plg trb workshop cbr v gb 010915 final
TRANSCRIPT

Logistics Engineering Supply Chain
Moving Crude Oil By Rail
Graham BrisbenCEO
PLG Consulting
January 11, 2015
2
Boutique consulting firm with team members throughout North America
Established in 2001
Over 100 clients and 250 engagements
Practice Areas Logistics
Engineering
Supply Chain
Consulting services Strategy & optimization
Logistics assets & infrastructure development
Supply Chain design & operationalization
M&A/investments/private equity
Industry verticals Energy
Bulk commodities
Freight rail
Institutional investors and private equity
About PLG Consulting
Moving Crude Oil By Rail
Partial Client List
3
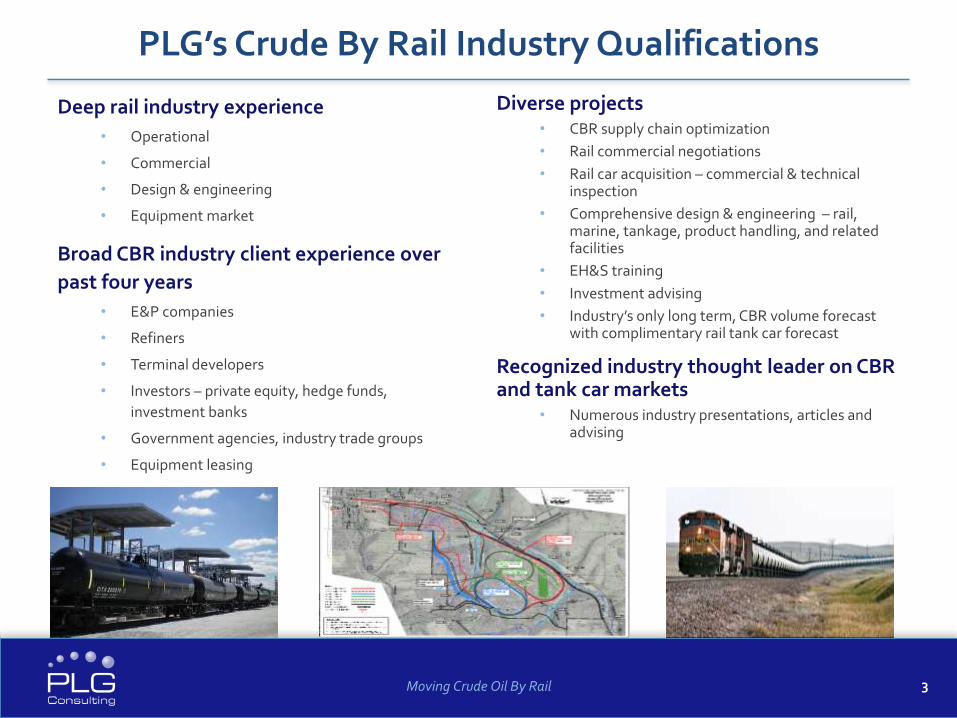
Deep rail industry experience
• Operational
• Commercial
• Design & engineering
• Equipment market
Broad CBR industry client experience over
past four years
• E&P companies
• Refiners
• Terminal developers
• Investors – private equity, hedge funds,
investment banks
• Government agencies, industry trade groups
• Equipment leasing
PLG’s Crude By Rail Industry Qualifications
Moving Crude Oil By Rail
Diverse projects• CBR supply chain optimization
• Rail commercial negotiations
• Rail car acquisition – commercial & technical inspection
• Comprehensive design & engineering – rail, marine, tankage, product handling, and related facilities
• EH&S training
• Investment advising
• Industry’s only long term, CBR volume forecast with complimentary rail tank car forecast
Recognized industry thought leader on CBR and tank car markets
• Numerous industry presentations, articles and advising

4
ssSource: CAPP, About Oil Sands
Source: EIA, May 2014
US Shale
Unconventional Energy Resources and Extraction Technologies
Moving Crude Oil By Rail
Western Canadian (WC)
Oil Sands
Source: www.epmag.com
SAGDHorizontal Drilling & Hydraulic Fracturing
Source: Marathon, February 2014
“Moore’s Law” at play:
Exponential advances in technology, resulting in
Declining costs
Surging production
5
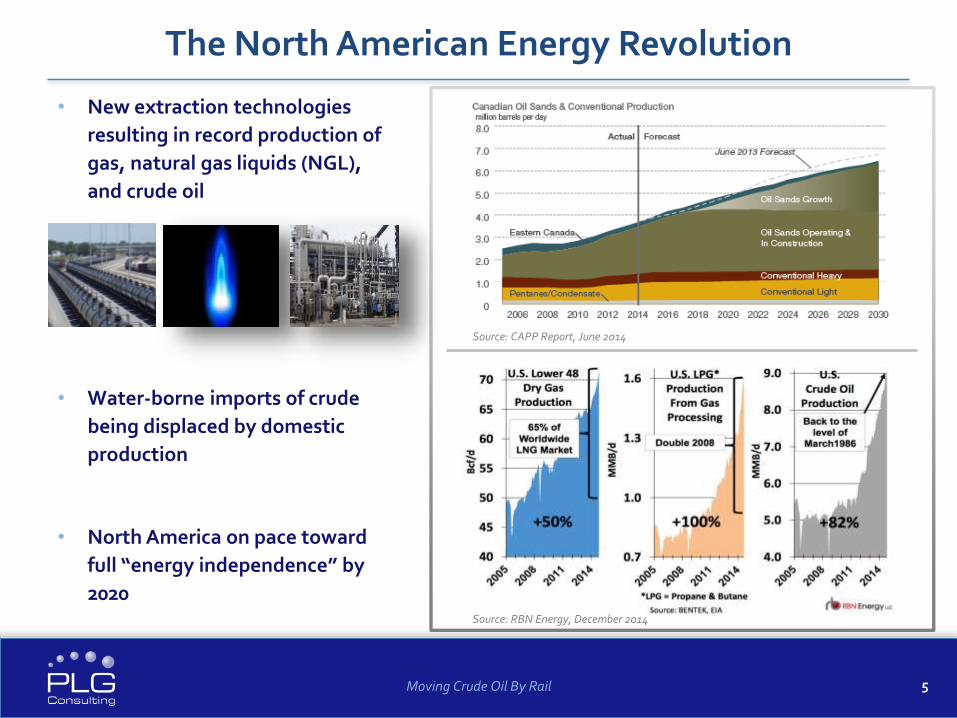
• New extraction technologies
resulting in record production of
gas, natural gas liquids (NGL),
and crude oil
• Water-borne imports of crude
being displaced by domestic
production
• North America on pace toward
full “energy independence” by
2020
The North American Energy Revolution
Moving Crude Oil By Rail
Source: CAPP Report, June 2014
Source: RBN Energy, December 2014

6
Shale Supply Chain and Downstream Impacts
Feedstock (Ethane)
Byproduct (Condensate)
Home Heating (Propane)
Other Fuels
Other Fuels
Gasoline
Gas
NGLs
Crude
Proppants
OCTG
Chemicals
Water
Cement
Generation
Process Feedstocks
All Manufacturing
Steel
Fertilizer (Ammonia)
Methanol
Chemicals
Petroleum Products
Petro-chemicals
Inputs Wellhead Direct
Output Thermal Fuels Raw Materials
Downstream Products
Moving Crude Oil By Rail
Impacts to-date include: Dramatic reduction in crude imports,
lower electricity costs, lower gasoline prices, increased refined products exports
The next wave: Manufacturing renaissance in the US based on
abundant, low cost energy and feedstocks

7
Over $120B of New Shale-Related Manufacturing Investments Have Been Announced
Moving Crude Oil By Rail
Ethylene and Propylene
Ammonia and Derivatives
Methanol
Polymers and Resins
Chlor-alkali
OtherSource: American Chemistry Council and PLG analysis

8
NA Crude Logistics Pre-2010
Moving Crude Oil By Rail
Sources: EIA, PLG analysis (Google Earth)
Light/Sweet
Heavy/Sour
Pacific Northwest Refiners
California Refiners
2,525kbpd
PADD VDemand
Midwest Refiners
3,375kbpd
PADD II Demand
East Coast Refiners
PADD I Demand1,075kbpd
LA Gulf Coast Refiners
TX Gulf Coast Refiners
PADD III Demand
8,150kbpd
Permian
ANS
Imports
Imports
Rail
Pipeline
Marine
Oil Sands
Imports GOM

9
NA Crude Logistics Today
Moving Crude Oil By Rail
Sources: EIA, PLG analysis (Google Earth)
Light/Sweet
Heavy/Sour
Pacific Northwest Refiners
California Refiners
2,525kbpd
PADD VDemand
Midwest Refiners
3,375kbpd
PADD II Demand
East Coast Refiners
PADD I Demand1,075kbpd
LA Gulf Coast Refiners
TX Gulf Coast Refiners
PADD III Demand8,150
kbpd
Eagle Ford
Permian
Bakken
Rail
Pipeline
Marine
Oil Sands
GOM
10
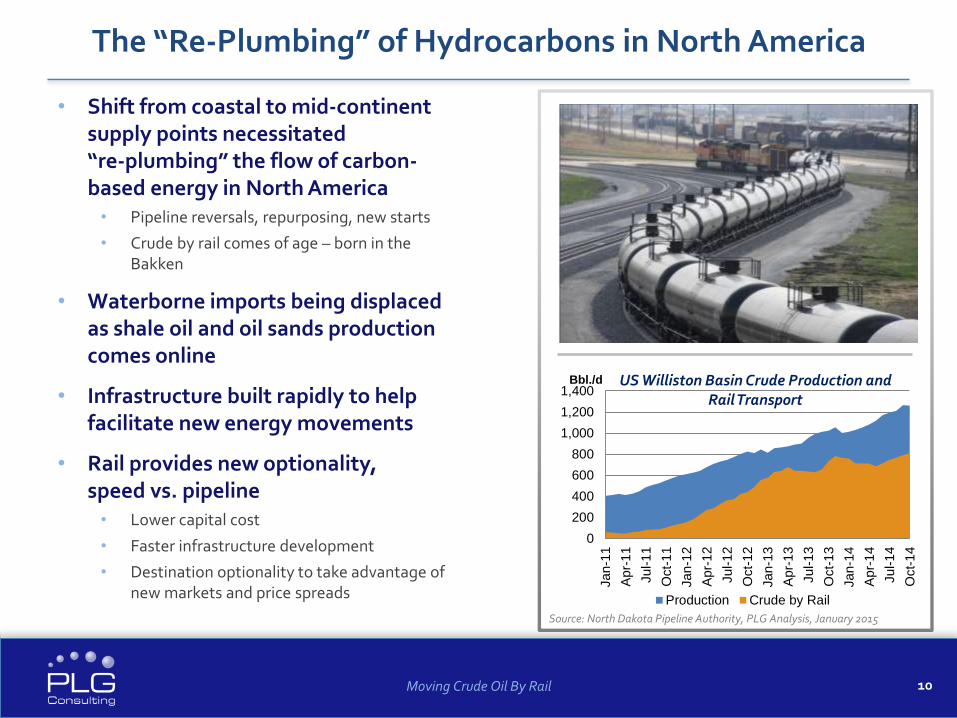
• Shift from coastal to mid-continent supply points necessitated “re-plumbing” the flow of carbon-based energy in North America• Pipeline reversals, repurposing, new starts
• Crude by rail comes of age – born in the Bakken
• Waterborne imports being displaced as shale oil and oil sands production comes online
• Infrastructure built rapidly to help facilitate new energy movements
• Rail provides new optionality, speed vs. pipeline• Lower capital cost
• Faster infrastructure development
• Destination optionality to take advantage of new markets and price spreads
The “Re-Plumbing” of Hydrocarbons in North America
Moving Crude Oil By Rail
0
200
400
600
800
1,000
1,200
1,400
Jan-1
1
Apr-
11
Jul-1
1
Oct-
11
Jan-1
2
Apr-
12
Jul-1
2
Oct-
12
Jan-1
3
Apr-
13
Jul-1
3
Oct-
13
Jan-1
4
Apr-
14
Jul-1
4
Oct-
14
Bbl./d US Williston Basin Crude Production and Rail Transport
Production Crude by Rail
Source: North Dakota Pipeline Authority, PLG Analysis, January 2015

11
The Three Phases of Crude-by-Rail Growth in North America
Moving Crude Oil By Rail
0
200
400
600
800
1,000
1,200
US CrudeOriginations
Williston CrudeOriginations
Source: NDPA, STB, PLG
Analysis, January 2015
Crude by Rail Volumes (kbpd)
2009-2011
• CBR developed from the Bakken to bridge the gap until pipelines are built
• First unit train shipment in Dec. 2009
• Destination market: Cushing, OK WTI trading hub
2011-2013
• Ascendancy of trading as main growth driver in CBR; WTI-Brent-LLS differentials are key
• St. James, LA LLS hub becomes most attractive destination
• Coastal refineries begin rail receipt infrastructure build-out
• Tank car market overheats, becomes main growth constraint
2013-current
• CBR from Bakken assumes long-term structural role in crude oil market
• Bakken CBR transitioning to east and west coast markets; LLS and WTI converge as Permian and Eagle Ford growth floods USGC
• Canadian CBR build-out begins; tank car market reorienting to coiled/insulated car types (~2/3 of CBR fleet order backlog)

12
Low Oil Price Case North American CBR Forecast Overview
Moving Crude Oil By Rail
Bakken & Oil Sands are main drivers of
CBR volumes, accounting for ~87% of NA
movements in 2017
Other plays such as Niobrara and
Permian are seeing increasing CBR
activity but will be adequately
served by pipelines long-term
0
100
200
300
400
500
600
700
800
900
1,000
2013 2014 2015 2016 2017 2018 2019
Low ($<65/bbl) Case Crude by Rail Volumes (kbpd)
Williston
Oil Sands
Niobrara
Permian
Source: PLG Crude by
Rail & Tank Car
Forecast, Nov. 2014

13
Low Oil Price Case: Bakken Production and Takeaway
Moving Crude Oil By Rail
0
200
400
600
800
1,000
1,200
1,400
2014 2015 2016 2017 2018 2019
Low Case ($<65/bbl) Takeaway (kbpd)
Pipeline Forecast
Crude by Rail Forecast
Local Refinery Forecast
CBR share of production expected to be remain strong and long lasting due to the optionality it provides and the lack of pipeline options to the key markets on West and East Coast
Source: PLG Crude by
Rail & Tank Car
Forecast, Nov. 2014

14
Low Oil Price Case: Western Canada Production and Takeaway
Moving Crude Oil By Rail
Proportion of production handled by rail expected to ramp up through 2017 and then drop back as pipeline
capacity starts to develop
At its peak in 2017, rail will handle ~ 18% of production and
then fall back to ~ 6% by 2019
0
500
1,000
1,500
2,000
2,500
3,000
3,500
4,000
4,500
5,000
2014 2015 2016 2017 2018 2019
Low Case ($<65/bbl) Takeaway (kbpd)
Pipeline Forecast
Crude by Rail Forecast
Local Refinery Forecast
Source: PLG Crude by
Rail & Tank Car
Forecast, Nov. 2014

Logistics Engineering Supply Chain
Thank You !For follow up questions and information,
please contact:
Taylor Robinson, President+1 (508) 982-1319 / [email protected]
This presentation is available for download at:http://plgconsulting.com/category/presentations/