pleurochrysis carterae in relation to harvesting … · 2011. 1. 31. · chapter 2: literature...
TRANSCRIPT

I
PHYSICAL CHARACTERISTICS OF
PLEUROCHRYSIS CARTERAE IN RELATION TO HARVESTING
POTENTIAL FOR BIODIESEL PRODUCTION
By
Marjan Rahbari
School of Chemical Engineering The University of Adelaide
A thesis submitted for the degree of Master of Engineering Science
March 2009

II
Declaration This work contains no materials which have been accepted for the award of any other
degrees or diploma in any university or other tertiary institution, to the best of my
knowledge and belief and contains no material previously published or written by
another person, except where due reference has been made in the text.
I give consent for this copy of my thesis to be made available in the University
Library.
Marjan Rahbari Feb2009

III
Acknowledgements First and foremost, I would like to express the sincerest appreciation to my
supervisors, Dr Peter Ashman and Dr David Lewis. I have learnt a lot especially when
it comes to learning in English as second language. I would like to thank them for
their technical and academic supervision.
I have been very fortune in the support of my family. As for my Parents, my brothers,
sister- in- law, nephews and my little angel Negar, I appreciate you for all you have
done.
My special thanks also go to my close friends in Adelaide especially Ms Homeyra
Bozorgmehr and Johnson’s family for their wonderful support and encouragement.
The other people I also like to thank the Chemical Engineering school staff, in
particular, Mr Andrew Wright and Mrs Mary Barrow and colleagues in the MERG
group. Their help and contributions made this work possible. Thanks to Dr Bill
Wisner for editing this thesis.
Last but not least, I will forever be grateful to Mr Shamsoldin Haeri (Ershad Ali). I
thank him for his spiritual advices. I owe you so much for your help over the past
years.

IV
Table of contents Abstract.....................................................................................................................VII Chapter 1: Introduction ..............................................................................................1
1.1 Background...........................................................................................................1 1.2 Aims of this study .................................................................................................3
Chapter 2: Literature Review.....................................................................................4
2.1 Microalgae and Commercial applications ............................................................4 2.2 Biofuel production from Microalgae ....................................................................8 2.3 Coccolithophores and cultivations factors ..........................................................11 2.4 Growth parameters..............................................................................................14 2.5 Harvesting...........................................................................................................18
2.5.1 Filtration......................................................................................................19 2.5.2 Flocculation.................................................................................................20 2.5.3 Centrifugation .............................................................................................21
2.6 Harvesting challenges .........................................................................................24 2.7 Physical characteristics and settling rate.............................................................27 2.8 Cell structure and size distribution .....................................................................27 2.9 Particle settling theory ........................................................................................29 2.10 Cell viability......................................................................................................31 2.11 Viscosity ...........................................................................................................34 2.12 Summary and remarks ......................................................................................36
Chapter 3: Materials and Methods ..........................................................................38
3.1 Source and maintenance of strain .......................................................................38 3.2 Photo bioreactor ..................................................................................................39 3.3 Growth parameters..............................................................................................40 3.4 Cell counting.......................................................................................................40 3.5 Cell analysis ........................................................................................................40 3.6 Cell isolation .......................................................................................................41 3.7 Free Settling velocity ..........................................................................................42 3.8 Viscosity .............................................................................................................43 3.9 Centrifuge ...........................................................................................................44 3.10 Cell viability......................................................................................................44 3.11 Cell size distribution .........................................................................................45
Chapter 4: Results and discussion............................................................................47
4.1 Cell identification................................................................................................47 4.2 Cultivation...........................................................................................................48 4.3 Cell size distribution ...........................................................................................51 4.4 Viscosity .............................................................................................................54 4.5 Free settling velocity...........................................................................................56 4.6 Cell disruption.....................................................................................................59 4.7 Discussion ...........................................................................................................63

V
Chapter 5: Conclusions and future work ................................................................67
5.1 General Conclusions ...........................................................................................67 5.2 Future work.........................................................................................................69
References ................................................................................................................71
VI
Table of Figures
Figure 2.1 Model for commercial applications of microalgae .................................................. 7
Figure 2.2 Micrograph image of P. carterae .......................................................................... 12
Figure 2.3 A schematic representation of the life cycle of Pleurochrysis carterae ................13
Figure 2.4 Apistonema’ stage of P. carterae ......................................................................... 13
Figure 2.5 Changes in growth versus critical factors in a raceway pond ................................ 15
Figure 2.6 Photbiorector and commercial scale of microalgal cultivation.............................. 18
Figure 2.7 Horizontal design of continuous scroll discharge decanter ................................... 24
Figure 2.8 Settling column tests and graphical analysis of settling curves ............................. 31
Figure 2.9 Flow cytometer diagram ........................................................................................ 34
Figure 2.10 Rheograms of some Newtonian fluids ................................................................. 35
Figure 3.1 Photo-bioreactor drums used to grow P. carterae ................................................. 40
Figure 3.2 Graphical analysis of settling curves...................................................................... 43
Figure 4.1 Light microscopy image of P. carterae.....……………..………...……..………..48
Figure 4.2 High resolution image of P. carterae cell (SEM Method).............…..………..….48
Figure 4.3: Growth cycle of Pleurochrysis cartare................................................................. 48
Figure 4.4 pH shifts during the growth cycle .......................................................................... 48
Figure 4.5 Comparison of logarithmic growth after and before increasing initial pH ............ 49
Figure 4.6 Lower magnification of clump cells ...................................................................... 49
Figure 4.7 Changes of the average cell size and surface area during the growth cycle .......... 51
Figure 4.8 Cell size distribution during the growth cycle ...................................................... 53
Figure 4.9 Shear rate against shear stress for different cell concentrations............................. 55
Figure 4.10 Settling columns with various cell densities and collection times ....................... 56
Figure 4.11 Graphical procedure of P. carterae suspension settlement.........................…......57
Figure 4.12 Settling curves of different cell concentrations.................................................... 57
Figure 4.13 Light microscopy slides of P. carterae culture at diffrenet magnifications......... 60
Figure 4.14 Flow cytometry results for blank samples ........................................................... 61
Figure 4-15 Flow cytometry records of centrifuged cells ...................................................... 62
VII
Abstract
During the last three decades, microalgae has been suggested as a potential source of
biofuel, with a number of advantages over other energy crops. These advantages,
including high lipid content, fast growth rate, reduced requirements for land and the
possibility of utilizing marine water systems constitute the most likely sources for
CO2 reduction systems. However, no commercial plant has been established to date.
This is because of the high capital cost of microalgal systems and the many uncertain
aspects of harvesting small cells (<20µm) from dilute cultures (~1g/l). Therefore, this
project aims to investigate the physical characteristics of Pleurochrysis carterae, a
potential biofuel feedstock, with a view to understanding the fundamental
characteristics of this species during large-scale harvesting.
The preliminary study of cell growth cycle in the laboratory showed that; P. carterae
grows quickly in BG11 media with 1.8% salinity. The maximum cell concentration
after 20 days was ~0.5 g/l. Also, large flocs (120µm) were observed early in the
growth phase (day 4) and the stationary phase (day20).
In order to calculate the theoretical settling rate some parameters, such as cell size
distribution and medium viscosity, were measured. The results indicated that cell size
grew from 3.8µm at the inoculation to 11.7 µm at the end of the growth cycle. Also,
the viscosity of the suspension was independent of cell concentration and is identical
to that of seawater (0.001Pa.s). The theoretical settling rate, based on Stokes’ law
yielded, 1.4 ×10⁻⁶ m/s. Screen tests from column settling tests showed that the
terminal selling rate of P. carterae cells is 4×10⁻⁴ m/s, which is faster than the
predicted rate. It was estimated that 91% of cells, without any pre-treatment, and
during 12 hour experiments, settled to the bottom of the columns. It shows
flocculation is a potential method for a low cost harvesting in large scale biomass
production.
The effect of shear stress on cell viability after centrifugation with various gravity
forces was also assessed. The results showed that the number of broken cells
VIII
increased at higher shear stress and that maximum cell disruption occurred after
harvesting with 11000 × g force.
Results from laboratory in this study indicate that further optimisation need to be done
to increase P. carterae harvesting efficiency toward the minimum cost, thus achieve
economic biodiesel product.
P. carterae is a potential candidate for commercial scale biofuel production with
significant advantages including high growth rate, low contamination risk and fast
settling velocity. The use of a primary flocculation stage with secondary continuous
centrifugation is potentially suitable for low cost commercial harvesting. However,
still more work needs to be done to demonstrate the feasibility of large-scale
production of biofuel from microalgae.
1
Chapter 1: Introduction
1.1 Background
Biofuel production from large-scale cultivation of microalgae has been widely
regarded as one of the most promising systems that has potential to deal with the
problem of global warming (Benemann & Oswald, 1996; Chisti, 2007). The average
temperature of the earth, over the last century has increased by approximately 0.76oC
and even further warming of about 0.2oC per decade has been predicted for the future.
These increases in temperature are attributed to increasing concentrations of CO2 in
the atmosphere. Human activities , particularly fossil fuel use, are the primary causes
of increasing atmospheric concentrations of carbon dioxide and thus of global
warming (IPCC, 2007). The United Nations Framework Convention on Climate
Change (UNFCCC), agreed to by 173 Countries in Kyoto in 1997, required 35
countries to decrease their green house gas (GHG) emissions to determined levels.
The individual targets for parties (listed in Kyoto Protocol Annex B) include a total
reduction of GHG emissions of at least 5% from the 1990 level in the period 2008 to
2012. In this regard, a great deal of attention has been focused on sustainable
renewable sources of energy as one of the ways to reduce green house gases thus the
ultimate objective of the UNFCCC is to reduce CO2 emission, which account the
majority of GHG emissions (UNFCCC, 1997).
Different methods, including chemical or physical absorption, membrane processes
and biofixation have been proposed for removing and separating carbon dioxide
(Benemann, 1993; Kojima, 1995; Pennline et al., 2006; Zhang, 2006). Among these
methods, biological systems are a potential alternative to CO2 fixation. Biological
methods enable photosynthetic organisms to capture CO2, utilize solar energy and act
as a reservoir of carbon. Biomass also can be converted to renewable fuels, such as
biodiesel, and this will reduce demand for fossil fuels, thus leading to significantly
lower CO2 emissions (Hall & House, 1993).
2
Animal oil, food crops, and waste cooking oils are the main feedstocks for biodiesel
production. These feedstocks are unable to supply large quantities of biodiesel due to
their slow growth rate, and the limited availability of freshwater and arable land
(Chisti, 2007). Aquaculture resources, particularly marine microalgae, have been
recognised as promising alternative feedstocks with a number of advantages including
fast growth, high lipid content and higher productivity compared to other crops (Chelf
et al., 1993).
Despite this promise, the large-scale production of biofuel from microalgae still has
many fundamental limitations. Even though microalgae has significantly higher areal
productivities than other plants, commercial production would still require extremely
large areas, perhaps >100km2 per site. Microalgae also have very small cell sizes (in
the order of 10 µm) and low concentration (~1g/l). Therefore, any harvesting process
is difficult and costly and thus the separation process is typically an important factor
in the overall cost of production. Prior harvesting cost analysis has calculated that
approximately 20%-30% of the total microalgal biomass production cost should be
credited to its harvesting process (Gudin & Thepenier, 1986). The price of algal oil
has been estimated at $1.4-$2.8/l which is not competitive with mineral diesel at
$0.49/l – $0.79/l (Chisti, 2007). Currently, there are no suitable harvesting methods
that can achieve the necessary economic and performance criteria. Therefore, more
studies need to be done to investigate economically-feasible harvesting methods for
the biofuel production system for the individual types of the algal species.
Successful harvesting techniques are highly dependent on the properties of media and
algal species. In particular, properties such as settling rate, culture viscosity and cell
concentration as well as the effects of the harvesting process in damaging cells are all
important factors for harvesting design and downstream processing (Charles &
Ambler, 1979; Svarovsky, 1985; Coulson & Richardson, 2005). The evaluation of
these critical factors for each algal species and culturing process is required to
develop an economical harvesting system that could lead to a commercial scale
process. Pleurochrysis carterae has been recognised as a suitable species with high
lipid content for biofuel production (Moheimani, 2005). Therefore, this study deals
with the physical characteristics of this species and its settling characteristics, these
being fundamental requirements for optimizing harvesting methods.
3
1.2 Aims of this study
Previous work on the use of microalgae for biodiesel production has focused on
developing a convenient and highly efficient cultivation system. Among numerous
studies which need to be done to improve various aspects of biofuel production and
reduce the total price of the final product, this study focused on the harvesting aspect
and aimed to:
a) Identify physical characteristics of Pleurochrysis carterae during the growth period
b) Investigate settling characteristics of the target particles and compare them with the
theoretical prediction
c) Determine cell viability against shear stress applied by high gravity forces
In this thesis, the literature review (Chapter 2) examines the relevant literature on
microalgae, biofuel production from microalgae, available methods for measuring
cells properties and the most promising methods for harvesting biomass. The
materials and methods section (Chapter3) describes the equipments and techniques
used in the experiments reported here. The results of these experiments are presented
and discussed in chapter 4. Finally, the conclusions arising from this research together
with possibilities for future work are discussed in chapter 5.

4
Chapter 2: Literature Review
2.1 Microalgae and Commercial applications
Microalgal culturing is a modern biotechnology which has existing and potential
markets such as food supplements and animal feed. These photosynthetic micro
organisms can drive sunlight to their cells and convert carbon dioxide into potential
products such as food and biofuels (Chisti, 2007). The first use of micro algae by
humans goes back to 2000 years ago while the large-scale commercial culturing of
microalgae has more than a 30 year old history (Borowitzka, 1998).
Over the last few decades, the market for microalgal products has been growing and
numerous commercial applications have been identified. As a result, the importance
of the commercial applications has led to numerous and diverse studies on microalgae
systems. Some of the potential commercial applications which have been proposed
are:
a) Water treatment (Wilde & Benemann, 1993; Craggs, 1997)
b) Ascorbic acid Production (Running et al., 1994)
c) Renewable fuel production (Benemann & Oswald, 1996; Chisti, 2007)
d) Human nutrients (Seshadri et al., 1991; Otles & Pire, 2001)
e) Animal feed (Martin et al., 1985; Knuckey et al., 2006)
f) Cosmetic industries such as skincare and anti aging (Spolaore et al., 2005).
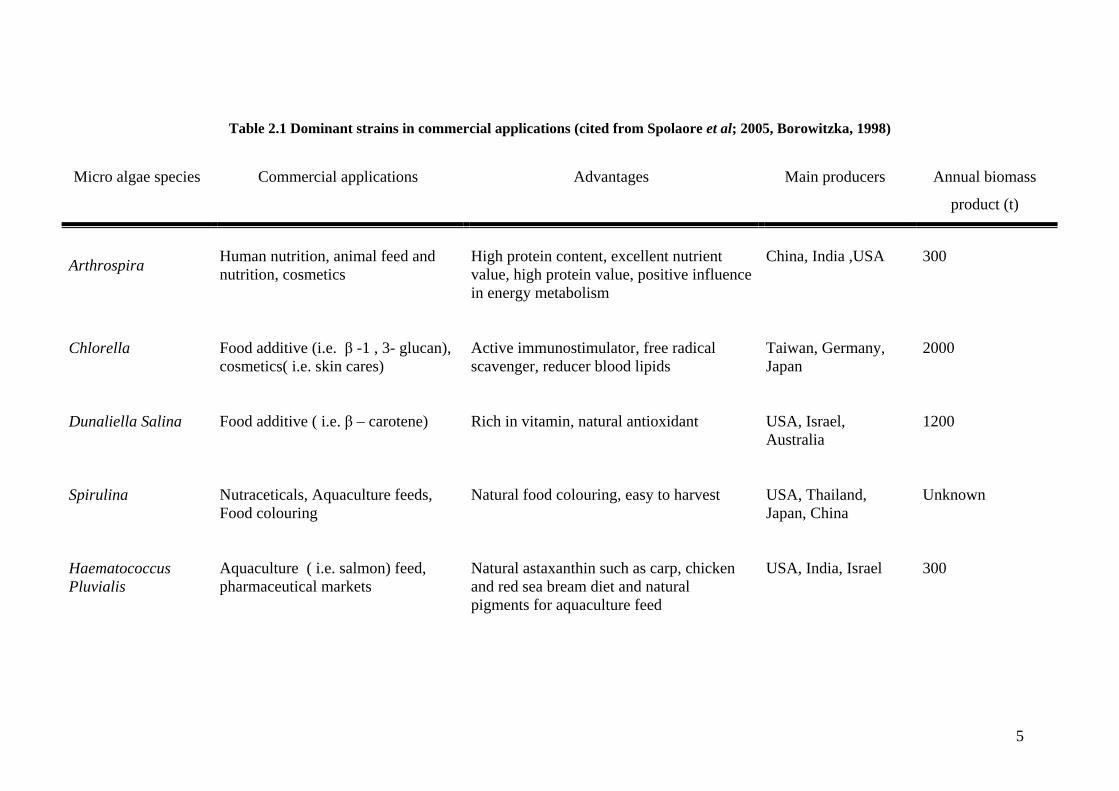
Although not all of the above projects have resulted in large scale production, due to
their high cost and the risk posed by on-site production (Spolaore et al., 2005), several
successful commercial systems (Table 2.1) reveal that modern microalgal
biotechnology has promise and that more studies and research could overcome or
minimize commercial problems.
5
Table 2.1 Dominant strains in commercial applications (cited from Spolaore et al; 2005, Borowitzka, 1998)
Micro algae species Commercial applications Advantages Main producers Annual biomass
product (t)
Arthrospira
Human nutrition, animal feed and nutrition, cosmetics
High protein content, excellent nutrient value, high protein value, positive influence in energy metabolism
China, India ,USA
300
Chlorella Food additive (i.e. β -1 , 3- glucan), cosmetics( i.e. skin cares)
Active immunostimulator, free radical scavenger, reducer blood lipids
Taiwan, Germany, Japan
2000
Dunaliella Salina Food additive ( i.e. β – carotene) Rich in vitamin, natural antioxidant USA, Israel, Australia
1200
Spirulina Nutraceticals, Aquaculture feeds, Food colouring
Natural food colouring, easy to harvest USA, Thailand, Japan, China
Unknown
Haematococcus Pluvialis
Aquaculture ( i.e. salmon) feed, pharmaceutical markets
Natural astaxanthin such as carp, chicken and red sea bream diet and natural pigments for aquaculture feed
USA, India, Israel 300
6
The main objective of all commercial production of microalgal is to reduce costs and
achieve diversified and economically competitive products. Therefore, several
parameters such as biology of the species, cost of the land and production as well as
the type of the final product need to be investigated and optimized. These factors will
determine the ultimate choice of an economical project (Borowitzka, 1998).
Much of the early work focused on cultivation and the type of the ponds, but there are
more difficulties and limitations in some commercial projects. One of the most
difficult and costly parts of algal biomass production on a large scale is the harvesting
of cells from their dilute suspension (Benemann et al, 1980). There has been a strong
emphasis in previous studies on the identification of a suitable harvesting technique
appropriate for the specific type of species. These studies confirm that an effective
harvesting technique is highly dependent on the characteristics of species and the
purpose of harvesting the biomass (Shelef et al., 1984; Mohn, 1988; Richmond,
2004). Little information about suitable species and their preferred harvesting method
for large-scale biofuel production is available.
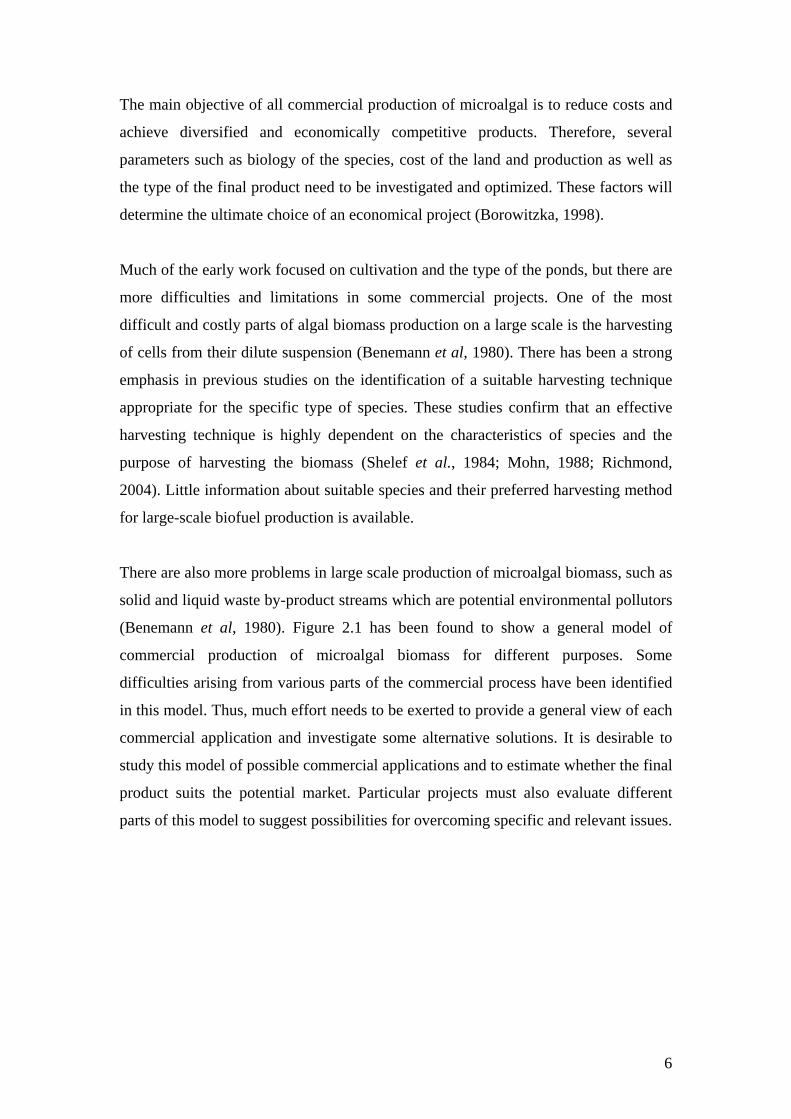
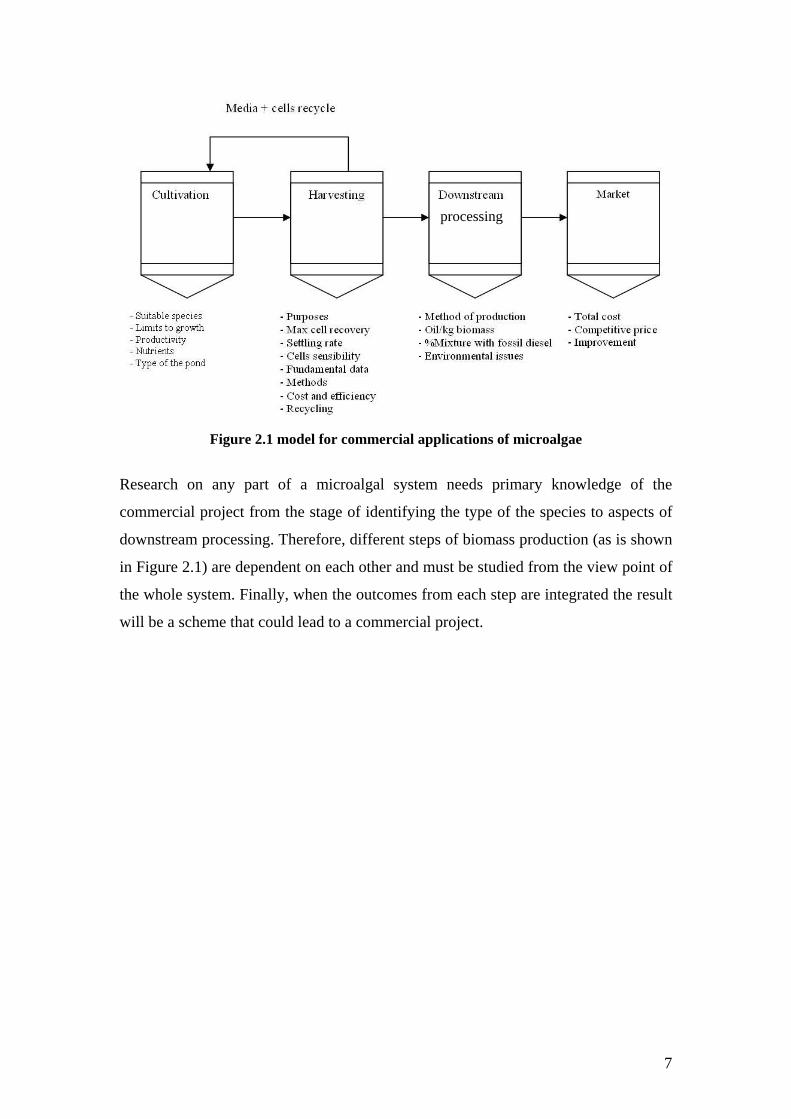
There are also more problems in large scale production of microalgal biomass, such as
solid and liquid waste by-product streams which are potential environmental pollutors
(Benemann et al, 1980). Figure 2.1 has been found to show a general model of
commercial production of microalgal biomass for different purposes. Some
difficulties arising from various parts of the commercial process have been identified
in this model. Thus, much effort needs to be exerted to provide a general view of each
commercial application and investigate some alternative solutions. It is desirable to
study this model of possible commercial applications and to estimate whether the final
product suits the potential market. Particular projects must also evaluate different
parts of this model to suggest possibilities for overcoming specific and relevant issues.
7
Figure 2.1 model for commercial applications of microalgae
Research on any part of a microalgal system needs primary knowledge of the
commercial project from the stage of identifying the type of the species to aspects of
downstream processing. Therefore, different steps of biomass production (as is shown
in Figure 2.1) are dependent on each other and must be studied from the view point of
the whole system. Finally, when the outcomes from each step are integrated the result
will be a scheme that could lead to a commercial project.
processing

8
2.2 Biofuel production from Microalgae
There is a continuously increasing interest concerning biofuel production, mainly
because of fossil fuel dependence and an urgent demand for CO2 capture and
utilisation. On the other hand, over the last three years oil prices have been
significantly increased from an average $23/barrel in 2002 to more than $100/barrel in
2007 (Bernard & Prieur, 2007) . High prices, unsustainable sources of fossil fuels and
carbon dioxide emission from fossil burning create one of the toughest environmental
– economical issues in history (Chisti, 2007; Dautzenberg & Hanf, 2008).
Various research relating to biofuel production and market issues, have been
undertaken around the world (Faaij, 2006; Bernard & Prieur, 2007; Dautzenberg &
Hanf, 2008; Lamers et al., 2008). Europe in 1999 became the most active stimulator
and subsequently developer of bioenergy in the world. As a result, in Europe, 4% of
the total fossil fuel usage may be replaced by biofuel while a total 10% biofuel
contribution has been targeted for 2010 (Faaij, 2006). But currently, in Europe, only
20% of crops are converted to biofuel due to their cost of 2.3 times more than fossil
fuel processes (Kondili & Kaldellis, 2006). Meanwhile, a total annual biodiesel
production of 1 bbl (billion barrel) in USA and 7.5 bbl for 60 countries have been
urged (Lai, 2005). These statistics confirm that effective management of biofuel
production may shift the world’s dependence on fossil diesel toward sustainable
sources. Currently, biodiesel is mainly derived from food crops, animal oils and waste
cooking oil. Major problems of the first generation of biofuel sources include slow
growth rates, high demand for fresh water and a requirement for large areas of land
with consequences for global food needs, while only replacing 0.3% of the transport
fuel (Schenk et al., 2008). Therefore, the development of non-food feedstock sources
has recently been brought into sharp focus. This so-called second geneneration
biofuel, including microalgae, lingo-cellulosic biomass, rice straw and microbial
sources are better options when considering the need for food and energy security
(Patil et al., 2008). However, details about the lifecycle, growth and biomass
production are limited and need to be investigated in details. Biofuel production from
microalgae, during the last two decades, has been supported by many environmental
organisations (Benemann & Oswald, 1996). These photosynthetic micro-organisms
9
have a number of advantages including high lipid content and fast growth, thus
reducing competition with food crops for land and with the further possibility of
growing in marine water and other environmentally efficient systems that can fix CO2.
They have been proposed as a preferred source of biofuel with no net CO2
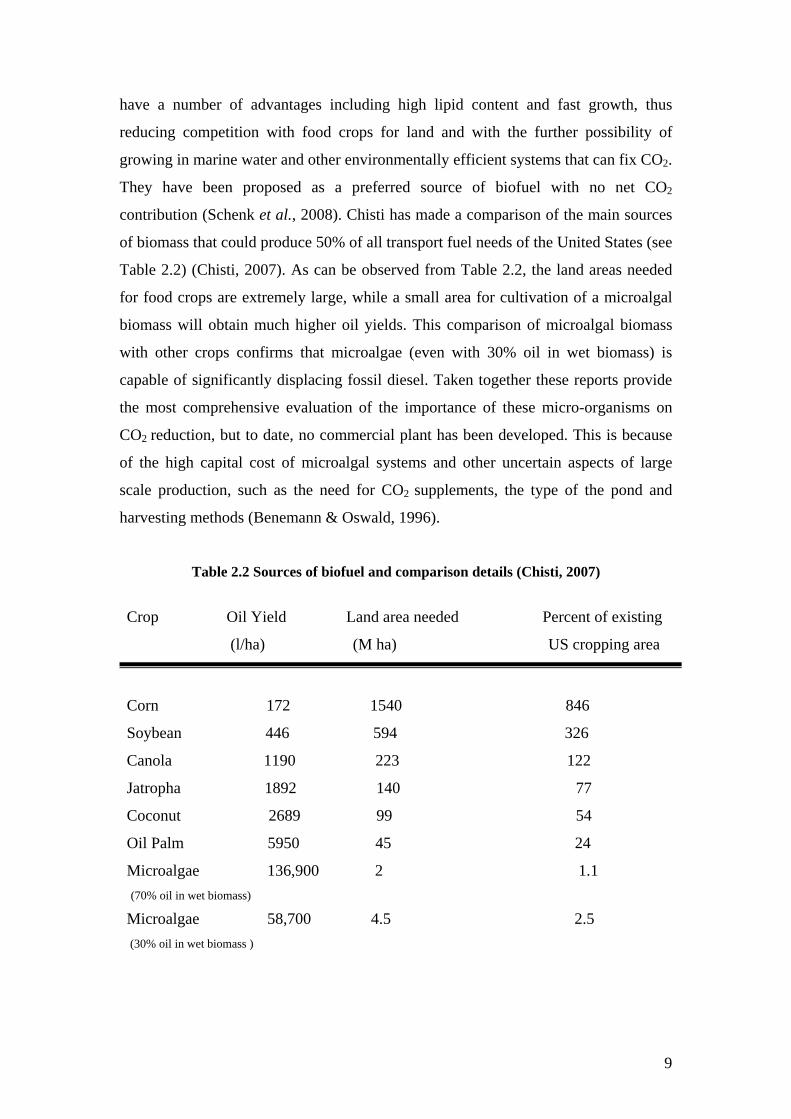
contribution (Schenk et al., 2008). Chisti has made a comparison of the main sources
of biomass that could produce 50% of all transport fuel needs of the United States (see
Table 2.2) (Chisti, 2007). As can be observed from Table 2.2, the land areas needed
for food crops are extremely large, while a small area for cultivation of a microalgal
biomass will obtain much higher oil yields. This comparison of microalgal biomass
with other crops confirms that microalgae (even with 30% oil in wet biomass) is
capable of significantly displacing fossil diesel. Taken together these reports provide
the most comprehensive evaluation of the importance of these micro-organisms on
CO2 reduction, but to date, no commercial plant has been developed. This is because
of the high capital cost of microalgal systems and other uncertain aspects of large
scale production, such as the need for CO2 supplements, the type of the pond and
harvesting methods (Benemann & Oswald, 1996).
Table 2.2 Sources of biofuel and comparison details (Chisti, 2007)
Crop Oil Yield Land area needed Percent of existing
(l/ha) (M ha) US cropping area
Corn 172 1540 846
Soybean 446 594 326
Canola 1190 223 122
Jatropha 1892 140 77
Coconut 2689 99 54
Oil Palm 5950 45 24
Microalgae 136,900 2 1.1 (70% oil in wet biomass) Microalgae 58,700 4.5 2.5 (30% oil in wet biomass )

10
Accordingly, a number of reports have attempted to analyse the economic feasibility
of biodiesel production from microalgae (Borowitzka, 1992; Chisti, 2007; Schenk et
al., 2008; Yanqun et al., 2008). They all have argued that the costs of producing
biodiesel from microalgae must be drastically reduced and the quality improved if it is
to compete with fossil diesel. In this regard, Chisti (2007) has proposed an economics
equation for algal oil as,
petroleumCC 3oil algal 109.6 −×= E.q.2.1
Where,
:oil algalC Microalgal oil in US$ per litre
:petroleumC Crude oil in US$ per barrel
In Equation 2.1, Chisti has assumed that algal oil has 80% of the energy content of
crude oil. This means that if the initial price of crude oil is US$100/barrel in 2008, the
microalgal oil should not be more than US$0.7/litre. The current price of microalgal
oil has been estimated to be from US$52-91/barrel, depending on the biomass
production methods used (Schenk et al., 2008), whereas palm oil costs approximately
US$2.65/barrel (Chisti, 2007). The price of algal oil is not yet acceptable to the
market, but undoubtedly, there are some possibilities for reducing costs and
improving efficiency with research and development.
As it was discussed earlier, Figure 2.1 represents a general pattern for any type of
microalgal system, including biofuel production. The applications of biofuel are
proliferating both in terms of quality and price. In practice, a process such as that
shown in Figure 2.1 can be improved so as to achieve the aims of cost reduction and
increase the industrial feasibility of biofuel production. Therefore, it is necessary to
examine what the contributing factors to the cost of the system are and how they
might be reduced. By considering some alternatives and the information gathered
from previous studies, more projects can be proposed for minimizing cost and
increasing commercial feasibility. Even down-stream process such as
Transesterification (Box 2.1), which is the common method for all biodiesel
production, must be considered and improved through further studies.

11
CH2 – OCOR1 CH2 – OH R1 – COOCH3
CH – OCOR2 + 3 HOCH3 CH – OH + R2 – COOCH3
CH2 – OCOR3 CH2 – OH R3 – COOCH3
Triglyceride Methanol Glycerol Methyl esters
Box 2.1 Transesterification process for converting triglycerides to biodiesel diesel
(Chisti, 2007)
Among these alternatives, bio-refinery based production, cultivating in open ponds
and increasing the productivity by raising annual biomass production and the selection
of suitable species and cultivation methods are important factors in the determination
of the feasibility and the cost of the final products (Borowitzka, 1992; Becker, 1994;
Richmond, 2004). Therefore, the first step in any successful microalgal system is the
identification of species and the limits to their growth. Furthermore, results from the
cultivation stage and that of identification of the characteristics of the species will be
used for the next stages of harvesting and downstream processing. The following
literature review focuses on characteristics of the target species, issues concerning
harvesting biomass and the most promising harvesting methods.
2.3 Coccolithophores and cultivations factors
Coccolithophores algae are unicellular motile or non motile coccolid cells. They are
members of the Haptophyceae family and contain Chlorophyll a and c (Siesser, 1994).
Coccolithophores were discovered by Ehrenberg in 1836 in the Baltic Sea. Later in
the 19th century different forms of Coccolithophores were observed around the world
(Pienaar, 1994). This group of species and specifically P. carterae has been noted for
its potential application for biofuel production, having a number of advantages
including, high lipid content (33% of dry biomass), high productivity (0.23g/l.day)
and low contamination risk (Moheimani, 2005).
Catalyst
12
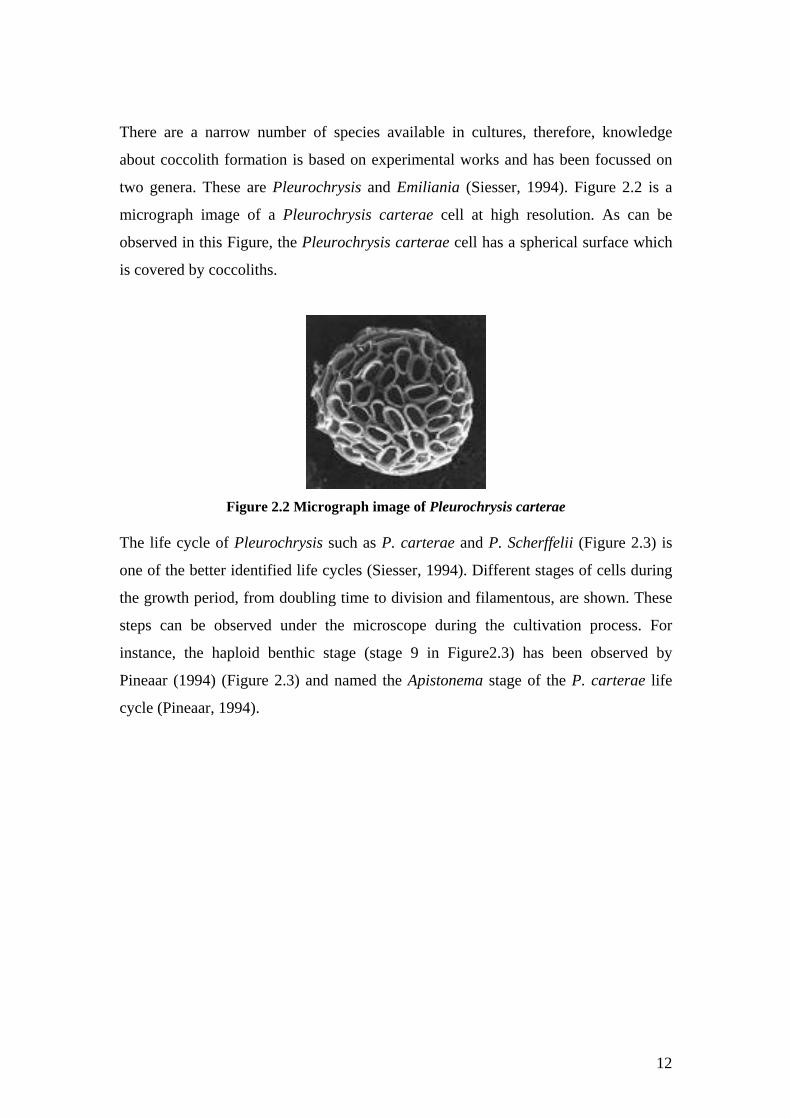
There are a narrow number of species available in cultures, therefore, knowledge
about coccolith formation is based on experimental works and has been focussed on
two genera. These are Pleurochrysis and Emiliania (Siesser, 1994). Figure 2.2 is a
micrograph image of a Pleurochrysis carterae cell at high resolution. As can be
observed in this Figure, the Pleurochrysis carterae cell has a spherical surface which
is covered by coccoliths.
Figure 2.2 Micrograph image of Pleurochrysis carterae
The life cycle of Pleurochrysis such as P. carterae and P. Scherffelii (Figure 2.3) is
one of the better identified life cycles (Siesser, 1994). Different stages of cells during
the growth period, from doubling time to division and filamentous, are shown. These
steps can be observed under the microscope during the cultivation process. For
instance, the haploid benthic stage (stage 9 in Figure2.3) has been observed by
Pineaar (1994) (Figure 2.3) and named the Apistonema stage of the P. carterae life
cycle (Pineaar, 1994).

13
Figure 2.3 A schematic representation of the life cycle of Pleurochrysis carterae
Figure 2.4 Apistonema’ stage of P.carterae (a) A well defined cell wall (arrowhead) is
clear around the cells, (b) Low power view of benthic filamentous stage
Like any higher plants, light, water and inorganic nutrients are the basic elements of
the requirements for microalgae (Benemann & Oswald, 1996). In order to establish an
effective high value of biomass production it is necessary to optimize the growth
parameters (Borowitzka, 1997). These factors have been demonstrated in detail
(Moheimani & Borowitzka, 2006b) and are commonly used in preliminary studies for
growing and maintaining Pleurochrysis carterae species. Below is a brief overview of
the growth limits and cultivation issues addressed by previous studies. These
fundamental elements provide better understanding of any type of microalgal culture.
a b
Apistonema stage

14
2.4 Growth parameters
Each species requires an individual range of physical elements for growth. These
needs must be identified at the bench scale then optimised and scaled up to a
commercial pond (Borowitzka, 1992). It has to be mentioned that not necessarily all
parameters in a raceway pond are similar to a bench scale, as some of them, such as
light intensity, temperature, rain and salinity are influenced by the environmental
changes. Therefore, a combination of laboratory knowledge and environmental
elements has to be evaluated in developing an operational protocol for pond
management.
Previous study shows how critical elements affect the productivity of P. carterae in a
raceway pond. For instance Figure 2.5 demonstrates changes in growth, temperature
and daily pH in 12 months of cultivation in a raceway pond (Moheimani, 2005). This
information can be used in this study as fundamental data for cultivation. Further
more, results from laboratory cultivation can be compared with previous work.
One of the most common problems in cultivating algal cultures is contamination with
other micro-organisms (biotic elements) such as fungi, bacteria and viruses (Becker,
1994). In a rich nutrient culture, any other unwanted organisms can contribute and
compete with the main species. This will significantly decrease productivity
especially in open ponds. Avoiding contamination at a large scale is almost
impossible, but ecological knowledge will be useful to maintain an algal culture and
choosing the right system and a suitable location will decrease contamination risk. For
instance growth in a batch system is less likely to be contaminated with other micro-
organisms (Pluz, 2001). It can be seen, therefore, that different systems have been
studied for the growth and handling of microalgal in large scale cultivation
(Chaumont, 1993; Benemann & Oswald, 1996; Borowitzka, 1998).

15
Figure 2.5 Changes in growth versus critical factors in a raceway pond over a year at
Murdoch University (Moheimani, 2005)
16
There are two main types of cultivation systems including open air and closed systems
(Benemann & Oswald, 1996; Pluz, 2001). The selection of an individual system is
effected by different parameters such as climate, economic condition (water and land)
and nature of the species (Benemann & Oswald, 1996).
Open systems incorporate the most popular techniques for the large scale production
of microalgae due to their less expensive process. Shallow big ponds, tanks, circular
and raceway ponds are currently used in different projects (Borowitzka, 1998).
However, low productivity and high contaminate risk make them unsuitable for some
commercial applications (Pluz, 2001).
Closed reactors are another type of cultivation systems with higher productivity and
low contamination risk. These are very expensive and have only been recommended
for individual applications where there must be no contamination risk (Borowitzka,
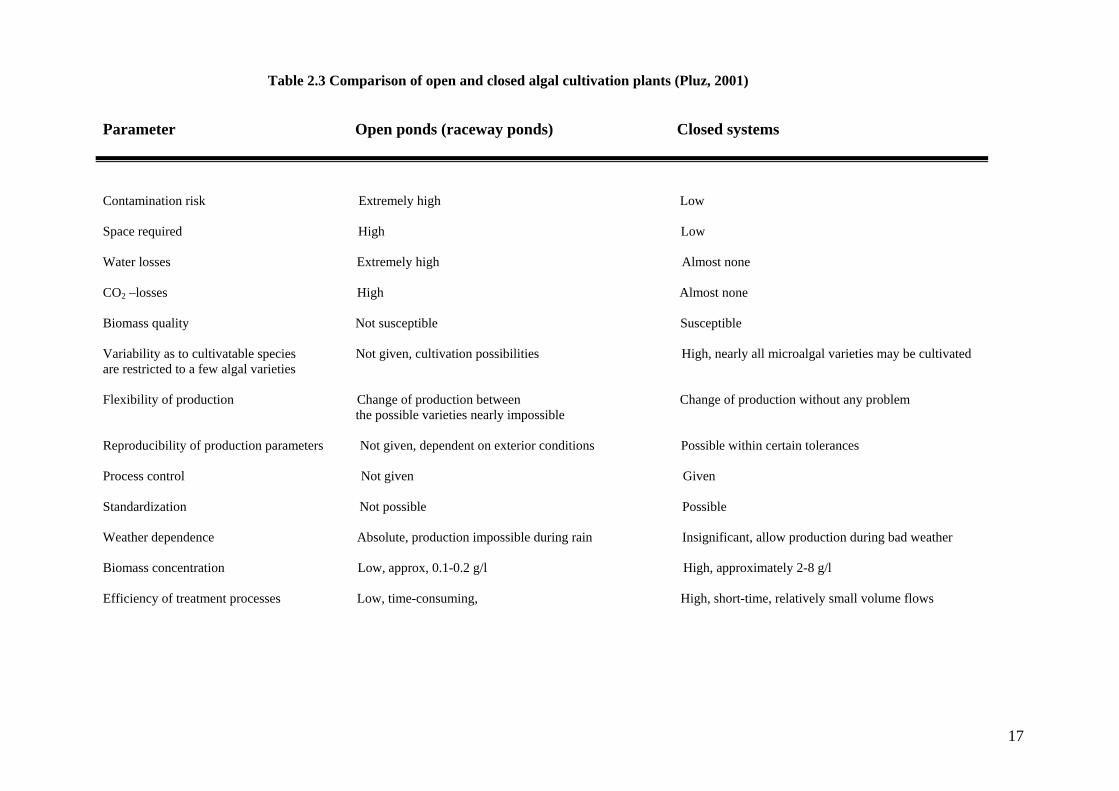
1998). Pluz (2001) presented a comparison data demonstrating the disadvantages and
advantages of each system (Table 2.3). Figure 2.5 shows two examples of microalgal
cultivation which have been used on a commercial scale.
Because of concern about the high cost involved in culturing microalgae and cost
reduction requirements, more studies need to focus exclusively on issues of the target
species. In 1987, Benehann et al (1987) estimated US$3.25/kg of dry biomass as the
general operating cost of microalgal ponds (Benehann et al., 1987); total costs of
cultivation of the P. carterae biomass, depending on the type of the pond and
harvesting technique, has recently been argued to be between Aus$7.35/kg to
Aus$14.17/kg (Moheimani, 2005). These current prices are not competitive in
comparison to fossil fuel and more work is needed to make this proposal into a
commercial project. As it was mentioned previously, harvesting small microalgal cells
is the main problem involved in this costly process. Therefore, separate studies need
to focus exclusively on issues relating to the harvesting of the individual species
biomass and to also investigate potential harvesting techniques for large-scale
recovery. Furthermore, the economies of this biomass recovery should be reported in
order to estimate the total cost involved in the design of harvesting methods. Some of
the specific harvesting challenges and methods examined in previous studies are
discussed in the next section.
17
Parameter Open ponds (raceway ponds) Closed systems
Contamination risk Extremely high Low
Space required High Low
Water losses Extremely high Almost none
CO2 –losses High Almost none
Biomass quality Not susceptible Susceptible
Variability as to cultivatable species Not given, cultivation possibilities High, nearly all microalgal varieties may be cultivated are restricted to a few algal varieties Flexibility of production Change of production between Change of production without any problem the possible varieties nearly impossible Reproducibility of production parameters Not given, dependent on exterior conditions Possible within certain tolerances
Process control Not given Given
Standardization Not possible Possible
Weather dependence Absolute, production impossible during rain Insignificant, allow production during bad weather
Biomass concentration Low, approx, 0.1-0.2 g/l High, approximately 2-8 g/l
Efficiency of treatment processes Low, time-consuming, High, short-time, relatively small volume flows
Table 2.3 Comparison of open and closed algal cultivation plants (Pluz, 2001)

18
Figure 2.6 Left- A 25 l photobioreactor with tubular sterilisable design ,
right- Earthrise Farms Arthrospira production plant in USA
2.5 Harvesting Harvesting is the most challenging part of biofuel production. It has been claimed that
the cost of harvesting biomass is 20-30% of the total production cost (Gudin &
Thepenier, 1986). Thus, the economy of microalgal production is highly dependent on
the harvesting technique and investigating an acceptable harvest method at a
commercial scale has a considerable effect on total price reduction (Mohn, 1988;
Becker, 1994; Benemann & Oswald, 1996; Chisti, 2007).
Nevertheless, one or more solid-liquid separation stages must take place to ensure that
microalgal systems can achieve concentrated biomass (Richmond, 2004). Although,
there is no lack of harvesting methods, it is difficult to identify economical harvesting
technique that is highly efficient at large-scale (Benemann & Oswald, 1996).
Small cell size (3-30 µm), low concentration (~1g/l) and unfavourable density (only
slightly greater than media) are all factors that result in an expensive harvesting
process and are significant concerns which need to be overcome or minimised through
technological development. Of the many harvesting techniques, which were proposed
and examined during the previous decades, only a few of them were found to possess
potential applications that could be developed for further optimization. These include,
flocculation, centrifugation and filtration (Mohn, 1988; Benemann & Oswald, 1996;
Molina et al., 2002; Richmond, 2004). Other techniques, including the Jameson cell
and bubble column have been tried successfully at a bench scale, but none of them has
19
been recommended for large scale biomass recovery (Guelcher & Kanel, 1998;
Guelcher & Kanel, 1999). Further more, the selection of suitable harvesting
techniques depends on the value of the final product, cell concentration, the purpose
for which the biomass is used and the type of the species (Becker, 1994; Yanqun et
al., 2008).
The next section reviews the most potentially useful harvesting techniques and
provides a general discussion of these methods for harvesting the target species.
2.5.1 Filtration
Filtration is a common method for separating particles from a suspension, and is
widely used in various processes (Becker, 1994). This technique had been used in
water treatment projects but has been suggested as an alternative for harvesting
microalgal cells. Collecting filamentous cells such as Spirulina using filtration
methods seems to be a satisfactory process, but difficulties arise in harvesting
unicellular small cells with a spherical shape. Rapid clogging and continuous
backwashing are the major problems, which limit throughput rates and continuous
harvesting of large volumes (Becker, 1994; Molina et al., 2002).
Many types of filters have been examined and compared but dramatic improvement at
a large scale, has yet to be demonstrated. Various filtration methods have been
compared quantitatively and it is apparent that some are suitable for certain purposes
(Mohn, 1988). The application of cross-flow membrane filtration for the separation of
microalgal cells has been widely used recently. This adapted technology needs to be
improved and studied in greater detail for each individual commercial application.
These and other early filtration machines have little practical application for
harvesting large volumes. Results achieved in the identification of the physical
characteristics of P. carterae in this work could be used to assess potential filtration
techniques. Possible limitations and difficulties for large-scale harvesting of
P. carterae using filtration should be addressed in a separate study.

20
2.5.2 Flocculation
Flocculation of algal cells is shown to be a rapid and effective harvesting method
(Molina et al., 2002), which has been recognised as an essential step in the harvesting
of microalgal cells from their media (Sukenik et al., 1988). This method refers to the
increasing of effective cell size and density using chemicals, polymers or organic
elements. As a result fine particles clump together and settle to the bottom of the
suspension. Flocculation by organic cationic has been widely employed for water
purification.
Two common flocculation techniques, bio flocculation and chemical flocculation,
have been examined for the purpose of algal recovery (Mohn, 1988; Benemann &
Oswald, 1996). Previous studies have shown that bioflucculation is an effective and
highly efficient (>70% cell recovery) method for cell recovery from freshwater.
However, this method has failed when attempting to collect cells from brackish water
(Pushparaj et al., 1992). Bioflocculation is an economical effective method for cell
recovery that does not contribute to contamination in the biomass. However, the
process is quite complex and unreliable and so more research is if we are to find a
suitable bioflocculation method. Chemical flocculation with inorganic flocculants has
been widely used in water purification and aquaculture feed production (Pan et al.,
1998; Knuckey et al., 2006). The total efficiency of chemical flocculation depends on
pH, chemical dosage and media salinity. Bilanovic et al (1988) concluded that the
optimum dosage of flocculants was markedly higher in marine cultures (Bilanvoic et
al., 1988). Thus, although, chemical flocculation was tried successfully in some
processes, the remnant chemicals in the harvested biomass, the expense of the
chemicals and low efficiency when using saline media suggest it is an uncertain
method for biofuel production.
Nevertheless, flocculation is an effective technique for carrying out the primary
concentration. In any event, issues relating to recovering cells, their end use, possible
cell disruption among the harvesting, settling velocity rates, the economic potential of
large scale processing and a suitable method for the individual species require further
investigation.

21
2.5.3 Centrifugation
Centrifugation is an effective harvesting method which can be used for all types of
microalgae (Benemann & Oswald, 1996; Molina et al., 2002; Richmond, 2004).
Several centrifugal devices have been considered in previous studies (Charles &
Ambler, 1979); Coulson & Richardson, 2005; Ladisch, 2001; Shuler & Kargi, 2002;
Svarovsky, 1985), but practical procedures for biomass recovery of microalgae on a
large scale have not yet been found. Despite the successful recovery and high
efficiency (~95%) in harvesting with the centrifugation technique, this method has a
number of limitations, including possible cell damage, high input energy, complicated
processing and large capital investment (Richmond, 2004). Moreover, greater detail
about particle size and distribution, suspension viscosity and the theoretical
foundation of particle settling are required to select a suitable centrifuge machine
(Becker, 1994; Benemann & Oswald, 1996; Richmond, 2004).
The recovery rate of any particle in a suspension is a matter of the nature of the
particles (i.e. size and density) and medium (viscosity and density), as well as the
applied by the centrifuge. In microalgal systems, particles are very small (<100µm)
and the viscosity of the medium is slightly greater than water. Therefore, the effect of
medium viscosity is neglected. Apart from the nature of the particle, which can be
identified for microalgal systems, critical parameters for centrifugation also need to be
investigated. Some of these factors are available in data sheets provided by
manufacturers and some vary depending on the particles and medium characteristics.
Centrifugal force depends on r (radius from centre of rotation to bottom of tube, cm)
and speed of centrifugation (N, rpm). The higher gravity forces the greater recovery
and higher energy input. RCF or g factor (gravitational force) can be calculated from
the equation,
24 )1000/(1018 NrRCF ×××= − Eq.2.2
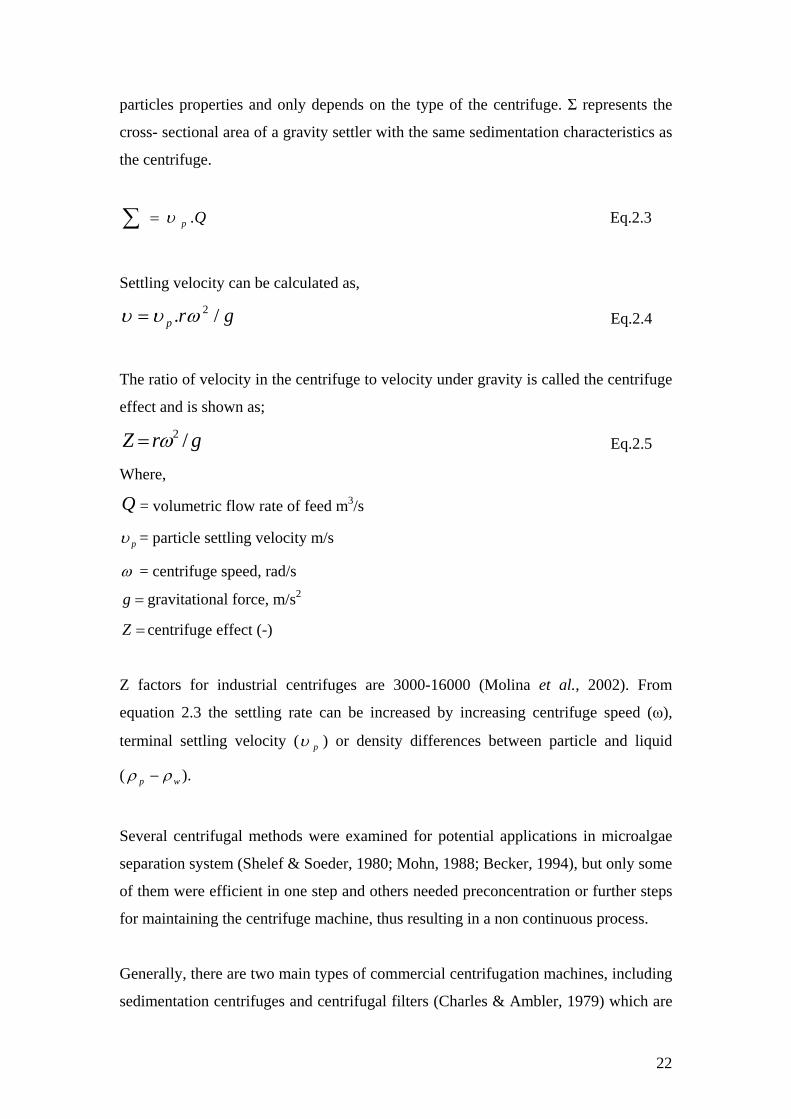
The capacity of the centrifuge and quantification of its performance is an initial factor
in the design of a reliable machine. This factor is shown as Σ and named
centrifugation coefficient (Eq.2.3). Value of Σ is independent of the medium and
22
particles properties and only depends on the type of the centrifuge. Σ represents the
cross- sectional area of a gravity settler with the same sedimentation characteristics as
the centrifuge.
Qp .∑ = υ Eq.2.3
Settling velocity can be calculated as,
grp /. 2ωυυ = Eq.2.4
The ratio of velocity in the centrifuge to velocity under gravity is called the centrifuge
effect and is shown as;
grZ /2ω= Eq.2.5
Where,
Q = volumetric flow rate of feed m3/s
pυ = particle settling velocity m/s
ω = centrifuge speed, rad/s
=g gravitational force, m/s2
=Z centrifuge effect (-)
Z factors for industrial centrifuges are 3000-16000 (Molina et al., 2002). From
equation 2.3 the settling rate can be increased by increasing centrifuge speed (ω),
terminal settling velocity ( pυ ) or density differences between particle and liquid
( wp ρρ − ).
Several centrifugal methods were examined for potential applications in microalgae
separation system (Shelef & Soeder, 1980; Mohn, 1988; Becker, 1994), but only some
of them were efficient in one step and others needed preconcentration or further steps
for maintaining the centrifuge machine, thus resulting in a non continuous process.
Generally, there are two main types of commercial centrifugation machines, including
sedimentation centrifuges and centrifugal filters (Charles & Ambler, 1979) which are

23
the only sedimentation types are suitable for microalgal systems (Shelef et al., 1984).
Sedimentation centrifuges are subdivided into chamber, tubular, nozzle, self cleaning
disc-stack (solid ejecting disc) and decanter centrifuges. Tubular centrifuges are not
continuous as there is no condition for solid discharge in tubular centrifuges. They
need to be stopped and cleaned regularly. These types of centrifuges are only
desirable in bench scale algal harvesting. The use of chamber centrifuges is very time
consuming as they need to be discharged frequently. They are only suitable for small
quantities and have been rejected for large scale applications (Svarovsky, 1985;
Mohn, 1988; Becker, 1994; Molina et al., 2002). Further optimisation will be
achieved by some laboratory tests of centrifugation and gravitational sedimentation. A
classification of sedimenting centrifuges has also been shown in Table 2.4.
Among the different type of sedimenting centrifuge machines, a decanters operation is
continuous both for feed and discharge solid, needing low maintenance, having a long
operation time and achieving 95% recovery (Borowitzka, 1998). Mohn (1980)
harvested different types of pre-concentrated microalgae with high reliability but
energy consumption was too high. However, Shelef (1984) has reported unsuccessful
recovery of flocculated slurry using this technique (Shelef et al., 1984). Decanter
centrifuges could be an option for second stage recovery of P. carterae cells, but
Imperforate Basket
Sedimenting Centrifuges
Multichamber centrifuge
Tubular centrifuge
Disc Centrifuge solids retaining
Disc Centrifuge Solid Ejection
Disc Centrifuge Nozzle type
Manual solids discharge
Intermittent solid discharge Continuous discharge
Table 2.4 Classification of Sedimenting Centrifuges (Svarovsky, 1985)

24
several uncertain aspects such as recovery rate, acceleration force requirements,
energy input and cell viability after centrifugation need to be studied in detail. A
continuous decanter centrifuge is shown in Figure 2.7. This type of centrifuge
machine is recommended by manufacturer for dewatering biomass after
preconcentration (1.5-2% dry solid).
Figure 2.7 Horizontal design of continuous scroll discharge decanter by Westfalia
separator AG, Germany
Nevertheless, there is a lack of knowledge about which centrifuge machine is suitable
for dewatering P. carterae biomass, and whether the energy balance of the system is
satisfactory. Previous work has been done on a laboratory scale and has recommended
centrifugation recovery as the second stage of dewatering biomass, but to date, no
commercial model has been described. Therefore, more studies are necessary to
investigate the economics of centrifugation and the effect of this method on cell
disruption specifically after flocculation. Furthermore, some bench scale experiments
with laboratory centrifuges could result in a better understanding of centrifugation for
harvesting P. carterae cells.
2.6 Harvesting challenges
As it was discussed earlier, among the various factors relating to biofuel production
from microalgae, biomass recovery is an important factor in the determination of the
cost of the process. Therefore, it is important to find and optimize harvesting
techniques, so as to produce the highest efficiency and also to satisfy the final price
requirements. A critical review of previous studies indicate that,
25
a) A number of studies have been done to improve biomass recovery and
estimate the total cost of harvesting process. However, none of them refers to
harvesting P. carterae for biofuel production.
b) Flocculation is a promising technique for the first stage of cell recovery with
lower energy input. However, great care must be taken to not have any
unwanted particles or chemicals in the biomass. This will limit further
downstream process. Therefore, suitable flocculation method for the specific
type of microalgal, P. carterae species, must be examined and reported in a
separate work. Moreover, the feasibility of this method needs to be estimated
for commercial scale biofuel production.
c) Decanter type centrifuges appears to be the most suitable machine with the
highest cell concentration (up to 20%), lower energy input and maintenance
requirements compared to other machines. They can be used as the second
stage of cell recovery after pre-concentration to at least %25.1 − by
flocculation methods. This proposition must be studied in greater detail and
must include dewatering P. carterae after the initial concentration.
d) Filtration, specifically, cross flow filtration has been suggested for filamentous
cells with its resulting high recovery rate and low energy input. But the high
cost of filter membranes, backwashing and clogging difficulties suggest it is
an unsatisfactory technique for continuous large scale harvesting of non
filamentous cells such as P. carterae. However, developed filtration
technology may offer more possibilities for a filtration technique which
satisfies requirements for economy when using continuous processes.
e) One of the strongest challenges in any type of harvesting is the nature of the
suspension and particles. Some simple experiments at the bench scale may
indicate the minimum requirements for industrial design. Any results will
greatly contribute to making the final decision in the selection of a harvesting
method. Therefore, a further consideration in selecting a suitable harvest
method depends on the algal species, as well as characteristics of the
suspension.
26
In deciding which of the machines and methods described above is to be employed for
harvesting P. carterae, one should consider; cell size, cell shape, maximum cell
concentration and other physical characteristics, which could be used to select an
appropriate harvesting method. These parameters have been predicated to play critical
roles in designing a suitable filtration system (Benemann et al., 1980; Becker, 1994).
Some of these parameters have been addressed in the literature review but further
investigation into the P. carterae culture including clumping cells, cell size
distribution and other physical factors are necessary to design suitable harvesting
methods (Charles & Ambler, 1979; Becker, 1994; Molina et al., 2002).
Therefore, the following information must be investigated in this particular case,
a) Nature of the target cell .i.e. type, size and distribution of the cell, motility
b) Settling characteristics of the particles
c) Density and viscosity of suspension at operation temperature
d) Concentration of cells in media
e) Harvesting efficiency
f) Quality of recovered cells
g) Cell damage due to shear rate
h) Pre-concentration requirements
i) Energy input
Industrial designer and manufacturers expect to receive the above information in each
specific suspension, if they are to design suitable instruments. Very little of the
information about physical characteristics of P. carterae and its settling behaviours
have been published. Therefore, bench scale screening experiments need to be done to
address these characteristics which can be used to investigate suitable harvesting
techniques. The next section provides a brief overview of techniques and instruments
which have been employed in previous studies to investigate the characteristics of the
suspension and cell. Conclusions from this section will illustrate a methodology for
laboratory experiments and thus indicate the appropriate analytical procedures.
27
2.7 Physical characteristics and settling rates
Knowledge of the fundamental factors of density, particle geometry and particle size
distribution can be used to describe the settling velocity rate of the suspension. On the
other hand effects of harvesting techniques on the target biomass will be critical for
examining the next stage of the downstream process. Therefore, the aim of this part of
the literature review is to present previous studies of the characterization of the
suspension and individual cells, in terms of measuring settling rate and investigating
suitable harvesting techniques. Techniques and methods in previous studies as well as
bench screening will permit better understanding of physical characteristics of the
suspension. This preliminary evaluation of cells and their suspension will lead to an
investigation and choice of an appropriate pattern among the possible efficient
harvesting methods.
2.8 Cell structure and size distribution
The settling characteristic of a suspension is strongly dependent on the cell size
distribution, cell shape and surface area (Metcalf & Eddy, 2003). A theoretical settling
velocity rate of the suspension can be calculated. Obtained values will be compared
with the actual settling rate to verify the application of the settling prediction thus
suggesting an appropriate design of the harvesting system.
Previous studies, mainly in wastewater treatment, show that the characteristics of
particles and their terminal settling velocity have a key role in the efficiency of
harvesting efficiency (Jun et al., 2007). Therefore, knowledge of species composition,
distribution of cell size and its structure are essential factors which should be
considered in the selection of the harvesting technique. The relation between the
structure and function of cell size, shape, and surface area and the specific purpose of
the system requires rapid and specific identification methods. Nevertheless, in the
design of any common harvesting methods- centrifugation, filtration and flocculation-
preliminary microscopic assessment of cells is required. The traditional method of cell
identification, using light microscopy is valuable in regards to cell counting, cell size
and shape observation. New technology, using appropriate softwares provides a wide
28
range of application in microscopic analysis. Further detection of smaller cells and the
confirmation results by light microscopy require more accurate methods, such as SEM
(Scanning Electron Microscope) (Dawes, 1998).
Since studying cells and dynamic processes in living cells plays a pivotal role in
biology, it is common for such data to be obtained by microscopy analysis. This
common approach for detecting cells and their events has been used for numerous
applications. However, manufacturers offer various types of instruments with
different costs and resolution capabilities, but quality, versatility and installed
software depend on the applications which are employed. In order to accomplish the
task of microalgal study the microscope must be equipped with suitable lenses
(magnifications) and analytic software.
The importance of electron microscopy in biological research is confirmed by its
exclusive use in medical, biochemistry and biology studies, but the traditional use of
dissecting light microscopy is limited to the study of surface features to about
5µm(Dawes, 1998). Thus, the SEM method with higher magnification can be
employed to obtain images with higher magnifications, as it is obvious from its
500×magnification in comparison with the dissecting light microscope (Dawes,
1998a). This method with a number of advantages, including great depth of focus,
direct observation, ability to switch over a wide range of magnification and easy
operation has been used to produce an image and acquire useful information about the
species (Hearle et al., 1972).
Both methods can be employed for different purposes. The scanning electron
microscope has been used for grain sizing, confirmation of fracture mechanism and
observing the presence of other micro-organisms such as bacteria; it has also been
used for light microscope cell counting, cell clump and dead colonies which were
imaged in day to day study. More details about instruments and software will be
explained in the material and methods chapter.
29
2.9 Particle settling theory
The terminal settling velocity of a rigid particle is a critical parameter in solid-liquid
separation (Metcalf & Eddy, 2003). It is needed so as to determine particle velocity
rate to simulate and design separation techniques. Settling experiments are commonly
used on wastewater samples to demonstrate how the individual particles behave under
the influence of gravity as characterized in sedimentation basins (Wong & Piedrahita,
1999). On the other hand, suspension settling under gravity has been reported to be
affected by various factors including shape and size of the particles, viscosity and
velocity of media (O'Mellia, 1991; Richardson & Zaki, 1954). Terminal settling of
any nonflocculating particle depends on Reynolds number and can be explained by
Newton or Stokes’ equations (O'Mellia, 1991; Metcalf & Eddy, 2003; Crittenden et
al., 2005).
2/1))1(34( pp
dp dSg
Cg
−=υ (For Re >1)
μυρ /..Re pp d=
pυ = particle settling velocity, m/s
pd = diameter of particle, m
pSg = specific gravity of the particle, (-)
dC = drag coefficient, (-)
Drag coefficient for particles with spherical shape is calculated by Eq.2.8,
34.0Re3Re
24++
=dC
For Stokes’ law yields:
μρρ
υ18
)( 2pp
p
dg −= (For Re <1)
pρ = particle density, kg/m3
ρ = fluid density, kg/m3
μ = Viscosity of medium, Pa.S
Eq.2.7
Eq.2.6
Eq.2.8
Eq.2.9
30
Terminal settling velocity can be calculated using theoretical models but specific
conditions such as the type of particle, hydrodynamic conditions and experimental
techniques will affect the settling velocity rate. Therefore, the settling velocity of the
suspension and its properties must be experimentally determined. With this
determination, a comprehensive evaluation of the theoretical calculations with
experimental results the next stage of harvesting design will be presented. Young
(1994) has developed Stokes’ law for the calculation of the settling velocity rate of the
Coccolithophores marine suspension.
Metcalf & Eddy (2003) have demonstrated various settling region in a suspension.
They have explained that in systems with high concentrations of suspended of solids
systems, two different regions affect the settling of particles. These are Hindered
(zone) and Compression settling. A high concentration of particles causes the liquid to
be more likely to shift up through the interstices of the contacting particles. Thus,
contacting particles tend to settle in a similar position to other particles with respect to
each other. This phenomenon is called hindered settling. The hindered settling rate
depends on the cells concentration and their physical characteristics. Furthermore,
cells continue to settle and build a layer of solid on the bottom of the cylinder. This
layer is known as compression layer. After the compression layer is formed, lower
concentrations of particles extend upward in to the cylinder. Hindered and
compression settling are important considerations in any settling rate. However, as in
most cases where are an identifiable interface, transition settling develops between the
upper phase and the hindered settling region (Figure 2.8).
When the suspension is of low concentration, the affects of mutual interference can be
neglected, because the distances between adjacent particles are bigger than the
particles’ size (Metcalf & Eddy, 2003; Richardson & Zaki, 1954). It is difficult to
predict the sedimentation rate as many quantitative factors concerning the surfaces of
particles and the presence of an ionised solute are involved in the settling process
(Coulson & Richardson, 2005). Therefore, an alternative method of determining the
terminal settling based on column settling tests, has been suggested in some
wastewater textbooks as a fundamental method to investigate the settling velocity rate
(Metcalf & Eddy, 2003; Crittenden et al., 2005).

31
On the other hand, the significance of different values which contribute to the settling
theory has not been investigated for the individual P. carterae cells, and so methods
for the measurement of the velocity rate must be developed by some laboratory
experiments. Furthermore, a comprehensive evaluation of the actual settling rate in
conjunction with theoretical results will suggest an effective removal system.
The rate of the settling can be determined by a column settling test. This method has
been described and also used to characterize the settling properties of the particle,
particularly in wastewater treatment studies (Wong & Piedrahita, 1999a; Metcalf &
Eddy, 2003).
A typical settling test involves the collection of an effluent suspension sample, placing
it in tall clear columns and observing the particle settling over time, data obtained
from the column tests will be plotted to a graph (Figure 2.8) and this will result in an
analysis of experiments to verify the applicability of the predictions to actual field
conditions (Metcalf & Eddy, 2003).
Figure 2.8 Left-settling in column tests through various phases, right-Graphical analysis of settling curves
2.10 Cell viability
As it was earlier concluded, physical forces, particularly shear stress are believed to
be an important causative factor in centrifugation which result in damaged cells for
the next stage of biomass treatment (Molina et al., 2002). Different studies have
verified microalgal cells viability, for various purposes mainly to verify toxicity
pollution and biomass quality as aquaculture feed studies have dealt with
flowcytometry as a fundamental method for microalgal cell viability assessment
32
(Franqueira et al., 2000; Hampel et al., 2000; Stauber et al., 2002; Knuckey et al.,
2006). On the other hand, previous studies have developed different procedures to
asses cells after harvesting using centrifugation and filtration techniques (Vandanjon
et al., 1998; Molina et al., 2002; Knuckey et al., 2006). However, the effect of
different harvesting methods on P. carterae cell viability has not yet been found, but
the centrifugation technique has been proposed as the most likely procedure for cell
disruption (Benemann & Oswald, 1996; Molina et al., 2002). Therefore, the
determination of P. carterae cell viability and the assessment of the physiological
state of the culture are essential for development of a centrifugation technique.
Furthermore, similar assessment methods can be employed for any other harvesting
technique.
Cell viability may be estimated using different types of methods depending on the
cells or culture. Flow cytometry is an accurate well-known method of cell assessment
which has wide range of medical applications (Muirhead, 1984; Zharov et al., 2007)
as well as other single cell applications, for example in microalgae studies (Franqueira
et al., 2000; Stauber et al., 2002). Employing a flow cytometry technique needs a
fundamental understanding of this specialized microscope technology. Over time flow
cytometry itself has become a field with numerous applications but this study explains
only the basic principles of flow cytometry.
Flow cytometry is an accurate technology which simultaneously measures and
analyses multiple physical characteristics of single particles (Stauber et al., 2002).
This powerful technique has been used over 30 years to measure various optical
parameters for any particular microscopic cells (Sklar, 2005). There are some useful
sources of information about the operation systems and how they are employed using
this technique (Givan, 1992; Carter & Meyer, 1994; Sklar, 2005). Any particle or cell
from 0.2-150 micrometers in size can be carried to the laser intercept in a fluid stream.
Flow cytometry is based on analysis of light scatter and staining from a continuous
cell sample which are passing through the detector one by one. The distribution of
light signals emanating from a single stationary cell while it varies with time under
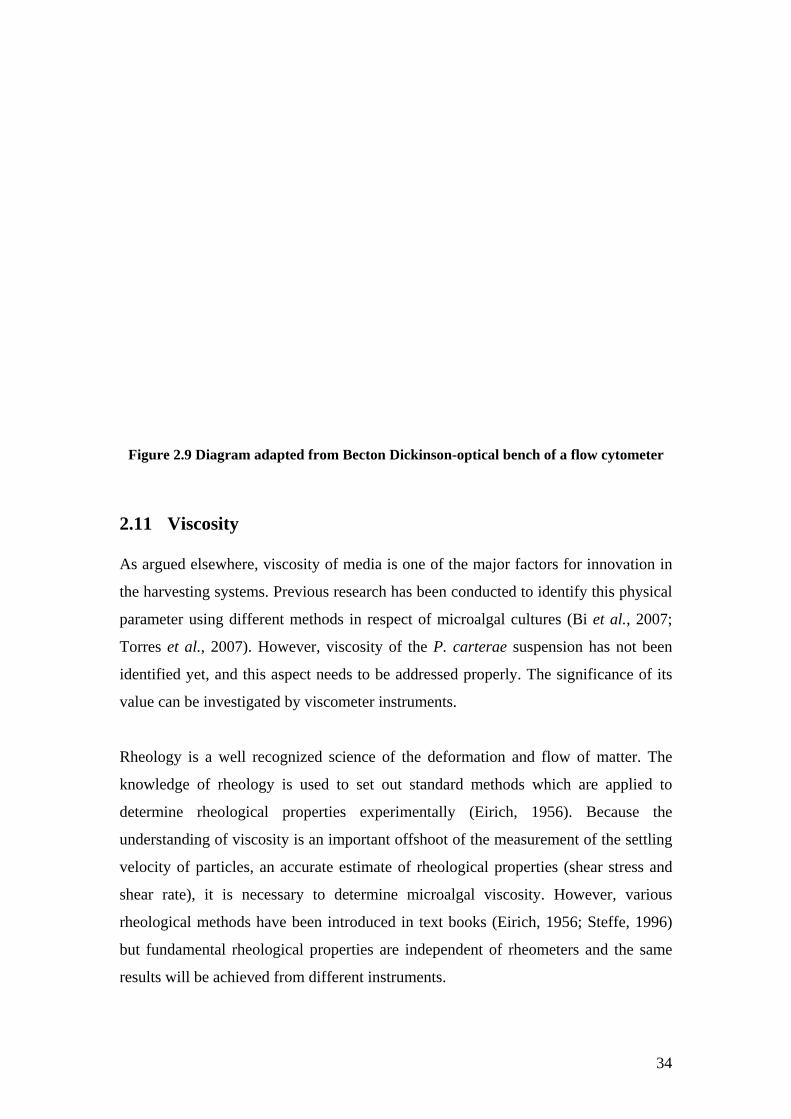
the scrutiny of the detector. A diagram of suspension which is analysed by an optical
bench flow cytometer has been showed in Figure 2.9 (Givan, 1992).
33
Generally, flow cytometers are built on the basis of three major parts including
fluidics, optics and electronics. The fluid system of a flow cytometer transports
particles of a random three-dimensional suspension one by one through the fluid
system. An optical system consists of lasers and filters to illuminate the cells in the
sample stream and directs them to resulting light signals and appropriate detectors.
Light filters are located in front of each photo detector to produce only the light of the
colour transmitted through their detectors. The signal will be continued by the
emerging light and photomultiplier tubes or photodiodes convert. Finally, the
detectors (electronics system) convert the detected light signals into electronic signals,
that can be demonstrated by the computer and appropriate software (Carter & Meyer,
1994). Data gathered from the flowcytometer can be analysed statistically by
flowcytometry software so as to describe cellular characteristics such as size,
complexity and health. In most cases flowcytometer detect cells between 1-15 µm.
The quantum of light which is scattered in the forward direction as laser light striking
the cell is forward scatter (FSC). The magnitude of forward scatter is proportional to
the cell size therefore this data can be used to quantify the particle size parameter. All
cells travelling through the laser beam will scatter light to the side .This is caused by
granularity and structural complexity inside the cell. More granular particles will
scatter more of the illuminating beam to the side with the resulting intensity being
called side scatter (SSC). The signals collected by side scatter and forward scatter
detectors will be plotted on one dimensional histogram and analysed by the software
connected to the system (Carter & Meyer, 1994).
34
Figure 2.9 Diagram adapted from Becton Dickinson-optical bench of a flow cytometer
2.11 Viscosity As argued elsewhere, viscosity of media is one of the major factors for innovation in
the harvesting systems. Previous research has been conducted to identify this physical
parameter using different methods in respect of microalgal cultures (Bi et al., 2007;
Torres et al., 2007). However, viscosity of the P. carterae suspension has not been
identified yet, and this aspect needs to be addressed properly. The significance of its
value can be investigated by viscometer instruments.
Rheology is a well recognized science of the deformation and flow of matter. The
knowledge of rheology is used to set out standard methods which are applied to
determine rheological properties experimentally (Eirich, 1956). Because the
understanding of viscosity is an important offshoot of the measurement of the settling
velocity of particles, an accurate estimate of rheological properties (shear stress and
shear rate), it is necessary to determine microalgal viscosity. However, various
rheological methods have been introduced in text books (Eirich, 1956; Steffe, 1996)
but fundamental rheological properties are independent of rheometers and the same
results will be achieved from different instruments.

35
The characteristics of elastic fluids which appear to have single constant viscosity
under uniform temperature conditions are referred to as Newtonian flow. This
parameter is based on linear-elastic material as shown in a stress-strain diagram
(Figure 2.10). Furthermore, viscosity (η) is described by defining the relation
between shear stress (τ, Pa) and shear rate (γ, s-1),
γτη /= SPa.
Plotted data on rheograms will demonstrate an average of viscosity with different cell
concentrations (Steffe, 1996)
Figure 2.10 Rheograms of some Newtonian fluids Young (1994) developed a sinking procedure for microalgal culture with a viscosity
of 0.001kgm-1s-1. In fact he assumed that microalgal culture viscosity is the same as
water viscosity. It is expected to behave like Newtonian fluids as found in rheograms
of typical Newtonian fluids with a constant value of viscosity. However, there is little
prospect of determining whether P. carterae cell density may affect the culture
viscosity or whether the final rheogram will obey Newtonian fluids rules. Therefore,
an experimental procedure using typical reheology methodology must be followed to
observe and review P. carterae culture viscosity. Obtained results also provide a
general view on viscometry techniques and can be applied for any other microalgal
culture.
A rheometer usually includes an electrical driven motor which can apply a force to the
material and measure its response at various times. The simplest method of obtaining
Eq.2.10
Sheer rate, 1/S
36
data involved shear flow and is achieved by shearing a fluid between two plates and
analysing output through a graph.
2.12 Summary and remarks
A summary of the literature review indicates that:
a) Optimizing the total cost of the biofuel production from microalgae is critical
for the commercial feasibility of biodiesel production from microalgae.
However, at the moment, none of the processes are suitable for commercial
harvesting but more research upon to selecting suitable species, investigating
proper harvesting technique will result in obtaining a low cost system with
high efficiency.
b) Before coming to a decision as to which harvesting process will be most
suitable for biomass production, the fundamental characteristics of cell-size
distribution and geometry and viscosity of the suspension must be determined
to calculate particle settling velocity. However, there is undoubtedly
considerable overlap between physical characteristics of P. carterae and its
settling behaviour. Thus, these elements are likely to be significant in order to
investigate proper harvesting techniques. Moreover, data from laboratory
experiments will propose a comprehensive evaluation of theoretical
foundation in comparison with trial observation.
c) Although, various methods have been compared in previous studies, it is
apparent that flocculation has more potential to save energy and cost and no
commercial harvesting by flocculation has been proposed yet (Benemann &
Oswald, 1996). Therefore, sedimentation tests, an important part of
characterizing settling behaviours, conducted with column tests, must be
carried for the target suspension. The main aims of the column test method
which will be examined in this work are: settling test are conducted with
column test to characterize how the particulate suspension will behave under
influence of gravity; It will perform any possible flocculation method as a

37
cheap primary harvesting; and comparison of Stokes’ settling rate and
experimental results will indicate a rational design methodology for settling
basins and other primary treatments. This method can be used to perform a
similar type of analysis at other suspension facilities.
d) As it has been earlier concluded, centrifugation is a potential harvesting
technique in microalgal recovery, after flocculation. Yet, the effect of this
method on cell disruption has not been determined for P. carterae. Therefore,
control of shear flow and investigate the deformation of P. carterae cell as
well as correlation between the applied shear stress and P. carterae cell
damage are necessary for various harvesting methods.
e) Finally, results of the screening tests will frequently lead to a preliminary
evaluation of particle settling velocity. Furthermore, these results will identify
feasibility of pre-concentration through flocculation methods.
Next chapter explains employed techniques in the preliminary work.
Pleurochrysis carterae was selected as the most suitable species with high oil
yield and bacterial tolerance. Most of the material and methods employed in this
work are similar to the previous studies in microalgal area. However, some of
these methods were limited to the laboratory facilities and project budget.

38
Chapter 3: Materials and Methods
3.1 Source and maintenance of strain
A species of Coccolithophorid algae, Pleurochrysis carterae, was obtained from the
Murdoch University microalgae culture collection. This species used in the current
study was naked (Coccolith free) P. carterae cells. The culture collection number was
CCMP 647. Modified BG11 was used to maintain the species.
The artificial seawater was prepared with MilliQ water and 1.8% cooking salt as it
was recommended for sea water preparation. To reduce error a stock solution of the
first three salts was prepared and each time 1 ml is added to the media.
Stock culture with 3×10⁴ cell/ml was maintained in 500/1 ml of the culture media
(BG11) in 100 ml conical flasks and subcultured every month with fresh media. The
recipe for preparing BG11 media has been shown in Table 3.1. The metal mix is made
up of two components and is used in all microalgal media. The first component is the
FeEDTA mix (Ferric citrate and Na2EDTA) and the second component is the trace
metals mix. To prepare metal mix, FeEDTA was added to 500ml of MilliQ water. pH
was adjusted to 7 and solution boiled to dissolve the salts. Then the trace metals mix
was added to 500 ml of MilliQ water and was mixed with FeEDTA. One ml of metal
mix per litre was added to BG11 media. After autoclaving, the media was allowed to
cool overnight and then a vitamin mix was added.
A store cabinet (20-25°C) was used to maintain the stock sample. Initial cell
concentration in the stock sample was 500/1 ml.
The first samples of P. carterae culture were filled in 50 ml flasks and put on the
shaker screen (70 rpm). White fluorescent light (220v, 500-600 photon.m-2.s-1) was
provided 12 hours on/12 hours off cycle. The lights were located in the growth cabinet
with 20 cm distance of flasks. Prior to each experiment all cultivation systems and
equipment including glassware, drums and tubes were washed with warm water (60-
80oC) in the washing machine then autoclaved. All media, glasswares and caps were

39
sterilised in the autoclave for 20 min at 121°C and 103.35 kPa. Unwanted microalgal
cultures were killed with chlorine solution before disposal.
Table 3.1 Modified BG11 medium used to grow P. carterae
Compound Stock Solution Quantity ( ml/l)
K2HPO4 MgSO4.7H20 CaCl2.2 H2O NaNO3 SeO2
30.5mg/l
75mg/l
56mg/l
1.5g/l
0.013
1
1
1
1
0.5
Metal mix
FeEDTA mix
Ferric citrate Na2EDTA
Trace metals H3BO3 MnCl2.4H2O ZnSo4.7H2O Na2MoO4.2H2O CaSO4.5H2O Co(NO3)2.6H20 Cooking salt
6.7g 14.9g
2.86g 1.81g
0.222g 0.390g 0.079g 0.049g
18g/l
1
(For preparing Metal mix add FeEDTA mix
to500ml MilliQ water then add trace metal mix to the mixture. Increase
total volume to 1000 with MilliQ water)
Vitamin mix Biotin B12
1g/l 1g/l
1
3.2 Photo bioreactor
Growth of P. carterae was investigated using 20 L carboys (see Figure 3.1). The
drums and media were sterilized for 20 min at 121oC, 103kPa and cooled one day
before inoculation. An air bubbling tube supplied CO2 and mixed the culture. Cultures

40
were grown at a temperature of 14-16oC and 300-400µmol photon.m-2.s-1 light
intensity was provided by a rotation of 12day/12night cycle fluorescents light.
Figure 3.1 Photo-bioreactor carboys used to grow Pleurochrysis carterae
3.3 Growth parameters
Critical parameters in growth rate including, pH, temperature, light and number of
cells were measured everyday over 40 days of growth cycle. Results from daily
measurements were plotted in the graphs for analysis at the end of the growth period.
3.4 Cell counting A general procedure for Microalgae cell counting by a haemocytometer was used for
daily cell counting. A very small sample (1 ml) was transferred into a centrifuge tube.
Cells were stained by adding a small aliquot (50 µl) of Evan’s Blue stock solution
(0.1%v/v) to each centrifuge tube and allowed to stand for 5 minutes. At the same
time, a haemocytometer and cover slip with 70% ethylene alcohol was cleaned.
Approximately 15µ of the stained suspension was added to each slide using leading
notch. The chamber had to be fully loaded with liquid by a pipette, as well as some
extra channels beside it; it was then placed on the Olympus IX50 microscope stage.
Cells were counted at 40×magnification.
3.5 Cell analysis Two methods were used for optical analysis including light microscopy and Scanning
Electron Microscopy (SEM). The feature of each method has been explained in
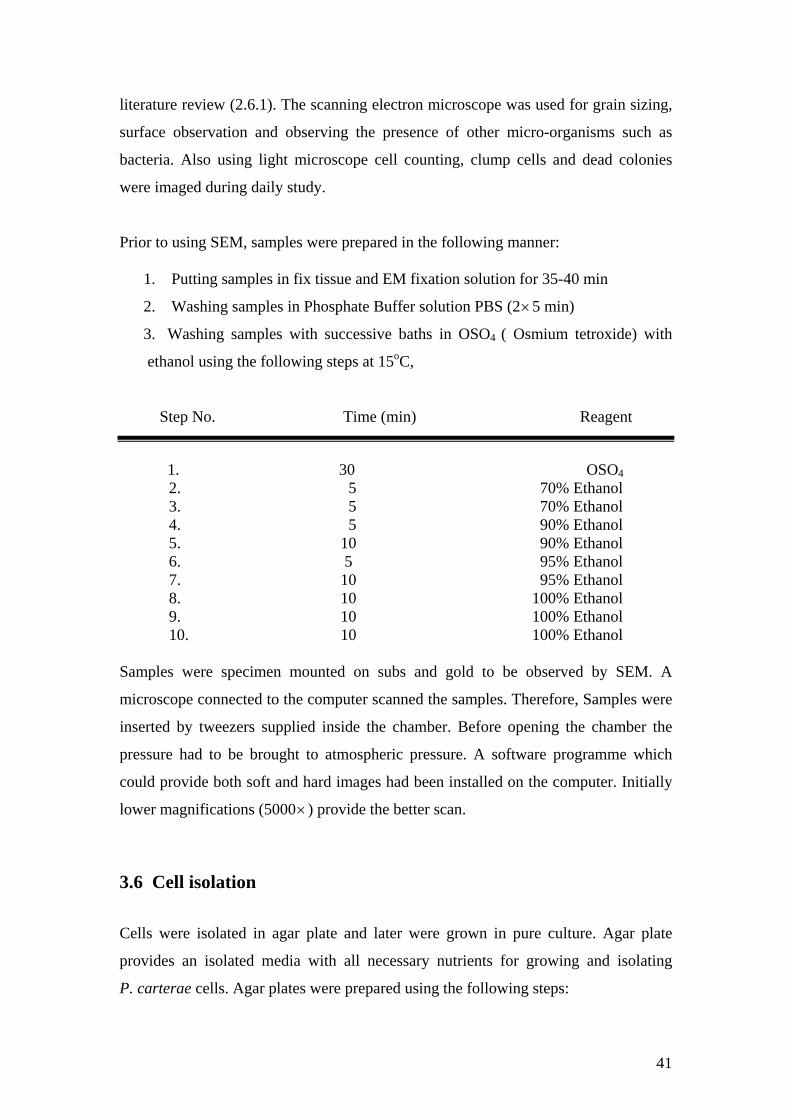
41
literature review (2.6.1). The scanning electron microscope was used for grain sizing,
surface observation and observing the presence of other micro-organisms such as
bacteria. Also using light microscope cell counting, clump cells and dead colonies
were imaged during daily study.
Prior to using SEM, samples were prepared in the following manner:
1. Putting samples in fix tissue and EM fixation solution for 35-40 min
2. Washing samples in Phosphate Buffer solution PBS (2×5 min)
3. Washing samples with successive baths in OSO4 ( Osmium tetroxide) with
ethanol using the following steps at 15oC,
Step No. Time (min) Reagent
1. 30 OSO4
2. 5 70% Ethanol 3. 5 70% Ethanol 4. 5 90% Ethanol 5. 10 90% Ethanol 6. 5 95% Ethanol 7. 10 95% Ethanol 8. 10 100% Ethanol 9. 10 100% Ethanol 10. 10 100% Ethanol
Samples were specimen mounted on subs and gold to be observed by SEM. A
microscope connected to the computer scanned the samples. Therefore, Samples were
inserted by tweezers supplied inside the chamber. Before opening the chamber the
pressure had to be brought to atmospheric pressure. A software programme which
could provide both soft and hard images had been installed on the computer. Initially
lower magnifications (5000× ) provide the better scan.
3.6 Cell isolation
Cells were isolated in agar plate and later were grown in pure culture. Agar plate
provides an isolated media with all necessary nutrients for growing and isolating
P. carterae cells. Agar plates were prepared using the following steps:

42
1. Measure 18 g agar and add to 1000ml BG11 media
2. Boil suspension and stir medium with a clean glass stir rod as agar is melting
3. While wearing heat resistant hand protection, hold the flask or beaker over the
flame. Swish or stir the mixture constantly while heating until agar is
dissolved.
4. Pour enough melted agar into each sterile plastic petri dish to cover the bottom
about 1/8" to 1/4" deep. Replace the lid immediately. Place agar plates on a
counter top to cool and set. The agar medium set like stiff gelatine at room
temperature
5. After cooling the plates a drop of microalgal culture was streaked across the
agar surface with a thin loop of sterile wire
6. Plates were maintained in a growth cabinet at 14-16oC and 300-400 µmol
photon.m-2.s-1 light intensity.
3.7 Free settling velocity
The rate of the settling can be determined by a column settling test. This method is
described and used to characterize the settling properties of the particle particularly in
wastewater treatment studies (Wong & Piedrahita, 1999; Metcalf & Eddy, 2003).
A typical settling test includes collecting an effluent suspension sample, placing it in
tall clear columns and observing the particle settling over time. Heights of the
interface during the settling time were measured and recorded. Data obtained from the
column tests was plotted to a graph (Figure 3.2) forming the basis of the subsequent
experiments that were conducted to verify the applicability of the predictions to actual
field conditions.

43
Figure 3.2 Graphical analysis of settling curves (Metcalf & Eddy, 2003)
A simple visualizing method for estimating the settling velocity of P. carterae was
employed in this study. The settling tests were carried out in column tests. The total
sedimentation rate was measured in 3 cultures with the cell densities of 2.1×10⁴,
1×10⁵ and 2×10⁶ cells/ml. Every half-an hour the height of the interfaces were
measured visually and recorded until transparent overflow suspensions were obtained.
The slope of the interface indicates the settling velocity rate of the P. carterae cells.
The samples were withdrawn from the overflow at the end of experiments to
determine the cell concentration of the supernatant by cell counting.
3.8 Viscosity
The viscosity determination was carried out with a VT 550 viscometer which was
operated at a steady shear rate (constant angular velocity). A MV1 geometric sensor
(suitable for low viscose suspension, working at a medium shear rate) was installed
and a temperature vessel was attached to the system. Five labelled samples including
pure media, 5×10⁴, 25×105 cell/ml, concentrated culture (2.4×10⁸ cell/ml) and
contaminated media were transferred to the geometric vessel. All data was obtained in
a constant temperature of 20-22oC. Eight different shear rates (50-300 s-1) were
introduced to the system. The machine measured shear stress versus each individual
shear rate within 120 seconds. Plotted data in a graph determine viscosity. As was
explained in section 2.11 slope of this graph defines the relation between shear stress
and shear rate and determines viscosity.

44
3.9 Centrifuge
Samples were harvested with a Beckman Coulter J2-21ME-1M with applied
acceleration factors of 300, 1500, 6000 and 11000×g (where g is the acceleration due
to gravity). The radius of the rotor was 11 cm with 6×400 ml capacity. Cell densities
were determined before concentration by microscopic examination at
400×magnification. P. carterae cultures with 11×105 cell/ml initial cell
concentrations were introduced to the centrifuge. The temperature was fixed at 18oC
for all samples. During the centrifugation process samples of the supernatant were
collected to evaluate harvest efficiency and to determinate concentration of cells
retained in the supernatant.
3.10 Cell viability
The aim of this experiment is to develop a methodology that permits frequent tests on
P. carterae viability and obtain a comparison of results using a flow cytometry
method versus light microscopy. In order to achieve this objective, viable cells need to
be collected and spun at various gravity forces including 300, 1500, 6500 and
11000 g× . The concentrated cells should be prepared for the flow cytometry
procedure. A method for sample preparation and using a Dickinson ‘Facscalibur’
flowcytometer located in Australian Water Quality Centre (AWQC) was
demonstrated and followed as below:
1. Cells were stained with bisoxonol dye DIBAC4
2. A total volume of 500 µl of DIBAC4 was used for each sample
3. 2 µl of 1 mM DIBAC4 was used in 500 µl.
4. Samples were centrifuged, and then DIBAC was added and leaved for 10 min
before experiments.
5. The machine has been set with no differences in fluorescence of the cells for
(green florescence), FL-3 was used as threshold.
6. The side scatter detector was set to 335 V and the green fluorescent detector
(FL1) set to 500 V. The fluorescence detector FL3 was used as the threshold
and set to a value of 289.
7. Sheath fluid was Milli Q water
45
8. Samples were examined with a total 5000 events
9. Data were examined on scatter-plots of log FSC vs Log SSC using WinMDI
version 2.8 software
10. Histograms were plotted for FSC against total events.
3.11 Cell size distribution
A Mastersizer, Malvern 2000, was used to measure cell size distribution. Results from
this machine allow understanding of the basic concepts of particle size, the concept of
the equivalent sphere and the differences observed in the scattering of large and small
particles.
The mastersizer 2000 system is designed such that equal volumes of particles of
different sizes produce a similar measured scattering intensity. The size distribution is
reported as a volume distribution as this best reflects the sensitivity of the system.
Volume distributions are based on the volume occupied by their constituent particles.
It should be remembered that all data in this study were analysed based on the volume
distribution.
This accurate instrument measures particle diameters from 0.02 to 2000 microns
(dependent on the dispersion accessory). Two dispersion accessories at a time were
being connected to the optical unit. Each dispersion accessory was provided with a
coded measurement cell cassette. When a cell is inserted into the optical unit it is
automatically recognised by the system which configures itself to operate with the
dispersion accessory.
The cell is fitted with a laser safety shutter override and a half-turn locking
mechanism locks the cell into the correct location with a single action. The system is
designed to be operated using Standard Operating Procedures (SOPs) to give
consistent results between laboratories and individual users.
Sample of 1 liter BG11 media was introduced to machine as blank sample. Particle
size distribution results from this sample were used as background of the experiments.
Approximately 100 ml of cell culture were added to 900 ml of pure BG11media and

46
introduced to mastersizer machine. One machine was turned on the standard
procedure was followed.
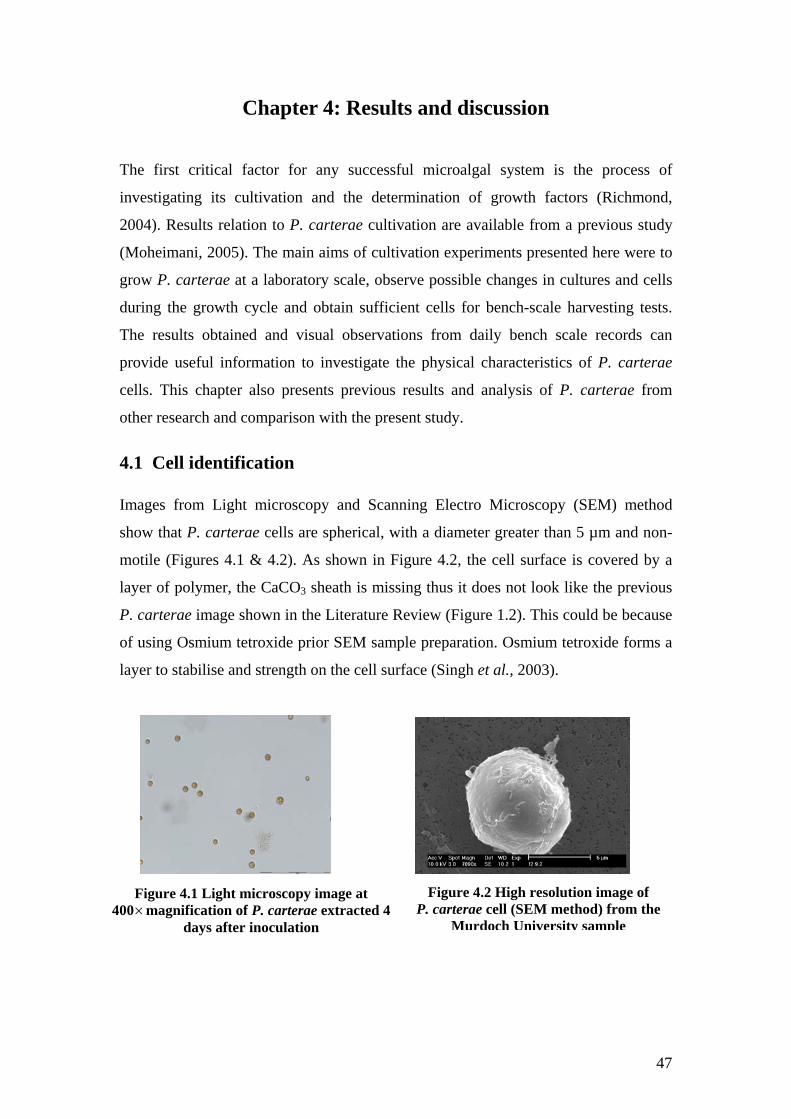
47
Chapter 4: Results and discussion The first critical factor for any successful microalgal system is the process of
investigating its cultivation and the determination of growth factors (Richmond,
2004). Results relation to P. carterae cultivation are available from a previous study
(Moheimani, 2005). The main aims of cultivation experiments presented here were to
grow P. carterae at a laboratory scale, observe possible changes in cultures and cells
during the growth cycle and obtain sufficient cells for bench-scale harvesting tests.
The results obtained and visual observations from daily bench scale records can
provide useful information to investigate the physical characteristics of P. carterae
cells. This chapter also presents previous results and analysis of P. carterae from
other research and comparison with the present study.
4.1 Cell identification Images from Light microscopy and Scanning Electro Microscopy (SEM) method
show that P. carterae cells are spherical, with a diameter greater than 5 µm and non-
motile (Figures 4.1 & 4.2). As shown in Figure 4.2, the cell surface is covered by a
layer of polymer, the CaCO3 sheath is missing thus it does not look like the previous
P. carterae image shown in the Literature Review (Figure 1.2). This could be because
of using Osmium tetroxide prior SEM sample preparation. Osmium tetroxide forms a
layer to stabilise and strength on the cell surface (Singh et al., 2003).
Figure 4.2 High resolution image of P. carterae cell (SEM method) from the
Murdoch University sample
b
Figure 4.1 Light microscopy image at 400×magnification of P. carterae extracted 4
days after inoculation

48
4.2 Cultivation Cultures were grown for 15 days in a growth cabinet (14-16ºC, 300-400 µmol
photon.m-2s-1) until the stationary phase was reached. Results show cells are likely to
have a 5-7 day lag phase (Figure 4.3). The maximum cell density of 2×10⁶ cell/ml
was obtained by the early stationary phase. The colour of the cultures changed from a
dark brown at the highest density, to a cloudy light yellow at the end of the death
phase. After 30 days, the number of cells had decreased significantly. Once the
culture reached the death phase, cells died within 5 days. Therefore, cultures with a
high density were transferred to fresh media while they were in the exponential
growth phase.
Figure 4.3 Cell density of Pleurochrysis cell was measured as number of cells produced
per millilitre culture during a light: dark of 12:12. (a) Lag, (b) Exponential, (c) stationary and (d) death phases
The initial pH of the cultures was 7.2 which during the exponential growth phase
increased to 9.4, then at the end of the death phase pH dropped to 7.8 (Figure 4.4).
Figure 4.4 pH during the growth cycle

49
Increasing the initial pH to 8.5 did not produce any significant change in growth rates.
As it can be seen in Figure 4.5, this increase only resulted in a longer lag phase of
nine days but the final obtained density was the same. At day 17 number of cells in
increased pH sample dropped to 1.6 ×10⁶ cell/ml. This could be because of cell
counting error or clumping cells together.
Figure 4.5 Comparison of logarithmic growth after and before increasing initial pH
Five days after inoculation P. carterae cells started sticking together, forming
colonies (80-120µm) and settled to the bottom of the glassware (Fig 4.6). Cell
counting, during this period was difficult. In 20l carboys, the use of air bubbling did
not prevent development of clumps, so daily manual stirring was used to re-suspend
the cultures. After day five, cells started growing separately. This phenomenon
happened again at the end of the stationary phase when the culture had its maximum
density.
Figure 4.6 Lower magnification of clump cells at day 6
The presence of bacteria did not appear to have any negative influence on the cultures.
P. carterae cells did not have high tolerance to invasion by other microalgal species
and the cells died shortly after being contaminated. Isolated cells were kept on agar

50
plates. Agar isolation is an accurate method for cell isolation, allowing cells to grow
slowly (over about two months). Primary samples of agar cultures showed small
micro-organisms growing with the P. carterae cells but have not appear to affect their
growth.
A previous study showed the maximum cell density obtained from a raceway pond
was 1.05×10⁶cells/ml (Moheimani, 2005), which was less than laboratory results in
this work. As it was mentioned in the literature review (Borowitzka, 1998), closed
systems are not suitable for large-scale cultivation of microalgae due to their
expensive processes, and provide a less satisfactory basis for commercialisation.
Therefore, open cultivation has been recommended for commercial scale work.
However, several difficulties in open ponds such as contamination risk and
environmental changes will affect the final cultivation productivity. Results from this
work confirm that the presence of bacteria did not affect the growth rate, but it should
be considered that P. carterae cells are competitive against other algal species and
continuous maintenance in a large scale cultivation is required to prevent the risk of
contamination.
Microalgal cells, during the growth cycle, capture CO2 from the atmosphere which
increase pH of the media (Huretas et al., 2000). Dissolved CO2, in a P. carterae
culture, increased the pH of the media from 7.2 to 9.4 and at the end of the growth
cycle due to a decreasing number of cells, will reduce pH to 7.8. Similar results have
been reported from a raceway pond cultivation (Moheimani, 2005). Increasing the
initial pH of the media did not change growth rate, thus indicating that the effect of
higher pH on P. carterae growth rate is minimal, although the pH range for
P. carterae growth has been reported between 8-11 (Moheimani & Borowitzka,
2006a). The data shown in Figure 4.3 shows that P. carterae has a long stationary
phase, although, after reaching the death stage, the cells died within 5 days. Therefore,
the cells must be harvested or transferred to a new culture before reaching the death
phase.
Pienaar (1994) described the filamentous stage (Apistonema) during the growth of
P. carterae. He described how cells stick together and make bigger `colonies in the
media (Figure 2.3). At laboratory scale of P. carterae growth, two filamentous stages
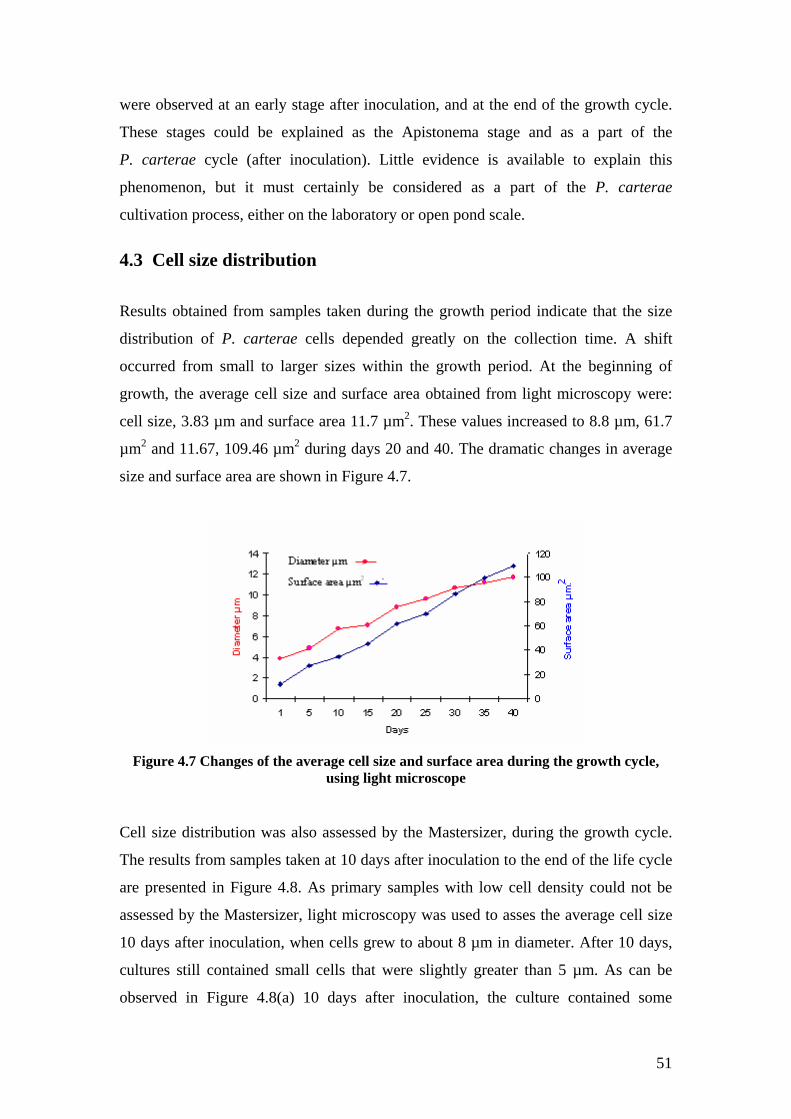
51
were observed at an early stage after inoculation, and at the end of the growth cycle.
These stages could be explained as the Apistonema stage and as a part of the
P. carterae cycle (after inoculation). Little evidence is available to explain this
phenomenon, but it must certainly be considered as a part of the P. carterae
cultivation process, either on the laboratory or open pond scale.
4.3 Cell size distribution
Results obtained from samples taken during the growth period indicate that the size
distribution of P. carterae cells depended greatly on the collection time. A shift
occurred from small to larger sizes within the growth period. At the beginning of
growth, the average cell size and surface area obtained from light microscopy were:
cell size, 3.83 µm and surface area 11.7 µm2. These values increased to 8.8 µm, 61.7
µm2 and 11.67, 109.46 µm2 during days 20 and 40. The dramatic changes in average
size and surface area are shown in Figure 4.7.
Figure 4.7 Changes of the average cell size and surface area during the growth cycle,
using light microscope Cell size distribution was also assessed by the Mastersizer, during the growth cycle.
The results from samples taken at 10 days after inoculation to the end of the life cycle
are presented in Figure 4.8. As primary samples with low cell density could not be
assessed by the Mastersizer, light microscopy was used to asses the average cell size
10 days after inoculation, when cells grew to about 8 µm in diameter. After 10 days,
cultures still contained small cells that were slightly greater than 5 µm. As can be
observed in Figure 4.8(a) 10 days after inoculation, the culture contained some

52
P. carterae cells of 5-11 µm diameter and some particles with diameter sizes between
0.3-2 µm. Sixteen days after inoculation, the cell population of 10 µm diameter size
increased. However, some very small particles were still present in the media (Fig 4.8
(b)). Various cell sizes from day 22 and 32 can be seen in Figure 4.8(c). These may
include bacteria, immature P. carterae cells after division and grown P. carterae
cells. Thirty two days after inoculation (at the end of the stationary phase), cells
started to clump together and make big colonies. These colonies, as was observed
with light microscopy, were between 80-120 µm (Figure 4.8(d)).

53
(a)
(b)
(c)
(d)
Figure 4.8 Left- Cell size distribution by the Mastersizer during the growth cycle at days
(a) 10, (b) 16, (c) 22, and (d) 32 in comparison with, right- light microscopy images Information available from the literature indicates that the settling velocity depends on
the physical characteristics of the suspension and specifically particle size distribution
(Eq 2.9). Results from the laboratory cultivation show that P. carterae cell diameter
increased from 3.5 µm to 11.2 µm during the growth cycle. Furthermore, cell surface
area increases dramatically during the growth cycle. These progressive changes in

54
diameter and surface area could greatly affect the settling rate. Therefore, a different
settling rate is expected throughout the various collection times. There is limited
information about the settling rate of P. carterae suspension in relation to collection
times. Metcalf & Eddy (2003) concluded that the settling velocity rate of any kind of
suspension is strongly increased by increasing particle size, so an understanding of
particle cell size distribution is a key factor in predicting the settling rate. The
Mastersizer results emphasise that all samples, depending on differences in growth
time, include small particles with size <3 µm. According to the literature review P.
carterae cells are > 5 µm in diameter (Pienaar, 1994). On the other hand, as was
discussed in the cultivation results, agar plates of isolated P. carterae cells had some
other micro-organisms (more likely to be bacteria). Therefore, the population of small
particles in the Mastersizer results could be bacteria present in the culture. These
bacteria have been recognised as a potential nutrient for P. carterae cells during their
growth phase (Moheimani, 2005). Figures 4.7 and 4.8, from light microscopy and the
Mastersizer assessment confirm that P. carterae cells size and surface area increased
over the growth cycle. However, the Mastersizer provides a more accurate method for
measuring cell diameter size distribution, not only in the case of a few random
samples but also of the majority of cells in the medium. Light microscopy measured
size and surface area but a statistically valid analysis of millions particles must be
done manually which is not practical.
4.4 Viscosity
During the measurement of shear stress versus shear rate there was no significant
difference with increasing cell number. However, high cell concentration after
centrifugation and contaminated samples caused a minor change in culture viscosity.
Test results obtained with samples at 22oC are shown in Figure 4.9. Data obtained
from the viscometer were plotted in graphs where the slope of the function identifies
the cultures viscosity. As can be seen in Figure 4.9 cultures displayed Newtonian flow
with different densities and have an almost a constant slope of 0.001Pa.S. Increasing
cell concentration and presence of other species did not affect viscosity. A summary
of obtained results are presented in Table 4.1. As can be seen in Table 4.1 the
viscosity of P. carterae cultures was a constant and independent of density.

55
Figure 4.9 Shear rate against shear stress for different cell concentrations (a) pure
media, (b) 25×105cells/ml, (c) high concentrated cells after centrifugation, and (d) contaminated culture. Slope of the graphs indicates culture viscosity.
Table 4.1 Variation of Microalgal density with cell concentration
Sample
Cells/ml
Viscosity (Pa.S)
Temperature (oC)
Comment
0
0
0.001
20
Pure media
1
25×105
0.0011
20
-
2
centrifuged cells
(2.4 × 10⁸)
0.0012
20
-
3
Contaminated
(0.2 ×10⁴)
0.0013
20
Culture included
Chlorella and bacteria
Viscosity is the quantity that describes a fluid resistance to flow. Viscosity varies with
temperature in microalgal cultures, while cell density is the critical factor for
measuring medium density (Young, 1994). The literature review (section 2.11)
described the proportional relation between shear stress versus shear rate to viscosity.
Plotted data from the viscometer indicate Newtonian and non Newtonian fluids.
Thus, from the previous results it can be seen that the P. carterae suspension, as was
a b
c d
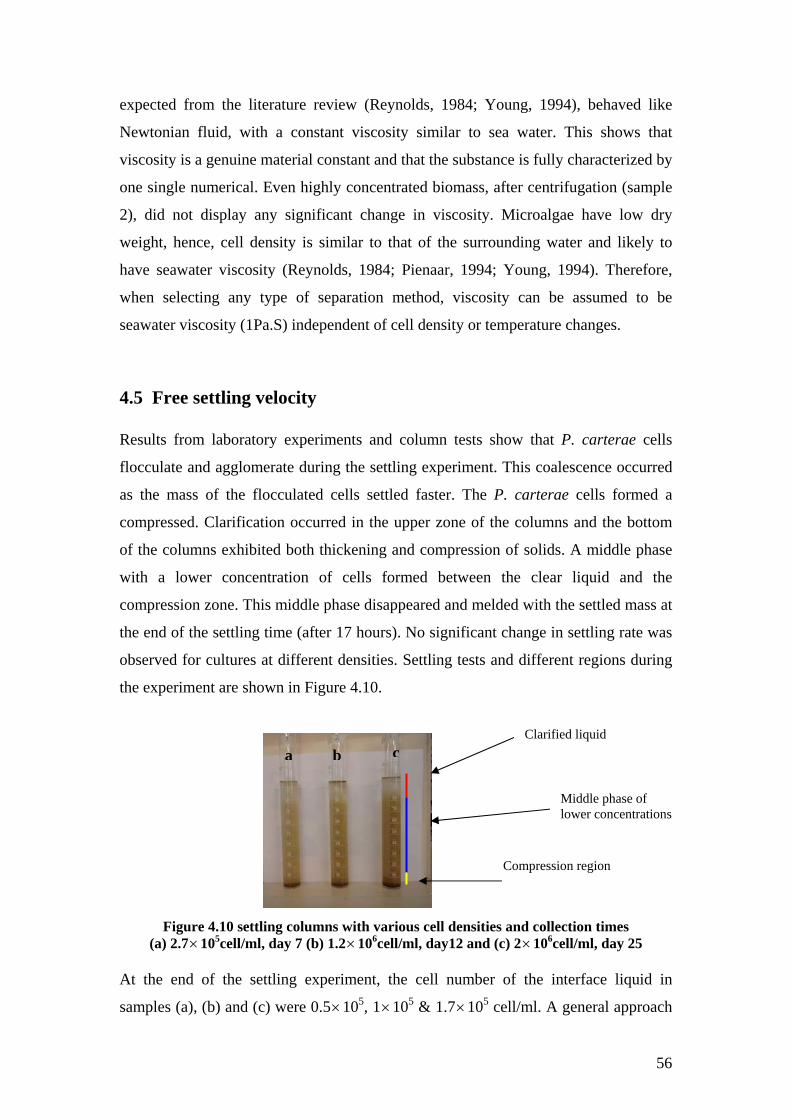
56
expected from the literature review (Reynolds, 1984; Young, 1994), behaved like
Newtonian fluid, with a constant viscosity similar to sea water. This shows that
viscosity is a genuine material constant and that the substance is fully characterized by
one single numerical. Even highly concentrated biomass, after centrifugation (sample
2), did not display any significant change in viscosity. Microalgae have low dry
weight, hence, cell density is similar to that of the surrounding water and likely to
have seawater viscosity (Reynolds, 1984; Pienaar, 1994; Young, 1994). Therefore,
when selecting any type of separation method, viscosity can be assumed to be
seawater viscosity (1Pa.S) independent of cell density or temperature changes.
4.5 Free settling velocity Results from laboratory experiments and column tests show that P. carterae cells
flocculate and agglomerate during the settling experiment. This coalescence occurred
as the mass of the flocculated cells settled faster. The P. carterae cells formed a
compressed. Clarification occurred in the upper zone of the columns and the bottom
of the columns exhibited both thickening and compression of solids. A middle phase
with a lower concentration of cells formed between the clear liquid and the
compression zone. This middle phase disappeared and melded with the settled mass at
the end of the settling time (after 17 hours). No significant change in settling rate was
observed for cultures at different densities. Settling tests and different regions during
the experiment are shown in Figure 4.10.
Figure 4.10 settling columns with various cell densities and collection times
(a) 2.7×10⁵cell/ml, day 7 (b) 1.2×10⁶cell/ml, day12 and (c) 2×10⁶cell/ml, day 25 At the end of the settling experiment, the cell number of the interface liquid in
samples (a), (b) and (c) were 0.5×10⁵, 1×10⁵ & 1.7×10⁵ cell/ml. A general approach
Clarified liquid
Middle phase of lower concentrations
Compression region
a b c

57
to the graphical procedure for suspension settlement has been set out in text books
(Metcalf & Eddy, 2003; Qasim, 1999). This approach was used on P. carterae cells
using a graduated cylinder as shown in Figure 4.10. The settled depth with a time of
sludge settling for various cell densities was also plotted in graphs (Figure 4.11). The
slope of the graphs, as it is shown in Figure 4.12, indicates the settling velocity rate of
the suspension samples (a) = 1.47, (b) = 1.49 and (c) = 1.5 cm/h.
Figure 4.11 Graphical procedure of P. carterae suspension settlement. Arrows identify
different stages during settling tests. Cited from (Qasim, 1999)
As was discussed in the literature review, the slope of flocculent settling in the
hindered zone indicates the settling velocity rate of the suspension. Furthermore, the
a
b c
Flocculant settling /Hindered zone (slope= settling rate)
Compression settling
Transition settling
Figure 4.12 Settling curves obtained from settling column tests at different cell concentrations, (a) 2.7×10⁵ cell/ml (b) 1.2×10⁶ cell/ml and (c) 2×10⁶cell/ml
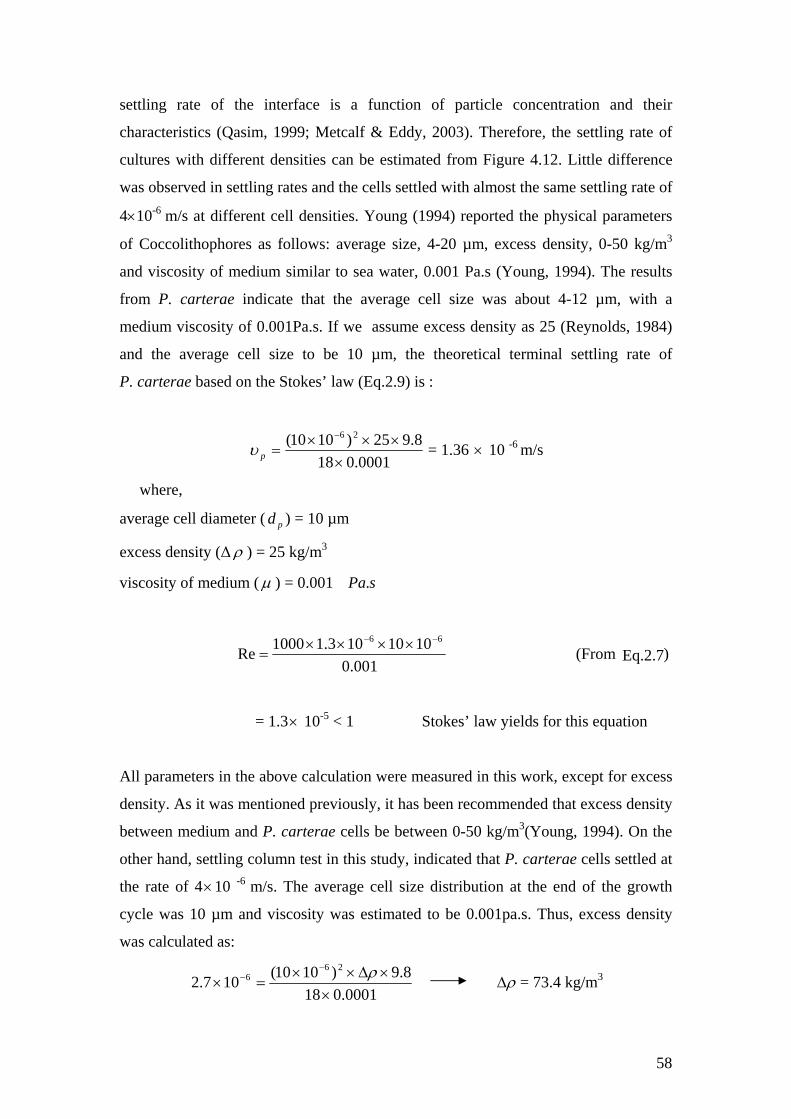
58
settling rate of the interface is a function of particle concentration and their
characteristics (Qasim, 1999; Metcalf & Eddy, 2003). Therefore, the settling rate of
cultures with different densities can be estimated from Figure 4.12. Little difference
was observed in settling rates and the cells settled with almost the same settling rate of
4×10⁻⁶ m/s at different cell densities. Young (1994) reported the physical parameters
of Coccolithophores as follows: average size, 4-20 µm, excess density, 0-50 kg/m3
and viscosity of medium similar to sea water, 0.001 Pa.s (Young, 1994). The results
from P. carterae indicate that the average cell size was about 4-12 µm, with a
medium viscosity of 0.001Pa.s. If we assume excess density as 25 (Reynolds, 1984)
and the average cell size to be 10 µm, the theoretical terminal settling rate of
P. carterae based on the Stokes’ law (Eq.2.9) is :
0001.0188.925)1010( 26
××××
=−
pυ = 1.36 × 10 -6 m/s
where,
average cell diameter ( pd ) = 10 µm
excess density (Δ ρ ) = 25 kg/m3
viscosity of medium (μ ) = 0.001 sPa.
001.0
1010103.11000Re66 −− ××××
= (From )
= 1.3× 10⁻⁵ < 1 Stokes’ law yields for this equation
All parameters in the above calculation were measured in this work, except for excess
density. As it was mentioned previously, it has been recommended that excess density
between medium and P. carterae cells be between 0-50 kg/m3(Young, 1994). On the
other hand, settling column test in this study, indicated that P. carterae cells settled at
the rate of 4×10 -6 m/s. The average cell size distribution at the end of the growth
cycle was 10 µm and viscosity was estimated to be 0.001pa.s. Thus, excess density
was calculated as:
0001.0188.9)1010(107.2
266
××Δ××
=×−
− ρ ρΔ = 73.4 kg/m3
Eq.2.7

59
Therefore, the excess density between P. carterae (naked) and the medium is 73.4
kg/m3 which was higher than the density reported in the literature review. If we
assume the culture has constant excess density and velocity, the only method of
increasing the settling rate is to raise the cells’ surface area and diameter by
flocculation techniques. Previous studies suggested various flocculation methods as
the most suitable technique for the initial collection of cells from the dilute media
(Mohn, 1988; Benemann & Oswald, 1996; Molina et al., 2002).
4.6 Cell disruption
Light microscopy assessment was carried out to visually examine cell breakage after
applying different acceleration forces. Cell disruption is clearly evident in samples (c)
and (d) (Figure 4.13) and the number of broken cells is much higher in sample (d). No
significant damage was observed in harvested cells after applying acceleration forces
of 300 and 1500×g. However, cell damage dramatically increased, after
centrifugation at 6500 and 11000 g× . A mixture of cells and associated debris can be
seen in the sample (Figure 4.13(d)). In this sample, P. carterae cells have lost their
walls, thus, it is difficult to realize individual cells in suspension and measure the
number of damaged cells/ml.
Figure 4.13 Light microscopy slides of P. carterae culture at ×400 magnification after
centrifugation with (a) 300, (b) 1500, (c) 6500, and (d) 11000 g× gravity forces
d
a b
c

60
Differences in cell breakage after the application of acceleration forces, as shown by
the results from light microscopy, were evaluated using flow cytometry. Healthy and
heat treated cells were selected to be used as controls. Results from flow cytometry
showed 94% of cells from the untreated culture were healthy (Figure 4.14(a)) and
87% of cells were damaged after heat treatment (Figure 4.14(b)). It can be observed
from the histograms that the cell population moved to the lower side scatter and the
left side of forward scatter. The percentage of broken cells increased from 8% after
centrifugation at 300×g to 12% at 1500×g then to 13% at 6500×g. Cells concentrated
in similar spots to healthy cells (Figure 4.14(a, b &c)). Increasing the acceleration
force up to 11000×g, destroyed 31% of the P. carterae cells. This breakage
transferred the cell population to the lower side scatter and left side of the forward
scatter. At 11000×g cells were scattered in different locations and no concentrated
population was recorded (Figure 4.14(d)).
As seen from the light microscopy experiments, the number of damaged cells
increased by applying higher gravity forces. Surprisingly, higher forces, up to
11000×g did not break cells more than 31%. However, light microscopy images show
almost all cells were broken, as a result of 11000×g (Figure 4.13(d)).

61
Figure 4.14 Left- Recorded results after assessing samples with flow cytometry, right- representative histograms of (a) healthy sample collected 30 days after
inoculation, (b) heat-treated cells
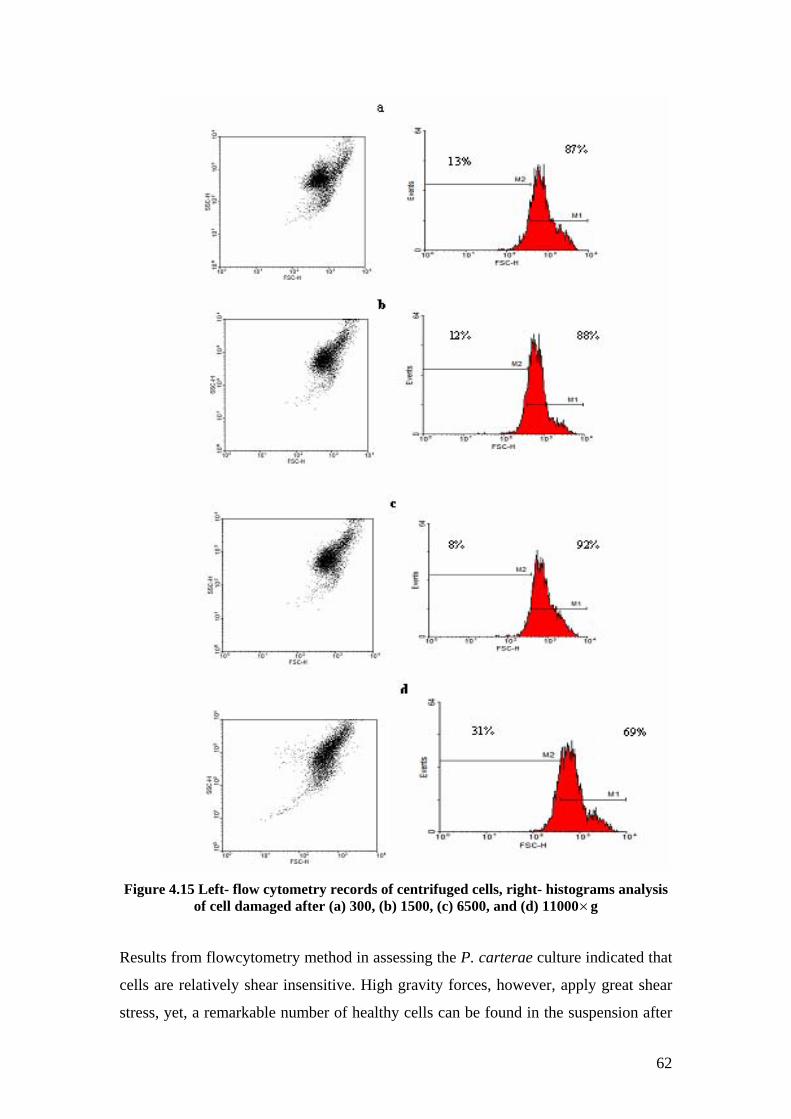
62
Figure 4.15 Left- flow cytometry records of centrifuged cells, right- histograms analysis
of cell damaged after (a) 300, (b) 1500, (c) 6500, and (d) 11000×g
Results from flowcytometry method in assessing the P. carterae culture indicated that
cells are relatively shear insensitive. High gravity forces, however, apply great shear
stress, yet, a remarkable number of healthy cells can be found in the suspension after

63
the centrifugation process. In the present work, P. carterae cellular characteristics,
such as cell size and internal complexity, were examined and displayed in histograms
using a flow cytometry method (Figures 4.14 & 4.15). The magnitude of forward
scatter is proportional to the size of the cell. Small cells provide small amount of
forward scatter. These small cells appear toward the left and larger cells move to the
right side of the forward histogram. Comparisons of damaged cells after heat
treatment with healthy cells from the culture show damaged cells have moved toward
the left side of the forward scatter. On the other hand, cells are travelling through the
laser beam will scatter light at all angles. This is caused by their granularity and
structure. Results from cells with less granularity will be plotted in lower side-scatter
histogram (Givan, 1992). Harvested cells under a low acceleration force did not have
any significant change in side-scatter or forward scatter, while 11000×g force
damaged 31% cell walls, and made a suspension of cells and their inside structure (as
it was shown in Figure 14.3(d)). Therefore, the majority of cells with smaller size and
less internal granularity have transferred to the left side of the forward scatter and the
lower part of the side scatter histogram (Figure 4.15(d)). Finally, plotted data from
cells passed through the laser were analysed in a histogram, revealing 31% cell
damage. In regard to the flow cytometry, a smaller percentage of cell viability in
comparison to light microscopy was observed.
The critical disruption point which was shown with both methods was 11000×g and
higher. P. carterae cells have a high level of sensitivity to shear stress. Light
microscopy showed a suspension of dead cells after 11000×g but only 31% damaged
cells have been reported by the flow cytometry method. Viability, was described to be
a limiting factor in the use of some harvesting methods, specifically, centrifugation
(Mohn, 1988; Benemann & Oswald, 1996).
4.7 Discussion
The comparison of growth results from this work and a previous study (Moheimani,
2005) showed P. carterae has a similar growth cycle at a bench-scale and in raceway
ponds. The maximum cell concentration obtained from the laboratory study was
higher than in a raceway pond. The reason for this difference can be explained by
64
comparing the condition of the cultures in these two systems. The growth carboys
were located in the laboratory, under continuous maintenance and sufficient nutrition.
They were operating as small closed reactors, but in an exterior system conditions
such as, rain, light and contamination will negatively influence growth rate and
maximum cell density. This problem has already been reported as one of the main
limitations facing the commercialisation of microalgal projects (Borowitzka, 1998).
This study of P. carterae cells at bench scale showed that these cells grew well in
BG11 media with 1.8% salinity, pH 8-11 with a high tolerance of bacteria
contamination. As a result, this marine species with its high growth rate could be a
suitable candidate for biofuel production, although cell recovery from the dilute media
still present harvesting difficulties and the lipid yield of biomass is unknown.
Moheimani (2005) estimated a final cost of P. carterae biomass production,
depending on cultivation and harvesting methods, to be Aus$7.35/kg to
Aus$14.17/kg. He has suggested flocculation as an efficient method for initial
harvesting of heavy Coccolithophorid cells thus reducing dewatering costs
(Moheimani, 2005), but no specific screen tests have been done to evaluate the
feasibility of different harvesting techniques.
The importance of cell size distribution and surface area of particles in harvesting
efficiency and methods of improving these parameters was discussed in the literature
review (Benemann & Oswald, 1996; Metcalf & Eddy, 2003). Observing cells under
the microscope in comparison with the Mastersizer observations showed that the cell
diameter and surface area grow during the life period to 11.67µm and 109.46 µm2.
Screening results from this work showed that the harvesting time was a critical factor
in cell size distribution. Results from cultivation and cell size distribution show
approximately, between days 15-25 (between stationary and dead stage) as the
optimum time for cell recovery. Over this period, the culture has maximum cell
density and size distribution was achieved. It must, however, be considered that
productivity may vary during the growth phase. Productivity of P. carterae cells (at
the end of their growth cycle) at maximum high concentration has been measured as
16-33.5g.m-2.d-1 in a raceway pond (Moheimani, 2005). Therefore, the lipid content of
cells must be measured over different collection times to harvest cells with the
optimum productivity as well as cell size distribution.

65
The settling velocity rate can be predicted theoretically through Stokes’ law and can
be compared with the actual terminal velocity of particles in column tests. Column
test modelling of sedimentation is a common technique in water treatment engineering
when designing sedimentation basins (Metcalf& Eddy, 2002). Results from the
settling column tests showed the settling rate of P. carterae cells at different cell
densities was 4×10⁻⁶m/s which was faster than the predicted rate of 1.3 ×10⁶m/s.
Because of the advantage provided by this high excess density (73.4 kg/m3) and fast
terminal settling of the P. carterae cells, sedimentation would be a suitable harvesting
method for low cost biomass recovery process. Experiments from the settling columns
indicate that a number of cells (~1×10⁵cell/ml) remained in the effluent. These cells
can be cultivated in fresh media. However, little evidence is available to explain the
feasibility of recycling the cells and reusing media. As a result, P. carterae cells with
their high excess density and fast settling rate can initially be recovered by
sedimentation methods. However, concentrated cells at the bottom of the columns had
a high water content and high moisture content has been determined as a negative
effect on the next stage of oil extraction (Demirbas, 2008), and so there is a need for a
second dewatering step to obtain satisfactory water content for downstream
processing. Filtration and centrifugation were two potential dewatering techniques
after pre-concentration, these techniques have been recommended for the microalgal
harvesting process (Mohn, 1988; Benemann & Oswald, 1996; Molina et al., 2002). P.
carterae cells seem unsuitable for filtration methods due to their size and flocculating
behaviour culture which leads to membrane clogging difficulties. These issues
associated with continuous back washing and the high costs involved in harvesting on
a large scale require detailed studies in order to develop possible filtration techniques
with less energy input and a maximum dewatering percentage. Centrifugation has the
most potential as a dewatering technique after flocculation, particularly for large scale
recovery (Molina et al., 2002). Nozzle centrifuges are not suitable instruments for
harvesting P. carterae. This is mainly because clumped cells clog nozzles and disrupt
the continuous process. To date, little study has been done to investigate any practical
centrifuge machine for second stage recovery of microalgal cells after flocculation.
Hence, further work needs to be done to investigate the potential of centrifugation
machines with their minimum need for energy input need. However, cell damage
appears as one of the fundamental problems with centrifugation recovery. Further, cell
disruption at a high stirring rate has been discussed as a difficulty prior to the

66
cultivation of P. carterae in a raceway pond (Moheimani, 2005). Results from flow
cytometry and light microscopy show P. carterae cells are strong enough cells to
resist shear stresses up to 11000 g× . However, cell disruption caused by
centrifugation prior to the harvesting process could be an advantage, because broken
cells cause release lipid to the medium, thus assisting the lipid extraction process.
More studies are required to examine alternative combinations of harvesting and
extraction methods so as to reduce the total cost of biofuel production.
Research on production of biofuel from microalgae has received much recent
attention (Demirbas, 2009). Biofuel production from feedstock is presently being
limited as a result of global crisis concerning food and water sources. On the other
hand, CO2 emission and global warming are still unsolved environmental issues. To
overcome these problems, marine microalgae, with their low demand for agricultural
land and water, may be potential sources of biomass for biofuel production.
Specifically, countries like Australia with sufficient sea water sources, land and
sunlight are suitable candidates for the commercial production of microalgal biofuel.
However, previous studies reveal that high costs and uncertainty about some aspects
of large scale production limit any alternative commercialization, but results from this
work confirm that improving different parts of the system (such as was shown in
Figure 2.1) will significantly reduce costs and support the plan to produce biofuel
from microalgae in commercial scale as a worthwhile project with CO2 fixation basis.
However, few studies have undertaken to estimate and update the economics of such a
system from cultivation to marketing. Results obtained in this study confirm that
improving different parts of the process will greatly reduce the total cost of the final
product. Therefore, further study is required to analyse alternatives that would
improve the feasibility of a realistic commercial product. The results and analysis
presented here will constitute a worthwhile basis for future work on microalgal
projects, specifically, biofuel production from microalgae. The next chapter presents a
general summary of this preliminary work and discusses future direction for biomass
recovery and cost reduction of biofuel production on a large-scale.

67
Chapter 5: Conclusion and future work
5.1 General Conclusion P. carterae has previously been shown to be a suitable candidate for biofuel
production because of its high lipid content, fast growth rate and low contamination
risk (Moheimani & Borowitzka, 2006b). On the basis of this study, certain
conclusions about harvesting can be drawn from the characteristics of the target
species. Several characteristics of P. carterae cells were screened and tested with
respect to their effect on harvesting and the downstream process in relation to biofuel
production.
Bench cultivation has successfully identified the growth cycle of P. carterae and any
change within this period at the laboratory scale has been recorded. The maximum
cell density obtained from laboratory cultivation in this study was 2 610× cell/ml. The
growth cycle of P. carterae cells, as with other micro-organisms have four growth
stages including, lag, growth, stationary and death phases. The presence of bacteria in
the media did not considerably influence the growth of P. carterae but the occurrence
of other species had negative effects on the growth of P. carterae cells. Daily pH
measurement indicated that the pH of the medium increased from 7.2 to 9.4 during the
logarithmic growth phase. Changes in initial media pH were found to have a minimal
impact on growth rates. The results presented here from laboratory screen testing
confirm that P. carterae cells can be maintained and grown in marine media with high
pH tolerance. This procedure optimises the use of P. carterae marine microalgae with
low contamination risk and fast growth rate and indicates their potential feasibility of
commercial production of biomass.
One of the most interesting results of this study was the increase in cell size during the
growth period. Cell size, under laboratory conditions, increased from 3.8 µm to 11.6
µm during 20 days. Moreover, P. carterae cells 5-7 and 30-32 days after inoculation
were shown to flocculate resulting in large colonies (80-120µm).
The physical characteristics of the P. carterae cell and medium, such as cell size
distribution and terminal velocity were used to calculate a theoretical settling rate.

68
Results from settling columns were compared to predicted terminal settling rate.
Examinations of settling curves from column tests confirm that P. carterae cells settle
faster than the theoretically predicted velocity rate. These results together indicate
that, a P. carterae culture has a similar viscosity to sea water, and naked cells have
excess densities of about 73.4 kg/m3. Cells are likely to stick together and settle
quickly. Therefore, flocculation, as the initial stage of harvesting, has the potential to
save a large amount of energy in the recovered P. carterae cells.
After cell counting in the culture recovered from column settling tests, it was
estimated that 91% of cells, without any pre-treatment, and during the 12 hour
experiments, settled to the bottom of the columns. On the other hand, as shown in the
growth cycle diagram, during the stationary phase, the culture maintains constant cell
concentration for about 12-15 days. Therefore, sedimentation in a reservoir can be a
potential harvesting technique for initial cell collection, although the high water
content of the biomass at this stage is not acceptable for any downstream process.
There is a need for further dewatering techniques to achieve a dry biomass for the
next step of oil extraction. A recent study in microbial flocculation, particularly using
P. carterae culture, suggests the potential of microbial flocculation method for the
low cost large scale production of biofuel (Lee et al., 2008).
Continuous centrifugation, has been suggested as the second stage of harvesting after
flocculation (Molina et al., 2002). However, cell disruption and expensive processing
are the main limitations of large-scale centrifugation. P. carterae cells after
centrifugation with various gravity forces were examined in this study. Flow
cytometry and light microscopy results both showed that P. carterae cells have a high
tolerance against shear stress. Gravity forces less than 6500×g did not affect cell
viability and only a small percent of broken cells were observed in centrifuged
samples, however, higher g forces dramatically damaged >30%. It may be feasible to
develop a combined stage of dewatering and oil extraction, but more work is needed
to evaluate the feasibility of this potential technique as a means of cost reduction.
Results from this study have shown that a preliminary evaluation of the physical
characteristics of the target species and the settling velocity rate of the suspension, are
extremely important for the investigation of feasible harvesting techniques. Further

69
results obtained from laboratory tests of P. carterae and its physical characteristics
indicate that there are possibilities for further optimisation of harvesting processes,
but these approaches must be carried out in outdoor systems under natural conditions.
Finally, the methods and analysis presented here can be used to perform similar work
in future studies
5.2 Future work
The methods and techniques discussed here reveal aspects of the settling behaviour
and characteristics of P. carterae in relation to the production of suitable harvesting
techniques. These results suggest work in several directions. Firstly, more work is
required to optimise the growth of the species in an open raceway pond in individual
areas and climate conditions. Although, P. carterae was considered as the most likely
potential species for biofuel production, different microalgal species must be grown
and examined in order to improve productivity. Secondly, similar tests for estimating
the settling characteristics of P. carterae should be done for raceway pond samples as
to find the effect of open outdoor cultivation on their settling characteristics.
Flocculation results from outdoor cultivation have the potential to significantly
identify an initial stage of harvesting using a low energy input. Furthermore, these
results can be scaled up to improve the economic modelling of large scale biomass
production. Previous studies have suggested various flocculation techniques, but none
of them have been examined out of the laboratory under natural growth conditions. A
recent study of microbial flocculation suggests a potential method for microalgal cell
recovery (Lee et al., 2008). Optimisation of this technique is necessary to examine the
feasibility of a cheap flocculation method in outdoor recovery. As it was discussed
previously, a second stage of dewatering is required to reduce biomass water content
for downstream processing. Centrifugation as one of the most promising methods for
second dewatering stage should be assessed by examining a large volume of
recovered cells after flocculation. Various centrifuge options are available in the
market. Only continuous systems with minimum energy input and low maintenance
are suitable for this system. More studies need to investigate suitable centrifuges and
estimate the total cost of recovery. Energy input and viability assessment are the

70
critical factors in assessing the feasibility of a centrifuge for work at a commercial
scale.
In addition, CO2 fixation in the large scale cultivation of microalgae is widely
regarded as one of the most promising alternatives for the supply of a sustainable
source of biofuel that can support action against global warming. Yet, there are many
unsolved aspects in the commercialisation of biofuel production from microalgae.
These issues should be examined in details and addressed in separate studies. The
next section suggests some future work which is required to improve this system so as
to aim towards a sustainable source of biofuel on an economical basis.
From the above discussion, it is evident that, there is a considerable overlap between
laboratory and outdoor cultivation and harvesting results for biofuel production.
Therefore, future studies in the use of outdoor ponds need to optimise the growth and
lipid productivity of the target species, investigate waste treatment methods and
estimate an economical harvesting system for biofuel production from microalgae on
a commercial scale.
71
References Becker, E.W., 1994, Microalgae biotechnology and microbiology, Cambridge, Press
Syndicate of the University of Cambridge. 142-171 Benehann, J.R., Tillett, D.M. & Weissman, J.C., 1987, Microalgae biotechnology.
Trends in biotechnology. 5: 47-53 Benemann, J., 1993, Utilization of carbon dioxide from fossil fuel-burning power
plants with biological systems. In: Proceedings of the International Energy Agency Carbon Dioxide Disposal Symposium, Oxford.
Benemann, J., Koopman, B., Weissman, J., Eisenberg, D. & Goebel, R., 1980,
Development of Microalgae Harvesting and High-Rate Pond Technologies in California. In: Shelef, G. & Soeder, C. (Eds.) Algae Biomass. Amsterdam, New York, Oxford, Elsevier pp: 457-495
Benemann, J. & Oswald, W., 1996, Systems and economic analysis of microalgae
ponds for conversion of CO2 to biomass.U.S. Department of Energy pp: 105-109
Bernard, F. & Prieur, A., 2007, Biofuel market and carbon modelling to analyse
French biofuel policy. Energy Policy. 35: 5991-6002 Bi, F., Junaid, M., Arman, M., Noor, T. & Iqbal, S., 2007, Physicochemical
characterization and ionic studies of sodium alginate from Sargassum terrarium (brown algae). Physics and Chemistry of Liquids. 45: 453-461
Bilanvoic, D., Shelef, G. & Sukenik, A., 1988, Flocculation of Micro algae with
Cationic Polymers- Effects of Media Salinity. Biomass. 17: 65-76 Borowitzka, M., 1992, Algal biotechnology products and processes matching science
and economics. Journal of Applied Phycology. 4: 267-279 Borowitzka, M., 1997, Microalgae for aquaculture: Opportunities and constraints.
Applied Phycology. 9: 393-401 Borowitzka, M., 1998, Commercial production of microalgae, ponds, tanks, tubes and
fermenters. Journal of Biotechnology. 70: 313-321 Carter, N.P. & Meyer, E.W., 1994, Introduction to the principles of flow cytometry.
In: Ormerod, M. G. (Ed.) Flow cytometry: a practical approach New York, IRL Press at Oxford University Press, pp: 1-24
Charles, M. & Ambler, P.E., 1979, Centrifugation. In: Schweitzer, P. (Ed.) Handbook
of Separation for Chemical Engineers. McGraw-Hill, pp: 56-93 Chaumont, D., 1993, Biotechnology of algal biomass production: a review of systems
for outdoor mass culture. Applied Phycology. 5: 593-604
72
Chelf, P., Brown, L.M. & Wyman, C.E., 1993, Aquatic biomass resources and Carbon Dioxide trapping. Biomass and Energy. 4: 175-183
Chisti, Y., 2007, Biodiesel from microalgae. Biotechnology. 25: 294-306 Coulson, J.M. & Richardson, J.F., 2005, Chemical Engineering McGraw-Hill. 4.6:
415-422 Craggs, R., 1997, Wastewater nutrient removal by marine microalgae grown on a
corrugated raceway. Water research. 31: 1701-1707 Crittenden, J.C., Trussell, R.R., Hand, D.W., Howe, K.J. & Tchobanoglous, G., 2005,
Water treatment: Principles and Design, John Wiley &Son, Inc. 2. 779-804
Dautzenberg, K. & Hanf, J., 2008, Biofuel chain development in Germany: Organisation, opportunities, and challenges. Energy Policy. 36: 485-489
Dawes, C., 1998, Introduction to biological electron microscopy Burlington, Ladd
Research Industries. Demirbas, A., 2009, Production of Biodiesel from Algae Oils. Energy Resources Part
A-Recovery utilization and environmental effects. 31: 163-168 Eirich, F.R., 1956, Introduction to Rheological Concepts. In: Eirich, F. R. (Ed.)
Rheology ; Theory and Applications. New York, Academic Press, pp: 1-8 Faaij, A., 2006, Bio-energy in Europe: Changing technology choices. International
Journal of Hydrogen Energy. 34: 322-342 Franqueira, D., Orosa, M., Torres, E., Herrero, C. & Cid, A., 2000, Potential use of
flow cytometry in toxicity studies with microalgae. The Science of the Total Environment. 247: 119-126
Givan, A.L.,1992 Flow cytometry : first principles. New York, Wiley-Liss. Gudin, C. & Thepenier, C., 1986, Bioconversion of solar energy into organic
chemicals by microalgae. Adv Biotechnol Processes Biotechnol Processes 6:73–110
Guelcher, S.A. & Kanel, J.S., 1998, Method for dewatering micro algae with Jameson
cell, USA, http://www.patentstorm.us/patents/5776349.html, viewed August 2007
Guelcher, S.A. & Kanel, J.S., 1999, Method for dewatering microalgae with bubble
column, United States, http://www.patentstorm.us/patents/5910254.html, viewed August 2007
Hall, D.O. & House, J.I., 1993, Reducing atmospheric CO2 using biomass energy and
photobiology. Energy Conversion and Management. 34: 889-896

73
Hampel, M., Moreno-Garrido, I., Sobrino, C., Lubián, L.M. & Blasco, J., 2000, Acute Toxicity of LAS Homologues in Marine Microalgae: Esterase Activity and Inhibition Growth as Endpoints of Toxicity. Ecotoxicology and Environmental safety. 48: 287-292
Hearle, J.W.S., Sparrow, J.T. & Cross, P.M., 1972, The use of the Scanning Electro
Microscope Oxford, Pergamon Press. Huretas, E., Espie, G.S., Colman, B. & Lubian, L.M., 2000, Light-dependent
bicarbonate uptake and CO2 efflux in the marine microalga Nannochloropsis gaditana. Planta. 211: 43-49
IPCC, 2007, Climate change:The Physical Science Basis. http://www.ipcc.ch, Viewed
March 2007 Jun, M., Lei, G. & Fang, J., 2007, Effect of algae species population structure on their
removal by coagulation and filtration processes - a case study. Journal of Water Supply Research and Technology, AQUA. 56: 41-54
Knuckey, R., Brown, M., Robert, R. & Frampton, D.M., 2006, Production of
microalgae concentration by flocculation and their assessment as aquaculture feeds. Aquaculture Engineering. 35: 300-313
Kondili, E.M. & Kaldellis, J.K., 2006, Biofuel implementation in East Europe:
Current status and future prospects. Renewable and Sustainable Energy Reviews. 11: 2137-2151
Lai, R., 2005, World crop residues production and implications of its use as a biofuel.
Environment International. 31: 575-584 Lamers, P., McCormick, K. & Antonio, J., 2008, The emerging liquid biofuel market
in Argentina: Implications for domestic demand and international trade. Energy Policy. 36: 1479-1490
Ladisch, M.R., 2001, Bioseparations engineering: principles, practice, and economics,
New York, Wiley. 17-36 Lee, A.K., Lewis, D.M. & Ashman, P.J., 2008, Microbial flocculation, a potentially
low-cost harvesting technique for marine microalgae for the production of biodiesel. Journal of Applied Phycology. DOI 10.1007/S10811-008-9391-8:
Martin, C., Noue, J.D.l. & Picard, G., 1985, Intensive cultivation of fresh water microalgae on areated pig manure. Biomass. 7: 245-259
Medronho, R.A., 2003, Isolation and purification of Proteins. In: Hatti-Kaul, R. &
Mattiasson, B. (Eds.) Biotechnology and bioprocessing. Marcel Dekker, pp: 131-191

74
Metcalf & Eddy, 2003, Gravity separation Theory. In: Tchobanoglous, G., Burton, F. L. & Stensel, H. D. (Eds.) Wastewater Engineering: Treatment and Reuse. 4 ed. New York, Mc Graw Hill, pp: 361-474
Moheimani, N., 2005, The Culture of Coccolithophorid algae for Carbon Dioxide
Brioremediation. Biological Sciences & Biotechnology, PhD thesis, Perth, Murdoch University.
Moheimani, N. & Borowitzka, M., 2006a, Limits to productivity of alga
Pleurochrysis carterae Grown in Outdoor. Biotechnology and Bioengineering. 96: 27-36
Moheimani, N. & Borowitzka, M., 2006b, The long-term culture of the
coccolithophore Pleurochrysis carterae in outdoor raceway ponds. Journal of Applied phycology. 18: 703-712
Mohn, F., 1988, Harvesting of Micro-algal biomass. In: Borowitzka, M. &
Borowitzka, L. (Eds.) Micro algae biotechnology. Cambridge University Press, pp: 396-413
Molina, E., Belarbi, E.H., Fernandez, F.G.A., Medina, A.R. & Chisti, Y., 2002,
Recovery of microalgal biomass and metabolites: Process options and economics. Biotechnology Advances. 20: 491-515
Muirhead, K.A., 1984, Applications of Flow cytometry in clinical diagnosis. Trends
in Analytical Chemistry 3:107-111 O'Mellia, C.R., 1991, Overview Lecture Practice, theory and solid-liquid separation
In: Bernhardt, H. & Ives, K. (Eds.) IWSA/IZWPRC joint specialized conference on coagulation, flocculation, filtration, sedimentation and flotation. Blackwell Scientific Publications, pp: 51-515
Pan, J.R., Huang, C., Chuang, Y.C. & Wu, C.C., 1998, Dewatering characteristics of
algae-containing alum sludge. Colloids and surface A: Physicochemical and Engineering Aspects. 150: 185-190
Patil, V., Tran, K.Q. & Giselrod, H.R., 2008, Toward sustainable production of
biofuel from Microalgae. Molecular Sciences. 9: 1188-1195 Pena, A.I., Quintela, L.A. & Herradon, P.G., 1998, Viability assessment of dog
spermatozoa using flow cytometry. Theriogenology. 50: 1211-1220 Pienaar, R.N., 1994, Coccolithophores. In: Winter, A. & Siesser, W. G. (Eds.)
Ultrastructure and calcification of Coccolithophores. New York, Cambridge University Press, pp: 13-49
Pluz, O., 2001, Photobioreactor production systems for phototrophic microorganisms.
Appl Microbiol Biotechnology. 57: 287-293

75
Pushparaj, B., Pelosi, E., Torzillo, G. & Materassi, R., 1992, Microbial biomass recovery using a sysnthetic cationic polymer. Bioresourse Technology. 43: 59-62
Qasim, S.R., 1999, Biological waste treatment. In: Wastewater treatment plants:
planning, design, and operation. Lancaster, Technomic Pub Co., pp: 379-539
Reynolds, C.S., 1984, The Ecology of Freshwater Phytoplankton Cambridge,
Cambridge University Press. Richardson, J.F. & Zaki, W.N., 1954, Sedimentation and fluidisation: part1 In:
Transactions of the institution of chemical engineers. London, pp: 35-53 Richmond, A., 2004, Microalgal Culture. In: Molina, E., Fernandez, F. G. A. &
Medina, A. R. (Eds.) Downstream Processing of Cell-mass and Products. Blackwell Science Ltd, pp: 215-251
Running, J.A., R.J, H. & P.T, O., 1994, Heterotrophic production of ascorbic acid by
microalgae. Journal of Applied Phycology. 6: 99 Schenk, P.M., Thomas-Hall, S.R., Stephens, E., Marx, U.C., Mussgnug, J., Posten, C.,
Kruse, O. & Hankmer, B., 2008, Second Generation Biofuels: High-Efficiency Microalgae for biodiesel Production. Bioenergy Research. 1: 20-43
Seshadri, C.V., Umesh, B.V. & Manoharan, R., 1991, Beta-carotene studies in
Spirulina. Bioresource Technology. 38: 111-113 Shelef, G., A.Sukenik & Green, M., 1984, Microalgae Harvesting and Processing: A
literature Review. Solar Energy Research Institute, pp: 40-48 Shelef, G. & Soeder, C.J., 1980, Experiences and Strategies in the Recovery of
Biomass from Mass Cultures of Microalage. In: G.Shelef & Soeder, C. (Eds.) Algae Biomass. Elsevier, pp: 546-572
Shuler, M.L. & Kargi, F. (Eds.), 2002, Bioprocess Engineering: basic concept, Upper
Saddle River, NJ, Pretice Hall. Siesser, W.G., 1994, Coccolithophores. In: Winter, A. & Siesser, W. G. (Eds.)
Historical Background of Coccolithophore. New York, Cambridge University Press, pp: 1-12
Singh, A.P., Gon, S., Kang, H., Chung, G.C. & Soo, Y., 2003, Simple and Rapid
Methods for SEM Observation and TEM Immunolabeling of Rubber Particles Journal of Histochemistry & Caytochemistry. 51: 1105-1108
Sklar, L.A., 2005, The future of Flow Cytometry in Biotechnology:The Response to
Diversity Oxford University Press. 3-14

76
Spolaore, P., Joannis-Cassan, C., Duran, E. & Isambert, A., 2005, Commercial applications of Microalgae. Journal of Bioscience and Bioengineering. 101: 87-96
Stauber, J.L., Franklin, N.M. & Adams, M.S., 2002, Applications of flow cytometry
to ecotoxicity testing using microalgae. Trends in Biotechnology. 20: 141-143 Steffe, J.F., 1996, Introduction to Reohology. In: Steffe, J. F. (Ed.) Rheological
Methods in Food Process Engineering. 2 ed., Freeman Press, pp: 1-91 Sukenik, Shelef & Bilanvoic, 1988, Flocculation of Microalgae in Brackish and Sea
Water. Biomass. 15: 187-199 Svarovsky, L., 1985, Solid-Liquid Separation Processes and Technology. In:
Williams, J.C & Allen, T. (Eds.) Handbook of Power Technology. Elsevier.
Torres, M.R., Sousa, A., EATS, F., Dirce, F.M., Feitosa, J., Paula, R.d. & Lima, M., 2007, Extraction and physicochemical characterization of Sargassum vulgare alginate from Brazil Carbohysrate Research. 342: 2067-2074
UNFCCC, 1997, Kyoto Protocol, http://unfccc.int/kyoto_protocol/items/2830.php.
viewed April 2007. Vandanjon, L., Rossignol, N., Jaouen, P., Robert, J.M. & Quemeneur, F., 1998,
Effects of shear on two Microalgae species. Contribution of pumps and valves in tangential flow filtration systems. Biotechnology and Bioengineering. 63: 1-9
Wilde, E. & Benemann, J., 1993, Bioremoval of heavy metals by the use of
microalgae. Biotechnology Advances. 11: 791-812 Wong, K.B. & Piedrahita, R.H., 1999, Settling velocity characterization of
aquacultural solids. Aquaculture Engineering. 21: 233-246 Yanqun, L., Horsman, M., Wu, N., Lan, C.Q. & Calero, N.D., 2008, Biofuel from
Microalgae. American Chemical Society and American Institute of Chemical Engineers.
Young, J.R., 1994, Function of Coccoliths. In: Winter, A. & Siesser, W. G. (Eds.)
Coccolithophores. Cambridge, New York, Melbourne, Madrid, Cambridge, pp: 63-82
Zharov, V.P., Galanzha, E.I., Shashkov, E.V., Kim, J. W., Khlebtsov, N.G. & Tuchin,
V.V., 2007, Photoacoustic flow cytometry: Principle and application for real-time detection of circulating single nanoparticles, pathogens, and contrast dyes in vivo. Journal of Biomedical Optics. 12: 051503