pleistocene carbonate dissolution fluctuations in the
TRANSCRIPT

Marine Micropaleontology 79 (2011) 41–51
Contents lists available at ScienceDirect
Marine Micropaleontology
j ourna l homepage: www.e lsev ie r.com/ locate /marmicro
Research paper
Pleistocene carbonate dissolution fluctuations in the eastern equatorial Pacific onglacial timescales: Evidence from ODP Hole 1241
Joseph J. Lalicata ⁎,1, David W. LeaDepartment of Earth Science, University of California, Santa Barbara, Santa Barbara, CA 93106-9630, USA
⁎ Corresponding author. Tel.: +1 661 665 5399, +1E-mail addresses: [email protected] (J.J. Lali
(D.W. Lea).1 Present Address: Aera Energy LLC, 10000 Ming Ave
0377-8398/$ – see front matter © 2011 Elsevier B.V. Aldoi:10.1016/j.marmicro.2011.01.002
a b s t r a c t
a r t i c l e i n f oArticle history:Received 1 July 2010Received in revised form 15 January 2011Accepted 19 January 2011
Keywords:eastern equatorial Pacific Oceancarbonate dissolution cyclesisotope stratigraphycarbon isotopebenthic foraminiferalysocline
This study presents a record of dissolution from the eastern equatorial Pacific (EEP) that extends to 2.1 Ma,based on sediments from Ocean Drilling Program (ODP) Site 1241. A new benthic oxygen isotope record wasdeveloped in order to provide the stratigraphic framework for the Pleistocene section of the core. The isotoperecord extends back to 2.1 Ma, covering MIS 1–80, and has a sampling resolution of 2 kyr from 0 to 360 kyrand 5 kyr from 360 to 2100 kyr. Dissolution at ODP Site 1241 is characterized through the use of percentcoarse fraction (%CF) and shell fragmentation records. These records indicate that %CF in the EEP is recording adissolution signal dominated by the 41-kyr and 100-kyr climate cycles, and that preservation maxima lagglacial maxima by 9–14 kyr at themajor orbital periods. The dissolution signals observed in the ODP Site 1241record can be correlated across the Pacific and likely record the response to basinwide changes in carbonatechemistry. The dissolution fluctuations and δ13C signal observed at ODP Site 1241 are consistent with both theShackleton (1977) and Toggweiler et al. (2006) hypotheses that explain changes in the global carbon cycleduring glacial–interglacial transitions.
805 893 8665.cata), [email protected]
, Bakersfield, CA 93311, USA.
l rights reserved.
© 2011 Elsevier B.V. All rights reserved.
1. Introduction
1.1. Pleistocene CaCO3 preservation patterns
Deep sea carbonates are one of the largest and most reactivereservoirs for carbon dioxide (Broecker and Peng, 1987). In additionthey also provide a record of changes in oceanographic conditionsduring glacial–interglacial oscillations (Karlin et al., 1992). Theamount of carbonate in marine sediments is controlled by theproductivity of CaCO3-producing organisms in the surface waters,dilution by terrigenous matter and non-carbonate matter, and theamount of dissolution as the carbonate rains down into corrosive deepwaters (Volat et al., 1980). The cause of the Pleistocene calciumcarbonate cycles in the equatorial Pacific and their connection to thestate of the ocean carbonate system, as well as atmospheric CO2, havebeen debated since their discovery (Arrhenius, 1952).
Records of CaCO3 abundance in marine sediments can be correlatedacross the central andwestern equatorial Pacific (Farrell and Prell, 1991;Yasuda et al., 1993) and Indian Oceans (Bassinot et al., 1994; Petersonand Prell, 1985), showing that CaCO3 abundance tends to be at amaximum during glacial–interglacial transitions, and at a minimumduring glacial onsets. Arrhenius (1952) postulated that a change in the
intensity of oceanic and atmospheric circulation during glacial periodscaused increased upwelling, and therefore increased CaCO3 productiv-ity. Later studies suggested that enhanceddissolutionduring interglacialintervals rather than changes in productivity controlled the PacificCaCO3 cycles; and showed that dissolution consistently lagged oxygenisotope cycles (Berger, 1973; Berger and Johnson, 1976; Ku and Oba,1978; Le and Shackleton, 1992; Luz and Shackleton, 1975; Matsuoka,1990; Thompson and Saito, 1974). These observations suggested thePacific calcium carbonate cycles may be the result of changes in thecarbonate ion content of deep waters (Pisias, 1976). The lag betweencarbonate preservation and sea surface temperature, as represented bythe oxygen isotope signal, was suggested to be dependent on the localhydrographyof the region (Moore et al., 1977).Other studies examiningthe cyclicfluctuations in CaCO3 continued to attribute the cyclic featuresto either dissolution (Anderson et al., 2008; Berelson et al., 1990; Yasudaet al., 1993) or changes in productivity (Adelseck and Anderson, 1978;Archer, 1991; Arrhenius, 1988).
This study presents dissolution records for a relatively shallowwater depth core in the eastern equatorial Pacific (EEP), OceanDrilling Program (ODP) Site 1241 (5°50.570′N, 86°26.676′W;2027 m).We developed a new stratigraphy for the Pleistocene sectionof the site based on a benthic oxygen isotope record. Patterns of CaCO3
dissolution in the EEP are compared to other regions in the Pacific inorder to determine whether the timing of preservation/dissolutionspikes shows a basin-wide signal. These new benthic oxygen andcarbon isotope records, as well as the CaCO3 dissolution proxy recordsare used to test hypotheses explaining Pleistocene dissolution cycles.

42 J.J. Lalicata, D.W. Lea / Marine Micropaleontology 79 (2011) 41–51
1.2. Site and core description
Ocean Drilling Project (ODP) Hole 1241 (5°50.570′N, 86°26.676′W)was recovered at awater depth of 2027 m in the Guatemala Basin on Leg202 of theODP. The site is located on the sediment-coverednorthflank ofthe Cocos Ridge (Cocos Plate) in the EPWP (East Pacific Warm Pool)(Fig. 1). A complete Neogene sediment record was recovered bygenerating a composite section from splicing together sections ofsediment from the three individual holes (~20 m apart) after they hadbeen stratigraphically aligned using magnetic susceptibility data (Mixet al., 2003). The depth scale for the spliced core, adjusted for expansionand contraction is on the correctedmeters composite depth (cmcd) scale.Core sediment consists of nannofossil ooze with CaCO3 percentagesbetween 54 and 74%. ODP Site 1241 is located in a tectonically activeregionwith hot spot volcanism characterizing the EEP andvolcanismdueto subduction occurring on the west coast of Central and South America.Throughout the entire core, seventy-two volcaniclastic horizons wererecorded, seventeen of which are in the Pleistocene section (Mix et al.,2003). These ash layers, aswell as thenewlydocumented layers from thisstudy, will be of importance when interpreting the carbonate dissolution
Fig. 1. Locations of cores from the EEP used in this study: ODP 1241 (5°50.570′N, 86°26.676′W2348 mwater depth), TR163-22 (0°30.9′N, 92°23.9′W, 2830 mwater depth), TR163-31P (3°temperature changes seasonally in the “cold tongue” region (indicated by the black box), temfrom IRI/LDEO Climate Data Library (Reynolds et al., 2002).
records in order to distinguish samples that are affected by dilution fromnon-carbonate sediment.
2. Materials and methods
2.1. Isotope analysis
Isotopic analysis was performed at 5 cm intervals over the top7.12 cmcd and at 10 cm intervals to 44.96 cmcd. Core material wasweighed and disaggregated through a wet-sieving procedure usingdeionized water to wash and collect the N150 μm fraction of thesample. Samples were allowed to dry for 2 to 3 days before beingtransferred to vials for picking of individual foraminifer tests. Roughly10–20 individual shells of the benthic species Uvigerina auberianawere weighed, gently crushed, and loaded into Wheaton V-vials.Samples were cleaned prior to analysis as follows: 25 μl of 3% H2O2
was pipetted into each vial and left to sit for 30 min in order to purifythe samples of organic material. Following the H2O2 rinse, sampleswere ultrasonicated for 2 s in acetone, the supernatant was wickedaway, and finally dried in an oven at ~50 °C overnight. Samples were
, 2027 mwater depth), which is the focus of this study, TR163-19 (2°15.5′N, 90°57.1′W,35′S, 83°57′W, 3205 mwater depth), and the average annual SSTs in the EEP. While theperatures remain relatively stable in the waters around ODP Site 1241. Figure modified
43J.J. Lalicata, D.W. Lea / Marine Micropaleontology 79 (2011) 41–51
then analyzed on a GV Instruments IsoPrime Stable Isotope MassSpectrometer, with calibration to a house standard, SM92, which wascalibrated to VPDB through the NBS-19 standard. Reproducibility ofthe standard throughout the runs is estimated at ±0.03‰ for δ13C and±0.05‰ for δ18O based on the reproducibility of internal standards.
2.2. Age model
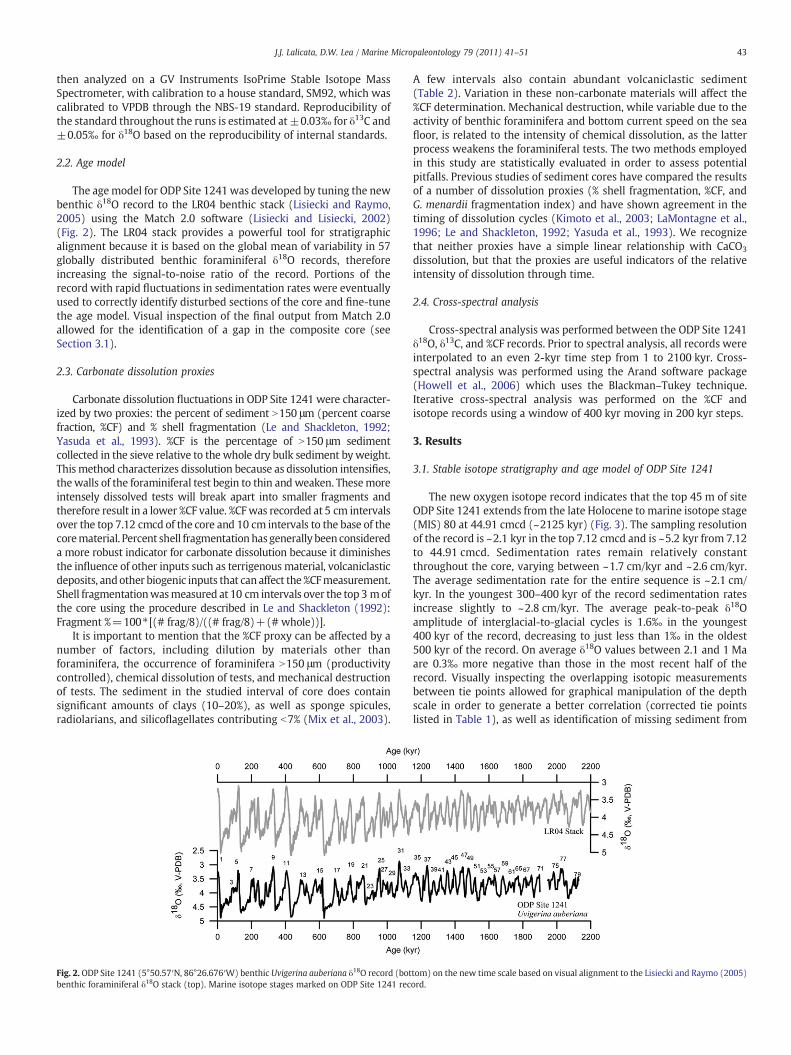
The agemodel for ODP Site 1241was developed by tuning the newbenthic δ18O record to the LR04 benthic stack (Lisiecki and Raymo,2005) using the Match 2.0 software (Lisiecki and Lisiecki, 2002)(Fig. 2). The LR04 stack provides a powerful tool for stratigraphicalignment because it is based on the global mean of variability in 57globally distributed benthic foraminiferal δ18O records, thereforeincreasing the signal-to-noise ratio of the record. Portions of therecord with rapid fluctuations in sedimentation rates were eventuallyused to correctly identify disturbed sections of the core and fine-tunethe age model. Visual inspection of the final output from Match 2.0allowed for the identification of a gap in the composite core (seeSection 3.1).
2.3. Carbonate dissolution proxies
Carbonate dissolution fluctuations in ODP Site 1241 were character-ized by two proxies: the percent of sediment N150 μm (percent coarsefraction, %CF) and % shell fragmentation (Le and Shackleton, 1992;Yasuda et al., 1993). %CF is the percentage of N150 μm sedimentcollected in the sieve relative to the whole dry bulk sediment byweight.This method characterizes dissolution because as dissolution intensifies,thewalls of the foraminiferal test begin to thin andweaken. Thesemoreintensely dissolved tests will break apart into smaller fragments andtherefore result in a lower %CF value. %CFwas recorded at 5 cm intervalsover the top 7.12 cmcd of the core and 10 cm intervals to the base of thecorematerial. Percent shell fragmentationhasgenerally been considereda more robust indicator for carbonate dissolution because it diminishesthe influence of other inputs such as terrigenous material, volcaniclasticdeposits, andother biogenic inputs that can affect the %CFmeasurement.Shell fragmentationwasmeasured at 10 cm intervals over the top 3 mofthe core using the procedure described in Le and Shackleton (1992):Fragment %=100⁎ [(# frag/8)/((# frag/8)+(# whole))].
It is important to mention that the %CF proxy can be affected by anumber of factors, including dilution by materials other thanforaminifera, the occurrence of foraminifera N150 μm (productivitycontrolled), chemical dissolution of tests, and mechanical destructionof tests. The sediment in the studied interval of core does containsignificant amounts of clays (10–20%), as well as sponge spicules,radiolarians, and silicoflagellates contributing b7% (Mix et al., 2003).
Fig. 2. ODP Site 1241 (5°50.57′N, 86°26.676′W) benthic Uvigerina auberiana δ18O record (botbenthic foraminiferal δ18O stack (top). Marine isotope stages marked on ODP Site 1241 rec
A few intervals also contain abundant volcaniclastic sediment(Table 2). Variation in these non-carbonate materials will affect the%CF determination. Mechanical destruction, while variable due to theactivity of benthic foraminifera and bottom current speed on the seafloor, is related to the intensity of chemical dissolution, as the latterprocess weakens the foraminiferal tests. The two methods employedin this study are statistically evaluated in order to assess potentialpitfalls. Previous studies of sediment cores have compared the resultsof a number of dissolution proxies (% shell fragmentation, %CF, andG. menardii fragmentation index) and have shown agreement in thetiming of dissolution cycles (Kimoto et al., 2003; LaMontagne et al.,1996; Le and Shackleton, 1992; Yasuda et al., 1993). We recognizethat neither proxies have a simple linear relationship with CaCO3
dissolution, but that the proxies are useful indicators of the relativeintensity of dissolution through time.
2.4. Cross-spectral analysis
Cross-spectral analysis was performed between the ODP Site 1241δ18O, δ13C, and %CF records. Prior to spectral analysis, all records wereinterpolated to an even 2-kyr time step from 1 to 2100 kyr. Cross-spectral analysis was performed using the Arand software package(Howell et al., 2006) which uses the Blackman–Tukey technique.Iterative cross-spectral analysis was performed on the %CF andisotope records using a window of 400 kyr moving in 200 kyr steps.
3. Results
3.1. Stable isotope stratigraphy and age model of ODP Site 1241
The new oxygen isotope record indicates that the top 45 m of siteODP Site 1241 extends from the late Holocene to marine isotope stage(MIS) 80 at 44.91 cmcd (~2125 kyr) (Fig. 3). The sampling resolutionof the record is ~2.1 kyr in the top 7.12 cmcd and is ~5.2 kyr from 7.12to 44.91 cmcd. Sedimentation rates remain relatively constantthroughout the core, varying between ~1.7 cm/kyr and ~2.6 cm/kyr.The average sedimentation rate for the entire sequence is ~2.1 cm/kyr. In the youngest 300–400 kyr of the record sedimentation ratesincrease slightly to ~2.8 cm/kyr. The average peak-to-peak δ18Oamplitude of interglacial-to-glacial cycles is 1.6‰ in the youngest400 kyr of the record, decreasing to just less than 1‰ in the oldest500 kyr of the record. On average δ18O values between 2.1 and 1 Maare 0.3‰ more negative than those in the most recent half of therecord. Visually inspecting the overlapping isotopic measurementsbetween tie points allowed for graphical manipulation of the depthscale in order to generate a better correlation (corrected tie pointslisted in Table 1), as well as identification of missing sediment from
tom) on the new time scale based on visual alignment to the Lisiecki and Raymo (2005)ord.

Fig. 3. ODP Site 1241 (5°50.57′N, 86°26.676′W) benthic Uvigerina auberiana δ18O record (bottom), δ13C record (center), and percent coarse fraction record (%CF) (top) in the depthdomain. Depth is on the correctedmeters composite scale (cmcd). Sampling resolution is 5 cm intervals in the top ~7.12 cmcd and 10 cm thereafter, with inferred core gap indicated.Squares on the %CF record indicate ash/lapilli layers (Table 2).
44 J.J. Lalicata, D.W. Lea / Marine Micropaleontology 79 (2011) 41–51
the record. MIS 73, representing roughly ~47 kyr of sedimentation, ismissing in the composite core (Fig. 4).
The carbon isotope record from ODP Site 1241 is also similar tobenchmark records fromthe region (Fig. 5) (Mixet al., 1995a, b). Themostnegativevalues,−1.4‰, occurbetween860and950 kyr (MIS21–25). The
Table 1Revised splice tie points, Site 1241.
Hole, core, section, interval (cm) Depth
(mbsf) (mcd) (cmcd) Age (kyr)
1241B-1H5W, 25 6.25 6.25 5.53 297.6 Tie to1241 C-2H6W, 75 40.25 44.52 39.4 1898.63 Tie to
mbsf = meters below sea floor. mcd = meters composite depth. cmcd = corrected meters
Fig. 4. ODP Site 1241 (5°50.57′N, 86°26.676′W) benthic foraminiferal Uvigerina auberiana δ1
(2005) benthic foraminiferal δ18O stack. Phase analyses on the records indicate that δ18O anthe orbital frequencies. Squares on the %CF record indicate ash/lapilli layers (Table 2).
most positive values,−0.3‰, occur between 450 and 550 kyr in MIS 13–15. The δ13C and δ18O records show significant coherence at the majororbital frequencies of 100, 41, and 23 kyr and are in phase throughout thecore (Table 3). Core data is available in Appendix A of Lalicata (2009) andwill be archived at the NOAA/WDC Paleoclimatology archive.
Hole, core, section, interval (cm) Depth
(mbsf) (mcd) (cmcd) Age (kyr)
1241A-2H1W, 123 5.13 6.25 5.53 297.61241B-5H3W, 72 39.12 44.52 39.4 1898.63
composite depth.
8O, δ13C, and %CF records on an age scale based on alignment to the Lisiecki and Raymod δ13C are in phase. Preservation maxima (high %CF) lag glacial maxima by 9–22 kyr on

Fig. 5. ODP Site 1241 (5°50.57′N, 86°26.676′W) Uvigerina auberiana δ13C record (bottom), compared with Cibicides wuellerstorfi δ13C records from EEP sites ODP 846 (center)(3°5.7′S, 90°49.1′W) (Mix et al., 1995a) and ODP 849 (top) (0°11′N, 11–°31.1′W) (Mix et al., 1995b). Sample resolution for ODP Site 1241, ODP 846, and ODP 849 is 10 cm.Comparison of the records shows that ODP Site 1241 is in agreement with other benchmark records and is, on average, more negative due to species specific offsets between U.auberiana and C. wuellerstorfi (Shackleton and Hall, 1984).
45J.J. Lalicata, D.W. Lea / Marine Micropaleontology 79 (2011) 41–51
3.2. CaCO3 dissolution data
The %CF and % shell fragmentation records display a strongcorrespondence, with a cross correlation r=0.78 (Fig. 6). Percentfragmentation values range from a maximum of 20% at 89.5 kyr toa minimum of 4.8% at 63.3 kyr. At the core top, values for % shellfragmentation and %CF are 19.4% and 10.4%, respectively. The core topvalues indicate a sharp increase in dissolution from the preservationmaximum at ~14 kyr and ~19 kyr, where % shell fragmentation is 6% and%CF is 28.7% respectively.
The %CF record displays a cyclicity that is somewhat similar to theδ18O record, with higher frequency cycles superimposed on longer100 kyr cycles (Fig. 4). Between 2100 and 1300 kyr the %CF valuesremain relatively constant. Between 1300 and 1100 kyr %CF valuesbegin to fluctuate with larger amplitudes. The average value for %CF is6% between 2100 and 1100 kyr, increasing to 11% between 1100 and0 kyr. Values fluctuate from maxima of 20–24% to minima of 2–3%between 200 and 0 kyr. From 1100 to 800 kyr, %CF maxima are above20%,with the highest value in the record (~30%) occurring at 1118 kyr.From700 to 400 kyr, %CFmaxima are lower anddonot exceed 15–17%.
Fig. 6. ODP Site 1241 (5°50.57′N, 86°26.676′W) %CF record compared with shell fragmendissolution is the dominant influence on the %CF record. The correlation between the two d
Cross-spectral analysis was performed between the %CF, δ18O, andδ13C records (Table 3). The %CF record lags the δ18O and δ13C records.Cross correlationbetween the%CF recordand δ18Ohas r-values averaging0.81 between 1 and 950 kyr and 0.7 between 950 and 1800 kyr. Between1and950 kyr, the%CF and δ18O records showsignificant coherence at the95% confidence interval for the 100 and 41 kyr orbital periods and 80%confidence interval for the 23 kyr orbital period, with preservationmaxima lagging ice volumemaxima by 8.9±2.5 kyr at the 23 and 41 kyrorbital frequency and14.4±3 kyr at the 100 kyr frequency. Between950and 1800 kyr the %CF and δ18O records show significant coherence atthe 95% confidence interval for the 41 and 23 kyr orbital periods,with preservationmaxima lagging ice volumemaxima by 14.1±2.6 and10.6±1.7 kyr at the 41 and 23 kyr orbital periods, respectively. Overallcross correlationbetween%CFand δ18O forODPSite1241 is r=0.64,withan overall lag of 12 kyr for %CF to achieve maximum correlation.Correlation between the %CF record and δ13C record averages r=0.79between1and950 kyr and r=0.5between950and1800 kyr. Between1and 950 kyr, the %CF and δ13C records show significant coherencies at the100 and 41 kyr orbital periods, with preservation maxima lagging δ13Cmaxima by 19±5.6 kyr and 9.3±3 kyr respectively. Between 950 and
tation record. Visual inspection of the relationship between the two records suggestsata series is r=0.78.
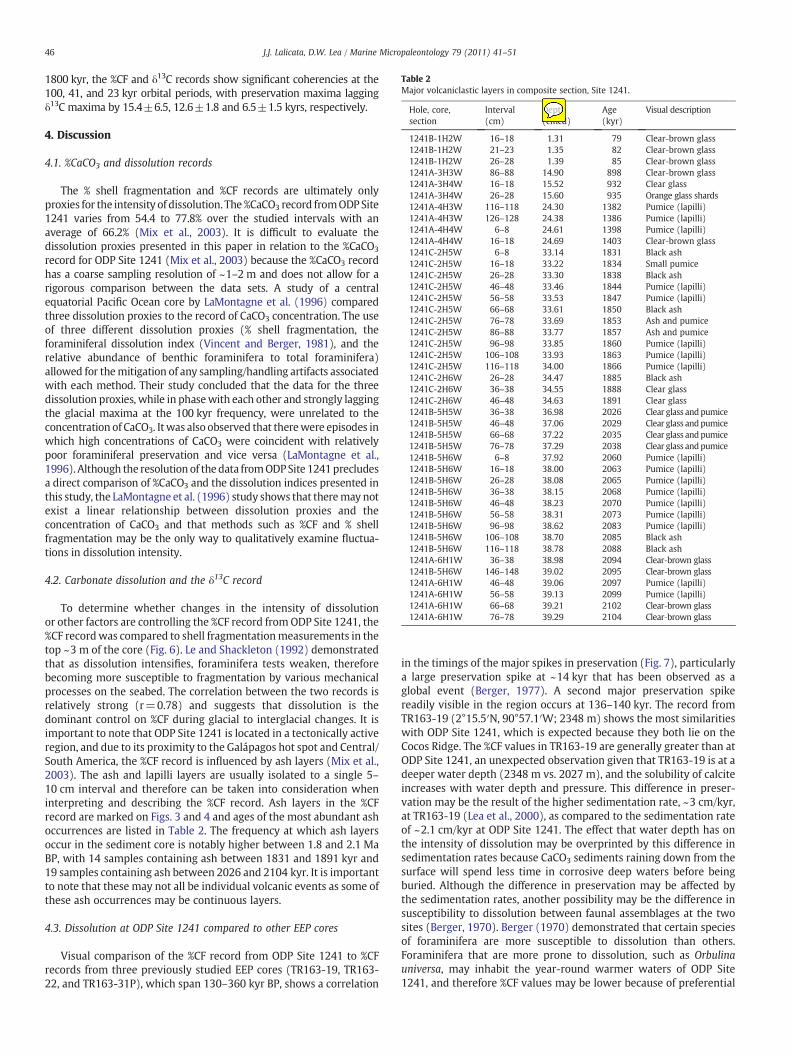
Table 2Major volcaniclastic layers in composite section, Site 1241.
Hole, core,section
Interval(cm)
Depth(cmcd)
Age(kyr)
Visual description
1241B-1H2W 16–18 1.31 79 Clear‐brown glass1241B-1H2W 21–23 1.35 82 Clear‐brown glass1241B-1H2W 26–28 1.39 85 Clear‐brown glass1241A-3H3W 86–88 14.90 898 Clear‐brown glass1241A-3H4W 16–18 15.52 932 Clear glass1241A-3H4W 26–28 15.60 935 Orange glass shards1241A-4H3W 116–118 24.30 1382 Pumice (lapilli)1241A-4H3W 126–128 24.38 1386 Pumice (lapilli)1241A-4H4W 6–8 24.61 1398 Pumice (lapilli)1241A-4H4W 16–18 24.69 1403 Clear‐brown glass1241C-2H5W 6–8 33.14 1831 Black ash1241C-2H5W 16–18 33.22 1834 Small pumice1241C-2H5W 26–28 33.30 1838 Black ash1241C-2H5W 46–48 33.46 1844 Pumice (lapilli)1241C-2H5W 56–58 33.53 1847 Pumice (lapilli)1241C-2H5W 66–68 33.61 1850 Black ash1241C-2H5W 76–78 33.69 1853 Ash and pumice1241C-2H5W 86–88 33.77 1857 Ash and pumice1241C-2H5W 96–98 33.85 1860 Pumice (lapilli)1241C-2H5W 106–108 33.93 1863 Pumice (lapilli)1241C-2H5W 116–118 34.00 1866 Pumice (lapilli)1241C-2H6W 26–28 34.47 1885 Black ash1241C-2H6W 36–38 34.55 1888 Clear glass1241C-2H6W 46–48 34.63 1891 Clear glass1241B-5H5W 36–38 36.98 2026 Clear glass andpumice1241B-5H5W 46–48 37.06 2029 Clear glass andpumice1241B-5H5W 66–68 37.22 2035 Clear glass andpumice1241B-5H5W 76–78 37.29 2038 Clear glass andpumice1241B-5H6W 6–8 37.92 2060 Pumice (lapilli)1241B-5H6W 16–18 38.00 2063 Pumice (lapilli)1241B-5H6W 26–28 38.08 2065 Pumice (lapilli)1241B-5H6W 36–38 38.15 2068 Pumice (lapilli)1241B-5H6W 46–48 38.23 2070 Pumice (lapilli)1241B-5H6W 56–58 38.31 2073 Pumice (lapilli)1241B-5H6W 96–98 38.62 2083 Pumice (lapilli)1241B-5H6W 106–108 38.70 2085 Black ash1241B-5H6W 116–118 38.78 2088 Black ash1241A-6H1W 36–38 38.98 2094 Clear‐brown glass1241B-5H6W 146–148 39.02 2095 Clear‐brown glass1241A-6H1W 46–48 39.06 2097 Pumice (lapilli)1241A-6H1W 56–58 39.13 2099 Pumice (lapilli)1241A-6H1W 66–68 39.21 2102 Clear‐brown glass1241A-6H1W 76–78 39.29 2104 Clear‐brown glass
46 J.J. Lalicata, D.W. Lea / Marine Micropaleontology 79 (2011) 41–51
1800 kyr, the %CF and δ13C records show significant coherencies at the100, 41, and 23 kyr orbital periods, with preservation maxima laggingδ13C maxima by 15.4±6.5, 12.6±1.8 and 6.5±1.5 kyrs, respectively.
4. Discussion
4.1. %CaCO3 and dissolution records
The % shell fragmentation and %CF records are ultimately onlyproxies for the intensity of dissolution. The%CaCO3 record fromODPSite1241 varies from 54.4 to 77.8% over the studied intervals with anaverage of 66.2% (Mix et al., 2003). It is difficult to evaluate thedissolution proxies presented in this paper in relation to the %CaCO3
record for ODP Site 1241 (Mix et al., 2003) because the %CaCO3 recordhas a coarse sampling resolution of ~1–2 m and does not allow for arigorous comparison between the data sets. A study of a centralequatorial Pacific Ocean core by LaMontagne et al. (1996) comparedthree dissolution proxies to the record of CaCO3 concentration. The useof three different dissolution proxies (% shell fragmentation, theforaminiferal dissolution index (Vincent and Berger, 1981), and therelative abundance of benthic foraminifera to total foraminifera)allowed for themitigation of any sampling/handling artifacts associatedwith each method. Their study concluded that the data for the threedissolution proxies, while in phasewith each other and strongly laggingthe glacial maxima at the 100 kyr frequency, were unrelated to theconcentration of CaCO3. Itwas also observed that therewere episodes inwhich high concentrations of CaCO3 were coincident with relativelypoor foraminiferal preservation and vice versa (LaMontagne et al.,1996). Although the resolution of thedata fromODPSite 1241precludesa direct comparison of %CaCO3 and the dissolution indices presented inthis study, the LaMontagne et al. (1996) study shows that theremay notexist a linear relationship between dissolution proxies and theconcentration of CaCO3 and that methods such as %CF and % shellfragmentation may be the only way to qualitatively examine fluctua-tions in dissolution intensity.
4.2. Carbonate dissolution and the δ13C record
To determine whether changes in the intensity of dissolutionor other factors are controlling the %CF record from ODP Site 1241, the%CF recordwas compared to shell fragmentationmeasurements in thetop ~3 m of the core (Fig. 6). Le and Shackleton (1992) demonstratedthat as dissolution intensifies, foraminifera tests weaken, thereforebecoming more susceptible to fragmentation by various mechanicalprocesses on the seabed. The correlation between the two records isrelatively strong (r=0.78) and suggests that dissolution is thedominant control on %CF during glacial to interglacial changes. It isimportant to note that ODP Site 1241 is located in a tectonically activeregion, and due to its proximity to the Galápagos hot spot and Central/South America, the %CF record is influenced by ash layers (Mix et al.,2003). The ash and lapilli layers are usually isolated to a single 5–10 cm interval and therefore can be taken into consideration wheninterpreting and describing the %CF record. Ash layers in the %CFrecord are marked on Figs. 3 and 4 and ages of the most abundant ashoccurrences are listed in Table 2. The frequency at which ash layersoccur in the sediment core is notably higher between 1.8 and 2.1 MaBP, with 14 samples containing ash between 1831 and 1891 kyr and19 samples containing ash between 2026 and 2104 kyr. It is importantto note that these may not all be individual volcanic events as some ofthese ash occurrences may be continuous layers.
4.3. Dissolution at ODP Site 1241 compared to other EEP cores
Visual comparison of the %CF record from ODP Site 1241 to %CFrecords from three previously studied EEP cores (TR163-19, TR163-22, and TR163-31P), which span 130–360 kyr BP, shows a correlation
in the timings of the major spikes in preservation (Fig. 7), particularlya large preservation spike at ~14 kyr that has been observed as aglobal event (Berger, 1977). A second major preservation spikereadily visible in the region occurs at 136–140 kyr. The record fromTR163-19 (2°15.5′N, 90°57.1′W; 2348 m) shows the most similaritieswith ODP Site 1241, which is expected because they both lie on theCocos Ridge. The %CF values in TR163-19 are generally greater than atODP Site 1241, an unexpected observation given that TR163-19 is at adeeper water depth (2348 m vs. 2027 m), and the solubility of calciteincreases with water depth and pressure. This difference in preser-vation may be the result of the higher sedimentation rate, ~3 cm/kyr,at TR163-19 (Lea et al., 2000), as compared to the sedimentation rateof ~2.1 cm/kyr at ODP Site 1241. The effect that water depth has onthe intensity of dissolution may be overprinted by this difference insedimentation rates because CaCO3 sediments raining down from thesurface will spend less time in corrosive deep waters before beingburied. Although the difference in preservation may be affected bythe sedimentation rates, another possibility may be the difference insusceptibility to dissolution between faunal assemblages at the twosites (Berger, 1970). Berger (1970) demonstrated that certain speciesof foraminifera are more susceptible to dissolution than others.Foraminifera that are more prone to dissolution, such as Orbulinauniversa, may inhabit the year-round warmer waters of ODP Site1241, and therefore %CF values may be lower because of preferential

Fig. 7. %CF records from available EEP cores (all axes on the same scale): ODP Site 1241 (5°50.57′N, 86°26.676′W; 2027 m) (bottom), TR163-19 (2°15.5′N, 90°57.1′W; 2348 m)(bottom center) (Lea et al., 2002), TR163-22 (0°30.9′N, 92°23.9′W; 2830 m) (Lea et al., 2006), and TR163-31P (3°35′S, 83°57′W; 3205 m) (Martin et al., 2002). Visual agreementbetween three of the cores indicates the presence of a regional dissolution signal. All records show a preservation spike at ~14 and ~130 kyr. The record from TR163-31P does notcorrelate as well due to input from terrigenous material.
47J.J. Lalicata, D.W. Lea / Marine Micropaleontology 79 (2011) 41–51
dissolution of these species. The %CF record from TR163-22 (0°30.9′N,92°23.9′W; 2830 m) shows similar timings for the dissolutionfluctuations, but the preservation is much poorer at this deeper site(2830 m). Although the average sedimentation rate at TR163-22 is7 cm/kyr, increased calcite solubility due to greater depth (pressure)appears to be the dominant factor influencing preservation. Preser-vation of carbonate sediment at TR163-31P (3°35′S, 83°57′W;3205 m) is comparable to TR163-22, which would be expectedbecause it has a similar sedimentation rate (~7 cm/kyr) and a waterdepth of 3205 m. The %CF record from TR163-31P, which ispunctuated by intervals of anomalously high %CF values, appears tobe the only record that does not show the same general fluctuations in%CF for the top 50 kyr. These high %CF intervals are due to input ofterrigenous matter, and visual inspection of the core materialconfirms the presence of non-CaCO3 sediment (Martin et al., 2002).When these samples are filtered out of the %CF record, there isagreement with the other cores in that maximum preservation(maximum %CF) occurs during glacial to interglacial transitions. Thesimilarities shared between the %CF records from the EEP indicate thata regional dissolution signal is reflected in the records.
An interesting observation in the comparison of the %CF recordsfrom the EEP is that the magnitudes of fluctuations are markedlydifferent between the shallow water cores (TR163-19 and ODP Site1241) and the deeper water cores (TR163-31P and TR163-22). Themodern day lysocline in the Panama Basin, just east of our study site,is estimated to be just below ~2900 m (Thunell et al., 1981), andduring the most intense periods of dissolution most likely nevershoaled above ~2900 m (López-Otálvaro et al., 2008). So althoughdissolution is occurring above the lysocline, this observation wouldseem to rule out the possibility that differences in the magnitudes ofdissolution fluctuations were the result of a shifting lysocline thatcaused greater dissolution in shallower cores than deeper cores. Thesevariations may be the result of productivity changes between glacialand interglacial periods (Adelseck and Anderson, 1978; Archer, 1991;Arrhenius, 1988; Murray et al., 2000), yet studies have disagreed as towhether there have been significant changes in EEP productivity
(Anderson et al., 2008; Luz and Shackleton, 1975; Paytan et al., 1996;Pedersen, 1983). Berger (1973) suggested that intensity of carbonatedissolution was the dominant control on the observed carbonatecycles in deep cores near the lysocline, but that CaCO3 records couldalso be influenced by productivity fluctuations. Based on measure-ments from shallow and deep EEP cores, Adelseck and Anderson(1978) proposed two means in which productivity may affectcarbonate fluctuations: a change in productivity resulting in increaseddeposition and/or a change in the amount of planktonic foraminifersresistant to dissolution.
The suite of cores presented in Fig. 7 represents deeper waters nearthe lysocline and shallower waters in areas of the EEP that are located inthe productive upwelling zone, as well as just slightly north of thosewaters. Since themajor preservation spikes at ~14 and ~136–140 kyr arevisible in all the cores in very different productivity regimes, changesin dissolution intensity are likely a regional control on %CF. In order tomore clearly see the magnitude of the fluctuations throughout the fourcores, %CF values were normalized to between 0 and 1 (Fig. 8). Thenormalizedvalues reveal that the relativefluctuationsdonot appear tobemarkedly different between the shallow- and deep-water cores. Theproductivity factors described by Adelseck and Anderson (1978) mayinfluence these sites, but TR163-19 and ODP Site 1241 may be too farnorth of the productive upwelling zone to be affected by large changes inproductivity. Murray et al. (2000) examined the interrelationshipbetween regional productivity variations and dissolution influences ontheconcentrationof sedimentary carbonate inanorth to south transect ofcores from the central equatorial Pacific Ocean. They show that across alllatitudes studied (4°N–5°S), glacial climatic states generally have greaterexport production, with maxima in export occurring during glacialtransitions. The higher latitude cores record minimal absolute exportchanges during glacial-to-interglacial cycles, whereas at the equatorexport productivity changes dominate. Should the same conditions applyto the EEP, ODP Site 1241, located at 5°N, is at a latitude at whichcarbonate concentration records are dominated by dissolution ratherthan export production (Murray et al., 2000). TR163-19, TR163-22, andTR163-31P are located at 2°N, 0°N, and 3°S respectively, and therefore

Fig. 8. Normalized %CF records from available EEP cores (all axes on the same scale): ODP Site 1241 (5°50.57′N, 86°26.676′W; 2027 m) (bottom), TR163-19 (2°15.5′N, 90°57.1′W;2348 m) (bottom center) (Lea et al., 2000), TR163-22 (0°30.9′N, 92°23.9′W; 2830 m) (Lea et al., 2006), and TR163-31P (3°35′S, 83°57′W; 3205 m) (Martin et al., 2002). Normalizedvalues demonstrate the similar magnitudes of the fluctuations in %CF between the four cores.
48 J.J. Lalicata, D.W. Lea / Marine Micropaleontology 79 (2011) 41–51
may have an overprint of export production on their dissolution proxiesthat could account for some of the difference between the records. This isan important observation that might explain the lack of relationshipbetween the dissolution indices and the concentration of CaCO3.
Fig. 9. Bathymetric variations in %CaCO3 from cores in the central equatorial Pacific(CEP) (Farrell and Prell, 1991) and the %CF record from ODP Site 1241 (5°50.57′N,86°26.676′W). %CaCO3 measurements are contoured with 6 isopleths. The %CF axis isreversed so that up indicates increasing dissolution. During periods of intensifieddissolution the %CaCO3 isopleths shoal indicating less carbonate at shallower depths.The timings of the dissolution fluctuations are similar in both the EEP %CF record andthe CEP record. Some differences occur because of the ash deposits in the ODP Site 1241record, a slight difference in the age models used to stratigraphically align both datasets, and data resolution differences. Figure modified from Farrell and Prell (1991).
4.4. Carbonate dissolution in the equatorial Pacific
Both theODPSite 1241% shell fragmentation and%CF records showamajor dissolution event at the core-top, with values of 19% and 10% forfragmentation and %CF, respectively (Fig. 6). This late Holocenedissolution event has been seen in other cores from the WEP (Le andShackleton, 1992), the central equatorial Pacific (Farrell andPrell, 1991),and the EEP (Lea et al., 2006; Ninkovich and Shackleton, 1975). Thedissolution event has been predicted by models, which attempt toexplain the changes in atmospheric pCO2 during glacial and interglacialtimes (Boyle, 1988;Broecker, 1982;Keir andBerger, 1983). Preservationreaches its maximum at ~14 kyr in the fragmentation record and~24 kyr in the %CF record before the Holocene dissolution pulse.
Comparing the ODP Site 1241%CF record to dissolution records fromsites across the Pacific shows a clear common signal. Farrell and Prell(1991) reconstructed%CaCO3 isopleths froma suite of cores in the centralequatorial Pacific (CEP). The changes in the %CF record from ODP Site1241 have similar timings to the CEP dissolution patterns (Fig. 9). Slightvariations do exist, most likely as a result of differences in the agemodelsused to stratigraphically align each data set, as well as the respectiveresolution of each data set. This correlation between the two differentproxies further supports the hypothesis that %CF is recording a basin-wide dissolution signal. Comparing the %CF record fromODP Site 1241 toa %CF record from western equatorial Pacific site ODP 806B (0°19.1′N,159°21.7′E; 2520 m) (Medina-Elizalde, 2007) also demonstrates thePacific basin-wide fluctuations in preservation (Fig. 10). The timings ofthe fluctuations are similar in both records, with noticeable preservationspikes at 14 and 130 kyr followed by a dissolution event at the core top.Cross-spectral analysis performed on dissolution proxies and δ18O fromthe WEP and EEP indicate that both regions have a similar phase anglebetween dissolution and ice volume signal (Table 3). The magnitude ofthe %CF fluctuations ismuch greater in theWEP,whichmay be the resultof different faunal assemblages inhabiting the relatively warm waters of
the region. By examining the correlation of productivity indicators anddissolution proxies, Yasuda et al. (1993) suggested that productivityvariations in theWEP played a subordinate role to carbonate dissolutionfluctuations, and therefore the reasoning of Adelseck and Anderson(1978) cannot be used to explain the %CF changes in this region.Therefore dissolution patterns in the WEP are likely dominated bychanges in bottom-water carbonate chemistry on glacial-to-interglacialtime scales (Yasuda et al., 1993). Whereas the intensity of dissolutionmight have varied between regions, the synchronous timing of thefluctuations demonstrates that there were basin-wide changes in oceanchemistry occurring at glacial–interglacial transitions.
A number of hypotheses have been proposed to link dissolutionfluctuations to atmospheric pCO2 changes that occurred on glacial-to-

Fig. 10.ODP Site 1241 (5°50.57′N, 86°26.676′W; 2027 m) %CF record (bottom) in stratigraphic alignment with the ODP 806B (0°19.1′N, 159°21.7′E; 2520 m) (top) (Medina-Elizalde,2007). The timings of the major dissolution fluctuations are in phase between the EEP and WEP. Overall cross correlation between the two records is r=0.57.
49J.J. Lalicata, D.W. Lea / Marine Micropaleontology 79 (2011) 41–51
interglacial timescales. Examining the δ18O, δ13C, and %CF records(Fig. 4) fromODPSite 1241 allows for a test of someof thesehypotheses.At ODP Site 1241, δ13C and δ18O are in phase throughout the core(Table 3). During glacial maxima the δ13C record shows the mostisotopically negative values (Fig. 4). Cross-spectral analysis performedon the %CF and the δ18O record show a linear correlation of r=0.66 anda lag of preservation maxima to glacial maxima of 9–14 kyrs over themajor orbital frequencies (Table 3). Preservation spikes occur roughly inthe middle of the deglaciations, and dissolution becomes progressivelystronger throughout the first half of the interglacial (Fig. 4). This isapparent in the record from 0 to 1300 kyr; before ~1300 kyr, theamplitude of the %CF cycles is considerably smaller. The increase in theamplitudeof the%CF recordoccurs during the transition fromthe41-kyrdominated δ18O signal to the 100-kyr dominated δ18O signal. Theimplication is that changes in carbon cycle feedbacks and oceanchemistry that occurred during the mid-Pleistocene transition influ-enced the dissolution signal (Clark et al., 2006; Kohler and Bintanja,2008; Medina-Elizalde and Lea, 2005; Raymo et al., 1997). There are nopublished fragmentation or %CF records from other cores that extendback to ~2.1 Ma, so it is difficult to verify this hypothesis with otherrecords.
Table 3Results of cross-spectral analysis.
Core X,Y 100 kyr 41 k
Phase Coherencya,b Phas
Phase angle (°) kyr Phas
ODP 1241 (0− .9 Ma) δ180, %CF 52±10 14.4±3 0.97 87ODP 1241 (.9−2 Ma) δ180, %CF NA NA NA 127ODP 1241d δ180, δ13C −18±17 −4.9±5 0.92 11ODP 1241 (0− .9 Ma) δ13C, %CF 76±22 19±5.6 0.87 84ODP 1241 (.9−2 Ma) δ13C, %CF 56±24 15.4±6.5 0.86 114ODP 806Be,f δ180, %CF 58±23 16.1±6 0.75 92RC17-177g,h δ180, % Frag 77±123 21.4±4 0.96 85V28-238g,h δ180, % Frag 56±26 15.6±7 0.87 106ERDC-93Pg,h δ180, % Frag 58±19 16.1±5 0.92 128
NA: indicates no confidence.a Coherency reported as r value.b Correlation is significant at the 95% confidence interval.c Correlation is significant at the 80% confidence interval.d 0-1900 kyr time interval.e 0-1400 kyr time interval.f 0-500 kyr time interval.g (Medina-Elizalde, 1992).h (Le and Shackleton, 1992).
The δ13C signal in the Pacific has been interpreted as a record ofchanges in mean ocean carbon (Curry et al., 1988; Mix et al., 1995a,b;Shackleton, 1977). Shackleton (1977) suggested that rapid growth ofthebiosphere duringdeglaciationwould result in extractionof CO2 fromthe atmosphere–ocean system and ultimately cause enhanced carbon-ate preservation. This would be reflected in the δ13C record as a positiveexcursion because isotopically negative CO2was being drawn out of theocean (Shackleton, 1977). The isotopic evidence from ODP Site 1241supports this view in that both the oxygen and carbon isotope signal arein phase and during deglaciations δ13C values become increasinglypositive. The %CF signal also records this effect because extraction of CO2
from the ocean would result in less corrosive waters and enhancedpreservation. Maximum preservation in the record occurs duringdeglaciations, lagging the ice volume and carbon signals by 9–14 kyron theorbital frequencies,most likely as a result of the carbonate systemresponse time (Archer, 1991; Le and Shackleton, 1992).
Although the Shackleton (1977) hypothesis is supported by thedata from ODP Site 1241, the cause of the dissolution fluctuations ismost likely the result of a combination of processes occurring at thetransition from the glacial to interglacial intervals. For example,another model proposed that changes in the exchange of CO2 into and
yr 23 kyr
e Coherencya,b Phase Coherencya
e angle (°) kyr Phase angle (°) kyr
±22 9.7±2 0.87 139±39 8.9±2.5 0.67c
±24 14.1±2.6 0.86 163±27 10.6±1.7 0.82±14 1.3±1.7 0.94 −34±28 −2.2±1.9 0.81b
±26 9.3±3 0.82 NA NA NA±16 12.6±1.8 0.93 98±23 6.5±1.5 0.86±16 10.5±2 0.93 150±18 9.6±1 0.92c
±40 9.7±5 0.68 115±28 7.3±2 0.85±22 12.1±3 0.90 143±17 9.1±1 0.67±41 35.6±11 0.69 133±24 8.5±2 0.88

50 J.J. Lalicata, D.W. Lea / Marine Micropaleontology 79 (2011) 41–51
out of the ocean during glacial to interglacial transitions could becaused by strengthening of the southern overturning circulation dueto a positive feedback that involves the position of the westerly winds(Toggweiler et al., 2006). The data from ODP Site 1241 supports thismodel, with a positive shift in δ13C during deglaciations (indicatingventing of respired CO2) and the related increase in preservation. Boththe terrestrial carbon sink model of Shackleton (1977) and therecently proposed model by Toggweiler et al. (2006) can explain thepatterns of δ13C and preservation in the ODP Site 1241 record,although it remains difficult to separate the two signals in the carbonisotope record.
5. Conclusions
A stable isotope record from ODP Site 1241 indicates that the top45 m represents ~2.1 Ma of continuous sedimentation. A record ofpercentage coarse fraction from ODP Site 1241 demonstrates a basin-widedissolution signal; this record displays similar phase lags relative tooxygen isotopes as is seen for dissolution proxies in the WEP. Thepreservation at ODP Site 1241 is slightly poorer than that of a slightlydeeper Cocos Ridge core, TR163-19, most likely due to differences insedimentation rates. Normalized %CF records from the EEP show similartimings and magnitudes in the major dissolution events betweenshallow- and deep-water cores. A comparison of WEP and EEPdissolution records shows a similar correlation for the timings of theevents, but with a much greater magnitude in the fluctuations of theWEP. Since productivity has not varied much in theWEP (Yasuda et al.,1993), changes in bottom water carbonate saturation state must beresponsible for the observed signal. The %CF record from ODP Site 1241documents one of thefirst dissolution records to extendback to ~2.1 Ma.A remarkable increase in amplitude of the signal occurs at the mid-Pleistocene transition, perhaps related to changes in the global carbonsystem that forced climate froma41-kyr to a 100-kyr dominated climatesystem (Clark et al., 2006; Kohler and Bintanja, 2008; Medina-Elizaldeand Lea, 2005). The dissolution fluctuations and δ13C signal observed atODP Site 1241 are consistent with both the Shackleton (1977) andToggweiler et al. (2006) models that explain changes in the globalcarbon signal. The lag between %CF and the δ13C and ice volume recordsmost likely reflects the response time for the ocean carbonate system.
Acknowledgements
We thank the ODP andODP Leg 202 crew for gathering and providingthe sample material, G. Paradis and H. Berg for stable isotope massspectrometer operation and technical support (UCSB), Jenny King andLeahCarver for assistancewith samplepreparation (UCSB), SarahMedley,Kate Steger, LiLing Hamady and Martin Medina-Elizalde for lab support(UCSB), James Kennett, Susannah Porter, and Jordan Clark for commentson the research (UCSB), and Rick Murray for his constructive reviews ofthemanuscript. Thisworkhas beenpreviously defended andaccepted fora MS degree at the University of California, Santa Barbara under theguidance of Dr. DavidW. Lea. Thismaterial is based uponwork supportedby the National Science Foundation under Grant no. OCE 0602362.
References
Adelseck Jr., C.G., Anderson, T.F., 1978. The late Pleistocene record of productivityfluctuations in the eastern equatorial Pacific Ocean. Geology 6 (7), 388–391.
Anderson, R.F., Fleisher, M.Q., Lao, Y., Winckler, G., 2008. Modern CaCO3 preservation inequatorial Pacific sediments in the context of late-Pleistocene glacial cycles. Mar.Chem. 111, 30–46.
Archer, D., 1991. Equatorial Pacific calcite preservation cycles: production ordissolution? Paleoceanography 6 (5), 561–571.
Arrhenius, G., 1952. Sediment cores from the east Pacific. Reports of the Swedish DeepSea Expedition, 5, pp. 1–202. 1947–1948.
Arrhenius, G., 1988. Rate of production, dissolution and accumulation of biogenic solidsin the ocean. Palaeogeogr. Palaeoclimatol. Palaeoecol. 67 (1–2), 119–146.
Bassinot, F.C., Beaufort, L., Vincent, E., Labeyrie, L., Rostek, F., Muller, P., Quidelleur, X.,Lancelot, Y., 1994. Coarse fraction fluctuations in pelagic carbonate sediments fromthe tropical Indian Ocean: a 1500-kyr record of carbonate dissolution. Paleoceano-graphy 9 (4), 579–600.
Berelson, W.M., Hammond, D.E., Cutter, G.A., 1990. In situ measurements of calciumcarbonate dissolution rates in deep-sea sediments. Geochim. Cosmochim. Acta 54 (11),3013–3020.
Berger, W.H., 1970. Planktonic Foraminifera— selective solution and the lysocline. Mar.Geol. 8 (2), 111–138.
Berger, W.H., 1973. Deep-sea carbonates: Pleistocene dissolution cycles. J. Foramin. Res.3, 187–195.
Berger, W.H., 1977. Deep-sea carbonate and the deglaciation preservation spike inpteropods and foraminifera. Nature 269, 301–304.
Berger, W.H., Johnson, T.C., 1976. Deep-sea carbonates: dissolution and mass wastingon Ontong-Java Plateau. Science 192 (4241), 785–787.
Boyle, E.A., 1988. The role of vertical chemical fractionation in controlling the lateQuaternary atmospheric carbon dioxide. J. Geophys. Res. 93, 701–715.
Broecker, W.S., 1982. Glacial to interglacial changes in ocean chemistry. Prog. Oceanogr.11 (2), 151–197.
Broecker, W.S., Peng, T.H., 1987. The role of CaCO3 compensation in glacial tointerglacial atmospheric CO2 change. Glob. Biogeochem. Cycles 1, 15–19.
Clark, P.U., Archer,D., Pollard,D., Blum, J.D., Rial, J.A., Brovkin, V.,Mix, A.C., Pisias,N.G., Roy,M.,2006. The middle Pleistocene transition: characteristics, mechanisms, and implicationsfor long-term changes in atmospheric pCO2. Quatern. Sci. Rev. 25 (23–24), 3150–3184.
Curry, W.B., Duplessy, J.C., Labeyrie, L., Shackleton, N.J., 1988. Changes in thedistribution of ∂13 C of deep water ∑CO2 between the last glaciation and theHolocene. Paleoceanography 3 (3), 317–341.
Farrell, J.W., Prell, W.L., 1991. Pacific CaCO3 preservation and ∂18O since 4 Ma:paleoceanic and paleoclimatic implications. Paleoceanography 6 (4), 485–498.
Howell, P., Pisias, N., Ballance, J., Baughman, J., Ochs, L., 2006. ARAND Time-SeriesAnalysis Software. Providence, RI.
Karlin, R., Lyle, M., Zahn, R., 1992. Carbonate variations in the Northeast Pacific duringthe Late Quaternary. Paleoceanography 7 (1), 43–61.
Keir, R.S., Berger, W.H., 1983. Atmospheric CO2 content in the last 120, 000 years: thephosphate-extraction model. J. Geophys. Res. 88, 6027–6038.
Kimoto, K., Takaoka, H., Oda, M., Ikehara, M., Matsuoka, H., Okada, M., Oba, T., Taira, A.,2003. Carbonate dissolution and planktonic foraminiferal assemblages observed inthree piston cores collected above the lysocline in the western equatorial Pacific.Mar. Micropaleontol. 47, 227–251.
Kohler, P., Bintanja, R., 2008. The carbon cycle during the Mid Pleistocene Transition:the Southern Ocean Decoupling Hypothesis. Clim. Past 4, 311–332.
Ku, T.L., Oba, T., 1978. Amethod for the quantitative evaluation of carbonate dissolutionin deep-sea sediments and its application to paleoceanographic reconstruction.Quatern. Res. 10, 112–129.
Lalicata, J.J., 2009. Pleistocene carbonate dissolution fluctuations in the easternequatorial Pacific on glacial timescales. Unpublished MS thesis, University ofCalifornia, Santa Barbara, Santa Barbara, 74 pp.
LaMontagne, R.W., Murray, R.W., Wei, K.-Y., Leinen, M., Wang, C.-H., 1996. Decouplingof carbonate preservation, carbonate concentration, and biogenic accumulation: a400 k.y. record from the central equatorial Pacific Ocean. Paleoceanography 11,553–562.
Le, J., Shackleton, N.J., 1992. Carbonate dissolution fluctuations in the westernequatorial Pacific during the late Quaternary. Paleoceanography 7 (1), 21–42.
Lea, D.W., Pak, D.K., Spero, H.J., 2000. Climate impact of late quaternary equatorialpacific sea surface temperature variations. Science 289 (5485), 1719–1724.
Lea, D.W., Martin, P.A., Pak, D.K., Spero, H.J., 2002. Reconstructing a 350 ky history of sealevel using planktonic Mg/Ca and oxygen isotope records from a Cocos Ridge core.Quatern. Sci. Rev. 21 (1–3), 283–293.
Lea, D.W., Pak, D.K., Belanger, C.L., Spero, H.J., Hall, M.A., Shackleton, N.J., 2006.Paleoclimate history of Galapagos surface waters over the last 135, 000 yr. Quatern.Sci. Rev. 25 (11–12), 1152–1167.
Lisiecki, L.E., Lisiecki, P.A., 2002. Application of dynamic programming to the correlation ofpaleoclimate records. Paleoceanography 17 (4), 1049. doi:10.1029/2001PA000733.
Lisiecki, L.E., Raymo, M.E., 2005. A Pliocene–Pleistocene stack of 57 globally distributedbenthic ∂18O records. Paleoceanography 20 (1), PA1003.
López-Otálvaro, G.-E., Flores, J.-A., Sierro, F.J., Cacho, I., 2008. Variations in coccolitho-phorid production in the Eastern Equatorial Pacific at ODP Site 1240 over the lastseven glacial–interglacial cycles. Mar. Micropaleontol. 69 (1), 52–69.
Luz, B., Shackleton, N.J., 1975. CaCO3 solution in the tropical east Pacific during the past130, 000 years. Spec. Publ. Cushman Found. Foramineferal. Res. 13, 4824–4841.
Martin, P.A., Lea, D.W., Rosenthal, Y., Shackleton, N.J., Sarnthein, M., Papenfuss, T., 2002.Quaternary deep sea temperature histories derived from benthic foraminiferal Mg/Ca. Earth Planet. Sci. Lett. 198 (1–2), 193–209.
Matsuoka, H., 1990. A new method to evaluate dissolution of CaCO3 in deep-seasediments. Trans. Proc. Paleontol. Soc. Jpn. 157, 430–434 N.S..
Medina-Elizalde, M., 2007. The Thermal Evolution of the Western Equatorial PacificWarm Pool During the Pleistocene and Late Pliocene Epochs. Unpublished PhDdissertation, University of California, Santa Barbara, Santa Barbara, 167 pp.
Medina-Elizalde, M., Lea, D.W., 2005. The mid-Pleistocene transition in the tropicalPacific. Science 310 (5750), 1009–1012.
Mix, A.C., Le, J., Shackleton, N.J., 1995a. Benthic foraminiferal stable isotope stratigraphyof Site 846: 0–1.8 Ma. Proc. ODP, Sci. Results, 138. Ocean Drilling Program, CollegeStation, TX, pp. 839–854.
Mix, A.C., Pisias, N., Rugh, W., 1995b. Benthic foraminiferal stable isotope record fromSite 849 (0–5 Ma). Proc. ODP, Sci. Results, 138. Ocean Drilling Program, CollegeStation, TX, pp. 371–412.
51J.J. Lalicata, D.W. Lea / Marine Micropaleontology 79 (2011) 41–51
Mix, A.C., Tiedemann, R., Blum, P., Abrantes, F.F., Benway, H., 2003. Site 1241. Proc. ODPInit. Results 202, 1–101.
Moore, T.C., Pisias, N.G., Heath, G.R., 1977. Climate changes and lags in the Pacific carbonatepreservation, sea surface temperature, and global ice volumes. In: Andersen, N.R.,Malahoff, A. (Eds.), The Fate of Fossil Fuel CO2 in the Oceans. Plenum, New York, pp.145–166.
Murray, R.W., Knowlton, C., Leinen, M., Mix, A.C., Polsky, C.H., 2000. Export productionand carbonate dissolution in the central equatorial Pacific Ocean over the past1 Ma. Paleoceanography 15, 570–592.
Ninkovich, D., Shackleton, N.J., 1975. Distribution, stratigraphic position and age of ashlayer “L”, in the Panama Basin region. Earth Planet. Sci. Lett. 27 (1), 20–34.
Paytan, A., Kastner,M., Chavez, F.P., 1996.Glacial to interglacialfluctuations inproductivityin the equatorial Pacific as indicated bymarine barite. Science 274 (5291), 1355–1357.
Pedersen, T.F., 1983. Increased productivity in the eastern equatorial Pacific during thelast glacial maximum (19, 000 to 14, 000 yr B.P). Geology 11 (1), 16–19.
Peterson, L.C., Prell, W.L., 1985. Carbonate dissolution in recent sediments of the easternequatorial Indian Ocean — preservation patterns and carbonate loss above thelysocline. Mar. Geol. 64 (3–4), 259–290.
Pisias, N., 1976. Late Quaternary sediments of the Panama Basin: sedimentation rates,periodicities, and controls of carbonate and opal accumulation. Mem. Geol. Soc. Am.145, 375–392.
Raymo, M.E., Oppo, D.W., Curry, W.B., 1997. The mid-Pleistocene climate transition: adeep sea carbon isotopic perspective. Paleoceanography 12 (4), 546–559.
Reynolds, R.W., Rayner, N.A., Smith, T.M., Stokes, D.C., Wang, W., 2002. An Improved InSitu and Satellite SST Analysis for Climate. J. Climate 15, 1609–1625.
Shackleton, N.J., 1977. Carbon-13 in Uvigerina: tropical rain forest history and theequatorial Pacific carbonate dissolution cycle. In: Andersen, N.R., Malahoff, A.(Eds.), The Fate of Fossil Fuel CO2 in the Oceans. Plenum, New York, pp. 401–427.
Shackleton, N.J., Hall, M.A., 1984. Oxygen and carbon isotope stratigraphy of Deep SeaDrilling Project Hole 552A: Plio-Pleistocene glacial history. Initial Rep. of the DeepSea Drill. Proj. 81, 599–610.
Thompson, P.R., Saito, T., 1974. Pacific Pleistocene sediments: planktonic Foraminiferadissolution cycles and geochronology. Geology 2 (7), 333–335.
Thunell, R.C., Keir, R.S., Honjo, S., 1981. Calcite dissolution—an in situ study in thePanama Basin. Science 212, 659–661.
Toggweiler, J.R., Russell, J.L., Carson, S.R., 2006. Midlatitude westerlies, atmosphericCO2, and climate change during the ice ages. Paleoceanography 21 PA2005.
Vincent, E., Berger, W.H., 1981. Planktonic foraminifera and their use in paleoceano-graphy. In: Emiliani, C. (Ed.), The Sea. : The Oceanic Lithosphere, Volume 7. JohnWiley, New York, pp. 1024–1119.
Volat, J.L., Pastouret, L., Vergnaudgrazzini, C., 1980. Dissolution and carbonatefluctuations in Pleistocene deep-sea cores — a review. Mar. Geol. 34 (1–2), 1–28.
Yasuda, M., Berger, W.H., Wu, G., Burke, S., Schmidt, H., 1993. Foraminifer preservationrecord for the last million years: Site 805, Ontong Java Plateau. Proc. Ocean Drill.Program Sci. Results 130, 491–508.