please do not remove this page - rmit...
TRANSCRIPT
Thank
Citatio
See th
Version
Copyri
Link to
you for do
on:
is record i
n:
ght Statem
o Published
wnloading
in the RMI
ment: ©
d Version:
this docum
IT Researc
ment from
ch Reposit
the RMIT R
ory at:
Research RRepository
PLEASE DO NOT REMOVE THIS PAGE
Herman, A, Orifici, A and Mouritz, A 2011, 'Developments in structural proof testing foraircraft composite components', in Don Love (ed.) Third Asia-Pacific InternationalSymposium on Aerospace Technology (APISAT 2011), Melbourne, Australia, 28 February -3 March 2011, pp. 1-12.
https://researchbank.rmit.edu.au/view/rmit:11242
Published Version
Royal Aeronautical Society, Australia DivisionThis work is licensed under a Creative Commons Attribution 3.0Unported License.

AIAC14 Fourteenth Australian International Aerospace Congress
Developments in Structural Proof Testing for Aircraft Composite Components
A. P. Herman1,*, A. C. Orifici1 and A. P. Mouritz1
1School of Aerospace Mechanical and Manufacturing Engineering, Royal Melbourne Institute of Technology, Melbourne, Victoria, 3000, Australia
Abstract This paper evaluates structural proof testing methods for the detection of manufacturing defects in aircraft composite components. A static proof test method based on compliance and surface strain mapping and a dynamic (vibration) method based on mode shape curvature (MSC) analysis are evaluated for the detection of manufacturing defects. The evaluation of these structural proof methods was performed using finite element analysis to identify the test conditions best suited for damage detection. The finite element modelling was validated by structural proof tests performed on T-joint composite specimens containing the manufacturing defects of large voids, porosity and delaminations. The coupled compliance and surface strain mapping technique was able to detect a delamination crack along the stiffener-skin bond-line or a void within the fillet region when the joint was elastically loaded, but failed to detect porosity at the concentrations which typically occur in defective joints. The MSC technique successfully detected voids, porosity and delaminations in the T-joint excited by elastic stress waves induced by random frequency vibrations. Keywords: Structural proof testing, surface strain mapping, mode shape curvature, composite structures, defects.
Introduction Primary aircraft composite structures must be non-destructively inspected following manufacturing to ensure high standards of mechanical integrity and safety, as manufacturing defects may cause catastrophic failure during service. The aerospace industry is mostly reliant on conventional non-destructive inspection (NDI) methods to detect defects such as porosity and voids in as-manufactured structural components. The NDI methods most often used by the industry, such as ultrasonics and radiography, are slow for the inspection of large or complex structures - up to 50% of manufacturing time and cost of a structure can be tied in the NDI. Another shortcoming of many NDI methods is that they cannot determine whether the structural properties are affected by defects that are inadvertently created during manufacturing. A further problem is that some NDI methods cannot reliably inspect three-dimensional unitised structures; for example the skin-stiffener connection in stiffened panels where voids, porosity or delamination cracks may be present. Structural proof testing is a non-destructive technique with the potential to overcome or minimise many of the short-coming of conventional NDI [1-3]. The objective of proof testing is to reduce the time and cost associated with the quality assurance and certification of as-manufactured components. Proof testing also offers the possibility of detecting damage which cannot be readily identified using NDI in so-called “hard to inspect” regions. Proof testing
* Corresponding author, E-mail address: [email protected] (A.P. Herman) 3rd Asia-Pacific International Symposium on Aerospace Technology
(APISAT 2011)

AIAC14 Fourteenth Australian International Aerospace Congress
often involves applying a static or dynamic load to the structure, and using damage detection devices coupled with displacement and load measurements to assess the structural integrity. Proof testing can be used to detect and assess the severity of defects in a structure under an applied static load by monitoring changes in local stiffness and strain [4]. Changes to the surface strain are monitored using single-surface, non-contact, wide field mapping techniques that measure in-plane or out-of-plane surface deformation and strains. The techniques used include interferometry, shearography and digital image correlation. Although previous studies have successfully used static proof tests to detect large damage in simple structures [3, 5-8], no work has yet been published on the detection of small, passive (no-growth) damage in complex structures such as stiffened composite panels. Dynamic proof test methods are also used to detect damage by changes in stiffness which change the vibration modal properties (natural frequencies, damping coefficients, mode shapes, etc.) of the structure [9, 10]. These changes are then correlated to damage detection, location, characterisation and severity. To date, no work has yet been published that the MSC technique is capable of detecting small damage in complex composite structures [9, 11, 12]. This paper presents a research study to assess the feasibility, methodology and accuracy of two structural proof testing methods for the detection of manufacturing defects in a carbon-epoxy T-stiffened panel. A static proof test method based on coupled compliance and surface strain monitoring and a dynamic (vibration) method based on mode shape curvature (MSC) analysis are assessed using finite element analysis and experimental testing. Both techniques are based on the principle that damage causes a change in structural stiffness/flexibility. A T-stiffened carbon-epoxy joint representative of an aircraft composite structural panel was used as the case study in assessing the capability of the two proof test methods to detect delamination, voids and porosity in the bond-line or fillet regions, which is where most manufacturing defects occur in T-stiffened structures (as shown in Fig. 1).
Skin
T-joint comprised of two L-stiffeners
Central fillet region
Most susceptible areas to defects & damage
Fig. 1: Composite T-joint showing locations where manufacturing defects are likely to occur
Research methodology: proof testing experimentation and finite element analysis
Composite T-joint specimens The evaluation of the structural proof test methods was performed using carbon-epoxy joints with the T-shape shown in Fig. 1. This shape is representative of the skin-stiffener connection in a rib-stiffened composite panel for a aircraft structure. T-joint specimens were manufactured using unidirectional carbon fibre-epoxy prepreg tape (VTM264) stacked in a [90/0/90/0/90]s pattern. Defects were deliberately introduced during manufacturing along the
3rd Asia-Pacific International Symposium on Aerospace Technology (APISAT 2011)

AIAC14 Fourteenth Australian International Aerospace Congress
skin/stiffener bond-line or the central fillet region at the locations indicated in Fig. 2. A region of delamination damage or porosity covered a region extending from the edge of the bond-line to the centre of the skin-stiffener connection at one-side of the joint. The delamination was created by inserting a thin strip of non-stick release film to stop the stiffener from bonding to the skin. The porosity was introduced by adding phenolic microballoons along the bond-line prior to curing. The stiffener and skin was co-cured and bonded (without film adhesive) inside an autoclave at a temperature of 120 °C and pressure of 90 psi for 1 hour. The experimental program was designed to be representative of proof testing scenarios, and in place of extensive experimentation, a numerical finite element (FE) model was validated and employed as a means of extending the analysis significantly.
Delaminationand Porosity
26 mm
201 mm51 mm
74 mm
72 mm
Fig. 2: Artificial damage introduced to T-joint specimen
Static proof testing method T-joints specimens with and without damage were proof tested under static loading conditions. The static test basically involved applying a tensile load to the stiffener at different angle between 0° and 90° (refer Fig. 3). The specimens were tested under a monotonically increasing load at a constant displacement rate of 5 mm/min, and the bulk compliance and surface strains were measured. Specimens were tested with the bond-line damage subjected to a compression (closure) or tensile (opening) condition, as indicated in Fig. 3. The specimens were loaded in the elastic regime, and no damage occurred during testing.
15° to 90°
Load
‘Tension’ load on damage region
15° to 90°
Load
‘Compression’ load on damage region
damage
damage
Fig. 3: Compression and tension loading of T-joint damage region using the static proof test
method 3rd Asia-Pacific International Symposium on Aerospace Technology
(APISAT 2011)

AIAC14 Fourteenth Australian International Aerospace Congress
Dynamic proof testing method The dynamic proof test was performed by inducing mechanical vibrations in the T-joint specimen using a shaker (Fig. 4 – Fig. 5). The shaker transmitted sinusoidal elastic stress waves of random frequencies between 0–10 kHz directly into the skin or stiffener of the joint (Fig. 4). The joint was freely suspended during testing. Scanning laser vibrometry (SLV) was used to measure the vertical displacement of the joint at each modal frequency (MSD). Both the upper and lower surfaces of the T-joint specimens were scanned along two lines on each side.
Test specimen
Shaker
Rubber bands
Rigid excitation attachment wire
Centre scan lineEdge scan line
Damage region
(a)
Test specimen
Shaker
Rubber bands
Rigid excitation attachment wire
Attachment point glued to test piece
Scan linesDamage region
(b) Fig. 4: Arrangement for the dynamic proof load test when the joint is excited by the shaker on
the (a) skin or (b) stiffener. The damaged region and lines along which the SLV was performed are indicated
Scanning Laser Vibrometer
Computer
Test specimen & shaker Fig. 5: Complete experimental setup – test specimen rig, SLV and computer – for the dynamic
proof load test 3rd Asia-Pacific International Symposium on Aerospace Technology
(APISAT 2011)

AIAC14 Fourteenth Australian International Aerospace Congress
Each MSD response measured using the scanning laser vibrometer was normalised against a benchmark (control) response to eliminate variations between nominally identical T-joint specimens. A Matlab® script was applied to all datasets (curve approximation smoothing), which calculated the normalised MSD, MSC, and MSC-difference curves. Finite element analysis Finite element (FE) models were constructed of the T-joint composite specimens with and without defects to numerically analyse the two proof test methods. MSC.Patran was used as the pre- and post-processor, and MD.Nastran as the solver. A number of FE meshes for the T-joint were investigated in order to establish the dependence of the results on the mesh, and a time-efficient and accurate model composed of 40,000 solid hex-elements (approx 155,000 DOFs) was selected. The front and rear faces of the T-joint models were fixed such that the joint was restrained to movement in a 2D plane only; additional boundary conditions within the model are discussed below along side the results. Damage was introduced into two regions of the T-joint model: void and porosity in the fillet region and delamination and porosity in the bond-line (Fig. 6; refer also Fig. 2 for measurement of path length). Voids were modelled in the fillet as deleted elements; porosity was modelled as an arbitrary 20% reduction in element modulus; and delamination was modelled using coincident nodes and gap elements. The method for introducing a void of increasing size into the fillet region is presented in Fig. 7. In order to model porosity and delamination in the skin/stiffener bond-line, an additional resin layer was introduced between the skin and the stiffener. Four levels of porosity and delamination damage were introduced to the skin/stiffener bond-line of the FE model from the smallest length of 5 mm to a maximum length of 70 mm (Fig. 8). The accuracy of the FE model was assessed by comparing the bulk compliance of the defect-free T-joint calculated using the model for different tensile load angles between 0o (vertical load) and 90o (Fig. 3) with the experimentally measured compliance. The agreement between the compliance values for the FE model and experimental test was within 15% for all load angles between 0o and 75o, but at higher angles there was much larger disagreement. The calculated and measured compliance values of defective T-joints were also similar up to a load angle of 75o, above which the agreement was poor. Based on this validation, the FE model appears accurate (within 15%) for all load angles between 0o and about 75o, but at higher angles to model is not reliable for analysing the static proof load test. The FE model for modal shape analysis was also validated by experimental testing [13].
gap elementsFixed in all DOFs
Fixed in all DOFs
Upper surface strain mapDamage region:skin/stiffener bond-line
porosity & delamination
Damage region: central fillet area,porosity & voids
Lower surface strain map Fig. 6: Boundary conditions, damage types and regions, and surface strain path length used
for the FE modelling of the static proof test
3rd Asia-Pacific International Symposium on Aerospace Technology (APISAT 2011)

AIAC14 Fourteenth Australian International Aerospace Congress
0%
20%
40%
60%
80%
100%
Fig. 7: T-joint centre fillet region, introducing progressively larger void damage. The void
region is shaded white inside the fillet.
1. Very small 1/3 length of fillet region, 5 mm2. Small Length of fillet region, 15 mm3. Medium 1/3 length of adhesive layer, 35 mm4. Large 2/3 length of adhesive layer, 70 mm
Resin layer added between panel and stiffener
Fig. 8: Damage regions along bond-line (porosity and delamination)
Results and discussion
Static load proof test The T-joint model was used to numerically assess the detectability of the voids, porosity and delamination cracks. The compliance and surface strains for the defective T-joint specimens were compared to the undamaged T-joint to determine whether the damage can be detected. The FE predictions for the porosity and delaminations were validated by structural tests performed on T-joint specimens containing either of these defects. A number of load conditions - tension, compression, stiffener bending, skin bending - were investigated to determine their effect on enhancing the detection of damage. Figure 8 shows the loads and boundary conditions used in the FE analysis.
3rd Asia-Pacific International Symposium on Aerospace Technology (APISAT 2011)

AIAC14 Fourteenth Australian International Aerospace Congress
Tension Stiffener Bending
Compression Skin Bending
P = 100 N
gap elements
Strain mapped along this line
M = 1000 N.mm
damage region
P = 50 NP = 50 N M = 500 N.mmM = 500 N.mm
Fixed in all DOFs
Fixed from movement in z-direction only
Fixed from movement in z-
direction only
Fixed in all DOFs
Fixed in all DOFs
Fixed in all DOFs
Fixed in all DOFs
Fixed in all DOFs
Fig. 9: Loads and boundary conditions used to analyse the static proof test method
The compliance and surface strain maps calculated for the defective T-joints were normalised to the defect-free joint for each damage and load case. Figures 9 and 10 show the percentage change in surface strain calculated along the joint containing delamination damage or porosity under the different load conditions. In these figures, no change (0%) in surface strain indicates that the strain level is identical in the defective and defect-free joints at the same location, whereas a value of 100% indicates a doubling of the strain in the joint containing the defect. Figures 9 and 10 show that the surface strain maps indicate false detection outside of the damage region, primarily due to the geometric stress/strain concentration at the centre of the T-joint. This type of false detection can be avoided in structural proof testing by applying several load types to the same T-joint (i.e. the location of the stiffener). The skin bending load case provided the most exaggerated indication of the presence of porosity or delamination damage, albeit at the cost of a high sensitivity towards any area of high strain such as the region immediately surrounding the stiffener. The stiffener bending load case produced a similar result, although the ‘sensitivity’ of the surface strain to the stiffener was greatly reduced. Tension and compression loads cases could not detect porosity and were less sensitive to the delamination damage than the two bending load cases. Based on this analysis, the stiffener bending load provides the most obvious indication of damage in the static proof test, and this load condition was applied to all subsequent analysis.
3rd Asia-Pacific International Symposium on Aerospace Technology (APISAT 2011)
AIAC14 Fourteenth Australian International Aerospace Congress
0
200
400
600
800
1000
50 55 60 65 70 75 80 85 90 95 100Path length (mm)
Rel
ativ
e in
crea
se in
stra
in (%
)
Tension Stiffener Bending Skin bending Compression
Damage
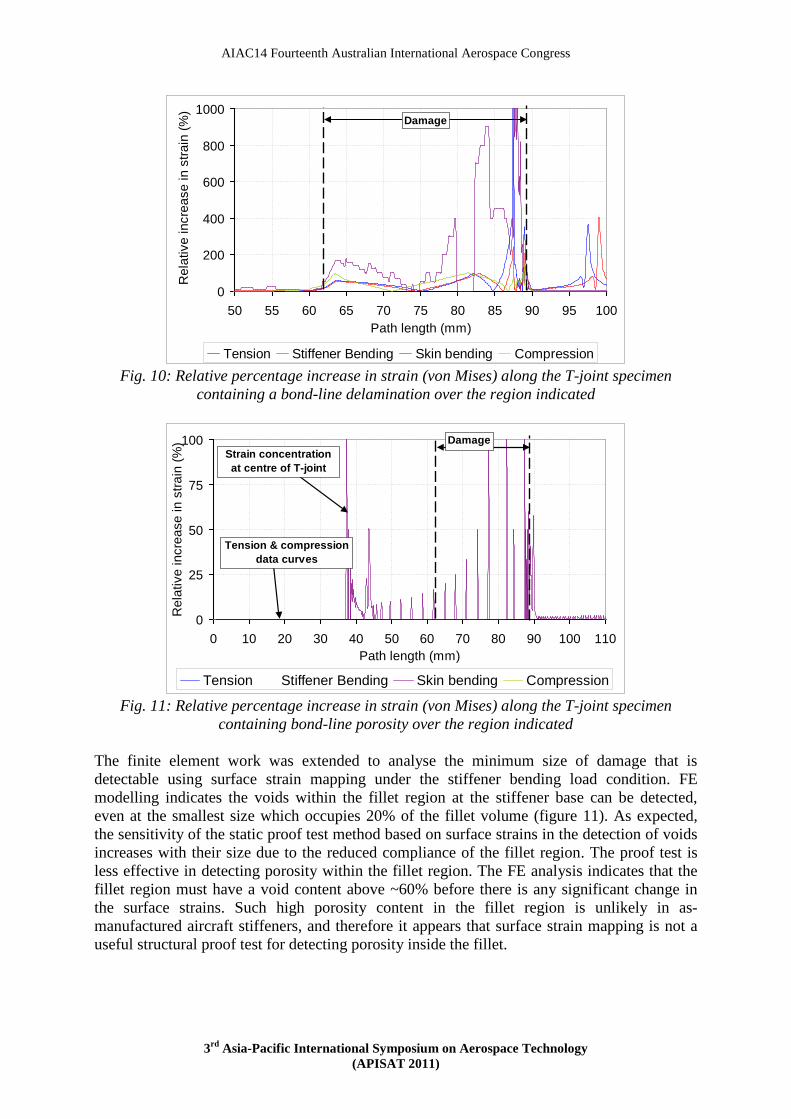
Fig. 10: Relative percentage increase in strain (von Mises) along the T-joint specimen
containing a bond-line delamination over the region indicated
0
25
50
75
100
0 10 20 30 40 50 60 70 80 90 100 110Path length (mm)
Rel
ativ
e in
crea
se in
stra
in (%
)
Tension Stiffener Bending Skin bending Compression
Damage
Tension & compression data curves
Strain concentrationat centre of T-joint
Fig. 11: Relative percentage increase in strain (von Mises) along the T-joint specimen
containing bond-line porosity over the region indicated The finite element work was extended to analyse the minimum size of damage that is detectable using surface strain mapping under the stiffener bending load condition. FE modelling indicates the voids within the fillet region at the stiffener base can be detected, even at the smallest size which occupies 20% of the fillet volume (figure 11). As expected, the sensitivity of the static proof test method based on surface strains in the detection of voids increases with their size due to the reduced compliance of the fillet region. The proof test is less effective in detecting porosity within the fillet region. The FE analysis indicates that the fillet region must have a void content above ~60% before there is any significant change in the surface strains. Such high porosity content in the fillet region is unlikely in as-manufactured aircraft stiffeners, and therefore it appears that surface strain mapping is not a useful structural proof test for detecting porosity inside the fillet.
3rd Asia-Pacific International Symposium on Aerospace Technology (APISAT 2011)

AIAC14 Fourteenth Australian International Aerospace Congress
Lower surface
0
15
30
45
60
75
90
60 65 70 75 80 85 90 95 100Path length (mm)
Rel
ativ
e in
crea
se in
st
rain
(%)
Porosity 20% Porosity 40% Porosity 60%Porosity 80% Porosity 100% Void 20 %
Damage
Fig. 12: Surface strain map, relative percentage increase in strain undamaged-to-damaged
case for different sizes of the void region within the joint fillet FE analysis and experimental testing was performed to determine whether the static proof test method can detect porosity or delamination damage at the joint bond-line. For all the cases of bond-line porosity investigated (refer Fig. 8), the FE analysis suggests that the structural proof test based on strain mapping is incapable of reliability detecting the damage. This was confirmed by experimental tests performed on T-joints containing different concentrations and areas of porosity along the bond-line. Static load proof tests performed on the defective joints at different load angles failed to detect changes in the compliance or surface strains due to porosity at the bond-line. The static load proof test could detect delamination damage along the joint bond-line, even at the smallest size (of 5 mm). The FE analysis predicted a significant change in the compliance or surface strains for all cases of delamination damage that were studied, and this was confirmed by experimental testing. Based on these findings, it appears that the static load proof test based on compliance and surface strains is reliable for the detection of bond-line cracks in stiffened composite panels. Dynamic load proof test Modal analysis is more sensitive to local changes in stiffness than compliance and surface strains. Each structural modal frequency has an associated mode shape displacement (MSD), and although they are not particularly sensitive to local changes in stiffness, their double derivative - the mode shape curvature (MSC) - is sensitive to local stiffness changes. The technique subtracts the MSC signal for a defective structure from the undamaged MSC signal for the defect-free structure, and any difference is indicative of damage. Figure 12 presents MSC difference results measured experimentally for the T-joints containing a bond-line delamination. The point of mechanical excitation to induce vibrational waves in the joint is indicated in the figure, although it was found that the excitation point was not a significant factor in the detection of damage. It was also found that the mode I stress waves gave the strongest indication of damage, with higher wave modes being less sensitive, and therefore all assessment of the MSC technique for dynamic proof testing was performed by analysing changes in the mode I wave responses. The delamination damage over a critical size was clearly detectable by a large rise in the MSC-difference curve. The magnitude of the
3rd Asia-Pacific International Symposium on Aerospace Technology (APISAT 2011)

AIAC14 Fourteenth Australian International Aerospace Congress
MSC-difference response increased with the delamination size, and based on the analysis presented in figure 12 the largest delamination is detected.
Fig. 13: MSC-difference profiles measured along the T-joint containing delamination
damage. The point of excitation by mechanical vibration is indicated as is the region of the joint which is delaminated.
The MSC method was able to detect porosity along the bond-line, but not within the fillet region of the T-joint. Fig. 14 presents an example of an MSC-different result for the T-joint containing porosity along the bond-line or within the fillet region. The porosity within both regions was detectable, albeit with the spike in the MSC profile occurring at the boundary of the porous region rather than being located within the region. It is also important to note that the magnitude of the MSC-difference for porosity is much smaller than delamination damage within the same region of the bond-line. This is expected because porosity would have a smaller effect in reducing the local flexural stiffness (damping capacity) than a delamination. Note that Fig. 14(b) includes the results from Mode 3, which shows that in some cases the first few modes can be more indicative of damage in difficult to inspect regions, rather than relying on Mode 1 alone.
Fig. 14: MSC-difference profiles measured along the T-joint containing porosity (a) at the
bond-line and (b) fillet. The point of excitation by mechanical vibration is indicated as is the region of the joint which is porous
3rd Asia-Pacific International Symposium on Aerospace Technology (APISAT 2011)
AIAC14 Fourteenth Australian International Aerospace Congress
Conclusion The applicability of the coupled compliance and surface strain monitoring and modal analysis in the structural proof testing of composite stiffened panels has been investigated using finite element analysis and experimentation. Porosity, voids and delamination were introduced to an experimentally validated finite element T-joint in the central fillet region and along the skin/stiffener bond-line. The surface strain method can detect delaminations and voids within the fillet region under certain load conditions. The bending load cases provided the highest sensitivity for damage detection, particularly the skin bending condition. Delaminations and voids above a certain size induce changes in local stiffness which are high enough to be detected by strain mapping or bulk compliance measurements in a proof test performed under static elastic loading. This proof test method proved less reliable for the detection of porosity within either the bond-line or fillet regions. Only very high concentrations of porosity spread over a large area could be reliably detected using this procedure, and porosity of this severity is unlikely in composite stiffened panels. The dynamic load proof test method based on modal analysis was able to detect most types of damage reliably, except for small or low concentrations of porosity. However larger damages such as delaminations were reliably detected using this method.
Acknowledgements One of the authors (A.P. Herman) kindly acknowledges the financial support of Boeing Aerostructures Australia. The guidance and assistance of RMIT technical staff P. Tkatchyk and R. Ryan in specimen preparation and experimentation is also gratefully acknowledged.
References 1. Harris, B., Assessment of structural integrity of composites by non destructive methods,
Practical considerations of design, fabrication and tests for composite materials. AGARD: Advisory Group for Aeronautical Research and Development, AGARD lecture series n.124; Accession number: ADD436676 1982.
2. McGonnagel, W.J., International Advances in Nondestructive Testing, Vol. 9, 1983, New York, Gordon and Breach, Science Publishers, Inc., 369.
3. Silk, M.G., A.M. Marshall, and J.A.G. Temple, The Reliability of Non-Destructive Inspection: Assessing the Assessment of Structures Under Stress, 1987, Bristol, Hilger.
4. Summerscales, J., Non-Destructive Testing of Fibre-Reinforced Plastics Composites, 1990, New York, Elsevier Applied Science.
5. Shull, P.J., Nondestructive Evaluation: Theory, Techniques, and Applications. Mechanical Engineering Series of Reference Books, 2002, New York, Marcel Dekker.
6. Pourmand, M. Airworthiness certification strategy for global hawk HALE. in Aircraft Structural Integrity Program, 2005. Memphis, TN: Unmanned Systems, Northrop Grumman Corporation.
7. Buntin, W.D., “Concept and conduct of proof test of F-111 production aircraft”, Aeronautical Journal, Vol. 76, No., 1971, pp. 587-598.
8. Carlyle, J., “Acoustic emission testing the F-111”, NDT International, Vol. 22, No. 2, 1989, pp. 67-73.
9. Ghoshal, A., A. Chattopadhyay, M.J. Schulz, R. Thornburgh, and K. Waldron, “Experimental investigation of damage detection in composite material structures using a
3rd Asia-Pacific International Symposium on Aerospace Technology (APISAT 2011)

AIAC14 Fourteenth Australian International Aerospace Congress
laser vibrometer and piezoelectric actuators”, Journal of Intelligent Material Systems and Structures, Vol. 14, No. August, 2003, pp. 521-537.
10. Shiryayev, O.V., Improved structural health monitoring using random decrement signatures, Department of mechanical and materials engineering, Wright State University, Dayton, 2008.
11. Kesavan, A., M. Deivasigamani, S. John, and I. Herszberg, “Damage detection in T-joint composite structures”, Composite Structures, Vol. 75, No., 2006, pp. 313-320.
12. Qiao, P., W. Lestari, M.G. Shah, and J. Wang, “Dynamics-based damage detection of composite laminated beams using contact and noncontact measurement systems”, Journal of Composite Materials, Vol. 41, No. 10, 2007, pp. 1217-1252.
13. Herman, A.P., Developments in structural proof testing methodologies for aircraft composite components, PhD Thesis, School of Aerospace, Mechanical & Manufacturing Engineering, Royal Melbourne Institute of Technology, Melbourne, 2010.
3rd Asia-Pacific International Symposium on Aerospace Technology (APISAT 2011)