players guide v3.3.1 - unisim · 5.1 dashboard and market parameters the homepage of the simulation...
TRANSCRIPT


2
Content
Introduction ........................................................................................ 4
1. Basic principles of the simulation game ............................................... 4
2. Operating solution for the simulation game .......................................... 5
3. Knowledge required for the game ....................................................... 6
4. Logging in and the progress of the game ............................................. 7
4.1 Logging in .................................................................................. 7
4.2 Course of a game ........................................................................ 8
5. Application introduction .................................................................... 9
5.1 Dashboard and market parameters ................................................ 9
5.2 Section Market parameters .......................................................... 10
6. Reports ......................................................................................... 10
6.1 Types of reports ......................................................................... 10
6.2 Purchasing reports ...................................................................... 11
6.3 Overview and annotation of reports .............................................. 12
7. Introduction into the company and its funding .................................... 14
7.1 Introduction into the company ...................................................... 14
7.2 Company funding ....................................................................... 15
8. Market and customer segments ........................................................ 16
8.1 Segmentation ............................................................................ 16
8.2 How to find out demand for a product ........................................... 18
9. Product creation ............................................................................. 19
9.1 Product attractiveness ................................................................. 19
9.2 How to choose appropriate target segment and define product parameters ..................................................................................... 20
9.3 How to input and edit products in Products section .......................... 21
10. Creating sales channels .................................................................. 23
10.1 Efficiency of sales channels ........................................................ 23
10.2 Push and pull channels .............................................................. 24
10.3 Direct and Indirect sales channels ............................................... 24
10.4 How to create a sales channel in Sales channels section ................. 25
10.5 How to find out cost of sales channels ......................................... 26

3
10.6 Warehouses ............................................................................. 26
11. Company and product marketing communication ............................... 27
11.1 Company communication ........................................................... 27
11.2 Product communication ............................................................. 28
11.3 Media planning ......................................................................... 28
11.4 How to find out achieved efficiency and cost of communication ....... 30
12. Human resources development ....................................................... 31
12.1 Employees ............................................................................... 32
12.2 Training courses ....................................................................... 32
13. Round evaluation .......................................................................... 33

4
Introduction The main purpose of this simulation is to support trainings and studying due to the possibility to apply theoretical knowledge in a dynamic environment that simulates a real market.
The benefits for the participants from practice are the development of strategic and creative thinking, the opportunity to compare their skills, broaden their views and increase motivation.
Unisim managerial game has an advantage in the possibility to immediately see the consequences of decisions made on a company performance. Players are able to evaluate their managerial and business skills.
This document is designed for players of the Unisim managerial game.
The main goal of this document is to introduce the principles of the simulation game to the players as well as provide information how to reach the goals of this game and how decisions made in each section influence the results of business management.
It, however, does not contain the detailed description of all the steps in individual sections of the simulation as operating the game is very intuitive.
It is advised to complement the reading with practical usage of the simulation, video-tutorials, and lecturer’s commentary.
1. Basic principles of the simulation game The basic principle of this simulation game is competing of individual companies on a defined market. The companies are made of one or more players who can play different roles in the team.
There are various versions of the Unisim simulation game which take place on different markets, e.g. consumer electronics market, tourism market, medical facilities etc.
The goal of the companies is to maximize the parameter that has been determined as the main one. Usually is used EVA, but it can be ROE or sales volume.
The company with the highest score of the determined parameter after finishing the given number of rounds is the winner. It can also be the company which reaches the target score of the determined parameter.

5
The individual companies make their decisions (determine the values of the defined group of parameters) based on information about the market and rival companies that can be obtained by buying reports.
The calculation of consequences of these decisions on the commercial position of each company will be made after every round based on chosen parameters.
Parameters the companies can make decisions about:
• Types of products, their parameters, prices and offered quantities
• Type of communication, media plan, frequency of communication
• Types of business channels, their sales and numbers in regions
• Internal company financing and outsourcing
• Employee rewarding and training
Detailed description of parameters and their influence on the company performance is to be found in individual sections.
2. Operating solution for the simulation game Players equipment
The application is hosted on a remote server and the players as well as instructors use the web interface.
Consequently, every device with a web browser and Internet connection can be used for playing – a laptop, a netbook, and thanks to adaptive graphics also a tablet or even a smartphone.
Each team has to have at least one of these devices. Having more devices is an advantage that enables dealing with more tasks and roles at the same time (e.g. one player edits products while others study reports or edits business channels…)
Number of companies and players
Number of companies in this simulation is not limited. However, the recommended number for maintaining clear arrangement and gaining appropriate feedback is 3 – 8 companies.
Number of players in a team (company) is decided upon by the instructor. The recommended number is 1 - 5 players.

6
Online gaming
The game is developed for playing online. Provided that everyone is connected to the Internet, teams or even team players can be in different places or remote locations.
Online playing is also supported by:
Widget (status window) on the homepage shows logs – all the actions made by individual team players. Thanks to it everyone can see what has been done so far by the team players even without them being in the same place.
Widget on the homepage showing individual team players and their connection status – green dot if the player is logged in, red dot if not.
3. Knowledge required for the game Economic education is advantage, not a condition. Players should, however, know the following terms:
A. Indicators of the company productivity, mainly EVA (main goal of the game) EVA (Economic Value Added) is based on following formula:
• EBIT: Earnings before interest and taxes • t: rate of earnings taxes (e.g. 20 % = 0,2) • C: long-term invested capital • NOPAT: Net Operating Profit After Taxes • WACC: Weighted average cost of capital (e.g. 10 % = 0,1)
B. Marketing mix (4P)
Classic marketing concept including Product, Place, Price and Promotion.
C. Segmentation of customers It is desirable to be aware of the basis, purpose and types of the market segmentation, e.g. segmentation according to the characteristics of customers or segmentation based on the customers’ relation to the product and its use.
D. Types of marketing communication and brand building Significance of brand building. Significance of communication support of sales channels.
E. Types of sales channels and their economy

7
Players should be aware of the business principles of their own (direct) and other (indirect) sales channels. It is also important to distinguish push and pull channels and the implications for their support through the means of marketing communication.
F. Financing the company and capital costs It is desirable to have a knowledge of financial leverage and its use for financing company. Understanding costs for own/other capital.
G. Accounting statements Orientation in basic statements: balance sheet, profit and loss statement, cash flow statement.
4. Logging in and the progress of the game 4.1 Logging in Game is created by the administrator (instructor). Note: administrator can also be a player (team member of a company) if he/she decides so. Logging into the game can be done in two ways:
1. Using an invitation email An invitation email is automatically sent to all players of the game when the game is created. Players just have to click on the link in the invitation email.
Important: The invitation email can go straight to a spam folder. This is due to the fact that it is an automatically generated email. Players who did not receive the invitation email should therefore check their spam folder. Delivery of the invitation email to an email client could take up to a few minutes. Important: First time players can enter a game only after receiving an invitation email, which includes information about their login to the simulation game. 2. Direct login to the Unisim simulation
Player goes to the web page: app.unisim.eu and enters his/her email and password which were included in the invitation email. Note: In case player has already been a part of a game he/she can use their login which was included in the invitation email before the first game. If the player changed their login, the current email and password is required.

8
Fig.1: Login to the game
Note: If a player is invited to more than one game he/she will get to a menu after entering his/her login information. There he/she can choose which game to enter.
Changing user name and password
After logging into a game, players can fill in/change their name and password. That can be achieved by clicking on the name in the right top corner. In the dialog window new name and password can be filled in.
We recommend to change the login and to remember new password so as to avoid looking for the initial login information.
4.2 Course of a game Unisim simulation game has two modes: manual and automatic. The mode is decided upon by an administrator of a game.
In manual mode the game as well as every new round is started by an administrator. The round ends after the time limit is reached. It can be stretched or shortened by the administrator during the round.
In automatic mode the game can be started by the administrator or the fixed date and time of the beginning can be chosen. In this mode the game keeps going on (after the end of a round a new round starts automatically) until the fixed number of rounds is finished or the target value of a certain criteria is met.
Automatic mode is, therefore, suitable for a game without an instructor and for online playing.
Game termination and round termination

9
After the time limit (or after forced termination before the time limit by an administrator) a calculation occurs.
Based on company products attractiveness, their business channels coverage and capacity the number of products sold to individual segments by individual companies is calculated. Subsequently economic outcome of individual companies and their standings is also calculated.
Game ends by:
- Choosing “End the game” – executed by the administrator. In manual mode it is necessary to end the game in this way. In automatic mode this is used to terminate the game before the time limit.
- Achieving the given conditions in automatic mode. These conditions can be the number of rounds or achieving the goal value of the given criteria, e.g. EVA.
5. Application introduction 5.1 Dashboard and market parameters The homepage of the simulation game is called dashboard. Dashboard has two main functions:
a. Offers basic information for orientation in the game:
- operational information: logs, information about co-players, remaining time until the end of a round.
- information about performance: account state, sales numbers, company standings, etc.
Note: details of information about performance are in relevant reports. Dashboard is therefore used only for quick and easy orientation.
b. Is used for entering different sections of a game and for settings the account of the player (changing name and password).
Entering different sections is possible not only from the main page, but also from any other section (left menu remains always the same).

10
Fig. 2: Dashboard (homepage)
5.2 Section Market parameters It is possible to enter this section (as well as other sections) by clicking a button on the left side of the screen.
The purpose of this section is to provide players with information about particular market parameters for given game. The settings can vary in different types and versions of the game. In this section players do not carry out any actions, but can for example find out how high is the cancellation fee for unsold products etc. Particular parameters and their purpose are described in the section.
6. Reports The purpose of reports in Unisim simulation game is to provide players with information about their own company, market, customers, and other companies as well. All the reports can be found in the section of the same name.
6.1 Types of reports There are two types of reports with regards to their availability:
a. Company reports
These reports are available to the company at all times (in each round) free of charge. The reports offer information about player’s own company, i.e.

11
information every company would have without doing e.g. marketing research. They contain information about company’s products, employees or sales channels.
b. Paid reports
To obtain this information a real company would have to order a marketing research. Therefore, these reports representing a marketing research outcome are paid. They contain information about the market as well as competing companies.
The reports can also be divided into:
a. Static
The reports contain the definition of market, segments, and consumers’ preferences which do not change during the individual rounds. Companies do not need to buy these reports repeatedly and can use the ones from the previous rounds.
These reports are: Market survey, Product parameters and priorities, Brands/Destinations, Media, Sales channels types, Head office.
b. Dynamic
Information in these reports are based on individual company’s activities and the progress of the game. They change in each round. These are all the reports with exception of those stated above as static ones. Dynamic reports are marked with the letter D after the name of the report.
Every report can be opened directly in the web browser or can be downloaded into an Excel file. This choice is suitable for players who want to make further calculation and analysis of the data.
Note: Reports can be opened in new tab or new window for better convenience (click the right mouse button on the report and choose an option).
6.2 Purchasing reports Players can buy reports in Purchasing reports section (by clicking on a cart icon). The chosen report is transferred into Purchased reports. This action can be undone if players change their mind, i.e. a report can be deleted from Purchased reports.

12
Important: Purchased reports will be available in next rounds of the game. Reports available in current round of the game contain information about the previous round.
Fig. 3: Reports section
6.3 Overview and annotation of reports
Paid reports
Report Purpose
Market survey It offers information about the population and its structure in regions, segmentation, and the structure of demand
Product parameters and priorities
It enables players to find out how should a product for their chosen segment look like focused on the parameters of the product as well as the importance of the individual parameters according to the segment.
Products overview It brings information about both parameters and reached economics of the individual products. It is a very important source for information about competition as it includes information about competing products as well.
Media It contains information about the efficiency of various types of media on particular segments. It is the highest possible reach achieved for the maximum frequency for the particular type of

13
media. With the information about costs for the particular type of media the players are able to calculate which type of media has the highest efficiency in the chosen segment with regard to the costs.
Marcomm It contains information about the achieved level of:
a. Brand (on a scale 1-10)
b. Awareness of the products (up to 100 %)
With this report company is able to check if its communication or the communication of a product is efficient or at what state is the competition.
Sales channels types
Report offers information about the highest possible efficiency of a given sales channel on a segment. It also contains the costs of the sales channel: commission in case indirect channel, overhead costs including the number of employees in case of company’s own sales (direct) channel. Also the required number of channels for covering the given area is stated.
Sales channels efficiency
Report brings the very important information about the efficiency of the company’s sales channel for the given product and segment.
Sales This report offers information about the number of products sold in particular regions through particular channels and also the attractiveness in chosen segment. That is essential for the players to know if the customers will buy products from their company or from the competition.
Trainings It contains information about the training courses done in individual companies.
Brands/Destinations (according to the type of the game)
It enables players to choose a suitable brand. It states how the brand is perceived – as an innovative one, high-quality one or one of prestige. Price index influences the costs of the given brand (the basic price level of individual parameters is multiplied by the index).
In the case of tourism industry market it contains information needed for choosing a suitable destination.
Performance report It contains all the key economic parameters of all companies, so it is possible to directly compare them.
Company reports include similar basic information as the paid ones, but only about their own company.
There are also following special reports:
Company reports Purpose
Accounting records All decisions and following actions in the simulation game are transferred into real accountant operations which can be found in this report.

14
Head office It contains information about costs connected to the company headquarters operations including required number of employees.
7. Introduction into the company and its funding 7.1 Introduction into the company To get familiar with own company, its structure, costs etc. is logically the first step of a player after the beginning of the simulation game.
At the beginning of a game each company has its own headquarters with a given number of employees and other production costs such as rent or energy fees. This information can be found in the report Headquarters in the section Reports. Thanks to it, players get to know the costs that have to be paid every round for headquarters operations.
New employees are hired by creating and expanding the sales channels. Employees are, therefore, not hired or laid off as such, but only in connection to the expansion or decrease of company’s own sales channels. Personal costs might be managed by sales channel optimization or by changing the wages.
Information about company’s property and capital structure, revenues and costs, are in financial statements in Finance section, Financial statements subsection.
Financial statements in this sections are created according to Czech accounting standards:
• Balance statement • Profit and loss statement • Cash Flow statement
Financial statements are created by Unisim application and are based on implemented company decisions, which are transformed into statements by individual accounting operations. Individual accounting operations are displayed in Accounting operations report.
Note: In some cases accounting operations can be simplified compared to the real accounting practice. Important principles are maintained.

15
Players do not have to create the statements by their own, but have them to understand the connection between the commercial decisions and accounting and basic accounting principles.
Fig. 4: Financial statements
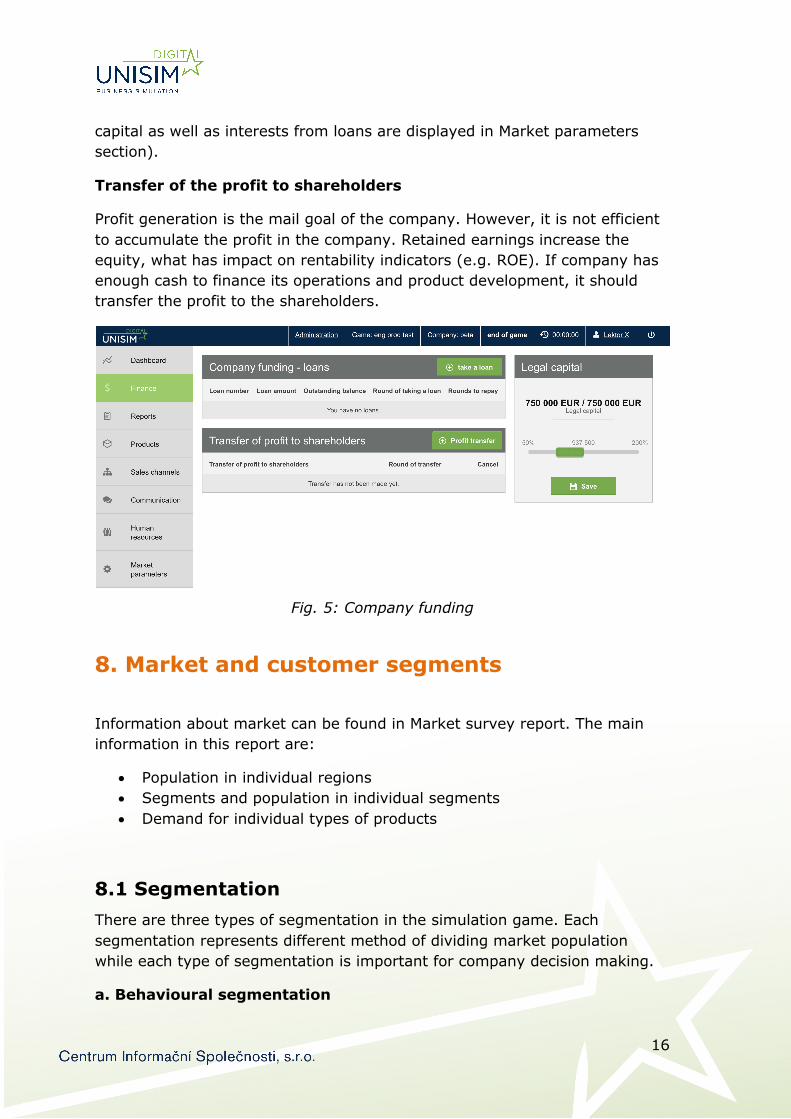
7.2 Company funding In this part of Finance section, the players can obtain additional funding by a loan or by changing company legal capital.
In case of a loan players choose the required amount from the given maximum. The maximum is given for the whole game. Players can take more than one loan, but their total sum cannot be higher than the maximum loan framework (the application will not enable it). The loan has to be paid back within five rounds of the game/years while the early repay is also possible. Players pay interests from the loan which are determined and unchanging for the whole game (the amount of interests for the particular game is displayed in Market parameters section).
The second option to get funding is to increase the legal capital.
Important: In both cases the funding is added to company account in the following round!
The method of funding a company including increase or decrease of legal capital affects the key parameters such as ROE or EVA. By changing the structure of funding the cost of capital (WACC) changes as well, because cost of external capital is lower than cost of own capital (cost on company’s own
16
capital as well as interests from loans are displayed in Market parameters section).
Transfer of the profit to shareholders
Profit generation is the mail goal of the company. However, it is not efficient to accumulate the profit in the company. Retained earnings increase the equity, what has impact on rentability indicators (e.g. ROE). If company has enough cash to finance its operations and product development, it should transfer the profit to the shareholders.
Fig. 5: Company funding
8. Market and customer segments
Information about market can be found in Market survey report. The main information in this report are:
• Population in individual regions • Segments and population in individual segments • Demand for individual types of products
8.1 Segmentation There are three types of segmentation in the simulation game. Each segmentation represents different method of dividing market population while each type of segmentation is important for company decision making.
a. Behavioural segmentation

17
This segmentation determines preferred values of product parameters for given type of consumers.
Segment preferences can be found in the report Product parameters and priorities.
Individual product parameters and their ratings are evaluated by customers on a scale from 1 to 10. The more points, the better rating.
Example: adventure driven customers prefer accommodation in tents to accommodation in hotels (have more points in report).
b. Psychographic segmentation
This segmentation determines the importance of particular product and company parameters for given segments.
Preferences of individual segments can be found in the report Product parameters and priorities.
Each customer has virtual 100% which are used for evaluation. How many % are given to individual parameters by a given psychographic segment can be found in this report.
Example: The most important for Focus on status segment is the company brand, but for Value seekers it is the price.
c. Demographic segmentation
Demographic segmentation helps players with making decision in following fields:
• It enables to determine demand for given product • Efficiency of media is defined according to it and it is used for creating
media mix. • It affects sales channels creating, because various channels have
different efficiency on demographic segments.
It is obvious from Market survey report that there is a correlation between behavioural and demographic segmentations.
Example: The percentage of adventure seeking people is higher in the segment of young people than in the segment of families with kids (full nest).

18
On the contrary there is no correlation between psychographic segmentation and other types of segmentation.
Example: The percentage of young people focused on status is the same as the percentage of families with kids focused on status.
8.2 How to find out demand for a product Demand can be found out in the Demand table in the Market survey report. Existing demand is based on demographic segmentation for individual types of products.
Products need to be created and targeted using behavioural and psychographic segmentation – these two help determine the parameters a product should have.
Data about the appropriate product parameters for selected psychographic and behavioural segments can be found in Product parameters and priorities report. There are, however, no information about appropriate product parameters for demographic segments. It is up to the players to find out demand for their product in Behavioural and Psychographic segments using correlation between Demographic and Behavioural segmentation.
Fig. 6 Table of behavioural segmentation and demand table

19
Example: If you focus on product (Holiday stay) for adventure seeking customers, you will find out in Market survey report that adventure-seeking people make 40 % of Young singles and couples, 5 % of Full nest I, 10% of Full nest II, 20% of Older singles and couples. In Demand chart you will also find out that Holiday stays are demanded by 1000 Young singles, 3000 Full nest I, 2000 Full nest II, 2000 Older singles and couples. Demand for your product (a Holiday stay for adventure seekers) will be 400 within Young singles (40 % from 1000), 150 within Full nest I (5 % from 3000), 200 within Full nest II (10% from 2000), 400 within Older singles and couples (20% from 2000).
Total amount of demand for products for Adventure seekers segment will be 400+150+200+400=1150. That is, however, not all. It is also necessary to find out how many of these customers are focused on status, quality, or value, i.e. psychographic segmentation. There is no correlation here. If the players look for demand for products for value-seeking customers and the percentage of these customers is 50 %, the total count will be a half of demand of all functionality-seeking customers. Total demand for Holiday stay for Adventure seekers focused on value will be 575 units (1150x0,5).
9. Product creation After getting to know their own company, market and its customer segments, players have to create appropriate (sufficiently attractive) product for chosen target segment.
9.1 Product attractiveness Product attractiveness is a parameter potential customers use as a basis for deciding if they buy a product (it has to achieve at least the rating determined in Market parameters section, e.g. 5 points on 10-point scale) and from which company.
Product attractiveness is determined not only by product parameters which are chosen by the players in Product section, but also by company parameters: brand and perceived service quality. Brand is built by company communication, perceived service quality is determined by employees’ quality (human resources management).
Achieved product attractiveness is scalar product of achieved points for individual product and company parameters (see Determination of Product Parameters later) and importance that is put on individual parameters by given segment.

20
Important: achieved value of product attractiveness can be found in Sales report. It is necessary to choose values of all segments, because product attractiveness varies depending on respective customer segments.
9.2 How to choose appropriate target segment and define product parameters Target segment and product type
First of all, choosing target segment means to base the choice on Behavioural segmentation combined with Psychographic segmentation. Only this combination gives all the necessary information for defining appropriate product.
Example: company wants to target its product on potential customers focused on health and status.
One possible option for choosing the type of product and target segment is the size of demand (see section How to find out demand for a Product). Higher demand enables a bigger amount of products to be sold and higher margin to be achieved.
Different approach is to focus on such a type of product and target segment, where there is only small competition and on which competing companies have not yet focused. You can use Product overview report for this during the game where also the competing companies’ products are displayed.
Important: Individual types of products are not competing between each other. That means that if one company offers Holiday stay and second one offers Discover tour, the demand is independent.
Determining product parameters
Choose the appropriate product parameters for your chosen target segment with Product parameters and priority report.
Choose those parameters value which are better rated by your target Behavioural segment.
Not always it is effective to choose the very best rated values of parameters. It is also necessary to consider the cost of the given parameter value. That can be found by filling in product parameters in Products section where the cost will be automatically displayed. In this case the psychographic segmentation is very important – for customers focused on status or quality the price is not an issue and it is, therefore, possible to choose more expensive product parameters’ values. On the contrary, while targeting
21
customers focused on value (value seekers) it is necessary to deal with lower product price and choose less expensive parameters’ values even though they are not the best rated ones.
9.3 How to input and edit products in Products section Parameters chosen according to the instructions above can be input in Products section.
Further, the amount of products and their prices are also to be input in the Products section:
Number of units
Choose the amount of products according to expected demand (see How to Find out the Demand for a Product section). If you choose too low amount, you will miss the opportunity for profit. If you choose too high amount, you will not be able to sell them and you will pay a cancellation fee from the unsold ones (x % from product cost – particular percentage is displayed in Market Parameters section). The maximum amount is limited by your financial means and storage limit (according to the type of the game).
Price
Price has to be selected with regards to:
- price level and margin (markup) has to be appropriate so as to manage direct product costs (displayed directly in Products section while inputting product parameters), but also to manage other company costs such as employee wages, operation (rent, energy prices), cost of communication etc.
- price level should be appropriate with regards to the target segment – not all of them are equally sensitive on prices.
- price/margin cannot be disproportionate to costs. Customers would rate such cases negatively which would lead to low attractiveness of the product. Maximum acceptable % markup for a particular game is displayed in Market parameters section.
Example: 150 % is seen as an acceptable markup (or 60% margin). I.e. if the direct product cost is 1000 EUR, the price should not surpass 2500 EUR.
Note: Margin and markup is different expression of the difference between selling price and cost of the product. % margin is related to the selling price, meanwhile % markup is related to the cost.

22
Fig. 7: Creating a new product
Product costs:
Costs are displayed for players directly while creating a new product in Products section. Costs are determined by chosen product parameters and adjusted accordingly to the changes so that the actual value is displayed at all times.
Note: So called complex product parameters - Destination in Tourism market version and Brands in Consumer Electronics version – are specific parameters. These complex parameters influence costs of other parameters by so called “price indexes” (displayed in Destinations/Brands report).
Example: if the price index of accommodation for a given destination is 2,00, the cost of accommodation in this destination will be two times more expensive than the basic value.
Editing of created products
Once a product has been created it is saved in Products section and stays there for future rounds unless it is deleted by the player. In each new round it is necessary to edit number of units if the company still plans to offer them in the given round. Otherwise the product will not play any role on the market.
It is possible to edit all the other product parameters with exception of type of a product.

23
10. Creating sales channels Creating sales channels or a mix of them is necessary for a company in order to sell successfully on a market. The appropriate settings will influence efficiency of sales as well as company finances.
Players’ goal is to create sales channels efficient enough with regards to planned capacity of sales (see Efficiency of sales channels) and optimized regarding the costs (see Company’s sales channels and others).
10.1 Efficiency of sales channels Particular efficiency of individual sales channels, which can be achieved can be found in Sales channels types report. Efficiency of sales channels is cover of potential customers by a given channel expressed in percentage. Efficiency is defined in each (demographic) segment.
Example: if the efficiency of Sales reps channel is defined as 40 % in young couples segment and 70 % in older singles and couples segment, it means that if you have an ideal number of sales reps (the necessary maximum), you are able to appeal only to 40 % of young people and 70 % of seniors in the given region. If you have just the half of an ideal number of sellers, you will appeal only to 20 % of young people in the given region.
Sales channel sizing
There is a defined number of various types of sales channels needed for complete cover of each region. E-shop is an exception, because only one is needed to cover all the regions. Information about the particular numbers for a given channel can be found in Sales channels types report.
Important: Efficiency of each sales channel is added up. If the efficiency of sales reps in Full nest I segment is 30 % and the efficiency of e-shop is 25 %, total efficiency is 55%.
The goal of a company is not necessarily to achieve 100% efficiency of sales channels, but to achieve efficiency appropriate to the planned sales.
Example: demand in chosen segment is up to 1000 items. Company plans to sell 200 items (for financial reasons). In this case the sufficient total efficiency of sales channels for given segment is 20 %.

24
Important: How to find out really achieved efficiency of sales channels? It is in the report Sales channels efficiency.
10.2 Push and pull channels Pull channels’ characteristics is that for achieving their efficiency it is necessary to have communication support. To manage the channel on its own would be fruitless.
To increase the efficiency of pull channels – or to achieve maximum efficiency (defined in the report Sales channels types) – product communication is used (see Communication section). Achieved efficiency of a pull channel varies in segments as well as products and regions.
Example: if you create an e-shop, it is obvious that no one will visit in on its own if they do not know about its existence, what kind of products are sold there and why should they visit it.
Examples of pull channels: e-shop, store.
Push channels, on the contrary, do not need communication support. The maximum efficiency can be achieved by appropriate sizing.
Examples of push channels: sales reps.
10.3 Direct and Indirect sales channels Direct sales channels are owned by the company. Operating costs are connected with them: rent, energy fees, employees’ wages and expenses.
Particular operating cost of a given sales channel can be found in the report Sales channels types or directly in Sales Channels section.
The advantage is that these costs are not increasing together with sales volume – company’s own sales channels are efficient from a given volume of sold products (this break-even point should be considered by players).
In some cases company’s own sales channels have higher efficiency than indirect channels of the same type – this information can also be found in Sales channels types report.
Indirect (not owned by the company) sales channels are not related with operating costs, but the company has to pay commission - defined

25
percentage from the price of each sold product. The higher the sales are, the higher the total costs for using indirect sales channels can get.
10.4 How to create a sales channel in Sales channels section After you have chosen a mix of sales channels with required efficiency and decided whether to use direct or indirect sales channels, go to Sales channels section. Choose a name of a channel, either direct or indirect, and a number of them that you will use in each region.
Some channels can be only direct or indirect, some offer both versions.
Note: Warehouses are specific channels. These are not meant for selling, but for distributing goods, see below. Warehouses are only in product types of simulation, in service types (e.g. travel agencies) they are not needed and, therefore, are not a part of the game.
Fig. 8: Sales channels
Sales channels editing
Created sales channels remain to be used in following rounds until the players deliberately cancel or adjust them.
Created sales channels can be edited only with regard to their amount. It is not possible to change the category or type of a channel. If players want to change it, they have to delete the current sales channel and create a new one.
26
Example: if player wants to change indirect e-shop for their own, indirect e-shop has to be deleted and their company’s own e-shop has to be created.
10.5 How to find out cost of sales channels Costs for direct sales channels are clearly defined and are not related with the volume of products sold through them. These costs can be easily found in Sales channels types report.
In case of indirect sales channels, it is slightly more difficult. In Sales channels types report you can find percentage from price of products which is used as commission of sales channel and, therefore, from the company’s point of view is seen as cost of sales. Sales report is used for finding out how many products were sold by which sales channel. Using these two information the company can calculate the amount of cost connected to sales through given indirect sales channel. It is also possible to use Accounting operations report where costs paid to indirect sales channels item is included.
Total costs for sales channels are consists of the direct and indirect sales channels.
It is obvious that sales channels costs can remarkably influence financial situation of the whole company. That’s why it is necessary to optimize them during the game. At the early stage it is nearly impossible for a company to create a vast number of its own direct sales channels, so it may be helpful to use indirect ones. However, during the game with increase in sales volume it would not be efficient to keep using only indirect sales channels.
10.6 Warehouses Warehouses are a specific type of sales channels. They are necessary for distributing products. It is not possible to offer these products in the given region without having warehouse there. Together with available funding they form a limitation for number of products which can be offered by the company.
Storage capacity
Each warehouse has a defined capacity – number of storage items. Each type of products has its own capacity requirements. Based on that, it is possible to determine how many items of given product can be stored.
Example: Warehouse has capacity for 1000 items. TV has capacity requirement of 5 units. It is, therefore, possible to store 200 pieces of TV in

27
one warehouse. Washing machine has capacity requirement of 10 units, so a warehouse can be used for 100 washing machines only.
11. Company and product marketing communication Marketing communication has two quite different functions in Unisim simulation game – company communication and product communication. The goal of company communication is to build brand and to get better attractiveness of company’s products for customers, especially those focused on status. The goal of product communication is to support the sales at pull sales channels.
In both types of communication, the key to success is to create efficient media mix. Both types of communication complement each other – company communication supports awareness of products and vice versa.
Fig. 9: Communication
11.1 Company communication Company communication is used to build brand, spread knowledge and increase its rating. That can be anywhere on a scale 0-10 and it is one of the parameters, which influence customers’ decision whether to buy the product or not.
Achieved value of a brand can be found in Marcomm (marketing communication) report.
Important: It is necessary to gradually create and maintain brand or awareness of a product. If players discontinue investing into communication, achieved value will gradually decrease.
28
11.2 Product communication Product communication is primarily used to support sales in pull channels (store, e-shop etc.). Parameters (communication mix) settings are similar to company communication, only, in addition, the players have to choose a particular product to be connected to communication. It is, therefore, necessary to support every product that is to be sold by pull channels. This influences the appearance of the company’s product portfolio. A too wide portfolio can become too expensive to support.
11.3 Media planning The company’s goal is to create an efficient media mix which will let them achieve required reach of the target segment while optimizing the costs.
This procedure is valid for both company communication and product communication.
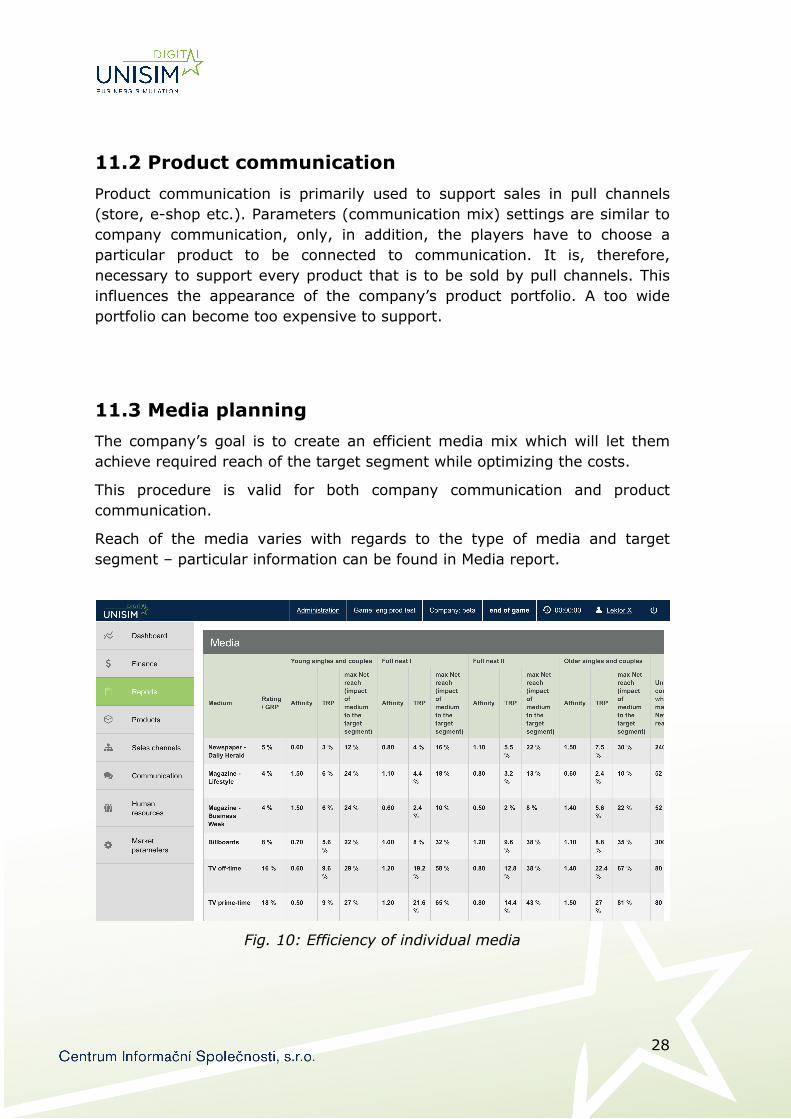
Reach of the media varies with regards to the type of media and target segment – particular information can be found in Media report.
Fig. 10: Efficiency of individual media

29
In this report players find out price per unit and number of units necessary for achieving max Net reach.
Communication unit varies for different media types. For example: unit in print media is advert, in case of TV it is TV spot, in case of PPC it is click etc.
In case of using one unit of communication the reach will correspond to TRP value (TRP value can be found in the report Media, the terms definition is below) and the reach will grow with increasing number of units until it reaches the max Net reach value.
However, this growth in not linear, but it has decreasing pace, see picture 11. In other words, increasing number of units increases the reach, but the growth is slower and slower, until it stops growing completely – when number of units corresponding to max Net reach is reached. Afterwards increasing number of units would be pointless wasting of money.
Fig. 11: Rise of communication efficiency with regards to frequency
Important: Total efficiency of communication (media) mix is a sum of all individual media reaches. If a company wants to achieve e.g. 100 % reach for a given segment, it has to combine several types of media.
Note: Company communication and product communication complement each other. If players will use company communication, it will up to some point influence awareness of products and vice versa.
Definition of media planning terms
Rating/GRP (Gross rating point): number of people (within population), who in defined time watched program, spot or advert. It is defined in % or in thousands.
Example of rating:

30
Population size = 10 M
TV program is watched by: 4 M people
Rating of this program = 40%
TRP (Target rating point):
Percentage of people (out of target segment, not general population) watching the advert.
Affinity:
Is relation between GRP and TRP. Affinity is an index, which describes suitability of the media (e.g. magazine, TV program) for particular target segment. Higher affinity means that the media is more suitable for addressing particular target segment.
Affinity shows how particular target segment follows given media compared to general population (usually all people 15+)
Affinity = TRP/GRP
Net Reach:
Reach defines how many people from our target segment actually saw our advert (or other communication type) at least once. It is stated in % from target group.
Repeating of the advert increases the reach, but because of duplicities the growth is slower and slower until it stops growing completely.
Creating media mix in Communication section.
Once you choose appropriate media mix with required reach using Media report, go to Communication section and choose individual media and allocate the budget on them. Budget should be allocated so that you achieve desired number of units of the respective media.
In case of product communication you also have to choose product on which the communication will focus.
11.4 How to find out achieved efficiency and cost of communication Efficiency of media mix is not displayed directly in the simulation game, only through its influence on target parameters, i.e. brand and product awareness.

31
Achieved values can be found in Marcomm report. The value of brand is shown on a scale 0-10. The value of product awareness can be anywhere between 0 and 100 %.
Building of a brand and product awareness is achieved gradually. Therefore, if you choose media mix with 100 % estimated reach on a target segment, the value of a brand will not be 10 immediately, but the company has to invest in long-term.
Communication (media) mix cost
Media mix cost can be evaluated using Media report. It is preferable to calculate cost for a given media for 1% reach of a target segment and choose efficient media mix according to it.
Example: Newspaper “Daily Herald” can achieve 20% reach on Full nest I segment with price of 500 EUR per unit and 50 units, i.e. 25.000 EUR as cost. That means that cost of 1 % is 1250 EUR. To use TV Nova costs 120.000 EUR (30x per 4000 EUR) and achieves reach of 50 % on Full nest I segment. The cost of 1 % is 2400 EUR. That means that using newspapers is more cost efficient.
Important: It is obvious that to achieve sufficient efficiency of communication (reach), it is necessary to combine several types of media. Moreover, it would be more efficient not to use number of units corresponding to max Net reach.
12. Human resources development The goal of human resources is to improve quality and satisfaction of employees as well as to optimize company’s cost. The higher the quality and satisfaction of employees (expressed by HR index which value can be found in Performance report), the higher the quality perceived by customers which leads to attractiveness of products and to sales.
Important: Achieved efficiency of human resources management can be found in Performance report where the HR index value is shown. That can be anywhere between 1 and 10 and the achieved value influences the attractiveness of product in a form of parameter of perceived quality.
Human resources section has two parts: Employees and Training courses.

32
12.1 Employees In this section, players can edit salary of individual types of employees. Pay rise will lead to higher satisfaction of employees as well as higher HR index, but the salary cost and payments for employees of the given type – whether in the headquarters or in the sales channel - will be higher as well.
Company has to decide if pay rise will be a part of their business strategy. In case that the company targets customers focused on quality, it is necessary to invest into the perceived quality. If the company is, on the other hand, targeting customers focused on prices, also the cost has to be low.
12.2 Training courses In this section players choose training courses for the company employees and number of employees to participate on the training. Maximum number varies based on to whom the training course is intended to – e.g. only managers or sales reps.
Every training course has its own rating – evaluation of contribution to the improvement of qualification. The higher this rating is, the bigger contribution to improving HR index value.
Employees’ education is necessary to build gradually, like a brand. That means that the investment into education are shown as a gradually rising HR index through time. If the investment into education is reduced, the HR index will gradually decrease too.
Fig. 12: Employees and training courses
33
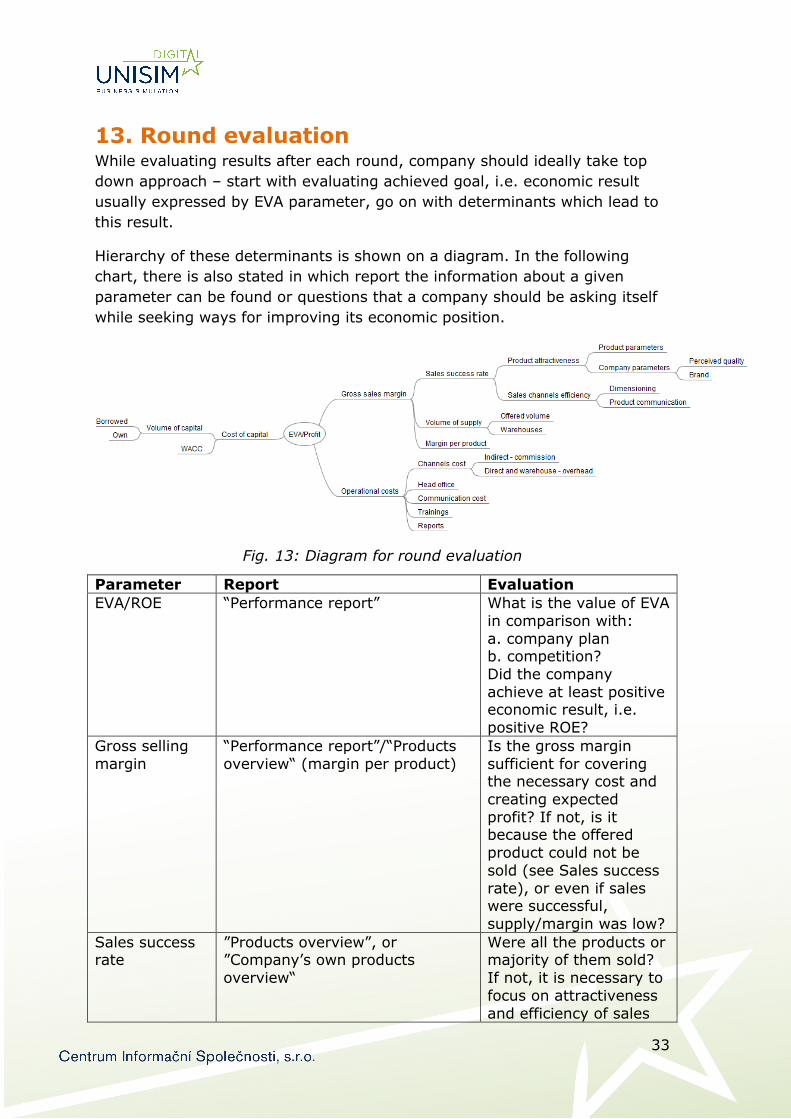
13. Round evaluation While evaluating results after each round, company should ideally take top down approach – start with evaluating achieved goal, i.e. economic result usually expressed by EVA parameter, go on with determinants which lead to this result.
Hierarchy of these determinants is shown on a diagram. In the following chart, there is also stated in which report the information about a given parameter can be found or questions that a company should be asking itself while seeking ways for improving its economic position.
Fig. 13: Diagram for round evaluation
Parameter Report Evaluation EVA/ROE “Performance report” What is the value of EVA
in comparison with: a. company plan b. competition? Did the company achieve at least positive economic result, i.e. positive ROE?
Gross selling margin
“Performance report”/“Products overview“ (margin per product)
Is the gross margin sufficient for covering the necessary cost and creating expected profit? If not, is it because the offered product could not be sold (see Sales success rate), or even if sales were successful, supply/margin was low?
Sales success rate
”Products overview”, or ”Company’s own products overview“
Were all the products or majority of them sold? If not, it is necessary to focus on attractiveness and efficiency of sales

34
channels.
Product attractiveness
“Sales“. Attractiveness varies for each segment, so it is necessary to input value for each segmentation – after that the attractiveness is displayed.
Is attractiveness in given segment above the minimal threshold necessary for sales? (usually 5) Is attractiveness higher than in competing products in given segment? If not, it is necessary to find out if the product has appropriate parameters or if the Brand/Perceived quality parameters are sufficient.
Efficiency of sales channels
“Sales channels efficiency“ Is total efficiency of sales channels sufficient, i.e. cover % enables to sell all the offered products? If not, their number or communication support of pull channels can be the problem.
Volume of supply
“Product Overview“, or “Company’s own products overview“
Is the amount of offered products appropriate to the market/needed gross margin? Is the storage capacity appropriate?
Margin per product
“Product overview“, or “Company’s own products overview“
Is margin higher than the expected one? (see Market parameters report) Is margin too low to achieve sufficient gross margin?
Operating cost of indirect sales channels
Cost of indirect channels are in Accounting operations report
Are the costs for indirect sales channels too high, so that using direct channels would be more efficient? Is the composition of indirect sales channels
35
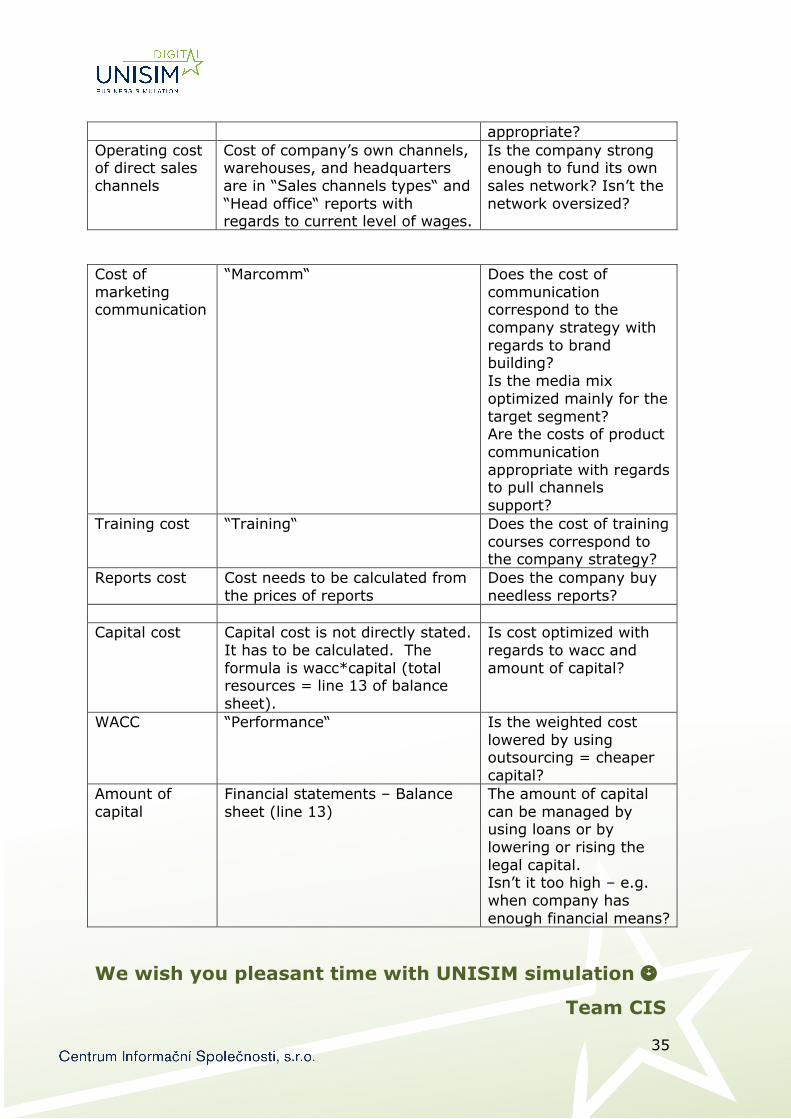
appropriate? Operating cost of direct sales channels
Cost of company’s own channels, warehouses, and headquarters are in “Sales channels types“ and “Head office“ reports with regards to current level of wages.
Is the company strong enough to fund its own sales network? Isn’t the network oversized?
Cost of marketing communication
“Marcomm“ Does the cost of communication correspond to the company strategy with regards to brand building? Is the media mix optimized mainly for the target segment? Are the costs of product communication appropriate with regards to pull channels support?
Training cost “Training“ Does the cost of training courses correspond to the company strategy?
Reports cost Cost needs to be calculated from the prices of reports
Does the company buy needless reports?
Capital cost Capital cost is not directly stated.
It has to be calculated. The formula is wacc*capital (total resources = line 13 of balance sheet).
Is cost optimized with regards to wacc and amount of capital?
WACC “Performance“ Is the weighted cost lowered by using outsourcing = cheaper capital?
Amount of capital
Financial statements – Balance sheet (line 13)
The amount of capital can be managed by using loans or by lowering or rising the legal capital. Isn’t it too high – e.g. when company has enough financial means?
We wish you pleasant time with UNISIM simulation J
Team CIS