platinum and platinum-ruthenium based catalysts on...
TRANSCRIPT
PLATINUM AND PLATINUM-RUTHENIUM BASED CATALYSTS ON VARIOUS CARBON SUPPORTS PREPARED BY DIFFERENT
METHODS FOR PEM FUEL CELL APPLICATIONS
A THESIS SUBMITTED TO THE GRADUATE SCHOOL OF NATURAL AND APPLIED SCIENCES
OF MIDDLE EAST TECHNICAL UNIVERSITY
BY
AYŞE BAYRAKÇEKEN
IN PARTIAL FULFILLMENT OF THE REQUIREMENTS FOR
THE DEGREE OF DOCTOR OF PHILOSOPHY IN
CHEMICAL ENGINEERING
MARCH 2008

Approval of the Thesis
PLATINUM AND PLATINUM-RUTHENIUM BASED CATALYSTS ON VARIOUS CARBON SUPPORTS PREPARED BY DIFFERENT
METHODS FOR PEM FUEL CELL APPLICATIONS submitted by AYŞE BAYRAKÇEKEN in partial fulfillment of the requirements for the degree of Doctor of Philosophy in Chemical Engineering Department, Middle East Technical University by, Prof. Dr. Canan Özgen Dean, Graduate School of Natural and Applied Sciences ________________ Prof. Dr. Gürkan Karakaş Head of Department, Chemical Engineering ________________ Prof. Dr. İnci Eroğlu Supervisor, Chemical Engineering Dept., METU ________________ Prof. Dr. Lemi Türker Co-supervisor, Chemistry Dept., METU ________________ Examining Committee Members: Prof. Dr. Zeynep İlsen Önsan Chemical Engineering Dept., Boğaziçi University _______________ Prof. Dr. İnci Eroğlu Chemical Engineering Dept., METU ________________ Prof. Dr. Deniz Üner Chemical Engineering Dept., METU ________________ Assoc. Prof. Dr. Gülsün Gökağaç Chemistry Dept., METU ________________ Prof. Dr. Can Erkey Chemical and Biological Engineering, Koç University ________________
Date: 17.03.2008

iii
I hereby declare that all information in this document has been obtained and presented in accordance with academic rules and ethical conduct. I also declare that, as required by these rules and conduct, I have fully cited and referenced all material and results that are not original to this work.
Name, Last name: AYŞE BAYRAKÇEKEN
Signature:
iv
ABSTRACT
PLATINUM AND PLATINUM-RUTHENIUM BASED CATALYSTS ON VARIOUS CARBON SUPPORTS PREPARED BY DIFFERENT
METHODS FOR PEM FUEL CELL APPLICATIONS
Bayrakçeken, Ayşe
Ph.D., Department of Chemical Engineering
Supervisor : Prof. Dr. İnci Eroğlu
Co-supervisor : Prof. Dr. Lemi Türker
March 2008, 165 pages
Proton exchange membrane fuel cells are one of the most promising hydrogen
energy conversion devices for portable, mobile and stationary applications. For
wide spread usage to produce electricity platinum loading has to be decreased
by using highly active electrocatalysts. Even 10 ppm carbon monoxide or
higher than 30% carbon dioxide cause performance losses via deactivation
which can be diminished by using binary catalysts. The aim of this thesis is to
develop new platinum based electrocatalysts with high catalytic activity and to
overcome the problems due to the deactivation. platinum and platinum-
ruthenium based catalysts on different carbon supports have been prepared by
supercritical carbon dioxide deposition and microwave irradiation methods.
By using supercritical carbon dioxide deposition platinum on Vulcan XC72R
(VXR), multi wall carbon nanotube (MWCNT) and Black Pearl 2000
(BP2000) catalysts were prepared and characterized by XRD, TEM and cyclic
voltammetry (CV). XRD results showed that in catalysts prepared by using

v
supercritical carbon dioxide deposition method, the particle sizes as low as 1-2
nm can be obtained. From the CV results the electrochemical surface areas
obtained were Platinum/VXR>Platinum/MWCNT>PlatinumBP2000. By
means of the oxygen reduction reaction (ORR), the number of electrons
transferred per oxygen molecule was calculated as 3.5, 3.6 and 3.7 for
Platinum/BP2000, Platinum/VXR and Platinum/MWCNT, respectively.
The microwave irradiation was used to prepare platinum on VX, Regal and
BP2000 and platinum-ruthenium on VX. The effects of microwave duration,
base concentration, carbon support used and surfactant/precursor ratios were
investigated. The particle sizes of the catalysts were ranging between 2-6 nm.
The prepared catalysts were characterized by XRD, XPS, and then PEMFC
tests were performed. The performance was ordered as
Platinum/VX>Platinum/Regal>Platinum/BP2000. The power losses arising
from carbon dioxide in hydrogen feed were decreased by using prepared
platinum-ruthenium based catalysts.
Keywords: PEMFC, Supercritical carbon dioxide, Microwave irradiation,
Electrocatalyst.

vi
ÖZ
PEM YAKIT PİLİ UYGULAMALARI İÇİN ÇEŞİTLİ KARBON DESTEKLER ÜZERİNE PLATİN VE PLATİN-RUTENYUM BAZLI KATALİZÖRLERİN FARKLI YÖNTEMLERLE HAZIRLANMASI
Bayrakçeken, Ayşe
Doktora, Kimya Mühendisliği Bölümü
Tez Yöneticisi : Prof. Dr. İnci Eroğlu
Ortak Tez Yöneticisi : Prof. Dr. Lemi Türker
Mart 2008, 165 sayfa
Proton değişim zarlı yakıt pilleri portatif, hareketli ve sabit uygulamalar için en
uygun alternatif enerji dönüşüm araçları olarak görülmektedir. Yaygın
kullanımları için platin yükü azaltılmalıdır bu da daha aktif katalizörlerin
kullanılmasını gerektirmektedir. Ortamdaki 10 ppm karbon monoksit veya
%30’dan fazla karbon dioksit güç kayıplarına sebep olmaktadır, bu etki ikili
katalizörler kullanılarak azaltılabilir. Bu tezin amacı yeni platin bazlı yüksek
katalitik aktiviteli ve deaktivasyona dayanıklı katalizörler geliştirmektir. Platin
ve platin-rutenyum bazlı katalizörler farklı karbon destekler üzerine süperkritik
karbon dioksit ve mikrodalga ısıtma yöntemleri kullanılarak hazırlanmıştır.
Süperkritik karbondioksit yöntemi kullanılarak platin Vulcan XC72R (VXR),
çok duvarlı karbon nanotüp ve Black Pearl 2000 (BP2000) destekleri üzerine
hazırlanmış ve XRD, TEM ve döner disk elektrot ile karakterize edilmiştir. Bu
yöntemle 1-2 nm boyutunda parçacıklar elde edilmiştir. Elektrokimyasal yüzey
alanları Platin/VXR>Platin/MWCNT>Platin/BP2000 olarak bulunmuştur.

vii
Oksijen indirgenme reaksiyonundan oksijen molekülü başına transfer edilen
electron sayıları Platin/BP2000, Platin/VXR ve Platin/MWCNT katalizörleri
için sırasıyla 3.5, 3.6 ve 3.7 olarak bulunmuştur.
Mikrodalga ısıtma yöntemi kullanılarak platin VX, Regal ve BP2000 ve platin-
rutenyum da VX karbon destekleri üzerine hazırlanmıştır. Mikrodalgada kalma
süreleri, baz konsantrasyonu, farklı karbon destekler ve sürfaktan/metal
sağlayıcı oranlarının etkileri araştırılmıştır. Elde edilen katalizörlerin partikül
boyutlarının 2-6 nm arasında olduğu saptanmıştır. Hazırlanan katalizörler
XRD, XPS ile karakterize edilmiş ve sonra yakıt pilinde denenmiştir.
Katalizörlerin performanslarının Platin/VX>Platin/Regal>Platin/BP2000
olduğu gözlenmiştir. Karbondioksit içeren hidrojen kullanıldığında meydana
gelen güç kayıpları hazırlanan platin-rutenyum bazlı katalizörlerle azaltılmıştır.
Anahtar kelimeler: PEM yakıt pilleri, Süperkritik karbondioksit, Mikrodalga
ısıtma yöntemi, Elektrokatalizörler.

viii
To my family

ix
ACKNOWLEDGMENTS
I would like to express my deepest sincere gratitude to my supervisor Prof. Dr.
İnci Eroğlu for her scientific and academic guidance, suggestions, comments,
encouragement, motivation and help during the course of this research. Also, I
am thankful to her because of her kindly attitude not only related with the
thesis but also in every occasion throughout this study.
Also, I would like to express my greatest appreciation to my co-supervisor
Prof. Dr. Lemi Türker for his interest in my research, his guidance, valuable
suggestions, comments and leading me to think for different aspects.
I also would like to thank Prof. Dr. Can Erkey for giving me opportunity to
conduct my research in the laboratory in University of Connecticut for a while
and for his guidance, help, financial support, suggestions, comments and
encouragement during my stay in USA.
I am also thankful to Dr. Alevtina Smirnova for her guidance during the
rotating disk electorde experiments that I conducted in Connecticut Global Fuel
Cell Center.
The members of the PhD examining committee, Prof. Dr. Deniz Üner and
Assoc. Prof. Dr. Gülsün Gökağaç are gratefully acknowledged for their critical
and constructive comments that help the progress of the thesis.
Prof. Dr. Nurcan Baç is gratefully acknowledged for providing a commercial
fuel cell hardware and his scientific contribution throughout the study.

x
Atatürk University is gratefully acknowledged for providing opportunity to me
to conduct my PhD in METU by OYP program. Especially the Dean of the
Engineering Faculty, Prof. Dr. Şahin Gülaboğlu, is kindly acknowledged for
his academic guidance, encouragement and his valuable suggestions.
My special thanks go to my lab mate Serdar Erkan for sharing his advanced
chemical engineering, computational, electronics knowledge with me, helping
me in all stages of my study and his friendship. I learned many things during
the brain-storming we made in the laboratory.
I am also thankful to the members of METU Fuel Cell Technology and
Biohydrogen Research Groups especially Dr. Ela Eroğlu, Dr. Başar Uyar, Erce
Şengül, Dr. R. Gültekin Akay, Berker Fıçıcılar and Dr. Yılser Devrim and from
other groups Aytaç Kocabaş, Arzu Kanca, Hilal Demir Kıvrak, Mukaddes Can
and Okan Komesli and all my friends for their encouragement and friendship
throughout my study.
I also would like to thank my friends Fatma Geneli, Ayten Koç, Dr. Didem
Sutay, Mihriban Yılmaz Civan for always being with me, their encouragement,
and friendship.
I would like to thank to the technicians in the machine shop of METU
Chemical Engineering Department. METU Central Laboratory is gratefully
acknowledged for the XPS measurements.
I am very grateful to my family for their endless love and support and not
leaving me alone although they were far away from me.
The Scientific and Research Council of Turkey (TUBİTAK) is kindly
acknowledged for the project 104M364. The author is thankful for financial

xi
support by METU Research Fund Projects (BAP-08-11-DPT.2002K120510)
and (BAP-08-11-DPT.2005K120600) project from DPT.

xii
TABLE OF CONTENTS
ABSTRACT .................................................................................................. iv
ÖZ.................................................................................................................. vi
DEDICATION..............................................................................................vii
ACKNOWLEDGMENTS.............................................................................. ix
LIST OF TABLES ....................................................................................... xvi
LIST OF FIGURES.................................................................................... xviii
LIST OF SYMBOLS .................................................................................xxiii
CHAPTER
1. INTRODUCTION ................................................................................... 1
2. PROTON EXCHANGE MEMBRANE FUEL CELLS ........................... 7
2.1 Principles of Proton Exchange Membrane Fuel Cells ................................................7
2.2 PEMFC components...................................................................................................9
2.3 Fuel cell irreversibilities ...........................................................................................13
2.3.1 Activation losses ..............................................................................................16
2.3.2 Fuel crossover and internal currents...............................................................17
2.3.3 Ohmic losses ....................................................................................................17
2.3.4 Mass transport or concentration losses...........................................................18
2.4 Electrocatalysis in Proton Exchange Membrane Fuel Cells .....................................18
2.4.1 Hydrogen oxidation reaction ...........................................................................19
2.4.2 Oxygen reduction reaction...............................................................................20
2.5 Catalyst preparation techniques................................................................................23
2.6 Deactivation of the catalyst by CO and CO2 ............................................................25
2.6.1 The significance of CO and CO2 contents in H2 ..............................................25
2.6.2 CO and CO2 tolerance of the catalysts ............................................................27
xiii
2.6.3 Improvements in CO and CO2 tolerance of the catalysts.................................30
3. METHODS FOR CATALYST PREPARATION IN SUPERCRITICAL
CARBON DIOXIDE ............................................................................ 35
3.1 Supercritical fluid properties ....................................................................................35
3.2 Supercritical carbon dioxide as a green solvent........................................................37
3.3 Utilization of scCO2 in catalyst preparation .............................................................39
4. MICROWAVE IRRADIATION........................................................... 43
4.1 Microwave heating theory........................................................................................43
4.2 Comparison of microwave heating and conventional heating..................................47
4.3 Catalyst preparation by microwave irradiation.........................................................49
5. EXPERIMENTAL STUDIES FOR SUPERCRITICAL CARBON
DIOXIDE DEPOSITION...................................................................... 51
5.1 Catalyst preparation by scCO2 deposition ................................................................52
5.1.1 Materials..........................................................................................................52
5.1.2 Supercritical carbon dioxide deposition setup ................................................52
5.1.3 Experimental procedure ..................................................................................53
5.2 Catalyst Characterization .........................................................................................55
5.2.1 X-ray diffraction .............................................................................................55
5.2.2 Transmission electron microscopy ..................................................................55
5.2.3 Cyclic voltammetry ..........................................................................................56
5.3 Scope of the experiments..........................................................................................57
6. EXPERIMENTAL STUDIES FOR MICROWAVE IRRADIATION..... 59
6.1 Catalyst preparation..................................................................................................60
6.1.1 Materials..........................................................................................................60
6.1.2 Experimental procedure ..................................................................................60
6.2 Catalyst characterization ..........................................................................................62
6.2.1 X-ray diffraction ..............................................................................................62
6.2.2 X-ray photoelectron spectroscopy ...................................................................62
6.3 PEM fuel cell tests....................................................................................................62
6.3.1 Catalyst ink preparation ..................................................................................63
6.3.2 Membrane Electrode Assembly Preparation ...................................................63
6.3.3 Single PEM Fuel Cell Construction ................................................................65
xiv
6.3.4 Fuel Cell Test Station ......................................................................................65
6.4 Scope of the experiments..........................................................................................67
7. RESULTS AND DISCUSSION OF THE CATALYSTS PREPARED BY
SUPERCRITICAL CARBON DIOXIDE DEPOSITION........................ 69
7.1 Adsorption kinetics of Pt and Ru organometallic precursors on different carbon
supports ....................................................................................................................69
7.2 XRD and TEM results ..............................................................................................78
7.3 CV results .................................................................................................................82
8. RESULTS AND DISCUSSION OF THE CATALYSTS PREPARED BY
MICROWAVE IRRADIATION............................................................. 94
8.1 Characterization of the catalysts...............................................................................95
8.1.1 Characterization by XRD ................................................................................95
8.1.2 Characterization by XPS ...............................................................................101
8.2 PEMFC tests...........................................................................................................109
8.2.1 Effect of base concentration on PEMFC performance ..................................109
8.2.2 Effect of microwave duration on PEMFC performance ................................111
8.2.3 Effect of carbon support on PEMFC performance........................................113
8.2.4 Effect of surfactant/Pt precursor ratio on PEMFC performance ..................115
8.2.5 Effect of catalyst properties on PEMFC performance...................................117
8.3 PEMFC operated with CO2 containing H2 ..............................................................118
8.3.1 Effect of N2 on PEMFC performance ............................................................119
8.3.2 Effect of CO2 on PEMFC performance .........................................................120
8.3.3 Effect of 30% CO2 on PEMFC performance when commercial PtRu/C anode
(ETEK) is used................................................................................................122
8.3.4 Effect of 30% CO2 on PEMFC performance when PtRu/VX anode is used ..125
8.4 Comparison of the PEMFC performances of the prepared and commercial Pt and
PtRu based catalysts ...............................................................................................127
9. CONCLUSION AND RECOMMENDATION...................................... 131
REFERENCES ........................................................................................... 136
APPENDICES
A. Sample calculations.......................................................................................................149
A.1 Calculation of particle size......................................................................................149

xv
A.2 Calculation of metal total surface area (SA) ...........................................................150
A.3 Calculation of electrochemical surface area (ESA) ................................................151
A.4 Calculation of Pt utilization.....................................................................................152
A.5 Calculation of Tafel slope........................................................................................153
B. MEA preparation protocol.............................................................................................154
C. Cyclıc voltammetry .......................................................................................................156
D. Fuel cell operating protocol...........................................................................................160
E. Reproducubility .............................................................................................................161
CURRICULUM VITAE........................................................................... 162
xvi
LIST OF TABLES
TABLES
Table 2.1 H2 and CO adsorption enthalpies of some metals ........................... 34
Table 3.1 Physical properties of gas, liquid, and supercritical fluid of typical
organic fluid (order of magnitude)................................................................. 36
Table 3.2 Critical constants of typical molecules used as SCF solvents.......... 37
Table 4.1 Relaxation times (20ºC) and dielectric properties of some organic
solvents ........................................................................................................ 46
Table 5.1 Catalyst preparation conditions and tests performed to the catalysts
prepared by scCO2 ........................................................................................ 58
Table 6.1 Catalysts prepared by microwave irradiation.................................. 67
Table 7.1 Surface area properties of carbon supports used in the experiments
and previous studies ...................................................................................... 70
Table 7.2 Langmuir equilibrium constants for CODPtMe2 on different carbon
supports obtained in scCO2 at 343 K and 24.2 MPa ....................................... 73
Table 7.3 Langmuir equilibrium constants for Ru(COD)(Tmhd)2 on different
carbon supports in scCO2 at 343 K and 24.2 MPa.......................................... 74
Table 7.4 Area covered by Pt or Ru organometallic precursors on different
carbon supports ............................................................................................. 77
Table 7.5 Langmuir equilibrium constants for Ru(COD)(Tmhd)2, scCO2 and
Pt/BP2000, Pt/MWCNT................................................................................ 77
Table 7.6 Electrochemical and total surface areas of the synthesized and
commercial catalysts ..................................................................................... 84
Table 7.7 Electrochemical and total surface areas of the prepared high Pt
loading catalysts ............................................................................................ 88
Table 8.1 Pt/VX (20%) catalyst prepared for different microwave durations.. 96
Table 8.2 Particle sizes calculated for the commercial ETEK and the prepared
catalysts by using XRD patterns .................................................................. 101

xvii
Table 8.3 Results of the fits of the XPS spectra for carbon oxidation states (%)
.................................................................................................................... 106
Table 8.5 Percent power losses of the commercial and prepared PtRu/C
catalysts with 30% CO2 ............................................................................... 112
Table C.1 Potentials for Ag/AgCl reference electrode.................................. 159
xviii
LIST OF FIGURES
FIGURES
Figure 2.1 Operational principle of PEMFCs................................................... 8
Figure 2.2 PEMFC components....................................................................... 9
Figure 2.3 Typical fuel cell polarization curve .............................................. 15
Figure 2.4 Schematic representation for the contact between Pt/C and Nafion in
PEMFCs........................................................................................................ 19
Figure 2.5 Cyclic voltammetric current potential curve for a platinum electrode
in contact with a 0.5 M H2SO4 solution (mercury sulfate reference electrode
was used, MSE) ............................................................................................ 22
Figure 2.6 Global hydrogen production in 1999............................................. 25
Figure 3.1 Schematic pressure–temperature phase diagram for a pure
component showing the supercritical fluid (SCF) region................................ 35
Figure 3.2 Schematic phase diagram for pure CO2 ........................................ 38
Figure 3.3 The scheme of using SCF as processing solvent to synthesize
supported nanoparticles via deposition or impregnation................................. 41
Figure 4.1 Differences in the temperature-time profiles for conventional and
microwave dielectric heating ........................................................................ 47
Figure 5.1 Experimental setup for supercritical deposition............................. 53
Figure 6.1 Schematic representations of (a) Pt and PtRu based catalyst
preparation without surfactant (b) Pt and PtRu based catalyst preparation with
surfactant ...................................................................................................... 61
Figure 6.2 Flow chart for MEA preparation techniques ................................. 64
Figure 6.3 Flow chart for the fuel cell test station ......................................... 66
Figure 7.1 Equilibrium curve for Pt/VXR...................................................... 72
Figure 7.2 Adsorption isotherms of CODPtMe2 , scCO2 on different carbon
supports in scCO2 (lines represents Langmuir (Eqn 7.1) fits for the
corresponding catalysts) ................................................................................ 72

xix
Figure 7.3 Adsorption isotherms for Ru(COD)(Tmhd)2, scCO2 on different... 74
carbon supports at 343 K and 24.2 MPa (lines represents Langmuir (Eqn 7.1)
fits for the corresponding catalysts) ............................................................... 74
Figure 7.4 Uptake of Pt or Ru precursors on carbon supports with different
mesoporous and macroporous surface area .................................................... 75
Figure 7.5 Uptake of Pt or Ru precursors on carbon supports with different
total surface area ........................................................................................... 75
Figure 7.6 Adsorption isotherm for Ru precursor at 343 K and 24.2 MPa on
Pt/C catalysts (lines represents Langmuir (Eqn 7.1) fits for the corresponding
catalysts) ....................................................................................................... 77
Figure 7.7 XRD patterns for the prepared and commercial catalysts a) whole
scan for all catalysts b) narrow scan for Pt/MWCNT, Pt/C (Tanaka), Pt/C
(ETEK) c) narrow scan for Pt/VXR and Pt/BP2000....................................... 79
Figure 7.8 Bright field and HRTEM images for catalysts (a) and (b)
Pt/MWCNT, (c) and (d) Pt/VXR, (e) and (f) Pt/BP2000................................ 80
Figure 7.9 Bright field and HRTEM images for catalysts (a)-(d) Pt/C-ETEK 81
Figure 7.10 CV results for Pt/BP2000 catalysts with different Pt loadings ..... 82
Figure 7.11 Cyclic voltammogram for the prepared catalysts in 0.1 M HClO4
in H2 atmosphere at a scan rate of 50 mV/s ................................................... 84
Figure 7.12 XRD pattern for high Pt loading Pt/VXR catalysts...................... 86
Figure 7.13 TEM images for 15% Pt/VXR .................................................... 87
Figure 7.14 CV for high Pt loading Pt/VXR catalysts .................................... 88
Figure 7.15 Hydrodynamic voltammograms of positive scans of Pt/VXR for O2
reduction in O2 saturated 0.1 M HClO4 (a) Koutecky-Levich plot at 0.2 V .... 90
Figure 7.16 Hydrodynamic voltammograms of positive scans of Pt/MWCNT
for O2 reduction in O2 saturated 0.1 M HClO4 (a) Koutecky-Levich plot at 0.2
V................................................................................................................... 91
Figure 7.17 Hydrodynamic voltammograms of positive scans of for Pt/BP2000
O2 reduction in O2 saturated 0.1 M HClO4 (a) Koutecky-Levich plot at 0.2
V………………………………………………………………………………91
xx
Figure 7.18 Tafel plots of ik for O2 reduction in positive scans for synthesized
catalysts in O2 saturated 0.1 M HClO4 for intermediate segment (0.85-0.75 V)
...................................................................................................................... 93
Figure 8.1 XRD pattern for the Pt/VX (20%) catalyst at base concentration of
0.14 g/l with different microwave durations................................................... 96
Figure 8.2 XRD pattern for the Pt/VX (20%) catalyst with different base
concentrations (BCs), 50 s microwave duration ............................................. 98
Figure 8.3 XRD pattern for the catalyst prepared with different carbon
supports, 50 s microwave duration, Base concentration is 0.54 g/l ................. 99
Figure 8.4 XRD pattern for the catalysts prepared with different SB12/H2PtCl6
(S/Pt) molar ratios, 50 s microwave duration, BC=0.54 g/l ............................ 99
Figure 8.5 XRD pattern for PtRu/VX (30%) catalyst prepared with or without
SB12 surfactant ........................................................................................... 100
Figure 8.6 XRD pattern for binary commercial catalysts of PtRu/C 20 and 40%
.................................................................................................................... 100
Figure 8.7 XPS core level spectra for Pt 4f for Pt/C (ETEK) catalyst........... 102
Figure 8.8 XPS core level spectra for Pt 4f for Pt/VX catalyst ..................... 103
Figure 8.9 XPS core level spectra for Pt 4f for Pt/Regal catalyst.................. 104
Figure 8.10 XPS core level spectra for Pt 4f for Pt/BP2000 catalyst ............ 105
Figure 8.11 Survey XPS spectra for commercial and prepared catalysts ...... 105
Figure 8.12 XPS core level spectra for C1s for Pt/C (ETEK) catalyst .......... 106
Figure 8.13 XPS core level spectra for C1s for Pt/VX catalyst..................... 107
Figure 8.14 XPS core level spectra for C1s for Pt/Regal catalyst ................. 107
Figure 8.15 XPS core level spectra for C1s for Pt/BP2000 catalyst.............. 108
Figure 8.16 XPS for (a) whole and (b) core level spectra for Ru3p for PtRu
based catalysts……………………………………………………………….109
Figure 8.17 Effect of base concentration (BC) on PEMFC performance (Pt/VX,
20%, 50 s microwave duration) ................................................................... 110
Figure 8.18 Effect of microwave duration on PEMFC performance (Pt/VX,
20%, Base concentration=0.14 g/l) .............................................................. 112

xxi
Figure 8.19 Effect of different carbon supports on PEMFC performance (50 s
microwave duration, base concentration=0.54 g/l) ....................................... 113
Figure 8.20 Effect of surfactant/Pt precursor (S/Pt) ratio on PEMFC
performance (Base concentration=0.54 g/l, 50 s microwave duration) ......... 116
Figure 8.21 Current density versus the particle size for Pt/VX (20% ) with
different conditions ..................................................................................... 117
Figure 8.22 Current density versus the particle size for Pt/VX, Pt/Regal and
Pt/BP2000 catalysts..................................................................................... 118
Figure 8.23 Effect of N2 percentage in the H2 gas fed to the fuel cell on
PEMFC performance with commercial MEA (Electrochem) ....................... 119
Figure 8.24 Effect of CO2 percentage in the H2 gas fed to the fuel cell on
PEMFC performance with commercial MEA (Electrochem) ....................... 121
Figure 8.25 Effect of CO2 cut off on PEMFC performance.......................... 122
Figure 8.26 Effect of CO2 on PEMFC performance (home made MEA with
anode 20% Pt/C (ETEK), cathode 20% Pt/C (ETEK)) ................................. 123
Figure 8.27 Effect of CO2 on PEMFC performance (home made MEA with
anode PtRu/C (ETEK, 40%), cathode 20% Pt/C (ETEK))............................ 124
Figure 8.28 Effect of CO2 on PEMFC performance (home made MEA with
anode PtRu/C (ETEK, 20%), cathode 20% Pt/C (ETEK))............................ 124
Figure 8.29 Effect of CO2 on PEMFC performance (home made MEA with
anode PtRu/VX (microwave, 30% PtRu), cathode 20% Pt/C (ETEK))......... 126
Figure 8.30 Effect of CO2 on PEMFC performance (home made MEA with
anode PtRu/VX (microwave with SB12, 30% PtRu), cathode 20% Pt/C
(ETEK) ....................................................................................................... 126
Figure 8.31 Comparison of PEMFC performances for commercial ETEK
catalysts and the microwave irradiated catalysts with similar particle size and
best performance ......................................................................................... 128
Figure 8.32 Comparison of commercial and microwave PtRu based catalysts
.................................................................................................................... 129
Figure 8.32 Current density versus the particle size for PtRu based catalysts130

xxii
Figure A.1 XRD pattern .............................................................................. 149
Figure A.2 Sample ESA graph for Pt/MWCNT ........................................... 152
Figure A.3 Tafel slope for Pt/Regal ............................................................. 153
Figure C.1 Three electrode cell configuration .............................................. 158
Figure E.1 Reproducibility of the catalyst of Pt/VX (20%) .......................... 161

xxiii
LIST OF SYMBOLS
A Area under the curve for H2 reduction part excluding double
layer capacitance
B Levich constant
BET Brunauer-Emmett-Teller
c0 Oxygen bulk concentration, mol/cm3
CV Cyclic voltammetry
D O2 diffusion coefficient, cm2/s
E Voltage of the fuel cell
ESA Electrochemical surface area
F Faraday constant
fcc Face cubic centered
GC Glassy carbon
GDL Gas diffusion layer
ID Inner diameter
ik Kinetic current density, mA/cm2
K Charge corresponds to a fully covered monolayer for a
polycrystalline Pt surface, 0.21 mC/cm2
L Pt loading on glassy carbon electrode
MEA Membrane electrode assembly
N Avogadro’s number
n Number of electrons per O2 molecule
OD Outer diameter
PEMFC Proton exchange membrane fuel cell
RDE Rotating disk electrode
S Scan rate, mV/s
SA Surface area

xxiv
scCO2 Supercritical carbon dioxide
TEM Transmission electron microscopy
VX Vulcan XC72
VXR Vulcan XC72R
XPS X-ray photoelectron spectroscopy
XRD X-ray Diffraction
υ Viscosity of the electrolyte, cm2/s
°rxn∆G Gibbs’ Free Energy Change on Reaction at STP, kJ/mol
∆G° Gibbs’ Free Energy of Formation, J/mol
∆G0rxn Gibbs’ Free Energy Change on Reaction at STP, kJ/mol
∆Grxn Gibbs’ Free Energy Change on Reaction, kJ/mol
∆H° Enthalpy of Formation, kJ/mol
∆H0rxn Enthalpy Change on Reaction at STP, kJ/mol
∆Hrxn Enthalpy Change on Reaction, kJ/mol
°c∆H Standard Heat of Combustion, kJ/mol
1
CHAPTER 1
INTRODUCTION
Rapid technological developments and increase in the world population
accelerated the consumption of the fossil-fuel-based energy sources which
resulted in the increase of the harmful gases released to the environment. From
this aspect, global warming is becoming a big threat for human beings that
threatens the future of the world. Therefore, a lot of efforts have been recently
devoted to find renewable, clean and sustainable energy sources to reduce the
dependency on fossil-fuel-based energy sources. The problem with fossil fuels
is not only their harmful effects but they may also run out because of excessive
utilization. Also the main reason for the commencement of wars in this century
is the inequality in distribution of energy sources. So, energy technologists
have been searching for new renewable, sustainable and clean energy sources,
because of not only for clean energy sources but also for the peace of the
world. If new renewable energy sources are found, the dependence of the
energy source-deprived countries to other foreign countries will be decreased
and they will be self reliant.
One of the most promising alternative energy carriers is hydrogen if some
drawbacks such as storage, infrastructure and high production cost are solved.
Hydrogen is not available in nature but it can be produced from the primary
energy sources including natural gas, coal, biomass, nuclear, wind, solar,
wastes etc. Producing electricity by using fuel cells may lead the way through
the new energy era.

2
Fuel cells are electrochemical devices that directly convert the chemical energy
of the fuel into electrical energy. Fuel cells, invented by Sir William Grove in
1839, have been still under investigation by the scientists in different fields of
the science including chemical engineers, mechanical engineers, chemists,
electrical and material engineers, physicists and so on. All these
multidisciplinary studies are made to eliminate the lacking parts of the fuel
cells for commercialization. The main problems that the researchers are trying
to solve for the commercialization of the fuel cells are high cost of the fuel cell
components, durability, life time and the poisoning effects of the gases coming
from the reformate or biologically produced hydrogen. The cost of the fuel cell
components can be reduced by using alternative low cost materials and
developing suitable techniques for manufacturing.
Especially for portable and mobile applications proton exchange membrane
fuel cell (PEMFC) seems to be the most reliable ones because of its low
operating temperature, high power density, and clean emissions. The heart of a
PEMFC is the membrane electrode assembly (MEA) which consists of an
anode and a cathode electrode and membrane. The half cell reactions and
proton conduction occurs in this part. When hydrogen is fed to the anode side
of the fuel cell, hydrogen splits its proton and electron by the help of the
platinum metal in the electrode. The membrane only allows the protons to pass
through it and the electrons are directed to an external circuit. Then these
electrons are sent to the cathode electrode and are reacted with the oxygen gas
fed to the cathode side and with the protons that pass through the membrane
and finally water is formed by this reaction.
During the master thesis (Bayrakçeken, 2004) a home made fuel cell test
station was developed for PEMFC tests. Also, the operating conditions of the
fuel cell such as anode and cathode humidification temperatures were
optimized. A membrane electrode assembly preparation technique was
developed by optimizing the preparation conditions. Furthermore the effects of
3
construction materials such as gas diffusion layer, membranes with different
thicknesses and sealing material were also investigated. The evaluation of the
performances was made by comparing the voltage-current data obtained from
these fuel cells by using the home made test station.
Platinum (Pt) supported on carbon support catalysts are used as the anode and
the cathode electrodes. Although a lot of studies were made to replace the Pt
with non-precious metals, no catalyst has been found that would give a better
performance than that of Pt. Pt is unique for both oxidation and reduction
reactions. But, it is important to emphasize that the Pt reserves are limited, so
the Pt loadings have to be decreased and the activity of the Pt metal on the
support has to be increased.
The PEMFC is very sensitive to carbon monoxide. Even at concentrations as
low as 10 ppm in the hydrogen feed, the performance of the PEMFC decreases
drastically because of the poisoning effect of the CO on Pt catalyst. High CO2
concentrations (30-50%) have an indirect CO effect because of either
electroreduction of CO2 or reverse water gas shift reaction. To compensate this
corrapting effect another metal, usually Ru, Mo, or W can be added near Pt
particles and these new binary or ternary catalysts may be CO and CO2
tolerant.
There are several ways to deposit Pt onto the carbon support such as
impregnation, microemulsion, sequential and co-precipitation, supercritical
carbon dioxide (scCO2) deposition, microwave irradiation, ion exchange, sol-
gel, ultrasonication. In this thesis by using scCO2 deposition and microwave
irradiation methods, it is aimed to increase the Pt utilization that is deposited
onto the carbon support.
scCO2 deposition method is gaining an increasing attention because scCO2 is a
green solvent with non-toxic, non-flammable, chemically inert and inexpensive

4
properties. It can be removed from the system only by depressurization and
there no residue is left on the catalyst surface. Besides its environmental
benefits supercritical carbon dioxide has also desirable physical and chemical
properties such as relatively chemical inertness, readily accessible critical point
(Tcr=31.1ºC, Pcr=7.4 MPa), excellent wetting characteristics, low viscosity,
highly tunable solvent behavior, facilitating easy separation. Especially highly
tunable solvent properties and leaving no residue characteristics are very
important in catalyst preparation.
Another catalyst preparation method used in the experiments was microwave
irradiation. In microwave processes heat is generated internally within the
material instead of originating from external sources. Briefly, the solvent or the
reagent has to be capable of absorbing the microwave energy and convert it
into heat. In conventional heating the material is heated only the outside
surface, but in case of microwave heating the microwaves can penetrate
materials and heat on the inside and also the outside. Since microwave heating
depends on the absorption ability of the materials, it will provide a selective
heating for different materials. Also, the heating time is shortened by using this
method.
In the present study, Pt and PtRu based catalysts are prepared by using scCO2
deposition and microwave irradiation methods. It is aimed to increase the
performance of the fuel cell for the main reactions by changing the catalyst
properties including particle size, metal distribution and also to increase the
CO2 tolerance of the fuel cell.
In case of Pt based catalysts, Pt was decorated on different carbon supports
which have different surface areas. The Pt based catalysts prepared by scCO2
deposition method were electrochemically characterized with CV by means of
hydrogen oxidation and reduction and also oxygen reduction reaction
mechanisms were investigated. The Pt based catalysts, prepared by the

5
microwave irradiation method, were tested in PEMFC test system as cathode
electrode to see the oxygen reduction reaction performance. Various PtRu
based catalysts, used as anode electrode, were prepared to increase the carbon
dioxide tolerance of the PEMFC.
In Chapter 2, general information about PEMFCs including the principle,
components, irreversibilities, electrocatalysis and the poisoning effects of
either carbon monoxide or carbon dioxide gases on PEMFC performance are
summarized.
In Chapter 3, a brief summary is given related with the properties of scCO2 and
its applications. The literature summary of the catalyst preparation with scCO2
is also included in this chapter.
In Chapter 4, comparison of the microwave irradiation to conventional heating
systems is given. The literature summary of the catalyst preparation with
microwave irradiation is also included in this chapter.
In Chapter 5, experimental procedures of Pt based catalyst preparation with
scCO2 deposition, physicochemical and electrochemical characterization of the
catalysts which includes XRD, TEM and cyclic voltammetry (CV) are given.
In Chapter 6, experimental procedures of Pt and PtRu based catalyst
preparation with microwave irradiation, physicochemical XRD, XPS and
PEMFC tests of the catalysts are given.
In Chapter 7, the results for the catalysts prepared by scCO2 deposition are
given which includes the XRD, TEM and CV results.

6
In Chapter 8, the results for the catalysts prepared by microwave irradiation are
given which includes the XRD, XPS and PEMFC test results.
In Chapter 9, conclusion and recommendation part is summarized.
7
CHAPTER 2
PROTON EXCHANGE MEMBRANE FUEL CELLS
2.1 Principles of Proton Exchange Membrane Fuel Cells
The proton exchange membrane fuel cell (PEMFC), also called the solid
polymer fuel cell (SPFC), was first developed by General Electric company in
the United States in 1960s for the first manned space vehicles used by NASA
(Larminie and Dicks, 2003).
Proton exchange membrane fuel cells are considered as promising alternatives
to internal combustion engines for transportation because of their high
efficiency, high power density, low emissions, low operating temperature, and
low noise (Lee et al, 2004) PEMFCs have further advantages such as
elimination of electrolyte leakage, lower corrosion, simplification of stack
design and increased ruggedness. These promising attributes have stimulated
applications in areas such as military, aerospace and transportation (Lee et al,
1998).
A single PEM fuel cell consists of a solid polymer electrolyte sandwiched
between two thin electrodes, a porous anode and cathode. Hydrogen, is fed to
the anode, in which oxidation reaction occurs, where Pt catalyst separates
hydrogen's negatively charged electrons from positively charged ions
(protons). At the cathode, oxygen/air combines with electrons and produce
water. The protons pass through anode to cathode with the help of a proton
conducting membrane (which allows only H+ ions, not electrons), and

8
electrons pass through the cathode via an external circuit and electricity
produced. Figure 2.1 (www.udomi.de/images/fcm.gif last accessed at
13.01.2008) illustrates the operational principle of a PEM fuel cell.
Figure 2.1 Operational principle of PEMFCs
In a PEM fuel cell; anode-cathode half cell and overall electrochemical
reactions are given in Eqns 1, 2 and 3 as follows:
Anode : 2 H2 � 4 H+ + 4 e- E=0.00V (2.1)
Cathode : O2 + 4 H+ + 4 e- � 2 H2O E=1.23V (2.2)
Overall : 2 H2 + O2 � 2 H2O ∆E=1.23V (2.3)

9
The heat of reaction and the Gibbs Free Energy change is as follows:
∆Hfo (H2O(l))= -285.8 kj/mol and ∆Hf
o (H2O(g))= -241.8 kj/mol
∆Gfo (H2O(l))= -237.1 kj/mol and ∆Gf
o (H2O(g))= -228.6 kj/mol
These values indicate that the overall reaction is an exothermic and spontenous
reaction (Larminie and Dicks, 2003).
2.2 PEMFC components
A PEMFC consists of the parts given in Figure 2.2
(http://www.kemi.dtu.dk/forskning/rg_materials/projekter/fuelcells.aspx last
accessed at 13.01.2008) in which each component is very critical for the fuel
cell to be operated with high performance.
Figure 2.2 PEMFC components

10
Electrolyte, the heart of the PEMFC is in the form of a proton conducting
membrane, and its thickness varies typically between 50 and 175 microns. Its
functions are: conductance of protons, separation of hydrogen and air,
and electronic isolation. The most frequently used PEM is made of Nafion
produced by DuPont, which consists of Teflon-like chains with a fluorocarbon
backbone and sulfonic acid groups, SO3-, permanently attached to the side
chains. When the membrane is hydrated by absorbing water, protons initially
attached to the SO3- groups combine with water molecules to form hydronium
ions. Hydronium ions are quite mobile and hop from one SO3- site to another
within the membrane making the hydrated solid electrolytes, like Nafion, as
excellent conductors of the hydrogen ions (Grujicic et al, 2004). The proton
conduction mechanisms in hydrated PEMs may be understood by considering
dissociation of the proton from the acidic site, subsequent transfer of the proton
to the aqueous medium, screening of the hydrated proton from the conjugate
base by water (e.g., the sulfonate anion), and finally diffusion of the proton in
the confined water within the polymer matrix (Paddison, 2003). Nafion proton
conduction is so very susceptible to membrane hydration. Sridhar et al. (2001)
observed that the fuel cell membrane always picks up water from the hydrogen
stream even under no load conditions, which further strengthens the need for
improved humidification. To provide 100% humidity for fuel cell operational
conditions, (including cell temperature, humidification temperatures, flow rates
and pressures) have to be optimized (Williams et al., 2004; Passos and
Ticianelli, 2002; Wang et al. 2003). Nafion is suitable for low temperatures
(~80ºC), so nowadays a lot of study is devoted to increase the operating
temperature of the fuel cell by replacing Nafion with high temperature resistant
membrane such as polybenzimidazole (PBI) (Korsgaard et al., 2006; Yurdakul,
2007; Şengül, 2007) or sulfonated polyethersulphone (PES) or polyetherether
ketone (PEEK) membranes (Akay, 2008; Erdener, 2007). By increasing the
temperature not only the kinetics of the electrodes will be improved but also
the carbon monoxide poisoning effect will be mitigated.
11
A PEMFC contains two electrodes, an anode and a cathode. At the anode,
hydrogen is oxidized to protons, while at the cathode oxygen (from air) is
reduced to water. The state-of-the-art electrodes contain carbon supported
platinum catalysts. The platinum loading is generally in the order of 0.2-0.4 mg
platinum per cm2 electrode area. Current state of the art of catalyst layers for
gas diffusion electrodes utilizes carbon supported Pt as the catalyst for oxygen
reduction at the cathode. The primary role of the carbon support is to provide
electrical conduction between the widely dispersed Pt catalyst particles and the
porous current collector (carbon cloth or paper) (Qi et al, 1998).
In order to facilitate transport of protons into the catalyst layer, a proton
conducting polymer (e.g.Nafion) is mixed with the catalyst. Nafion
impregnation is extending the three-dimensional reaction zone. A Nafion
content of about 33% of the total electrode weight appeared to be optimal to
minimize both ohmic and transport losses (Passalacqua et al, 2001).
The use of solid polymer as an electrolyte engenders the problem of non-active
catalysts in the electrode. Therefore, as an ionic conductor Nafion solution is
impregnated on the electrode surface to extend the catalytic reaction area by
forming passages of ionic transfer (Lee et al, 2004). Methods for fabricating
electrodes for PEMFCs include the silk printing, brushing and rolling
techniques (Choi et al, 1998; Yazaydin, 2003).
The electrode backing (gas diffusion layer) serves as current collector, gas
distributor and improves water management in the cell. Both carbon cloths and
carbon papers are used, with a typical thickness of 300 microns. The carbon
cloths generally contain one or two gas diffusion layers, having a thin (20-30
microns) microporous hydrophobic layer.
The gas diffusion layer in a PEMFC consists of a thin layer of carbon black
mixed with polytetrafluoroethylene (PTFE) that is coated onto a sheet of

12
macro-porous carbon backing (Lee et al, 2004). These layers are porous
enough to allow the distribution of the gases to unexposed areas of the flow
channel whereby this distribution permits the complete utilization of the
electrode area. The electrical conductivity of these layers may affect the
transport of electrons to the current collector from the electrode. The
hydrophobicity of these layers may compete with the hydrophilicity of water
available for hydration at the membrane. The performance variations may also
be due to changes in the porosity, the electrical contact resistance, and the
excluded water at the membrane ( Lee et al, 1999; Bayrakçeken, 2004).
It has been shown that a fuel cell embedded with a GDL with a larger averaged
porosity consumes a greater amount of oxygen, so that a higher current density
is generated and a better fuel cell performance is obtained. This explains partly
why fuel cell performance deteriorates significantly as the cathode is flooded
with water (i.e. to give a lower effective porosity in the GDL) (Chu et al,
2003).
Also gas diffusion layer thickness is a parameter that affects the performance.
A thin layer improves the gas supply and facilitates the removal of the
produced water, but it has high electronic resistance and does not give a non-
permeable support for coating with the catalyst layer during electrode
fabrication. Therefore, permeation of the catalyst layer into the diffusion layer
makes poor ionic contact with the Nafion membrane. On the other hand, a
thick layer hampers the accessibility of gas due to the lengthened path in the
layer and has poor gas diffusivity. Hence, an intermediate thickness enhances
the electrode performance best (Lee et al, 2004; Şengül et al, 2007).
The gaskets not only prevent the leakage of gases from the cell to the exterior
but also prevent the direct contact between the acidic electrolyte and the
bipolar plate. The materials used as gasket can be any plastic material which is
resistant to the conditions within a fuel cell. Teflon is often used.

13
The bipolar plates serve as gas separator between adjacent cells, contain flow
channels that distribute the reactant gases and conduct the current to the
adjacent cells. The materials used for bipolar plates need to have low electrical
resistivity (bulk and surface), be corrosion resistant, and light weight. Graphite
plates, composite materials and metals such as stainless steel, copper etc. can
be used as bipolar plates.
The main tasks of a flow field plate are current conduction, heat conduction,
control of gas flow and product water removal (Hoogers, 2003).
2.3 Fuel cell irreversibilities
In fuel cells, ‘Gibbs free energy’ is important because Gibbs free energy of
formation, ∆Gf, gives us the energy released and given as Eqn (4).
∑Gf =∑Gf (products) - ∑Gf(reactants) (2.4)
For the hydrogen fuel cell, two electrons pass round the external circuit for
each water molecule produced and each molecule of hydrogen consumed. So,
for one mole of hydrogen used, 2N electrons pass round the external circuit-
where N is Avogadro’s number. If –e is the charge on one electron, then the
charge that flows is,
-2NE = -2F (2.5)
where F being the Faraday constant, or the charge on one mole electrons. If E
is the voltage of the fuel cell, then the electrical work done for (We, Joules)
moving this charge round the circuit is equal to charge times voltage:

14
We = -2FE (2.6)
If the system is reversible (or has no losses), then this electrical work done will
be equal to the Gibbs free energy released. So,
∆Gf = -2FE (2.7)
2F
∆GE f−
= (2.8)
This fundamental equation (Eqn 2.8) gives the electromotive force (EMF) or
reversible open circuit voltage of the hydrogen fuel cell (Larminie and Dicks,
2003). Voltage-current density curve of a fuel cell is the performance indicator
of the fuel cells. It is important to obtain higher current densities at higher
voltages. These performance curves indicate which type of resistance is
dominated and where the problem is in the fuel cell. A typical polarization
curve for the fuel cell is given in Figure 2.3.
It can be obviously seen from the Figure 2.3 (Cooper et al., 2005) that there are
some voltage losses while operating the fuel cell. An evaluation of deviation of
operating voltage level from ideal operational case may provide information on
the extent of improving efficiency and energy efficiency of a fuel cell
(Ghadamian and Saboohi, 2004). The irreversibilities of a fuel cell is caused by
activation losses, fuel crossover and internal currents, ohmic losses and mass
transport or concentration losses.
The cell voltage including all cell reversibilities can be given as in Eqn (2.9):
V= E – ∆Vact - ∆Vohm - ∆Vtrans (2.9)
where

15
⋅=∆
0act i
ilnAV
(2.10)
irVohm =∆ (2.11)
).exp( inmVtrans =∆ (2.12)
in which E is the reversible open cell voltage, A is Tafel slope, i0 is the
exchange current density, r is the resistance and m and n are empirical
coefficients (Larminie and Dicks, 2003).
Figure 2.3 Typical fuel cell polarization curve
16
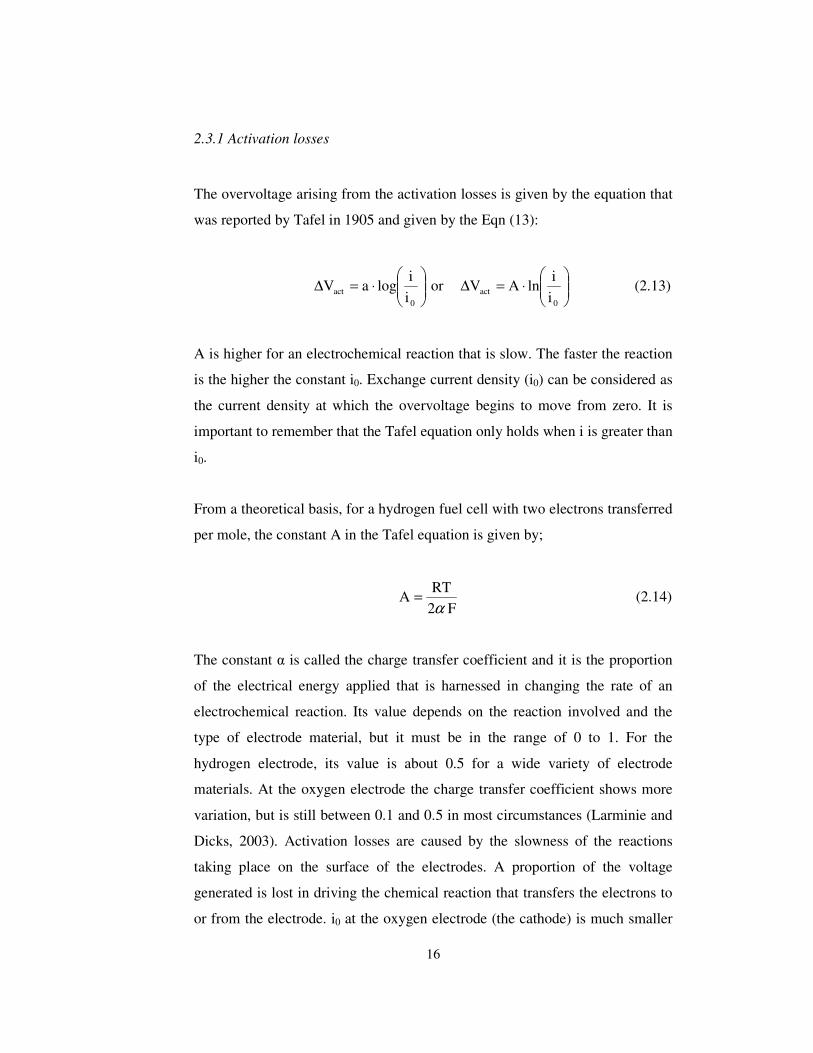
2.3.1 Activation losses
The overvoltage arising from the activation losses is given by the equation that
was reported by Tafel in 1905 and given by the Eqn (13):
⋅=∆
0act i
ilogaV or
⋅=∆
0act i
ilnAV (2.13)
A is higher for an electrochemical reaction that is slow. The faster the reaction
is the higher the constant i0. Exchange current density (i0) can be considered as
the current density at which the overvoltage begins to move from zero. It is
important to remember that the Tafel equation only holds when i is greater than
i0.
From a theoretical basis, for a hydrogen fuel cell with two electrons transferred
per mole, the constant A in the Tafel equation is given by;
F 2
RTA
α= (2.14)
The constant α is called the charge transfer coefficient and it is the proportion
of the electrical energy applied that is harnessed in changing the rate of an
electrochemical reaction. Its value depends on the reaction involved and the
type of electrode material, but it must be in the range of 0 to 1. For the
hydrogen electrode, its value is about 0.5 for a wide variety of electrode
materials. At the oxygen electrode the charge transfer coefficient shows more
variation, but is still between 0.1 and 0.5 in most circumstances (Larminie and
Dicks, 2003). Activation losses are caused by the slowness of the reactions
taking place on the surface of the electrodes. A proportion of the voltage
generated is lost in driving the chemical reaction that transfers the electrons to
or from the electrode. i0 at the oxygen electrode (the cathode) is much smaller

17
than that at the hydrogen anode, sometimes 105 times smaller. Indeed, it is
generally supposed that the overvoltage at the anode is negligible compared to
that of the cathode, at least in the case of hydrogen fuel cells. A crucial factor
in improving fuel cell performance is, therefore, to increase the value of i0,
especially at the cathode. This can be done in the following ways raising the
cell temperature, using a more effective catalyst, increasing the roughness of
the electrodes, increasing reactant concentration, for example, using pure O2
instead of air or increasing the pressure (Larminie and Dicks, 2003).
2.3.2 Fuel crossover and internal currents
The membrane in PEMFC has to be only proton conducting. If some fuel and
electron conduction occurs through the membrane, this will cause some energy
loss. Fuel crossover is known as the migration of the fuel through the
electrolyte.
2.3.3 Ohmic losses
Ohmic losses in fuel cell include all resistances such as resistance to the
electron flow through the material of the electrodes, various interconnections,
and the resistance to the flow of ions through the electrolyte. Electronic
resistances are located in a number of fuel cell stack components and, inside
the MEA, in the electrode substrates and the two catalyst layers. Ionic
resistances occur where proton transport takes place, i.e., inside the membrane
electrolyte and inside the catalyst layers (Hoogers, 2003).
18
2.3.4 Mass transport or concentration losses
Mass transport or concentration losses result from the change in concentration
of the reactants at the surface of the electrodes as the fuel is used. For both
anode and cathode sides, the consumption of the feed gases will result in the
decrease in the pressure which will reduce the voltage. Also, the flooding that
occurs because of the excess water in fuel cell can hinder the gas transport.
2.4 Electrocatalysis in Proton Exchange Membrane Fuel Cells
Platinum is the basic metal that is used for anode and cathode electrodes of
PEMFCs because of its high catalytic activity for both oxidation and reduction
reactions (Costamagna and Srinivasan, 2001). However, platinum is an
expensive metal which causes the price of MEAs to be prohibitively high for
commercialization and widespread usage of fuel cells (Xiong and Manthiram,
2005). For both anode and cathode sides, carbon supported Pt is used as the
electrodes. Since, oxygen reduction reaction (ORR) on the cathode side is
much slower than hydrogen oxidation reaction (HOR) at the anode side, the
catalyst and the catalyst loading at the cathode side is gaining more
importance. This sluggish ORR is the main contributor to the efficiency loss in
PEMFCs. The catalytic activity of the catalyst and the utilization depends on
the contact between the electrolyte and the Pt particles (Pan et al., 2005) as
well as the size of the platinum particles. Figure 2.4 shows the schematic
representation for the contact between Pt/C and Nafion in PEMFCs. To provide
proton conduction between the catalyst and the electrolyte, the Nafion solution
plays a network role.

19
Figure 2.4 Schematic representation for the contact between Pt/C and Nafion in PEMFCs
2.4.1 Hydrogen oxidation reaction
Hydrogen oxidation reaction (HOR) takes place at the anode side of the fuel
cell. The net reaction for the hydrogen oxidation is supposed to be with two
different pathways, i. e. via Tafel-Volmer mechanism or the Heyrovsky-
Volmer mechanism (Larminie and Dicks, 2003).
Overall half cell reaction
H2 + 2 H2O � 2 H3O+ + 2e- (2.15)
Tafel-Volmer mechanism
H2 � 2 Hads (2.16)
Hads + H2O � H3O+ + e- (2.17)
Heyrovsky-Volmer mechanism
H2+ H2O � Hads + H3O+ + e- (2.18)
PPtt
CCaarrbboonn
NNaaffiioonn

20
Hads + H2O � H3O+ + e- (2.19)
The favored mechanism depends not only the electrolyte medium but also the
catalyst used. Since the reaction at the anode side is very fast, the catalyst
loading at the anode side can be lower than the cathode side. At the anode side
of the fuel cell, it is important to prevent the poisoning effects of some gases
including especially carbon monoxide since it is a by-product of reforming
processes. So, many efforts have been devoted to find alternative catalysts to
eliminate the CO poisoning.
2.4.2 Oxygen reduction reaction
Oxygen reduction reaction (ORR) occurs at the cathode side of the fuel cell.
For ORR, two reactions pathways are assumed depending on the pH of the
electrolyte (Hamann et al, 1998):
Direct reduction
O2 + 4 H+ + 4 e- � 2 H2O E=1.23V (2.20)
Indirect reduction
O2 + 2 H+ + 2 e- � 2 H2O2 E=0.682V (2.21)
followed by a further reduction via
H2O2 + 2 H+ + 2 e- � 2 H2O E=1.77V (2.22)
or a chemical decomposition via
2H2O2 � 2 H2O + O2 (2.23)

21
The target reaction is direct reduction, in the latter case hydrogen peroxide is
formed which may accumulate and affect the fuel cell performance in a bad
way by forming the radicals from the hydrogen peroxide with the help of the
catalyst which causes membrane to deteriorate (Kunimoto et al, 2006).
Platinum bulk metal forms a face-cubic-centered (fcc) crystal structure,
generally with 110, 100 or 111 crystal planes in which every plane shows
different electrochemical behavior. The role of the local symmetry of surface
atoms in electrocatalysis is on the kinetics of the oxygen reduction reaction and
of the hydrogen evolution/oxidation reactions on single Pt crystals (Markovíc
et al., 1999). Figure 2.5 shows the cyclic voltammetric current potential curve
for a platinum electrode in contact with a 0.5 M H2SO4 solution (mercury
sulfate reference electrode was used, MSE) (Rodríguez et al, 2000). Since in
Figure 2.5 the reference electrode used was MSE the electrode potentials can
be converted to normal hydrogen electrode (NHE) referenced potentials by
adding 680 mV (Rodríguez et al, 2000).
The equilibrium potential for the hydrogen evolution/oxidation reaction is to be
-680 mV (0 V vs NHE) for any case. From the figure it is seen that below -300
mV (0.4 V vs NHE) hydrogen adsorption and desorption peaks appear. The
areas under the curves are used to determine the electrochemical surface areas
of the Pt that are active for the reactions. A fully covered monolayer is
supposed to correspond to a charge of 210 µC/cm2 for a polycrystalline Pt
surface (Liu et al, 2005). At potentials higher than 100 mV (0.8 V vs NHE) Pt
is oxidized. If potential is further increased to 700 mV (1.4 V vs NHE) oxygen
evolution can be observed. Approximately, in anodic direction between -300
and 100 mV (0.35 and 0.8 V vs NHE) and in cathodic direction between 100
and -300 mV (0.65 and 0.35 V vs NHE) region (double layer region) only the
current flow required to charge the electrochemical double layer can be
observed where only capacitive processes take place. The hydrogen
underpotentially deposited (Hupd) region shows two well-resolved peaks. The

22
peak located around -600 mV (120 mV vs NHE) is related to the
adsorption/desorption process of hydrogen on low coordinated Pt-surface
atoms comparable to the H adsorption/desorption peak observed on Pt(110)
single crystal surfaces. The second peak is located around -500 mV (240 mV
vs NHE). At the same position a H adsorption/desorption peak can be observed
on Pt (100) single crystal surfaces. This peak therefore points to the Hupd
process taking place on 100 facets (Markovíc et al., 1995).
Figure 2.5 Cyclic voltammetric current potential curve for a platinum electrode in contact with a 0.5 M H2SO4 solution (mercury sulfate reference electrode
was used, MSE)

23
2.5 Catalyst preparation techniques
The catalytic activity of the catalysts depends on several parameters such as
catalyst preparation technique, carbon support, precursor properties,
accessibility of the metal on the support, conditions and so on. Several
techniques were used to deposit platinum on different carbon supports, such as
impregnation-reduction (Zhang et al, 2004; Kawaguchi et al, 2005),
microemulsion based synthesis (Escudero et al, 2002) and ion exchange (Shao
et al, 2006). By using different deposition methods, metals are decorated on
different carbon supports such as Vulcan XC 72 R (Raghuveer and Manthiram,
2004), MWCNT (Liu et al, 2002; Li et al, 2003), carbon aerogel (Marie et al,
2004), activated carbon (Maruyama and Abe, 2003), BP2000 (Amine et al,
1998) and carbon cryogel (Babić et al, 2006). Carbon black is a widely used
support because it has good electrical conductivity, high corrosion resistance
(Gloaguen et al., 1997) and low cost. In all these techniques, it has been
targeted to decrease the average size of Pt particles in order to increase the
catalytic surface area per mass of Pt and also to disperse the Pt particles
uniformly on the support.
Briefly, impregnation method includes the mixing of carbon support with a
solution of metal salts and then drying this slurry to remove the solvent then to
reduce the catalyst by heat treatment to obtain the desired catalyst (Hoogers,
2003). Compared to other catalyst preparation methods, the impregnation
method has some drawbacks such as agglomeration which results in larger
particle sizes (Hui et al, 2005).
The colloidal method contains the production of nanoscale catalysts in the
homogeneous phase with the use of ligands, surfactants, or polymers as the
stabilizer. Then the heterogeneous catalysts can be obtained by depositing the
pre-prepared colloidal particles onto the supports. Therefore both the size and
composition of the colloidal precursors may be tailored independent of support

24
(Hui et al, 2005). In microemulsion-based synthesis, removing the surfactant
may be problematic (Yu et al, 2003).
Most of the patented Pt-based catalysts were prepared by using the
precipitation method. This method includes the precipitation of a soluble
species by chemical transformation. This is done by changing the pH (from
acidic to basic) or the addition of a reducing agent (e.g., formaldehyde,
hydrazine or any other reducing agent to precipitate metal) (Hoogers, 2003).
The supercritical deposition method involves the dissolution of an
organometallic precursor in a supercritical fluid and the impregnation of the
subtrate by exposure to this solution. Subsequent treatment of the impregnated
substrate results in metal/substrate nanocomposites. Because of its non-
toxicity, non-reactivity, non-flammability and inexpensive properties the most
commonly used fluid is CO2 (Saquing et al, 2005). One of the most promising
catalyst preparation techniques is the supercritical carbon dioxide (scCO2)
deposition method (Leitner, 2002) which results in small particle sizes and
homogeneous dispersion (Zhang et al, 2005). By using this method, the metal
loading on the support can also be controlled thermodynamically (Saquing et
al, 2005).
Microwave irradiation method is recently used for the heterogeneous catalyst
preparation. In this method, reduction of the metal is achieved by using
microwave heating (Liu et al., 2006).

25
2.6 Deactivation of the catalyst by CO and CO2
2.6.1 The significance of CO and CO2 contents in H2
Molecular hydrogen is not naturally available so it has to be produced from the
primary energy sources. The most commonly used ways for hydrogen
production are electrolysis, coal gasification, biohydrogen and steam
reforming. The gas output of the reforming systems contains carbon monoxide
and carbon dioxide and biohydrogen processes only contain carbon dioxide
besides hydrogen. Global hydrogen production in 1999 from different
production methods is given in Figure 2.6 (Sperling and Cannon, 2004). The
figure represents that most of the hydrogen is produced from hydrocarbon
based fuel sources.
Figure 2.6 Global hydrogen production in 1999

26
Especially for mobile applications and also for residential applications on-
board hydrogen produced by reforming systems seems to be the most suitable
one. All hydrocarbon reforming methods, whether it be steam reforming,
partial oxidation (Avcı et al, 2001a) or autothermal reforming (Avcı et al,
2001b), generate an effluent which is dilute in hydrogen and contains varying
amounts of trace CO (Bhatia et al, 2004). Hydrogen can be generated on-board
by reforming a liquid hydrocarbon, such as methanol, resulting in a fuel
mixture consisting of approximately 74% hydrogen, 25% carbon dioxide and
1-2% carbon monoxide by volume (Baschuk et al, 2003). Currently, the most
widely used method of hydrogen generation is via steam reforming of natural
gas, because it is mainly composed of methane which has a higher hydrogen
atoms per carbon atoms ratio close to 4:1 (Avcı et al, 2002).
Another hydrogen production method used is coal gasification. Coal is
potentially a more economical source of hydrogen when compared to natural
gas, because it is abundant and its delivery is safe (Sperling and Cannon,
2004).
Hydrogen production by electrolysis gives the purest hydrogen but it is not an
energy efficient process. Most of the efforts are devoted to integrate the
nuclear, solar or wind power with electrolyzers. So, by using sustainable
energy sources the cost of the hydrogen production via electrolysis could be
reduced.
Biological hydrogen production is also gaining increasing attention especially
when the wastes of different factories such as olive oil are used as the hydrogen
source (Eroğlu et al, 2006). By using this method carbon dioxide is produced
with hydrogen in the range of 4-50%.
27
2.6.2 CO and CO2 tolerance of the catalysts
The CO concentration must be reduced in a separate gas treatment unit down to
<10 ppm if conventional carbon supported Pt is used as anode catalyst.
Otherwise, CO molecules are adsorbed strongly on active sites of the catalyst
and inhibit the hydrogen oxidation reaction at the anode (Divisek et al, 1998).
Temporary deactivation occurs because CO binds strongly to Pt sites resulting
in a high Pt surface coverage of CO at the operating temperature of PEFCs
(Denis et al, 1999). Since, the electrodes in a PEM fuel cell contain platinum,
only higher than 10 ppm CO and even higher percentages of CO2 (20-50%) in
the hydrogen poisons the catalyst. So the electrodes have to be improved for
the tolerance of both CO and CO2. This improvement can be achieved by using
binary or ternary catalyst combinations which help to reduce the platinum
poisoning. Other poisons considered are H2S (Shi et al., 2007) and ammonia
(Halseid et al., 2006).
The ways to overcome the performance loss due to the presence of CO are:
• advanced purification of reformate gas by fuel processor, but this will
make the fuel cell system much more complex and expensive (Yu et al,
2002)
• electrodes poisoned by CO could be recovered quickly when fuels
containing no CO was used (Qi et al, 2003)
• increasing the temperature (to decrease CO adsorption), but the
operating temperature is limited to a maximum of about 1200C by the
need for effective humidification of the membrane
• injecting a small amount of O2 (up to about 2%), air bleeding, to
oxidize CO chemically. However, the explosion threshold for H2/O2
mixtures is 5% O2 in H2. This limits the maximum level of CO that can
be treated effectively by oxygen bleeding in PEFCs to about 100 ppm.
28
Furthermore, the chemical oxidation of CO by O2 catalyzed by Pt at the
anode reduces the amount of Pt available, for producing a current from
the oxidation of hydrogen, and also the utilization of the fuel will
certainly be decreased. Furthermore, only about 1 out of 400 oxygen
molecules participates in the oxidation of CO, and the remaining oxgen
chemically combusts with hydrogen. The combustion reaction not only
lowers the fuel efficiency, but might also accelerate the sintering of
catalyst particles which leads to a performance decline with time. In
addition, the chemical combustion might also create pinholes in the
electrolyte membrane, which could result in cell failure (Qi et al, 2003)
• the addition of H2O2 shows comparable results to air bleeding. The
decomposition of H2O2 to active oxygen leads to CO oxidation and to
enhanced cell performance. Addition of H2O2 has advantages regarding
the safety problem as compared to mixtures of hydrogen and oxygen.
An alternative to the H2O2 addition to the fuel gas could be a small
electrolyzer which produces defined amounts of oxygen (Divisek et al,
1998).
• the usage of Pt alloy catalysts that are more tolerant towards CO
poisoning than pure Pt. The use of Pt-Ru as oxidation catalyst for H2
containing CO at the anode leads to a lowering of the CO oxidation
potential (Denis et al, 1999). Search for an anode catalyst which
oxidizes adsorbed CO at lower electrode potentials than Pt, showing at
the same time a high activity for hydrogen oxidation (Divisek et al,
1998).
It is known that the higher percentages of CO2 have an adverse effect on
PEMFC performance. This effect is supposed to be due to either reverse water
gas shift (RWGS) reaction or electroreduction.
The reverse water gas shift reaction

29
CO2 + H2 CO + H2O
(2.24)
or electroreduction mechanism
CO2 + 2H+ + 2e- CO + H2O (2.25)
The effect of either in terms of the effect of surface coverage and its effect on
overpotentials will be the same (Urian et al, 2003). At low potentials, where Pt
is covered by adsorbed hydrogen (Pt-Hads), CO forms both linear and bridge-
bonded CO species. Moreover, the ratio of linear and higher coordinated forms
(such as bridge-bonded) appears to be a function of electrode potential.
Adsorption of CO2 on the platinum surface is expected to occur mainly in the
potential range where surface adsorbed hydrogen on Pt is present (hence in the
low potential region) (Urian et al, 2003).
Nafion is used in the catalyst solution to provide a network between the Pt
metal and the electrolyte. Uncovered platinum is likely to coexist with Nafion-
covered platinum. Bruijn et al. (2002) found that the uncovered Pt metal affects
the RWGS reaction. It is supposed to be this uncovered platinum (which is
capable of catalyzing the RWGS reaction) exposed to hydrogen leads to
adsorbed hydrogen atoms which cannot be removed electrochemically, due to
the lack of electrolyte. The CO, formed on the surface by this RWGS reaction
is in equilibrium with CO in the gas phase. On the Nafion-covered surface,
adsorbed hydrogen is immediately oxidized to protons, the dissociative
adsorption of molecular hydrogen being the rate determining step. By the low
amount of adsorbed hydrogen, the RWGS reaction is strongly supressed, and
the influence of CO2 is minor. Thin-film electrodes with high electrochemical
utilization are much more tolerant towards CO2, irrespective of the noble metal
composition of the anode (Bruijn et al, 2002).
Janssen (2004) modelled the CO2 poisoning on PEMFC anodes. From this
study it was found that RWGS reaction can in principle be the two sources of
30
anode poisoning in a fuel cell. There is the reduced CO2 that is in the form of
CO or a related species which blocks the catalyst surface for hydrogen
dissociation and oxidation. In addition, CO formed by CO2 reduction desorb
from the surface, enter the gas flow and re-adsorb further down-stream. Apart
from surface blocking, the dilution and utilization of hydrogen lead to a
reduced partial hydrogen pressure and hence increased activation and Nernst
losses. In this respect, the addition of CO2 is equivalent to the addition of N2.
At higher current density, the rate of CO2 reduction is reduced due to lower
amount of H-adsorbed sites available for the CO2 reduction reaction, hence at
higher current density the effects of 10 ppm CO become more significant than
those of CO2. Moreover, at high current densities the CO effect seems to
prevail, whereas at low current densities the CO2 effect dominates. The most
important conclusions are that increase of the rate constant of the RWGS
reaction and reduction of the hydrogen dissociation rate enhances CO2
poisoning effects whereas CO desorption and CO electro-oxidation mitigate
the effects (Janssen, 2004). Janssen (2004) has concluded that the performance
loss due to CO2 is mainly caused by the indirect formation of CO (Eqns 2.24 or
2.25). So, it will be more meaningful to discuss the effect of CO on PEMFC
performance. The active sites covered by CO lowers the performance. Bhatia et
al (2004) found that while hydrogen dilution alone lowers the fractional
coverage on the catalyst surface, it is only when CO is present that the
coverage is lowered to a degree that effects cell voltage (Bhatia et al, 2004).
2.6.3 Improvements in CO and CO2 tolerance of the catalysts
A composite electrode structure was proposed by Yu et al (2002) for improving
CO tolerance of PEMFCs. The electrode structure, as diffusion coefficients of
H2 and CO are different, was designed to make the poisonous CO to react at a
seperate layer with CO active electrocatalyst in advance, and make the main

31
hydrogen to react at another layer with traditional electrocatalyst platinum. It is
important for catalyst layer preparation that the inner catalyst layer should be
rich in platinum and that the outer catalyst layer should be rich in CO tolerant
electrocatalyst, e.g. PtRu/C. With the same catalyst loading, the new composite
electrode has improved cell performance than traditional electrode with PtRu/C
electrocatalyst for both pure hydrogen (since PtRu alloy is not as active as Pt
when pure hydrogen is served as the fuel) and CO/H2 (Yu et al, 2002).
For improving the CO tolerant, Yamada et al (2004) modified Pt/Cs by the
addition of Y2O3, TiO2, Ga2O3, Nb2O5, La2O3, ZrO2, In2O3, Ta2O5 or CeO2.
The addition of Bi was less effective than the former metal oxide additions.
The addition of vanadium and iridium shows no effect on the CO-tolerance.
Among them, the Pt/C modified with niobium oxide and tantalum oxide was
electrochemically tested by conventional cyclic voltammetry using a rotating
electrode. With the addition of these metal oxides to Pt/C, the possibility of
CO-tolerance improvement was also found in the CV measurements (Yamada
et al, 2004).
Hou et al (2003) prepared a CO tolerant electrocatalyst of PtRu-HxMeO3/C.
They found that such a structure promises better CO tolerance than PtRu/C for
lowering the ignition potential to CO oxidation reaction (COOR) and
improving the H2 oxidation reaction current when active sites on noble metals
are blocked by CO. The bifunctional mechanism of COOR is strengthened by
the existence of active water bonded on the transitional metal oxides, and the
anode polarization caused by CO poison is so diminished (Hou et al, 2003).
Papageorgopoulos et al (2002) incorporated Mo to PtRu catalyst and promising
results were attained for PEMFC operation on methanol or reformate gas. The
inclusion of 10wt% Mo in PtRu, led to an electrocatalyst with a higher activity
than PtRu/C in the presence of CO. Also, they found that fuel cell anodes
consisting of carbon supported PtMo (4:1) exhibit enhanced CO tolerance
32
compared to Pt/C and the other binary systems tested, but do not outperform
PtRu/C (Papageorgopoulos et al, 2002).
Divisek et al (1998) showed that PtRu alloy catalysts are the most active ones
to oxidize adsorbed CO and a detailed study on model catalysts with defined Pt
to Ru surface compositions have shown that Pt0.5Ru0.5 has the lowest
overpotential in comparison to pure Pt. The maximum power density of a PEM
single cell in H2/CO using such an anode catalyst is enhanced by a factor of
four compared to Pt. Improved anode catalysts such as PtRu alloys supported
on carbon showed an enhanced CO tolerance up to CO concentrations of 250
ppm (Divisek et al., 1998).
Different catalyst preparation techniques are used in the literature to prepare
the PtRu based catalysts. Luna et al (2000) prepared carbon-supported Pt:Ru
catalysts by using different methods and of all the preparation methods tested,
the one originally proposed by Watanebe, via the formation of a sulfite
complex, gives the best results, provided it is followed by a thermal treatment
in hydrogen atmosphere (Luna et al, 2000). Denis et al (1999) used a ball
milling (BM) process to obtain Pt-Ru unsupported catalyst. The best results
were obtained by milling Pt, Ru and Al in a 1:1:8 atomic ratio. Equivalent
hydrogen oxidation performance and CO tolerance results were obtained for
prepared Pt0.5Ru0.5 catalyst and commercially available catalysts (Denis et al,
1999).
Qi et al (2003) found that even trace amounts of CO in the fuel for a proton
exchange membrane fuel cell (PEMFC) could poison not only the anode,
which is directly exposed to the fuel, but also the cathode, which is separated
from the fuel by a proton exchange membrane; and the performance decline of
the cathode is sometimes more than that of the anode (Qi et al, 2003).

33
To reduce the CO level in the reformate gas a thin catalyst-sheet for PEMFC-
integrated CO oxidation system was developed by Rohland et al (1999). If a
PEMFC-stack is treated with catalyst-sheet in front of the Pt/Ru anode of each
cell, it is enough to lower the CO content by an external CO cleaning device to
1000-2000 ppm CO. The advantage is a better dynamic and a simpler
construction of the H2 producing unit of the PEMFC-plant (Rohland et al,
1999).
Götz et al (1998) found that PtRuW exhibits a higher activity for oxidation of
H2/CO and methanol than both a Pt/Ru catalyst synthesized by the colloid
method and a Pt/Ru catalyst supplied by E-TEK. It is however, far from likely
that ternary catalysts can be a factor of 10 better than binary Pt/Ru catalysts,
which is necessary for commercialization of DMFCs (Götz et al, 1998).
Isono et al (2000) showed that the thickness of the catalyst layer has a
significant effect on anode polarization. The CO tolerance of the PtRu alloy
anode was improved by reducing its thickness from 40µm to 20 µm (Isono et
al, 2000).
CO competes with H2 adsorption on the anode surface. If Langmuir-
Hinshelwood mechanism is assumed for the reactions given below:
CO + * CO* (2.26)
H2 + 2* 2H* (2.27)
where * represents the active sites of the metal, coverages of CO and H2 are as
follows where, KCO = k26 / k -26 and KH = k27/ k -27 are the equilibrium
constants. The ratio of the coverages is:

34
(2.28)
(2.29)
(2.30)
The smaller the difference in the heats of adsorption of CO and hydrogen the
less severe is the CO poisoning. H2 and CO adsorption enthalpies of some
metals are given in Table 2.1.
Table 2.1 H2 and CO adsorption enthalpies of some metals
Metal ∆Had(CO) (kj/mol) ∆Had(H2) (kj/mol)
Ni 120a (@303K) 85a (@303K)
Pt 120 b (@300K) 90c (@403 K)
Ru 120 d (@300K) 65 d (@300K)
a Spiewak and Dumesic, 1998
b King, 1997
c Spiewak et al., 1998
d Londhe and Gupta, 1997
( )
( )( ) 2/1
2/1
2/1
2
2
2
1
1
HHCOCO
HH
H
HHCOCO
COCOCO
PKPK
PK
PKPK
PK
++=
++=
θ
θ
( )
∆−∆−
≈==RT
HH
K
K COadHad
COad
Had
CO
H ,,
,
, expCO coverage
H coverage
θ
θ

35
CHAPTER 3
METHODS FOR CATALYST PREPARATION IN SUPERCRITICAL
CARBON DIOXIDE
3.1 Supercritical fluid properties
The relation between the temperature and the pressure of the pure substance is
given in Figure 3.1. The states for the pure substance are solid, gas and liquid
states. Between the boundaries of the two states, these two states are in
equilibrium. At the triple point shown with “T” in the Figure 3.1
(http://pubs.rsc.org/ej/jm/2000/a906486i/ last accessed at 13.01.2008), three
states exist.
Figure 3.1 Schematic pressure–temperature phase diagram for a pure component showing the supercritical fluid (SCF) region

36
The critical point (C) defines the temperature and pressure at which the vapour
and liquid phases existing in equilibrium have identical properties, so it is the
upper boundary of the vapour-liquid region (Kıran and Brennecke, 1991). A
supercritical fluid (SCF) is a fluid where it is heated and compressed above its
critical point values (Tc, Pc). Close to the critical point, small changes in
pressure or temperature result in large changes in density which allows many
properties to be tuned. The properties are unique and include liquid-like
densities, gas-like viscosities and kinematic viscosities, much higher
diffusivities than liquids and zero surface tension. The physical properties of
gas, liquid and supercritical fluid of a typical organic fluid are given in Table
3.1 (Weibel and Ober, 2003). High diffusivities in SCFs combined with their
low viscosities result in enhanced mass transfer characteristics when compared
to conventional liquid solvents. Better penetration and wetting of pores than
liquid solvents do, is provided by the low surface tension of SCF.
Table 3.1 Physical properties of gas, liquid, and supercritical fluid of typical organic fluid (order of magnitude) Density Diffusivity Dynamic viscosity
(g/ml) (cm2/s) (g/cm s)
Gas 1.10-3 1.10-1 1.10-4 Liquid 1.0 5.10-6 1.10-2 Supercritical fluid 3.10-1 1.10-3 1.10-4
One of the main differences between supercritical fluids and conventional
solvents is their compressibility. Conventional solvents in the liquid phase
require very large pressures to change the density, whereas for supercritical
fluids, very significant changes in density and hence solvating properties can
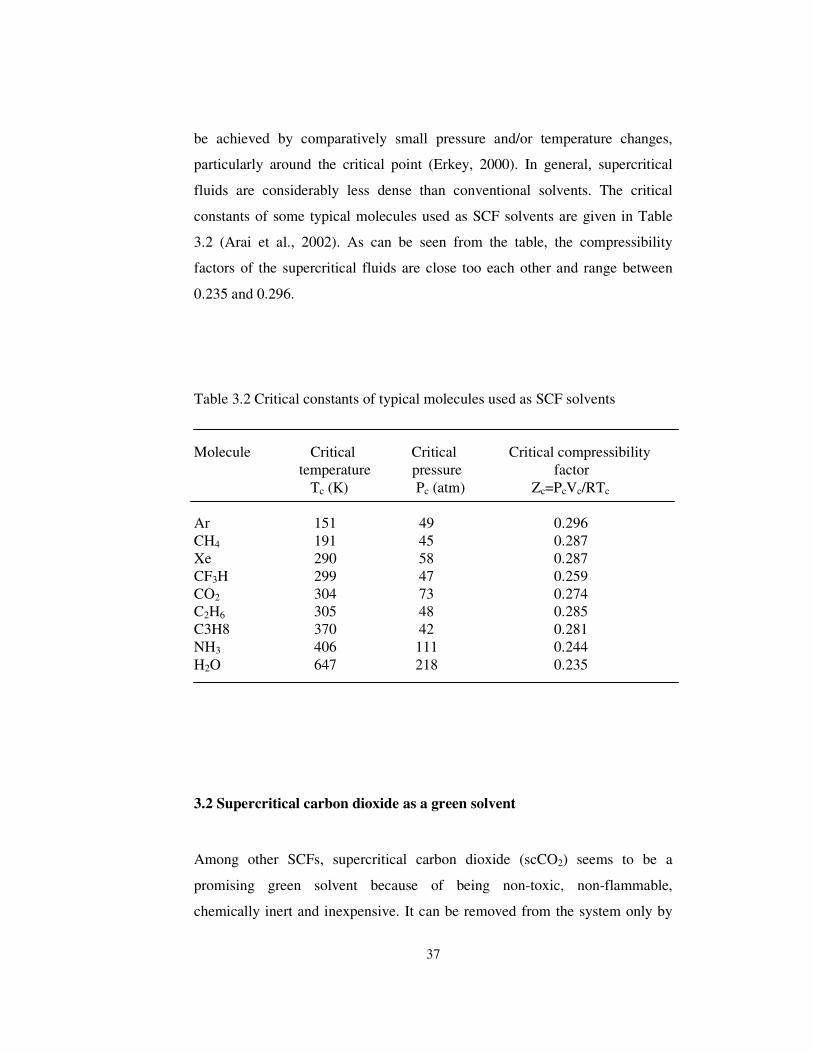
37
be achieved by comparatively small pressure and/or temperature changes,
particularly around the critical point (Erkey, 2000). In general, supercritical
fluids are considerably less dense than conventional solvents. The critical
constants of some typical molecules used as SCF solvents are given in Table
3.2 (Arai et al., 2002). As can be seen from the table, the compressibility
factors of the supercritical fluids are close too each other and range between
0.235 and 0.296.
Table 3.2 Critical constants of typical molecules used as SCF solvents Molecule Critical Critical Critical compressibility
temperature pressure factor Tc (K) Pc (atm) Zc=PcVc/RTc
Ar 151 49 0.296 CH4 191 45 0.287 Xe 290 58 0.287 CF3H 299 47 0.259 CO2 304 73 0.274 C2H6 305 48 0.285 C3H8 370 42 0.281 NH3 406 111 0.244 H2O 647 218 0.235
3.2 Supercritical carbon dioxide as a green solvent
Among other SCFs, supercritical carbon dioxide (scCO2) seems to be a
promising green solvent because of being non-toxic, non-flammable,
chemically inert and inexpensive. It can be removed from the system only by
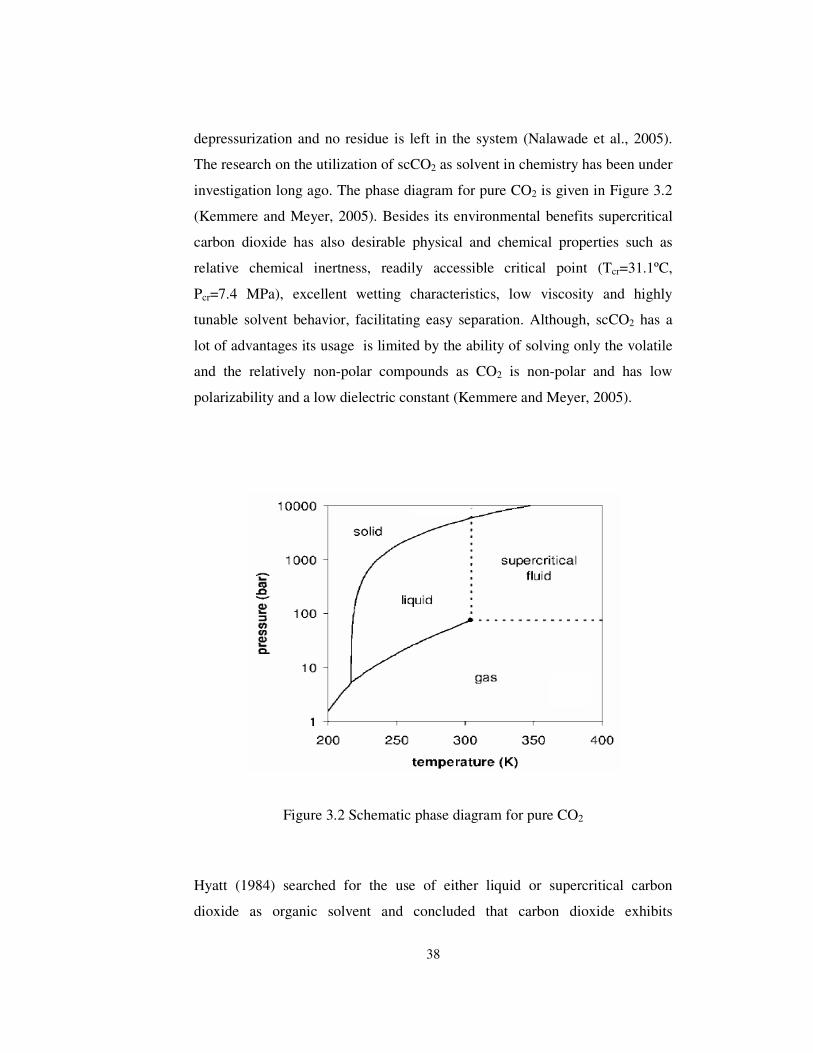
38
depressurization and no residue is left in the system (Nalawade et al., 2005).
The research on the utilization of scCO2 as solvent in chemistry has been under
investigation long ago. The phase diagram for pure CO2 is given in Figure 3.2
(Kemmere and Meyer, 2005). Besides its environmental benefits supercritical
carbon dioxide has also desirable physical and chemical properties such as
relative chemical inertness, readily accessible critical point (Tcr=31.1ºC,
Pcr=7.4 MPa), excellent wetting characteristics, low viscosity and highly
tunable solvent behavior, facilitating easy separation. Although, scCO2 has a
lot of advantages its usage is limited by the ability of solving only the volatile
and the relatively non-polar compounds as CO2 is non-polar and has low
polarizability and a low dielectric constant (Kemmere and Meyer, 2005).
Figure 3.2 Schematic phase diagram for pure CO2
Hyatt (1984) searched for the use of either liquid or supercritical carbon
dioxide as organic solvent and concluded that carbon dioxide exhibits
39
properties typical of hydrocarbon solvents. Leitner (2002), investigated the use
of supercritical carbon dioxide instead of conventional organic solvents in the
synthetic useful reactions and got similar or sometimes even better results with
scCO2.
scCO2 can be used in many fields of chemistry. Some applications can be given
as: extraction (Cirimile et al., 1995; Mulcahey and Taylor, 1992), sterilization
(White et al., 2006), pharmaceutical processing (Subramaniam et al., 1997),
microelectronics (Weibel and Ober, 2003) and catalyst preparation (Lin et al.,
2005) processes.
3.3 Utilization of scCO2 in catalyst preparation
Metal nanoparticles dispersed on high surface area substrates are used widely
as catalysts for a variety of reactions. Carbon supported precious metals, such
as platinum or ruthenium, are very important in fuel cells. There are several
ways of deposition of the metal on carbon support. Among other catalyst
preparation techniques, scCO2 deposition method is also attracting increasing
attention. There are a lot of parameters that affect the catalytic activity of the
catalysts which arise from the catalyst preparation techniques. The impurities
left from the solvent or precursor may influence the catalytic activity in a bad
manner. The particle size of the metal deposited onto the carbon support also
depends on the conditions of the reaction medium and so the preparation
technique.
SC deposition involves the dissolution of an organometallic precursor in a SCF
and the impregnation of the substrate by exposure to this solution. Subsequent
treatment of the impregnated substrate results in metal/substrate
nanocomposites (Saquing et al., 2005). As can be seen from the Figure 3.3
40
(Zhang and Erkey, 2006) there are two pathways to reduce the impregnated
organometallic precursor in its metal form. In the first pathway after the
impregnation the reaction medium depressurized and then the reduction
method applied. In the latter case the reduction can be achieved in the reaction
medium.
Many studies have been devoted to deposit Pt onto different carbon supports.
Lin et al (2005) prepared Pt/CNT nanocomposites as electrocatalysts for low-
temperature fuel cells. They obtained nanostructured and uniform particles and
these particles possessed a higher catalytic activity both for methanol oxidation
and oxygen reduction reaction.
Haji et al (2005) prepared Pt/Al2O3 catalysts by using scCO2 deposition
method. The catalysts were found to be active for hydrodesulfurization of
dibenzothiophene (DBT) dissolved in n-hexadecane (n-HD) without sulfiding
the metal phase.
Different carbon supports such as carbon aerogel which has high surface area
can also be produced by using scCO2 deposition method. Saquing et al (2005)
decorated carbon aerogels with platinum by using scCO2 deposition method,
and they showed that the reduction method for the organometallic precursor to
its metal form also influences the metal loading and the particle size. The metal
particle size and Pt loadings obtained ranged from 1 to 6 nm and 10 to 73 wt.%
Pt, respectively, for different reduction methods.
Instead of organometallic precursors, metal salts dissolved in ethanol (or
methanol) can also be used as the precursor in supercritical deposition method.
With the aid of scCO2, Sun et al (2007) have extended the SCF deposition
method to decorate CNTs with tin oxide using SnCl2·2H2O dissolved in ethanol
as a precursor

41
Figure 3.3 The scheme of using SCF as processing solvent to synthesize supported nanoparticles via deposition or impregnation
Besides being the proton conducting membrane, Nafion solution is also used
for the proton conduction between the catalyst and the electrolyte. Zhang and
Erkey (2005) synthesized the Nafion-platinum-carbon black nanocomposites
by using supercritical deposition. The average particle size obtained was 2.6
nm. They showed that Pt-Nafion-carbon black nanocomposite displayed
promising electroactivity as an electrocatalyst for fuel cells.
One of the most important parameters that affect the metal loading onto the
substrate is the solubility of the metal precursor in the SCF. Zhang et al (2005)
carried out their experiments by using two Ru precursors to deposit on carbon
aerogel, Ru(COD)(tmhd)2 and Ru(acac)3 which have solubilities of 0.0188
mol/l and 0.0025 mol/l, respectively. At the same conditions, the metal

42
loadings obtained were 10.7 and lower than 4% for the high and low solubility
precursors, respectively.
Instead of using carbon supported precious metals, the metal can be deposited
onto the membrane directly without any support. Jiang et al (2005)
impregnated the Nafion membranes with Pd via a supercritical fluid route for
use in direct methanol fuel cells (DMFCs). The fuel cell test results showed
that this kind of impregnated membrane can lower the methanol crossover
which is a main parameter that affects the performance of the DMFCs when
compared to the pure Nafion membrane. Also the performance of the fuel cell
was improved by the use of Pd impregnated membrane.
The adsorption of the precursor from scCO2 phase into the substrate phase is an
important step in SCF impregnation. The equilibrium adsorption isotherm data
of the organometallic precursor (OP)–scCO2–substrate system under
impregnation conditions of constant temperature and pressure provide an
understanding of the interaction between the components involved and how the
metal precursor partitions between the SCF and substrate. The isotherm reflects
the difference between the affinities or strength of interaction of the OP for the
adsorbent and the fluid phases (Zhang and Erkey, 2005). For the definite
temperature and pressure, the maximum metal loading on the substrate can be
controlled thermodynamically by using adsorption isotherms.
43
CHAPTER 4
MICROWAVE IRRADIATION
4.1 Microwave heating theory
Wavelengths of 1 cm to 1 m (300 GHz to 300 MHz) correspond to the
microwave region of the electromagnetic spectrum, and by an international
agreement only the frequencies 2.45 GHz (12.2 cm) and 900 MHz (33.3 cm)
are available for dielectric heating (Tierney and Lidström, 2005). The
improvement with microwave in chemistry is based on the efficient heating of
materials by “microwave dielectric heating” effects (Kappe, 2004).
Microwave heating is fundamentally different from conventional heating. In
microwave processes heat is generated internally within the material instead of
originating from external sources. Briefly, the solvent or the reagent has to be
capable of absorbing the microwave energy and convert it into heat. In
conventional heating the material is heated only on the outside surface, but in
case of microwave heating the microwaves can penetrate materials and heat the
inside and also the outside. Since microwave heating depends on the absorption
ability of the materials, it provides selective heating for different materials.
The conversion of the electromagnetic radiation to thermal energy can be
explained at the molecular level. There are two principle mechanisms proposed
for microwave interaction with matter: dipolar polarization and ionic
conduction.

44
Polar molecules tend to align themselves and oscillate in step with the
oscillating electric field of the microwaves and during this realignment energy
is lost in the form of heat through molecular friction and dielectric loss. The
more polar a molecule, the more effectively the molecule will couple with the
microwave field. On the other hand, ions are charged species that can couple
with the oscillating electrical field of the microwaves. The effectiveness or rate
of microwave heating of an ionic solution is a function of the concentration of
ions in solution. Therefore, rapid heating in a microwave field is caused by the
ability of absorption of the radiation by a material that is placed in the field.
The frequency of the applied field affects the amount of heat generated which
is directly related to the ability of the matrix to align. If the dipole does not
have enough time to realign, or reorients too quickly with the applied field, no
heating occurs. But for the commercial systems where 2.45 GHz frequency is
applied, such extreme cases have not been seen and it provides the molecular
dipole time to align in the field (Kappe, 2004).
In the gas phase, the interaction of the small molecules with permanent dipole
moments with microwave energy shows a well-defined spectrum that may be
used to define the moment of inertia of the molecule. As long as the molecule
has a permanent dipole moment, in this phase the rotation of molecules is
quantized and the transition between the energy levels may be observed as
sharp lines in the microwave spectrum. In liquids, the continuum of rotational
states resulted in frequently interacting molecules and so the phenomenon loses
its identity as a quantum mechanical description and rotational motions become
less distinguishable from translational processes. The rotations at one center
will influence the translational and rotational motions of neighbouring
molecules via intermolecular interactions. The intermolecular perturbations
will be greatest when the intermolecular forces arise from hydrogen bonding
and strong dipole-dipole interactions. It is important to emphasize that
microwave dielectric heating is not a quantum mechanical phenomenon
localized at one molecular center, but is a collective property that occurs in a

45
semi-classical manner and involves aggregates of molecules” (Tierney and
Lidström, 2005).
There are several important parameters related to microwave heating, such as
dielectric loss, dielectric constant and penetration depth. The conversion
capabilities for electromagnetic energy into heat of the materials at a given
frequency and temperature are determined by their loss factors (loss tangent,
tanδ). Also an important parameter in deciding the extent of interaction
between microwave radiation and a particular solvent is the average rotational
frequency or its inverse, the average relaxation time. Debye first proposed that
this relaxation time depends on the size of the molecule and the nature of the
intermolecular forces. A dielectric material is one that contains permanent or
induced dipoles, which when placed between two electrodes the whole
assembly acts as a capacitor, that is if the electrodes are connected by a circuit
the material allows charge to be stored and after the charging no d.c.
conductivity is observed. The polarization of dielectrics results from the finite
displacement of charges or rotation of dipoles in an electric field and must not
be confused with conduction, which results from the translational motion of
electric charges when a field is applied. At the molecular level, polarization
may be associated either with a distortion of the distribution of the electron
cloud of the molecule or the physical rotation dipoles. Dielectric heating in
microwave region is strongly connected with the latter case. The permittivity of
a material, έ, is the property that defines the charge-storing ability of that
material irrespective of the sample’s dimensions. The dielectric constant or
relative permittivity of a material is the permittivity of the material relative to
free space. The angle, δ, represents the angle between the vector for the
magnitude of the total current and the charging current. In other words loss
tangent represents the phase difference between the electric field and the
polarization of the material. The loss tangent can be given by the equation as
follows:

46
tanδ = ε˝/έ (4.1)
where ε˝ and έ represents the loss factor and dielectric constant, respectively
(Copson, 1962).
The relaxation times and dielectric properties of some common organic
solvents are given in Table 4.1 (Tierney and Lidström, 2005). The higher the
loss tangent is the better the conversion of electromagnetic energy into heat.
Table 4.1 Relaxation times (20ºC) and dielectric properties of some organic solvents Solvent Relaxation time τ (ps) Loss tangent at 2.45 GHz H2O 9.04 0.123 MeOH 51.5 0.659 EtOH 170 0.941 Propan-1-ol 332 0.757 Me2SO 20.5 0.825 HCONMe2 13.05 0.161 MeNO2 4.51 0.064 THF 3.49 0.047 CH2Cl2 3.12 0.042 CHCl3 8.94 0.091 MeCOMe 3.54 0.054 MeCO2Et 4.41 0.059 HCO2H 76.7 (25ºC) 0.722 MeCO2H 177.4 (25ºC) 0.174 MeCN 4.47 0.062 PhCN 33.5 0.459 Ethylene Glycol 113 (25ºC) 1.35

47
4.2 Comparison of microwave heating and conventional heating
In conventional heating, heat can be transferred to the material by conduction,
convection or radiation whereas in microwave heating energy is transferred to
the materials through molecular interactions with the electromagnetic field.
The difference between microwave and conventional heating is given in Figure
4.1 as below:
Time
Temperature
Microwave dielectric heating
Conventional heating
Figure 4.1 Differences in the temperature-time profiles for conventional and microwave dielectric heating (Tierney and Lidström, 2005)
The comparison between microwave and conventional heating is as follows:
• Heating rates in microwave are much higher than those can be achieved
conventionally.
• In microwave heating, direct contact between the energy source and the
sample undergoing heating is eliminated. With previous point, very
different temperature-time profiles for the reaction can be achieved and

48
consequently may lead to an alternative distribution of chemical products in
the reaction. Chemicals and the containment materials for chemical
reaction do not interact equally with the commonly used microwave
frequencies for dielectric heating and consequently selective heating may
be achieved.
• Solvents heated under microwave conditions often boil at elevated
temperatures even though they remain contained under 1 atmosphere
pressure.
• In conventional heating, the heating rate is limited by the thermal
conductivity, whereas in microwave heating individual heating of the
molecules is provided. So, the heating times can be reduced to less than 1%
of the conventional heating.
• In microwave heating, heat generation occurs in the product, not at walls or
air, so the heat loss is decreased.
• Using the different absorption capacities of the materials selective heating
can be achieved.
• Shutting on and off of the heating process can be achieved because of the
electromagnetic waves.
• Microwave heating processes are time and energy saving (Tierney and
Lidström, 2005; Robinson et al, 2007).
It is clear that due to the different heating phenomenon, in microwave heating
in different reaction rates and product distributions may result. Metals are not
used in microwave medium because of major sparking and arcing. But the
metals can be used in microwave field as long as they are in powder form. The
selection of the conditions such as low- microwave powers, high boiling point
solvents, high pressures, non-aromatic solvents and small well-dispersed metal
particles, is very crucial for low arcing for microwave synthesis in metal
powder organic solvent system (Tierney and Lidström, 2005).

49
4.3 Catalyst preparation by microwave irradiation
Microwave irradiation has a wide variety of applications in chemistry. Many
chemical reactions can be accelerated by the utilization of the microwave field
which depends on the material having high dielectric constant.
For the supported catalysts the dispersion and the uniform distribution is very
important for the particle size which will affect the catalyst activity. Highly
active Fischer-Tropsch Co/SiO2 catalyst was prepared by microwave
irradiation with a uniform and better dispersion of the Co particles within the
catalyst pellets, compared to that prepared by the conventional heating method
(Reubroycharoen et al, 2007).
Microwave irradiation also can be used for the preparation of the fuel cell
catalysts which require high quality catalyst properties. Tian et al (2006)
synthesized carbon black supported polytetrafluoroethylene (PTFE/C)
nanocomposites by an intermittent microwave irradiation for PEMFCs. They
observed that with the incorporation of the PTFE/C nanocomposite into a
Pt/C/Nafion catalyst, the mass transportation of the catalyst layer enhanced
significantly without any adverse effect on the electrocatalytic activity of the Pt
catalysts.
In microwave heating there are a lot of parameters which will affect the
properties of the material in the microwave oven. Microwave irradiation
duration is one of these parameters which affects the temperature. Wang et al
(2007) varied the microwave irradiation duration between 30-120 s and they
obtained the best electrocatalytic activity by using CV for 90 s with the particle
sizes changing between 3-5 nm.
Microwave irradiation can also be used for the preparation of binary catalysts
which is more suitable for the electrooxidation of methanol than the single Pt/C

50
catalysts. Liu et al (2004) synthesized PtRu nanoparticles supported on Vulcan
XC72 with 2-6 nm particle sizes which showed more electrocatalytic activity
for electro-oxidation of methanol. Also, PtSn/C catalysts with particle sizes of
2-7 nm were synthesized by microwave irradiation for methanol electro-
oxidation (Liu et al, 2006).
To increase the carbon monoxide tolerance of the fuel cells not only binary but
also ternary catalysts can be used which sometimes give better results. Carbon
supported PtAuFe catalyst was prepared via a microwave-irradiated polyol
process which enhanced the CO tolerance of the PEMFCs (Ma et al, 2007).
PtRuIr/C catalyst prepared by microwave irradiation plus annealing synthesis
strategy showed better CO tolerance when compared to the PtRu/C catalysts
(Liang et al, 2006).
In colloidal catalyst preparation methods, a stabilizing agent is used to cover
the metal particle to protect it from agglomeration. This process can also be
used with the combination of the microwave irradiation. Zhao et al (2006)
investigated the effect of addition of the sodium acetate solution as the
stabilizing agent in the synthesis of carbon supported Pt nanoparticles with
microwave irradiation. They demonstrated that the more the stabilizing agent
added the smaller particle sizes were obtained.
Another important parameter for high catalytic activities in fuel cells is
providing higher Pt loadings on the carbon support with small particle sizes.
By using pulse-microwave assisted polyol synthesis Pt loadings as high as 50%
on the carbon support with a small particle size of 2.7 nm was achieved (Song
et al, 2007). Platinum and palladium supported on Vulcan XC72 carbon black
were also prepared by a microwave-assisted polyol process for direct formic
acid fuel cells and Pd/C catalyst gave better electrocatalytic activity (Liu et al,
2006).

51
CHAPTER 5
EXPERIMENTAL STUDIES FOR SUPERCRITICAL CARBON
DIOXIDE DEPOSITION
The supercritical carbon dioxide (scCO2) deposition experiments were
performed in the University of Connecticut Chemical Engineering Department
and the cyclic voltammetry experiments were performed in Connecticut Global
Fuel Cell Center in USA.
Cyclic voltammetry is a commonly used diagnostic tool for the electrocatalyst
layer characterization. The active electrocatalyst layer in a PEM fuel cell
consists of a mixture of carbon-supported Pt and a proton conductive ionomer
such as Nafion. The carbon support provides electrical conduction and also
dispersion of Pt metal and Nafion used as a binder and also it provides the
proton conduction through the layer. The extent of formation of three phase
boundary, where the reactants, ionomer and active catalyst sites are in contact
with each other, affects the electrocatalytic activity of the catalysts.
Electrocatalytic performance of the catalysts can be tested either with fuel cell
or half cell experiments. Half cell experiments can be separated into two as ex
situ or in situ voltammetry experiments. In ex situ experiments the electrodes
were investigated by using a standard three electrode cell configuration with a
liquid acid electrolyte. But in case of in situ experiments a two electrode cell
configuration is used in fuel cell. To determine the ORR kinetics of fuel cell
cathode, nitrogen is fed to the cathode (serves as counter electrode) and
hydrogen fed to the anode (serves as counter/reference electrode). In the
present study ex situ experiments were performed. Half cell experiments are a

52
convenient and relatively fast method of screening electrocatalysts. In this part
of experiments the catalysts prepared by scCO2 deposition were characterized
by XRD, TEM and then tested with ex situ cyclic voltammetry.
5.1 Catalyst preparation by scCO2 deposition
5.1.1 Materials
Carbon supports, Vulcan XC72R (VXR) and Black pearl 2000 (BP2000)
(Cabot International) and multi wall carbon nanotube (MWCNT) (ID=1-3 nm,
OD=3-10 nm, L=0.1-10µm >90%) (Aldrich) were impregnated with Pt and Ru
using the scCO2 deposition method. Dimethyl (cyclooctadiene) platinum (II)
(99.9%) (STREM) (PtMe2COD) and bis (2,2,6,6-tetramethyl-3,5-
heptanedionate) (1,5-cyclooctadiene) Ruthenium (II) (99%) (STREM)
(Ru(COD)(Tmhd)2) were used as Pt and Ru precursors, respectively. Prior to
impregnation all carbon supports were heat treated in a pyrolysis oven at 423 K
for 4 hours in N2 (99.999%, Airgas) atmosphere.
5.1.2 Supercritical carbon dioxide deposition setup
A schematic diagram of the supercritical deposition setup is given in Figure
5.1. The deposition apparatus consists of a 54 ml custom-manufactured
stainless steel vessel equipped with two sapphire windows, 25 mm in diameter,
and sealed with poly ether ether ketone O-rings. A T-type thermocouple
assembly (Omega Engineering, PX300-7.5KGV), a vent line and a rupture disk
assembly (Autoclave Engineers) are also attached to the vessel.

53
Figure 5.1 Experimental setup for supercritical deposition
5.1.3 Experimental procedure
Impregnation of the organometallic precursors depends on the dissolution of
the precursor in scCO2 and then exposure of this solution to the carbon support.
Firstly, the heat-treated carbon support was placed into a pouch made of filter
paper and placed into the vessel together with a certain amount of either
PtMe2COD or Ru(COD)(Tmhd)2 precursors, and a stirring bar. For the desired
metal loading, the amounts of the corresponding precursors were determined
by using the adsorption isotherm of the precursor onto the carbon support
(Zhang et al., 2005). A stainless steel screen was used to separate the stirring
bar from the filter paper pouch. The vessel was sealed and heated to 343 K
using a circulating heater/cooler apparatus (Fisher Scientific Isotemp
Refrigerated Circulator Model 80) and then charged slowly with carbon
dioxide (99.998%, Airgas) to a pressure of 24.2 MPa using a syringe pump
(ISCO, 260D). These conditions were maintained for a period of 6 h which was
enough for the system to reach equilibrium and then the vessel was
Magnetic Stir Plate
Sapphire Window
Vent
PT
TC
Syringe Pump
Vessel
Circulating Heater
CO2
Pouched Filter
paper

54
depressurized. After allowing the vessel to cool, the pouch was removed and
the impregnated carbon support was weighed to determine the amount of
precursor adsorbed using an analytical balance (Adventure Model Ar 2140)
accurate to ±0.1 mg. Subsequently, the carbon support was placed in an
alumina process tube in a tube furnace (Thermolyne 21100), and the Pt and Ru
precursors were reduced thermally under flowing N2 (100 cm3 min-1) for 4 h at
473 K and 673 K.
The kinetics data were obtained by dissolving 100 mg of the Pt precursor in 54
ml scCO2 and exposing this solution to the carbon support for various times
ranging from 1 to 24 h. Adsorption isotherms were obtained by changing the
amount of the organometallic precursor (either Pt or Ru precursor) dissolved in
supercritical carbon dioxide where the carbon support amount was set to 0.1 g.
The adsorption isotherm was obtained by determining the weight change of the
plain supports before and after the exposure to the precursor dissolved in
scCO2. The adsorption data were collected until the saturation was reached. For
all isotherms, temperature and the pressure were set to 343 K and 24.2 MPa. In
case of single adsorption VXR, MWCNT and BP2000 carbon supports were
used. In case of binary adsorption Ru precursor was impregnated onto the
Pt/MWCNT and Pt/BP2000 catalysts at the same conditions as single
adsorption.
Adsorption studies showed that the maximum Pt loading on the carbon support
which could be achieved was 9%. In order to reach higher Pt loadings, another
procedure was followed. The heat treated carbon black was also placed into a
pouch made of a filter paper, and the pouch was placed into the vessel together
with the theoretical amount of the required precursor, depending on the desired
Pt loading. The vessel was heated to 343 K using a circulating heater/cooler
apparatus and then charged slowly with carbon dioxide (99.998%, Airgas) to a
pressure of 13.6 MPa using a syringe pump. These conditions were maintained
overnight and then the temperature was increased to 413 K for 6 h for thermal
55
reduction which caused the pressure to increase 31 MPa. After allowing the
vessel to cool, the pouch was removed and the impregnated carbon black was
weighed to determine the amount of Pt adsorbed. This reduction method
resulted in Pt/VXR (15%) and (35%) catalysts. Further reduction of the
Pt/VXR catalysts taken from the vessel in a tube furnace under flowing N2 did
not make any significant change over the Pt loading.
5.2 Catalyst Characterization
By using scCO2 deposition method Pt/MWCNT (9.9%), Pt/BP2000 (47.5%)
and Pt/VXR (9%) catalysts were prepared and characterized by X-ray
diffraction (XRD) and transmission electron microscopy (TEM) in the as-
synthesized condition with no subsequent cleaning or purification steps and
electrochemically characterized by cyclic voltammetry measurements. The
prepared catalysts were compared with commercially available Pt/C (ETEK,
10%) and Pt/C (Tanaka, 46.5%) catalysts.
5.2.1 X-ray diffraction
XRD measurements were recorded by using a Cu Kα source in a SCINTAG
XDS 2000 diffractometer. The diffractometer was operated in continuous scan
mode at a scan rate of 0.6 deg/min in the range of 5-80o (2θ).
5.2.2 Transmission electron microscopy
TEM samples were produced by dispersing the material ultrasonically in
ethanol, transferring a drop of this suspension onto a copper mesh grid coated

56
with a holey carbon film, and then allowing the ethanol to evaporate. The
sample was examined in a UHR JEOL 2010 FasTEM operating at an
accelerating voltage of 200 kV.
5.2.3 Cyclic voltammetry
The electrochemical characterization of these catalysts was obtained by using
cyclic voltammetry (CV) (Pine Instrument). CV measurements were carried
out in a standard three-electrode electrochemical cell. A silver-silver chloride
electrode (Ag/AgCl, Cl-) was used as the reference which was externally
connected to the cell by a specially designed salt bridge filled with 0.1 M KCl
solution and placed as close as possible to the working electrode to decrease
the ohmic resistance. The possible leakage was checked by measuring the
resistance of the salt bridge in 0.1 M KCl. The obtained value of 100 kOhm
ensured the absence of leakage into the HClO4 solution during the 2-3 hours
necessary to complete the experiment. Pt wire and a glassy carbon (GC)
electrode (5 mm in diameter) were used as the counter and working electrodes,
respectively. The catalyst solutions were prepared by mixing measured
amounts of either the commercial or the synthesized catalysts with 1 ml
deionized water, 1 ml 1,2-propandiol and 400 µL % 5 wt Nafion solution (Ion
Solutions Inc.). The amount of the catalyst in solution was in the range of 22-
25 mg, which correlates to the Pt loading in the support. In all experiments the
catalyst loading on the GC electrode was set to 28 µgPt cm-2. The suspension
was homogenized for 1 h using an homogenizer (Ultra-Turrax® T25) followed
by deposition of 5.8µl of this solution onto the GC electrode and overnight
drying.
CV data were collected in a 0.1 M HClO4 electrolyte saturated with hydrogen
for 30 min to remove the oxygen. Prior to the experiments the hydrogen supply

57
tube was taken out of the solution and placed on the top of the electrolyte
solution. All the experiments were performed at room temperature. After 10
cycles between 0.0-0.8 V at a scan rate of 50 mV s-1, the stabilized CV curves
were recorded. In all the figures CV data are given with respect to normal
hydrogen electrode (NHE). Tto determine the oxygen reduction reaction
(ORR) kinetics, firstly the electrolyte was saturated with oxygen for 30 min
and the rotation speed was varied between 100 and 2500 rpm. The
hydrodynamic voltammograms were recorded in the range of 0.0-0.8 V at a
scan rate of 10 mV s-1 in order to prevent the oxidation of the carbon support
that usually occurs at 1.2 V (Gasteiger et al., 2004). Calculation of
electrochemical surface area (ESA) was performed by using the area under the
reduction part of the curve according to the equation given elsewhere
(Smirnova et al., 2005).
5.3 Scope of the experiments
Supercritical carbon dioxide deposition method was used to prepare Pt and
PtRu based electrocatalysts which were then characterized by XRD, TEM and
CV. Table 5.1 shows the catalyst preparation conditions and the tests
performed to the catalysts prepared.

58
Table 5.1 Catalyst preparation conditions and tests performed to the catalysts prepared by scCO2
Support Precursor Catalyst Tests
performed
T (K) P
(MPa)
VXR PtMe2COD Pt/VXR (9%) Adsorption
kinetics, XRD,
TEM, CV
343 24.3
VXR PtMe2COD Pt/VXR (15%) XRD, TEM,
CV
343
413
13.6
31.0
VXR PtMe2COD Pt/VXR (35%) XRD, CV 343
413
13.6
31.0
MWCNT PtMe2COD Pt/MWCNT
(15%)
Adsorption
kinetics, XRD,
TEM, CV
343 24.3
BP2000 PtMe2COD Pt/BP2000
(47.5%)
Adsorption
kinetics, XRD,
TEM, CV
343 24.3
VXR Ru(COD)(Tmhd)2 Ru/VXR Adsorption
kinetics
343 24.3
MWCNT Ru(COD)(Tmhd)2 Ru/MWCNT Adsorption
kinetics
343 24.3
BP2000 Ru(COD)(Tmhd)2 Ru/BP2000 Adsorption
kinetics
343 24.3
Pt/MWCNT Ru(COD)(Tmhd)2 PtRu/MWCNT Adsorption
kinetics
343 24.3
Pt/BP2000 Ru(COD)(Tmhd)2 PtRu/BP2000 Adsorption
kinetics
343 24.3

59
CHAPTER 6
EXPERIMENTAL STUDIES FOR MICROWAVE IRRADIATION
The microwave irradiation experiments were performed at METU Fuel Cell
Research Laboratory. After the preparation of the catalysts, these catalysts
were characterized by using XRD (METU, Metallurgical Engineering) and
XPS (METU, Central Laboratory). The fuel cell tests were also performed in
Fuel Cell Research Laboratory by using the home made test station.
The full fuel cell test which gives the voltage-current density relationship is the
primary technique for the characterization of fuel cell performance. The
performance of a fuel cell (geometry, catalyst/electrode characteristic, and
electrolyte/membrane properties) under specified operating conditions
(concentration, flow rate, pressure, temperature and relative humidity) is a
function of the kinetic, ohmic and mass transfer resistances. The performance
curve obtained gives information about the cell losses under the operating
conditions. For better characterization of the fuel cell, the effects of both
system components and operating conditions have to be analyzed by
performance curves (Cooper et al., 2005). Because by using performance
curves of fuel cells one can determine which performance loss dominates, and
draw a new route to compensate the inverse effect.

60
6.1 Catalyst preparation
6.1.1 Materials
Carbon blacks (Cabot International); Black Pearl 2000 (BP2000), Regal 330
(Regal), Vulcan XC72 (pelleted, VX) which have different surface areas 1450,
94, 254 m2/g, respectively, were used as the carbon support material. As
platinum and ruthenium precursors hexachloroplatinic acid (H2PtCl6) and
ruthenium (III) chloride (RuCl3) (Aldrich) were used. As the surfactant, 3-N-N
dimethyldodecylammonio-propanesulfonate (SB12) (Fluka) was used. KOH
(Merck) was used as the base and ethylene glycol (Merck) was used as the
reducing agent. All the materials were used as received, no further treatment
was applied. In the catalyst preparation a domestic microwave oven (Akai,
2450 MHz, 800 W) was used. The commercial Pt (20% Pt/C, ETEK) and PtRu
based (20 and 40% PtRu/C, ETEK) catalysts were selected for comparison.
6.1.2 Experimental procedure
Pt/VX, Pt/BP2000, Pt/Regal and PtRu/VX catalysts were prepared by using
microwave heating of ethylene glycol solutions of the metal precursors. At
first, 0.05 M aqueous solutions of metal precursors were prepared. A required
volume of these solutions which corresponds to the desired Pt loading was
mixed with 50 ml ethylene glycol (EG) in a 100 ml beaker. The base
concentration of the solution was adjusted by using 0.4 M KOH solution. Then,
0.1 g carbon black was added to the solution. After ultrasonication for half an
hour, the mixture was put in the center of the microwave oven and heated for
30-120 s by means of a 800 W microwave power. The resulting suspension
was cooled immediately, and then filtered and the residue was washed with
acetone. The solid product was dried at 373 K overnight in a vacuum oven. The
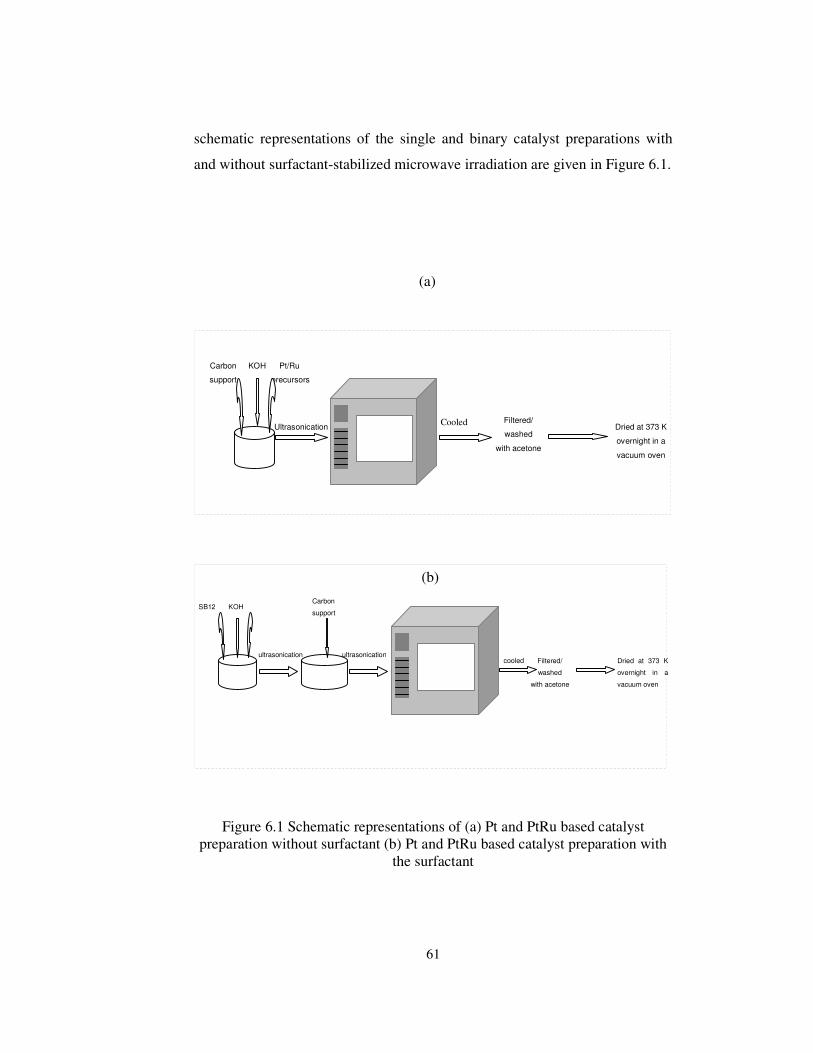
61
schematic representations of the single and binary catalyst preparations with
and without surfactant-stabilized microwave irradiation are given in Figure 6.1.
(a)
Figure 6.1 Schematic representations of (a) Pt and PtRu based catalyst preparation without surfactant (b) Pt and PtRu based catalyst preparation with
the surfactant
Cooled Filtered/
washed
with acetone
Pt/Ru
precursors
Dried at 373 K
overnight in a
vacuum oven
Ultrasonication
KOH Carbon
support
(b)
KOH SB12 Carbon
support
ultrasonication ultrasonication cooled Filtered/
washed
with acetone
Dried at 373 K
overnight in a
vacuum oven

62
6.2 Catalyst characterization
6.2.1 X-ray diffraction
In order to identify the crystalline phases, X-ray diffraction technique was
used. The Rigaku D/MAX2200 diffractometer with a CuKα radiation source
was used for the analysis. The scanning range of 2θ was set between 15º to 85º
with a step size of 0.01º.
6.2.2 X-ray photoelectron spectroscopy
The valence states of Pt and Ru were investigated in UNI-SPECS ESCA
system (Specs GMBH., Germany) with monochromotor, using Mg Ko
(λ=1253.6 eV) as the X-ray source. A computer program (XPSPeak4.1) was
used to analyze the XPS data by background subtraction (Shirley method) and
curve fitting for the studied envelopes.
6.3 PEM fuel cell tests
Before passing through the PEM fuel cell tests, the main part of the fuel cell
consisting of the membrane electrode assembly was prepared. The procedure
includes firstly the preparation of the catalyst ink and then MEAs were
prepared by spraying method developed in the fuel cell laboratory. After the
MEA preparation the single PEM fuel cell is constructed. The fuel cell tests
were performed by using the home made fuel cell test station.

63
6.3.1 Catalyst ink preparation
The catalyst ink contains catalyst, 2-propanol, deionized water and Nafion
solution. In the catalyst ink 2-propanol: deionized water ratio is 2:1.The
platinum loading is 0.4 mg Pt cm-2, (20% Pt/C, ETEK) whereas Nafion (5%
Nafion solution, Ion Power) loading is 30% on a dry basis. In case of the
binary catalysts, the PtRu loading is 0.4 mg PtRu/cm2. The required amounts of
these chemicals were weighed and then mixed together. After preparation of
this mixture it was stirred in an ultrasonic stirrer for at least 1 hour. The Pt
based catalysts prepared by microwave irradiation are used as cathode catalysts
where the anode side catalyst was commercial Pt/C (ETEK, 20%) catalyst. The
PtRu based catalysts prepared by microwave irradiation are used as anode
catalysts where in this case the cathode side catalyst was commercial Pt/C
(ETEK, 20%) catalyst. For comparison commercial binary PtRu/C (ETEK,
20% and 40%) catalysts are also used as anode electrode.
6.3.2 Membrane Electrode Assembly Preparation
In its simplest form, the membrane electrode assembly (MEA) consists of a
membrane, two active catalyst layers, and two gas diffusion layers (GDL).
Presently, two MEA preparation techniques have been used which are given in
Figure 6.2. In Mode 1 the catalyst ink is directly applied on GDL. The prepared
catalyst ink was sprayed directly on the treated GDL until the required Nafion
and platinum loading was attained and then these catalyst coated GDLs were
hot pressed at 403 K, 172 N/cm2 for 3 minutes onto the membrane and this is
the method to obtain 5 layer MEA (Bayrakçeken et al., 2007).
Mode 2 is the application of catalyst directly on to the membrane. The prepared
catalyst ink was sprayed onto the Teflon blanks which were as long as the size
of electrode active area. After this application Teflon blanks were hot pressed

64
on the membrane at the conditions mentioned in Mode 1 and then cooled for 30
minutes (Yazaydin, 2003). The MEA obtained from this method was a 3 layer
MEA which did not include GDLs. So GDLs were added later. Catalyst ink
was either sprayed onto GDL or Teflon blank by a spray gun. Previous studies
showed that the reproducibility of Mode 2 was very low. So, for all the
experiments, Mode 1 MEA preparation technique was used.
Figure 6.2 Flow chart for MEA preparation techniques
Then, this catalyst solution was sprayed onto the gas diffusion layer (GDL 31
BC, from SGL Carbon, Germany). After hot-pressing of these GDLs onto the
Nafion 112 (50 µm nominal thickness) membrane five layer MEA was
obtained.
MEA Preparation Techniques
Application of catalyst to GDL
Mode 1 Mode 2
Preparation of catalyst
solution
Preparation of catalyst
GDL
Spraying
Catalysed GDL
Pressing
Membrane
MEA1
Spraying
Catalysed Teflon blanks
Membrane
Pressing
MEA2
MEA
Preparation of catalyst
solutionTeflon blanks
Application of catalyst to membrane

65
6.3.3 Single PEM Fuel Cell Construction
The prepared MEA is placed into the commercially available PEM fuel cell
hardware (Electrochem, FC05-01 SP REF) which had an electrode active area
of 5 cm2. In this hardware the gas distribution plates were made of graphite
with four channel serpentine flow channels and the current collection was
achieved by using the coated metal. The MEA was placed between the two
graphite plates and then they were covered by current collectors. The single
PEM fuel cell sealing and the compression are very important. If sealing had
failed hydrogen and oxygen gases would be mixed and since there is catalyst
MEA could burn resulting in the burning of the MEA. Silicone (0.2 mm)
gaskets are used to prevent the gas leakage. The torque was adjusted to 1.7 Nm
diagonally on each bolt by a torque wrench.
6.3.4 Fuel Cell Test Station
The fuel cell tests were performed in a home made fuel cell test station which
is shown in Figure 6.3. The test station is suitable for testing single fuel cells
and also short stacks. The reactant gas flow rates are adjusted with mass flow
controllers (Aalborg GFC 171). There are four mass flow controllers in the
system by which the flow rates of H2, O2, CO and CO2 can be adjusted. So, by
using the mass flow controllers, the simulated reformate gas composition can
be prepared. Prior to entering the fuel cell, these gases were humidified by
passing them through the water columns contained in stainless steel cylinders
and heated with resistance heaters. The stainless steel gas lines were heated to
prevent the condensation of the water in the lines. The temperature in the
humidifiers, gas lines and fuel cell were controlled by PID temperature
controllers (GEMO DT442) and K type thermocouples. The purge gases left
through the water columns placed at the exit of the fuel cell.
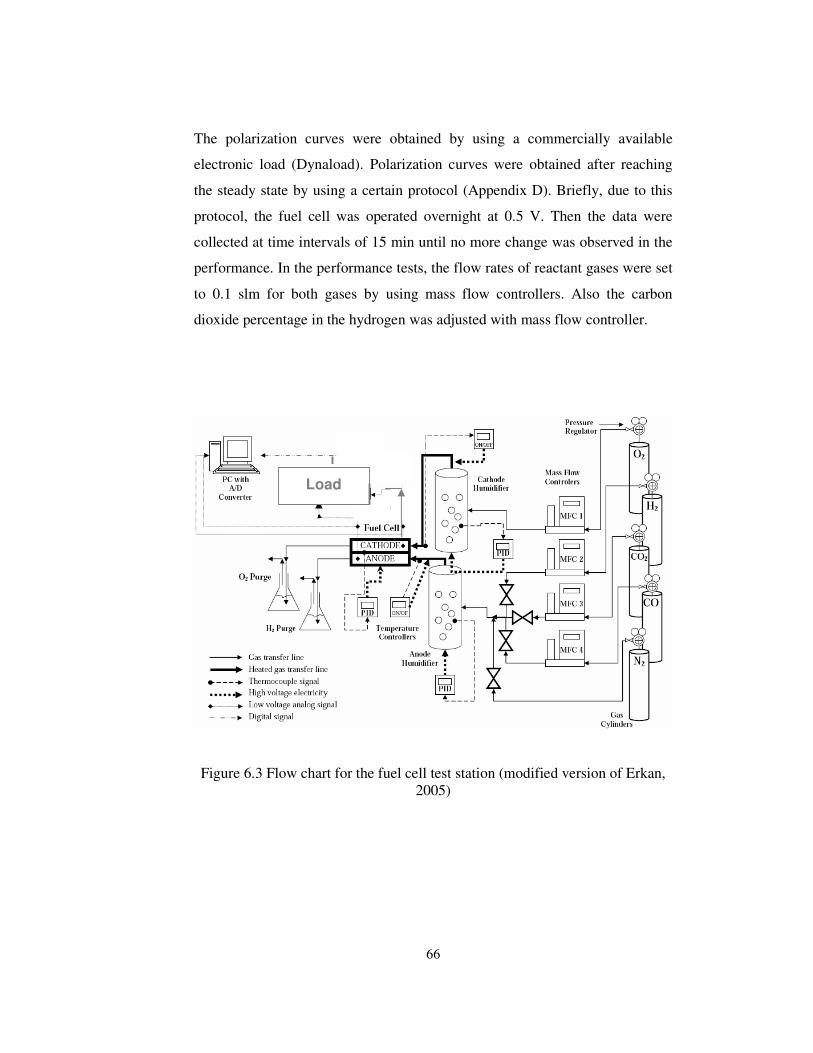
66
The polarization curves were obtained by using a commercially available
electronic load (Dynaload). Polarization curves were obtained after reaching
the steady state by using a certain protocol (Appendix D). Briefly, due to this
protocol, the fuel cell was operated overnight at 0.5 V. Then the data were
collected at time intervals of 15 min until no more change was observed in the
performance. In the performance tests, the flow rates of reactant gases were set
to 0.1 slm for both gases by using mass flow controllers. Also the carbon
dioxide percentage in the hydrogen was adjusted with mass flow controller.
Figure 6.3 Flow chart for the fuel cell test station (modified version of Erkan, 2005)
Load

67
6.4 Scope of the experiments
By using microwave irradiation method the Pt and PtRu based catalysts given
in Table 6.1 were prepared by changing the microwave duration, carbon black,
base concentration and surfactant/precursor (S/Pt) ratios.
Table 6.1 Catalysts prepared by microwave irradiaiton
Catalyst Initial
Pt (%)
BC
(g/l)
Microwave
duration (s)
S/Pt Tests performed
Pt/VX 20 0.14 50 0 XRD, PEMFC
Pt/VX 20 0.27 50 0 XRD
Pt/VX 20 0.54 50 0 XRD, XPS, PEMFC
Pt/VX 20 0.14 30 0 XRD
Pt/VX 20 0.14 60 0 XRD, PEMFC
Pt/VX 20 0.14 90 0 XRD, PEMFC
Pt/VX 20 0.14 120 0 XRD, PEMFC
Pt/Regal 20 0.54 50 0 XRD, XPS, PEMFC
Pt/BP2000 20 0.54 50 0 XRD, XPS, PEMFC
PtRu/VX 30 0.54 50 0 XRD, PEMFC
Pt/VX (SB12) 20 0.54 50 10 XRD, PEMFC
Pt/VX (SB12) 20 0.54 50 40 XRD, PEMFC
PtRu/VX (SB12) 30 0.54 50 80 XRD, PEMFC
MEAs were prepared by using Pt based catalysts as cathode electrodes where
the anode side was commercial ETEK catalyst (20% Pt/C). In case of prepared
PtRu based catalyst, these prepared catalysts were used as anode electrode and
the cathode was also commercial ETEK catalyst (20% Pt/C). It is known that
the dilution of the input gases entering the fuel cell has an adverse effect on
fuel cell performance. To eliminate this effect in carbon dioxide experiments,
68
the hydrogen flow rate was set to 0.1 slm and the percentage of CO2 was varied
by taking into account this value. To see the CO2 effect on PEMFC
performance a commercially available MEA was used (Electrochem MEA) and
the amount of CO2 was varied from 0 to 50%. For the testing of the binary
PtRu/C catalysts the percentage of CO2 gas was set to 30%. The cell
temperature, and also the anode and cathode humidification temperatures were
set to 700C in all the experiments. To eliminate the condensation of the
humidified gases, the inlet gas lines were heated to 720C.

69
CHAPTER 7
RESULTS AND DISCUSSION OF THE CATALYSTS PREPARED BY
SUPERCRITICAL CARBON DIOXIDE DEPOSITION
7.1 Adsorption kinetics of Pt and Ru organometallic precursors on
different carbon supports
Decoration of the support materials with either Pt or Ru nanoparticles were
achieved by the dissolution of the organometalic precursors in the scCO2 and
then exposure to the carbon substrates. After reduction of the precursors to
their metallic form, metal/support nanocomposites were obtained. In this
aspect, the adsorption phenomenon is very crucial for the control of the metal
loading onto the substrate. By changing the adsorption conditions and the
amount of the precursor dissolved in scCO2, one can control the metal loading
(Saquing et al., 2005). Pt based catalysts were prepared by dissolving Pt
precursor in the scCO2 and then exposure to the carbon supports of VXR,
MWCNT and BP2000. For PtRu based catalysts, Ru precursor was dissolved
in the scCO2 and then exposure to the Pt/MWCNT and Pt/BP2000 catalysts. It
was observed that the adsorption phenomena for the Pt and PtRu based
adsorption show some differences.
The carbon supports used in the experiments had a wide range of surface area
and pore size distributions. The surface area properties of carbon supports used
in the scCO2 deposition experiments are summarized in Table 7.1. The carbon
supports of VXR, BP2000 and MWCNT were used in the experiments. As can

70
be seen from the table these carbon supports have different total surface areas,
macro/meso and microporous areas.
Table 7.1 Surface area properties of carbon supports used in the present experiments and previous studies Support Stot (m
2/g) Smeso/macro (m2/g) Smicro (m
2/g) BP2000a 1450 515 935 MWCNT 300 -- -- VXRb 232 145 87 CA4c 741 489 252 CA22c 670 437 233
aKruk et al,1996 bYu, 2005 cSaquing et al., 2005
Kinetics of the the Pt/VXR is shown in Figure 7.1. Figure 7.1 illustrates the
adsorption kinetics of Pt precursor on VXR. The experiments were conducted
at 343 K and 24.2 MPa. This figure indicates that uptake reached to a steady
state value after 6 hours. So, the adsorption experiments were performed for
this time period.
An adsorption process is influenced by support-precursor interactions and
adsorption conditions. The metal loading can be controlled by adsorption
process, so that for catalyst preparation it is especially very crucial. The
adsorption isotherm was obtained at 343 K and 24.2 MPa. The adsorption

71
isotherm for CODPtMe2, scCO2 and different carbon supports is given in
Figure 7.2. As can be seen from Figure 7.2 uptake of precursor strongly
depends on the type of the supports which have different surface areas and pore
size distributions, adsorption behavior and so the metal loading changed
significantly. The higher the uptakes were, the higher the platinum loadings
obtained. The platinum loadings were 9, 15 and 47.5% for Pt/VX, Pt/MWCNT
and Pt/BP2000, respectively. The adsorption isotherm showed the partitioning
of the Pt precursor between the carbon support and scCO2. These isotherms
were fitted to Langmuir type model as given below:
cK
cQKq
1
01
1 += (7.1)
where K1 (g scCO2/mg precursor) is the Langmuir adsorption constant, Qo (mg
precursor/g support) is the adsorption capacity, c (mg precursor/g scCO2) is the
solution concentration and q (mg precursor/g support) is the uptake by the
adsorbent. After the regression, the Langmuir equilibrium constants obtained
for this system are given in Table 7.2.
Qo, is the maximum number of the available sorption sites that the carbon
supports can supply for the Pt precursor molecules in case of the Langmuir
isotherm. The adsorption capacity of CODPtMe2 on carbon support, Qo, is
increased by the increasing surface areas. Although the difference between the
surface area of the VXR and MWCNT was not doubled as given in Table 7.1,
Qo value of MWCNT was twice of VXR. This indicates that available sorption
sites of MWCNT are higher than that of VXR. K1 Qo value is a measure of the
relative affinity of the solute towards the surface of the adsorbent. High K1 Qo
values indicate that the CODPtMe2 has more affinity for carbon supports than
scCO2.

72
Time, h
0 5 10 15 20 25 30
Up
take
, m
g C
OD
PtM
e2/g
C
0
20
40
60
80
100
120
140
160
Figure 7.1 Equilibrium curve for Pt/VXR
Concentration in CO2, mg CODPtMe
2/g scCO
2
0 2 4 6 8 10
Up
take, m
g C
OD
PtM
e2/g
C
0
200
400
600
800
1000
1200
1400
Pt/BP2000
Pt/MWCNT
Pt/VXR
Figure 7.2 Adsorption isotherms of CODPtMe2 , scCO2 on different carbon supports in scCO2 (lines represents Langmuir (Eqn 7.1) fits for the
corresponding catalysts)
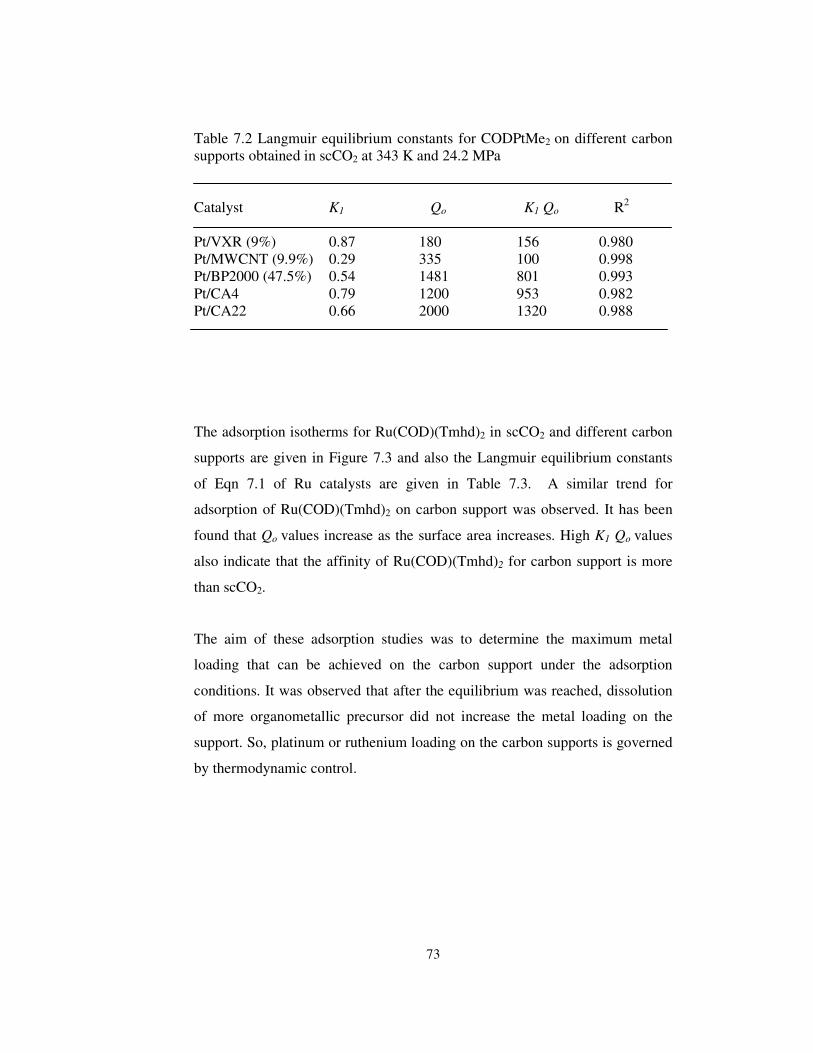
73
Table 7.2 Langmuir equilibrium constants for CODPtMe2 on different carbon supports obtained in scCO2 at 343 K and 24.2 MPa Catalyst K1 Qo K1 Qo R2 Pt/VXR (9%) 0.87 180 156 0.980 Pt/MWCNT (9.9%) 0.29 335 100 0.998 Pt/BP2000 (47.5%) 0.54 1481 801 0.993 Pt/CA4 0.79 1200 953 0.982 Pt/CA22 0.66 2000 1320 0.988
The adsorption isotherms for Ru(COD)(Tmhd)2 in scCO2 and different carbon
supports are given in Figure 7.3 and also the Langmuir equilibrium constants
of Eqn 7.1 of Ru catalysts are given in Table 7.3. A similar trend for
adsorption of Ru(COD)(Tmhd)2 on carbon support was observed. It has been
found that Qo values increase as the surface area increases. High K1 Qo values
also indicate that the affinity of Ru(COD)(Tmhd)2 for carbon support is more
than scCO2.
The aim of these adsorption studies was to determine the maximum metal
loading that can be achieved on the carbon support under the adsorption
conditions. It was observed that after the equilibrium was reached, dissolution
of more organometallic precursor did not increase the metal loading on the
support. So, platinum or ruthenium loading on the carbon supports is governed
by thermodynamic control.

74
Concentration in CO2, mg Ru(COD)(Tmhd)
2/g scCO
2
0 1 2 3 4 5
Up
take, m
g R
u(C
OD
)(T
mhd) 2
/g C
0
100
200
300
400
500
600
Ru/BP2000
Ru/MWCNT
Ru/VXR
Figure 7.3 Adsorption isotherms for Ru(COD)(Tmhd)2, scCO2 on different carbon supports at 343 K and 24.2 MPa (lines represents Langmuir (Eqn 7.1)
fits for the corresponding catalysts)
Table 7.3 Langmuir equilibrium constants for Ru(COD)(Tmhd)2 on different carbon supports in scCO2 at 343 K and 24.2 MPa Catalyst K1 Qo K1 Qo R2 Ru/VXR 3.32 80 258 0.974 Ru/MWCNT 0.87 169 147 0.984 Ru/BP2000 2.58 572 1476 0.985 Ru/CA4 4.02 175 704 0.930 Ru/CA22 2.08 499 1039 0.981
The adsorption capacities for different carbon supports against the mesoand
macro surface area and total surface area are given in Figures 7.4 and 7.5,
respectively.
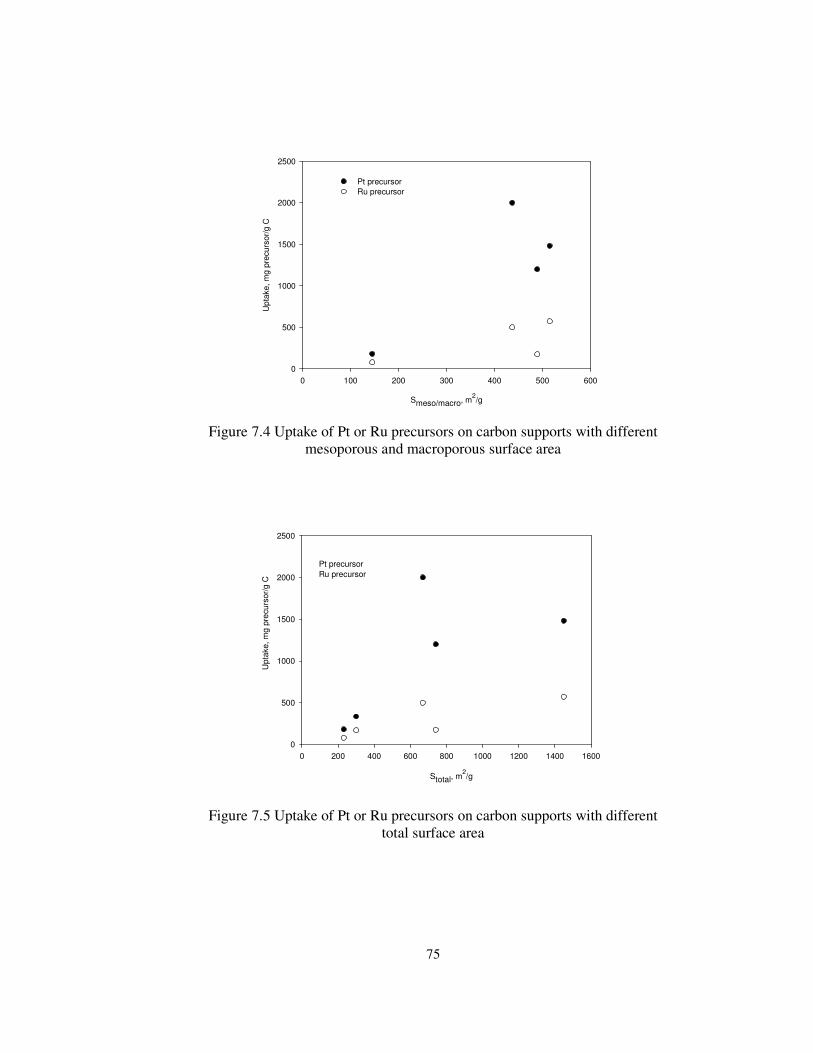
75
Smeso/macro, m2/g
0 100 200 300 400 500 600
Up
take,
mg
pre
curs
or/
g C
0
500
1000
1500
2000
2500
Pt precursor
Ru precursor
Figure 7.4 Uptake of Pt or Ru precursors on carbon supports with different mesoporous and macroporous surface area
0 200 400 600 800 1000 1200 1400 1600
0
500
1000
1500
2000
2500
Pt precursor
Ru precursor
Stotal, m2/g
Upta
ke,
mg p
recu
rsor/
g C
Figure 7.5 Uptake of Pt or Ru precursors on carbon supports with different total surface area
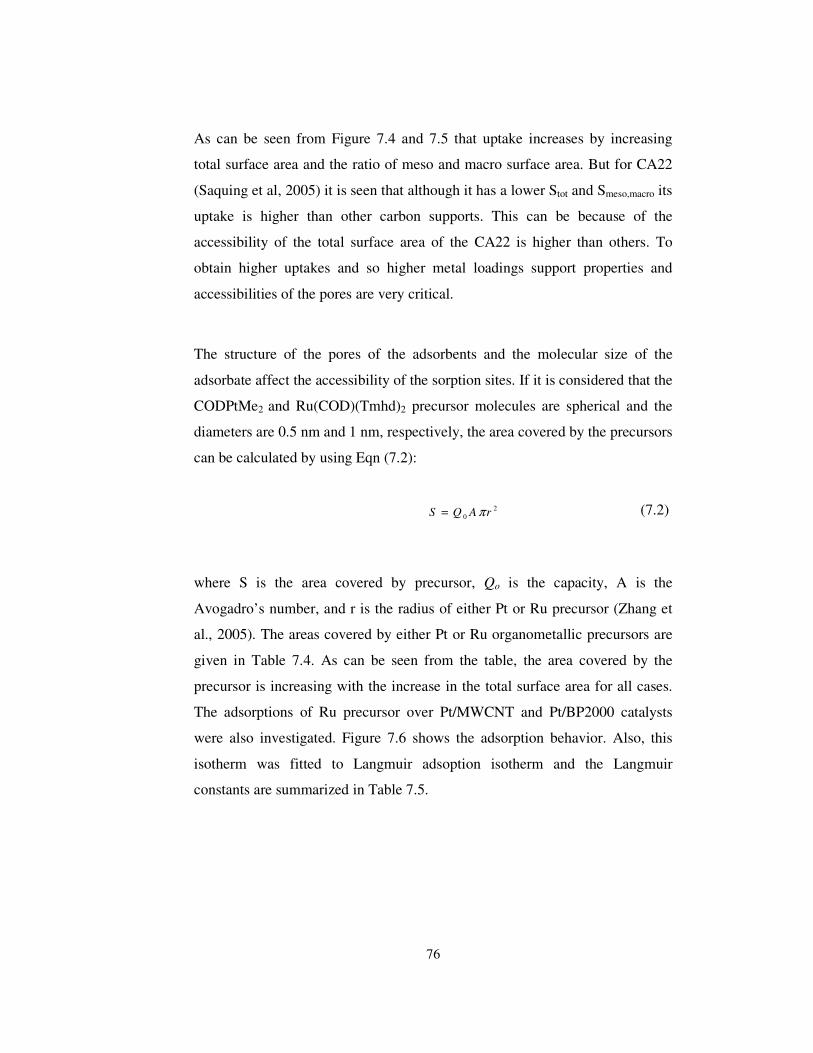
76
As can be seen from Figure 7.4 and 7.5 that uptake increases by increasing
total surface area and the ratio of meso and macro surface area. But for CA22
(Saquing et al, 2005) it is seen that although it has a lower Stot and Smeso,macro its
uptake is higher than other carbon supports. This can be because of the
accessibility of the total surface area of the CA22 is higher than others. To
obtain higher uptakes and so higher metal loadings support properties and
accessibilities of the pores are very critical.
The structure of the pores of the adsorbents and the molecular size of the
adsorbate affect the accessibility of the sorption sites. If it is considered that the
CODPtMe2 and Ru(COD)(Tmhd)2 precursor molecules are spherical and the
diameters are 0.5 nm and 1 nm, respectively, the area covered by the precursors
can be calculated by using Eqn (7.2):
20 rAQS π= (7.2)
where S is the area covered by precursor, Qo is the capacity, A is the
Avogadro’s number, and r is the radius of either Pt or Ru precursor (Zhang et
al., 2005). The areas covered by either Pt or Ru organometallic precursors are
given in Table 7.4. As can be seen from the table, the area covered by the
precursor is increasing with the increase in the total surface area for all cases.
The adsorptions of Ru precursor over Pt/MWCNT and Pt/BP2000 catalysts
were also investigated. Figure 7.6 shows the adsorption behavior. Also, this
isotherm was fitted to Langmuir adsoption isotherm and the Langmuir
constants are summarized in Table 7.5.
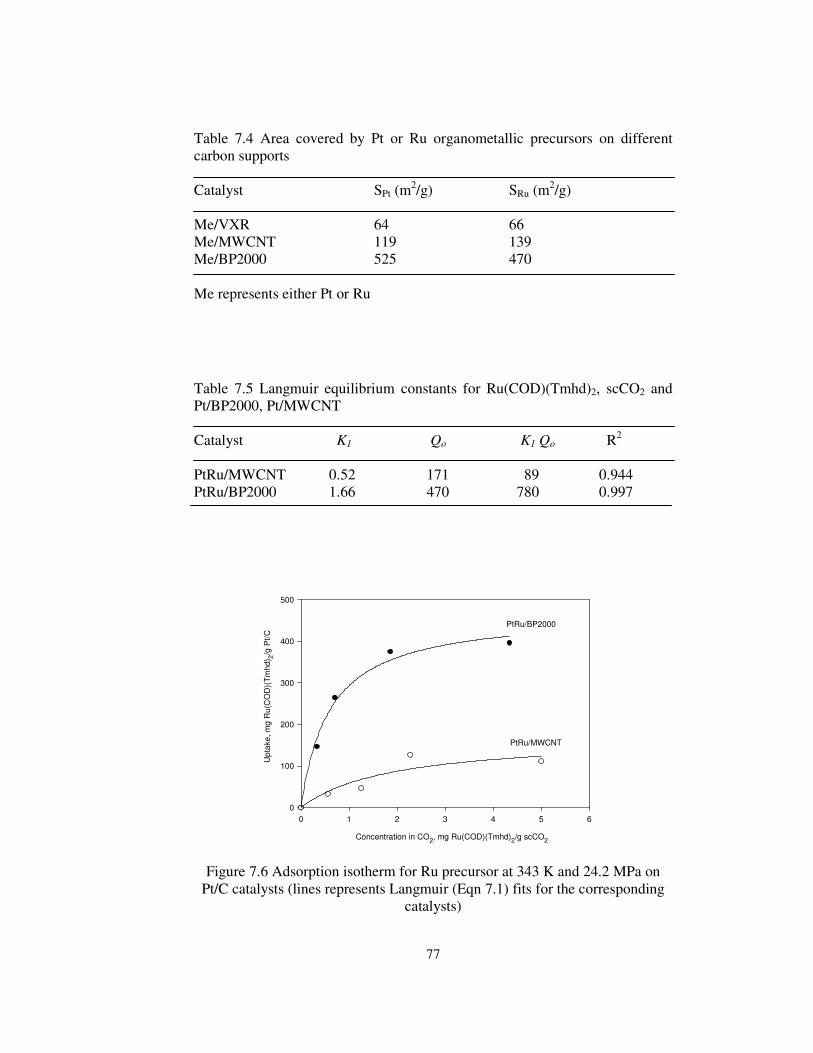
77
Table 7.4 Area covered by Pt or Ru organometallic precursors on different carbon supports Catalyst SPt (m
2/g) SRu (m2/g)
Me/VXR 64 66 Me/MWCNT 119 139 Me/BP2000 525 470 Me represents either Pt or Ru
Table 7.5 Langmuir equilibrium constants for Ru(COD)(Tmhd)2, scCO2 and Pt/BP2000, Pt/MWCNT Catalyst K1 Qo K1 Qo R2 PtRu/MWCNT 0.52 171 89 0.944 PtRu/BP2000 1.66 470 780 0.997
0 1 2 3 4 5 6
0
100
200
300
400
500
Concentration in CO2, mg Ru(COD)(Tmhd)
2/g scCO
2
Up
take,
mg
Ru(C
OD
)(T
mhd) 2
/g P
t/C
PtRu/BP2000
PtRu/MWCNT
Figure 7.6 Adsorption isotherm for Ru precursor at 343 K and 24.2 MPa on Pt/C catalysts (lines represents Langmuir (Eqn 7.1) fits for the corresponding
catalysts)

78
7.2 XRD and TEM results
The XRD spectra for the prepared and commercial catalysts are presented in
Figure 7.7 (a). For all catalysts the characteristic {111}, {200}, {220} peaks
for face-centered cubic (fcc) Pt were obtained. Since the {111}, and {200} Pt
peaks overlapped, to produce the broad C peaks, the sizes of the Pt particles
were calculated from the Scherrer equation using the half-full-width at half
maximum of the {220} reflection (Zhao et al., 2006). Sample calculation is
given in Appendix A. High-resolution XRD spectra obtained over the range 2θ
= 60˚-80˚ from the catalysts ETEK Pt/C, Tanaka Pt/C, Pt/MWCNT and
Pt/BP2000, Pt/VXR are given in Figures 7.7 (b) and (c), respectively. The
equivalent surface area (SA) of the metal phase (Pt) was determined using the
mean particle sizes obtained from the XRD data (Pozio et al., 2002).The mean
particle sizes are given in Table 1 and indicate that highly dispersed Pt
catalysts with small Pt particle sizes were obtained by using the scCO2
deposition method.
The HRTEM images of the synthesized and commercial catalysts are presented
in Figures 7.8 for Pt/MWCNT (a),(b), Pt/VXR (c),(d), Pt/BP2000 (e),(f) and
Figure 7.9 for ETEK Pt/C (a)-(d). In agreement with XRD data, it can be seen
that a small Pt particle size of about 1-2 nm and uniform Pt distribution can be
achieved using the scCO2 deposition method. The size of the Pt particles of
ETEK catalyst Pt/C (10 wt %) was reported as 2-3 nm (Gloaguen et al., 1997
and the ETEK company). However, the calculations based on the XRD data
resulted a particle size of 6 nm. The reason for this discrepancy might be due to
the broad Pt particle size distribution in the ETEK catalyst as can be seen from
the TEM data presented in Figure 7.9 (g)-(k). On the contrary, there is a good
agreement between XRD and TEM data for the catalysts synthesized by the
scCO2 deposition technique, indicating that they have a very narrow particle
size distribution.

79
2θ/o
0 20 40 60 80 100
Inte
nsity
(au)
ETEK Pt/C (10%)
Pt/BP2000 (47.5%)
Tanaka Pt/C (46.5%)
Pt/MWCNT (9.9%)
Pt/VXR (9%){220}
{111}
{200}
(a)
60 65 70 75 80
2θ/o
Inte
nsity (
au)
ETEK Pt/C (10%)
Tanaka Pt/C (46.5%)
Pt/MWCNT (9.9%)
{220}
60 65 70 75 80
2θ/o
Inte
nsity (
au
)
{220}
Pt/VXR (9%)
Pt/BP2000 (47.5%)
(b) (c)
Figure 7.7 XRD patterns for the prepared and commercial catalysts a) whole scan for all catalysts b) narrow scan for Pt/MWCNT, Pt/C (Tanaka), Pt/C
(ETEK) c) narrow scan for Pt/VXR and Pt/BP2000
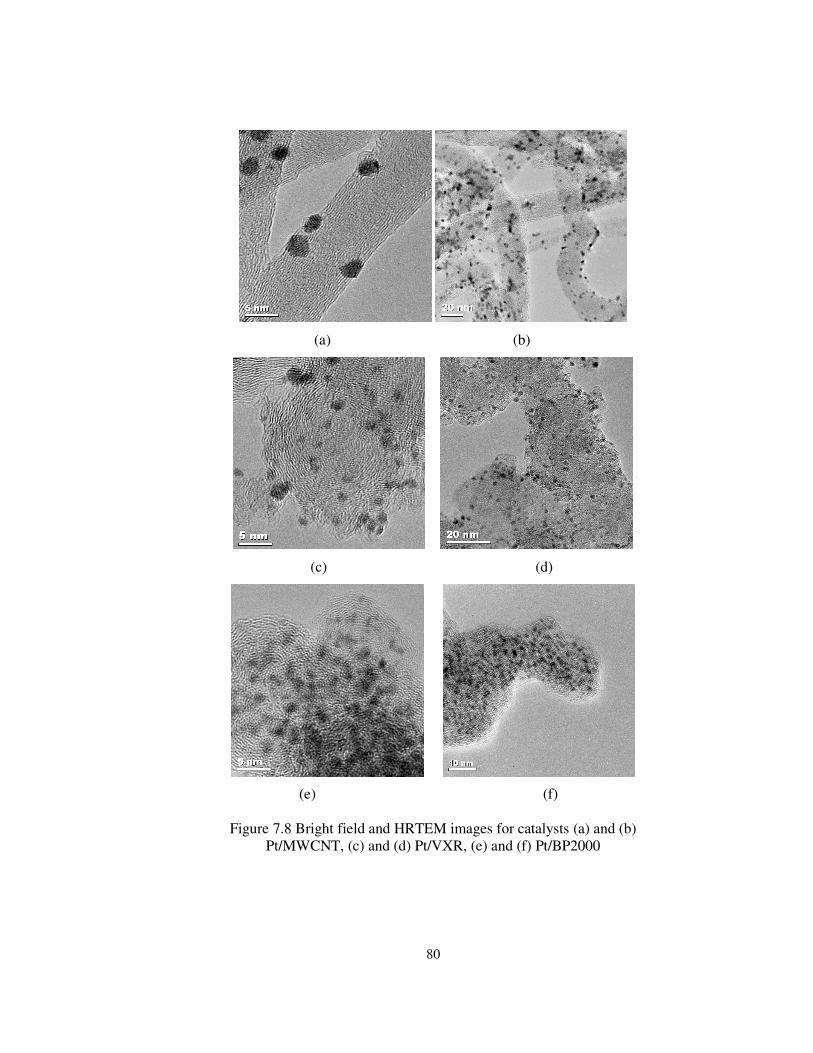
80
(a) (b)
(c) (d)
(e) (f)
Figure 7.8 Bright field and HRTEM images for catalysts (a) and (b) Pt/MWCNT, (c) and (d) Pt/VXR, (e) and (f) Pt/BP2000

81
(a) (b)
(c) (d)
Figure 7.9 Bright field and HRTEM images for catalysts (a)-(d) Pt/C-ETEK
Among the carbon supports, the BP2000 has the highest surface area and it is
this support on which the highest Pt loading was achieved in this work
(47.5%). This is due to highest uptake of the Pt precursor due to the highest

82
surface area. However, for the Pt/BP2000 catalysts that have different Pt
loadings, the ESA values obtained were approximately the same, presumably
due to similar size of the Pt particles (≈1 nm in diameter) which was confirmed
by the XRD measurements.
7.3 CV results
CV results for the Pt/BP2000 catalysts which have 29 and 47.5 wt % Pt
loadings are given in Figure 7.10. The ESA values for the Pt/BP2000 catalysts
which have 29 and 47.5 wt % Pt loadings are 110 and 102 m2 g-1, respectively.
Similar ESA values at substantially different loadings indicate that ESAs are
primarily governed by the platinum particle size for the same support. For
comparison with other prepared catalysts Pt/BP2000 (47.5%) was used.
E, V vs NHE
I, A
cm
-2
Pt/BP2000 (47.5%)
Pt/BP2000 (29%)
0.0 0.2 0.4 0.6 0.8 1.0
-0.004
-0.003
-0.002
-0.001
0.000
0.001
0.002
0.003
Figure 7.10 CV results for Pt/BP2000 catalysts with different Pt loadings

83
As demonstrated by the CV data (Figure 7.11), the catalytic activity of the
Pt/VXR prepared by supercritical deposition method for the electrooxidation
and reduction of hydrogen is substantially higher than the catalytic activity of
the commercial Pt/C (ETEK). Among the three different supports utilized in
supercritical deposition, VXR has the highest catalytic activity. The particle
size of the Pt/MWCNT and Pt/C (Tanaka) were 2 nm and the electrocatalytic
activity of these catalysts showed similar results.
Electrochemical surface areas (ESAs) of the catalysts were calculated by using
Eqn 7.3 taking into account the hydrogen reduction peak.
SLK
AESA
..= (7.3)
where A is the area under the curve for hydrogen reduction part excluding
double layer capacitance up to second inflection point, K=0.21 mC/cm2, S is the
scan rate (50 mV/s) and L is the Pt loading on the electrode (Smirnova et al.,
2005). The calculated SA and ESA values are given in Table 7.6.
Although Pt/VXR (scCO2) has the highest ESA and a low particle diameter
(Table 7.6), the Pt utilization is only 74% (Appendix A). It can be assumed that
in the case of small (~1 nm) Pt particles, the accessibility of the metal particles
even in liquid electrolyte is more critical due to the partially hydrophobic
nature of the carbon support. For Pt/MWCNT (scCO2) and Pt/C (Tanaka),
which have larger Pt particles (2 nm), the utilization of Pt seems to be higher.

84
E, V vs NHE
I, A
cm
-2
ETEK Pt/C (10%)
Pt/BP2000 (47.5%)
Tanaka Pt/C (46.5%)
Pt/MWCNT (9.9%)
Pt/VXR (9%)
0.0 0.2 0.4 0.6 0.8 1.0
-0.004
-0.003
-0.002
-0.001
0.000
0.001
0.002
0.003
Figure 7.11 Cyclic voltammogram for the prepared catalysts in 0.1 M HClO4 in H2 atmosphere at a scan rate of 50 mV/s
Table 7.6 Electrochemical and total surface areas of the synthesized and commercial catalysts Catalyst Particle* (nm) SA (m2/g) ESA (m2/g) Pt (%) Pt ut.
size
Pt/C (ETEK) 6 46.7 57 10 122 Pt/VXR (scCO2) 1.2 233.6 173 9 74 Pt/MWCNT (scCO2) 2 140.2 130 9.9 93 Pt/BP2000 (scCO2) 1 280.4 102 47.5 36 Pt/C (Tanaka) 2 140.2 128 46.5 91
*From XRD and TEM data (Figures 7.7, 7.8 and 7.9)
Pt ut. is Pt utilization (see Appendix A)

85
Even though the particle size of Pt on VXR and BP2000 is approximately the
same, the ESA of Pt/VXR is higher which results in a large difference in the Pt
utilization for these two materials (Table 7.6). This could be due to differences
in the structures of the carbon supports for these two catalysts, namely by the
higher micropore volume of BP2000. Some of the platinum nanoparticles may
be residing in the micropores and the electrolyte may not be contacting to these
particles. The Pt utilization value of over 100% in the case of Pt/C (ETEK)
presumably arises because the Pt particle size is not uniform, as revealed in the
HRTEM images for this material (Figures 7.8 g-k). We note, however, that Pt
utilization values of over 100% have been reported elsewhere for ETEK Pt/C
(20%) catalyst (Shan and Pickup, 2000).
From this point forward the results are given for the high Pt loading catalysts
which were prepared by reduction in supercritical carbon dioxide. To increase
the platinum loading on the VXR carbon black, another reduction method was
used. When reduction is carried out at atmospheric pressure in nitrogen
atmosphere, the maximum loading is governed by the adsorption isotherm of
the precursor between the carbon black phase and the scCO2 phase. Higher
loadings are possible when reduction is carried out in scCO2. In this case, after
dissolving the organometallic precursor in scCO2 at 343 K and 13.8 MPa for
overnight, the reduction was achieved in the same vessel by increasing the
temperature and pressure to 413 K and 31 MPa, respectively. By changing the
conditions and reduction method, the Pt loading on the VXR was increased to
15 and 35%. This loading was controlled by the amount of the precursor put
into the vessel.
The XRD spectra for the Pt/VXR (9%), Pt/VXR (15%) and Pt/VXR (35%)
catalysts are given in Figure 7.12. For all catalysts characteristic patterns of Pt
face-centered cubic (fcc) diffraction was obtained for {111}, {200}, {220}
peaks. Because of the overlapped {111}, {200} Pt and carbon peaks, particle
sizes of the catalysts were calculated by using Scherrer equation for the half-

86
full-width at half maximum of the {220} inflection (Appendix A). The surface
area (SA) of the metal phase (Pt) was calculated from the particle sizes
obtained from XRD data (Pozio et al., 2002). Particle size of Pt/VXR (35%)
catalyst was obtained as 2 nm from the XRD data.
Figure 7.13 shows the bright field and high resolution TEM images for the
Pt/VXR (15%) catalysts. As can be seen from the figure, by using the scCO2
deposition method, not only small sized Pt particles can be obtained, but also a
uniform and well Pt distribution can be achieved. Particle size was 1.3 nm for
Pt/VXR (15%) catalyst. The particle sizes obtained from TEM were in good
agreement with the ones obtained from XRD.
2θ/0
0 20 40 60 80
Inte
nsity (
au)
Pt/VXR (35%)
Pt/VXR (15%)
Pt/VXR (9%)
{111}{200}
{220}
Figure 7.12 XRD pattern for high Pt loading Pt/VXR catalysts
The cyclic voltammograms for the prepared catalysts with different Pt loadings
are given in Figure 7.14. As can be seen from the figure, the activity of the
Pt/VXR (15%) for electrooxidation and reduction of the hydrogen is superior

87
to Pt/VXR (35%). Electrochemical and total surface areas of the Pt/VXR
catalysts estimated from the XRD, TEM and CV data are tabulated in Table
7.7. ESAs for the 15 and 35% Pt/VXR catalysts were calculated by using
Figure 12 as 125 and 87 m2/g, respectively. It was observed that when the
platinum loading was increased, the particle size also increased. Although, the
electrochemical surface area was higher than Pt/VXR (35%) catalyst, Pt/VXR
(15%) had lower Pt utilization. High electrochemical surface area is an
indication of more catalytic active sites on the catalyst.
Figure 7.13 TEM images for 15% Pt/VXR
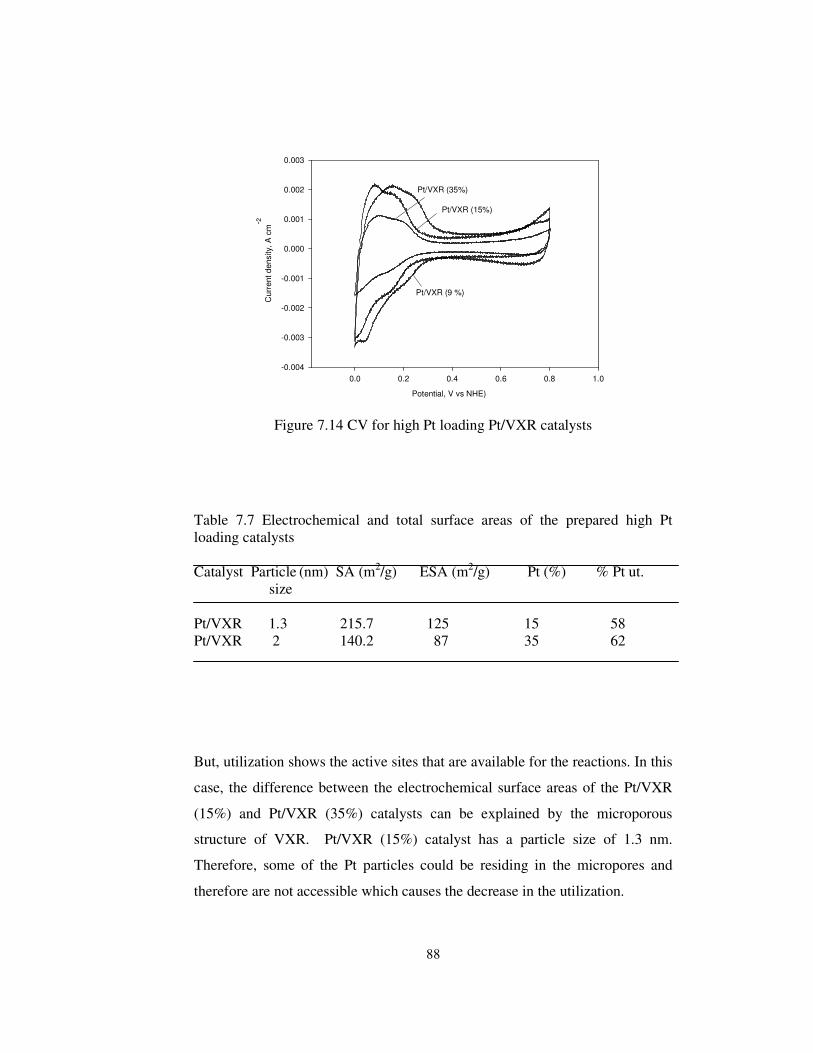
88
Col 1 vs Col 2 Col 3 vs Col 4
Potential, V vs NHE)
Curr
ent d
ensity, A
cm
-2
0.0 0.2 0.4 0.6 0.8 1.0
-0.004
-0.003
-0.002
-0.001
0.000
0.001
0.002
0.003
Pt/VXR (15%)
Pt/VXR (35%)
Pt/VXR (9 %)
Figure 7.14 CV for high Pt loading Pt/VXR catalysts
Table 7.7 Electrochemical and total surface areas of the prepared high Pt loading catalysts Catalyst Particle (nm) SA (m2/g) ESA (m2/g) Pt (%) % Pt ut.
size Pt/VXR 1.3 215.7 125 15 58 Pt/VXR 2 140.2 87 35 62
But, utilization shows the active sites that are available for the reactions. In this
case, the difference between the electrochemical surface areas of the Pt/VXR
(15%) and Pt/VXR (35%) catalysts can be explained by the microporous
structure of VXR. Pt/VXR (15%) catalyst has a particle size of 1.3 nm.
Therefore, some of the Pt particles could be residing in the micropores and
therefore are not accessible which causes the decrease in the utilization.

89
CV positive scans for O2 reduction with rotation speeds varying between 100-
2500 rpm at a 10 mV s-1 sweep rate for the synthesized Pt/VXR, Pt/MWCNT
and Pt/BP2000 catalysts are presented in Figures 7.15, 7.16 and 7.17,
respectively. The CV data show similar trends to the ESA data. Thus, for
Pt/MWCNT and Pt/VXR the current is higher than that for Pt/BP2000, and in
all three cases the current increases gradually with the speed of rotation. The
limiting current plateaus obtained for Pt/VXR and Pt/MWCNT indicate that the
oxygen reduction is fast enough at high overpotentials and follows a trend
(Shan and Pickup, 2000) similar to Pt/BP2000. If the electro-catalytically
active sites are not distributed uniformly and the electrocatalytic reaction is
slow, the current plateau becomes more inclined (Suárez-Alcantara et al.,
2006).
Koutecky- Levich plots were obtained by using Eqn (7.4) and plotting i-1 vs
w1/2 (Bron et al., 2002).
kiBwi
1112/1
+= (7.4)
where i is the current, ik is the kinetic current, w is the rotation speed and B is
the Levich constant. The plots for Pt/VXR, Pt/MWCNT and Pt/BP2000 are
presented in Figures 7.15(a), 7.16(a) and 7.17(a), respectively. The linearity of
the plots indicate that the rotation speeds used in this study are large enough
that the number of electrons transferred per oxygen molecule (n) is
independent of rotation speed. The Levich constants (B) obtained from the
slope of the Koutecky-Levich plots, were used to calculate the number of
electrons transferred per O2 molecule when w is expressed in revolutions per
minute (González-Cruz et al., 2003; Dundar et al., 2006) using Eqn (7.5):
6/13/202.0 −= νDnFcB (7.5)

90
where n is the number of electrons per O2 molecule, F is the Faraday constant
(96485 C mol-1), co is the oxygen bulk concentration (1.18 10-6 mol cm-3)
(Zečević et al., 1997), D is the oxygen diffusion coefficient (1.9 10-5 cm2 s-1)
(Zečević et al., 1997), and ν is the viscosity of the electrolyte (9.87 10-3 cm2 s-1)
(Mello and Ticianelli, 1997). By using the Levich constant obtained and Eqn
(7.5), the number of electrons transferred was calculated as 3.5, 3.6 and 3.7 for
Pt/BP2000 (1 nm), Pt/VXR (1.2 nm) and Pt/MWCNT (2 nm), respectively.
The oxygen reduction reaction is a multi-electron reaction which includes
several elementary steps (Marković et al., 2001) and can follow either the 2e- or
4e- pathway, which leads to hydrogen peroxide formation or complete water
formation reactions, respectively. The high number of electrons transferred per
O2 molecule calculated here (close to 4) is an indication of low H2O2 formation
and an almost complete reduction of O2 to H2O. Otherwise these values close
to 2 indicate H2O2 formation.
E, V vs NHE
I, A
cm
-2
2500
1600
900
400
100
rpm
w-0,5/ rpm-0,5
I-1/c
m2 m
A-1
(a)
-0.008
-0.006
-0.004
-0.002
-0.000
0.002
0.0 0.2 0.4 0.6 0.8 1.0 1.2
0.02 0.04 0.06 0.08 0.10 0.120.1
0.2
0.3
0.4
0.5
0.6
0.7
0.8
0.9
Figure 7.15 Hydrodynamic voltammograms of positive scans of Pt/VXR for O2 reduction in O2 saturated 0.1 M HClO4 (a) Koutecky-Levich plot at 0.2 V

91
E, V vs NHE
I, A
cm
-2
2500
1600
900
400
100
rpm
w-0,5/ rpm-0,5
I-1/c
m2 m
A-1
(a)
0.002
0.000
-0.002
-0.004
-0.006
-0.008
0.0 0.2 0.4 0.6 0.8 1.0 1.2
0.02 0.04 0.06 0.08 0.10 0.120.1
0.2
0.3
0.4
0.5
0.6
0.7
0.8
0.9
Figure 7.16 Hydrodynamic voltammograms of positive scans of Pt/MWCNT for O2 reduction in O2 saturated 0.1 M HClO4 (a) Koutecky-Levich plot at 0.2
V
E, V vs NHE
I, A
cm
-2
2500
1600
900
400
100
rpm
w-0,5/ rpm-0,5
I-1/c
m2 m
A-1
(a)
-0.006
-0.005
-0.004
-0.003
-0.002
-0.001
0.000
0.001
0.0 0.2 0.4 0.6 0.8 1.0 1.2
0.02 0.04 0.06 0.08 0.10 0.120.1
0.2
0.3
0.9
0.8
0.7
0.6
0.5
0.4
Figure 7.17 Hydrodynamic voltammograms of positive scans of for Pt/BP2000 O2 reduction in O2 saturated 0.1 M HClO4 (a) Koutecky-Levich plot at 0.2 V

92
The Tafel plots of kinetic currents (ik) for oxygen reduction in positive sweep
rates for the synthesized catalysts (Figure 7.18) show the same order as the
ESA values, i.e. Pt/VXR>Pt/MWCNT>Pt/BP2000. For high potentials and low
potentials, Tafel slopes were reported as 60 and 120 mV dec-1 for carbon
supported platinum catalysts, respectively (Antoine et al., 2001). However,
there is a wide range of Tafel slopes reported in the literature for low potentials
ranging between 120 and 200 mV dec-1 (Yu et al., 2003). The higher values of
Tafel slopes are possibly due low oxygen concentrations and due to a mixed
activation/mass transport control (Antolini et al., 1999). The Tafel slopes
obtained for the low overpotential and intermediate segment regions for
Pt/MWCNT, Pt/VXR and Pt/BP2000 were 44, 36 and 40 mV dec-1; and 74, 54
and 50 mV dec-1, respectively. The Tafel slopes close to 40 mV dec-1 in the
low overpotential region indicates the dominance of the reduction of surface
oxygen to OH. The Tafel slopes close to 70 mV dec-1 in the intermediate
region indicates that the oxygen reduction reaction kinetics can be explained
with a mechanism of four electron transfer pathway involving a single electron
transfer step yielding adsorbed O-containing species under Temkin adsorption
conditions as the rate determining step (Jiang and Li, 2005).
By using scCO2 deposition method it was seen that the catalysts which have
very small particle sizes as small as 1-2 nm can be prepared. Adsorption
studies showed that there is a maximum uptake value of the precursor on to the
carbon support for the defined temperature and the pressure. The higher the
carbon support’s surface area the higher the uptake of the precursor obtained.
Maximum Pt loading was achieved with BP2000 carbon support which has a
surface area of 1500 m2/g. The XRD and TEM images of the catalysts
indicated that the particle sizes of the catalysts were 1.2, 1 and 2 nm for
Pt/VXR, Pt/BP2000 and Pt/MWCNT catalysts, respectively. To determine the
electrocatalytic activity of the catalysts they were tested via a rotating disk
electrode. The best electrocatalytic activity was obtained for Pt/VXR catalyst.

93
From the CV measurements it was concluded that the carbon support used is a
very important parameter that affects the catalytic activity.
log (-ik), A
E, V
vs N
HE
Pt/BP2000
Pt/VXR
Pt/MWCNT
50 mV dec-1
54 mV dec-1
74 mV dec-1
0.0
0.2
0.4
0.6
0.8
1.0
-6.0 -5.5 -5.0 -4.5 -4.0 -3.5 -3.0 -2.5
Figure 7.18 Tafel plots of ik for O2 reduction in positive scans for synthesized catalysts in O2 saturated 0.1 M HClO4 for intermediate segment (0.85-0.75 V)

94
CHAPTER 8
RESULTS AND DISCUSSION OF THE CATALYSTS PREPARED BY
MICROWAVE IRRADIATION
The aim of the utilization of the fuel cells in energy systems is for clean and
efficient electricity production. The produced electricity has to be used in
everywhere where the electricity is needed. By using single fuel cells to
provide the required high powers one needs a fuel cell with a very high active
area which is not feasible. So for generating high powers multiple cells can be
electrically connected in series. By this way the required power is obtained
with smaller active areas. By changing the active area the number of single
cells can be arranged and vice versa. In fuel cell stacks it is needed to optimize
the stack efficiency and size.
A stack with nominal cell voltage of 0.7 V requires about 40% larger active
area than a stack sized at 0.6 V/cell. The stack size would be doubled when 0.8
V/cell nominal power is selected instead of 0.7 V/cell. However, higher cell
voltage provides better efficiency and lower fuel consumption. Fuel cell
developers mostly use between 0.7 and 0.6 V as voltage at nominal power
(Barbir, 2005). By using microwave irradiation method it is aimed to prepare
high power densities between the operating region of the fuel cell. The
prepared catalysts were characterized physicochemically by XRD and XPS.
Then they were tested in a PEM fuel cell. In this part the prepared catalysts
were tested in PEM fuel cell full cell experiments to determine the performance
of the catalysts.

95
8.1 Characterization of the catalysts
The prepared catalysts can be tested in fuel cell before the physicochemical
characterization. But before fuel cell tests it will be meaningful to determine
the catalyst properties which affect the catalytic performance of the catalysts.
To determine whether the Pt crystals are obtained or not XRD was used. By
using XRD the crystallite size which is given in this study as the particle size
can be calculated. By using XPS the surface oxidation states were determined.
By using both characterization techniques the catalyst properties were defined
and it was searched for if the catalysts are suitable for fuel cell tests or not.
8.1.1 Characterization by XRD
The XRD spectra for the prepared and commercial catalysts for different
conditions are given in the Figure 8.1. For all catalysts, the characteristic face-
centered cubic (fcc) diffraction patterns for Pt were obtained for {111}, {200},
{220} peaks. Because of the overlapping of {111}, {200} Pt and carbon peaks,
the particle sizes of the catalysts were calculated by using Scherrer equation
(Appendix A) for the half-full-width at half maximum of the {220} inflection
and also the surface areas (SAs) of the catalysts were calculated from the
particle sizes obtained from the XRD data.
Firstly, the effect of microwave duration onto the particle size was investigated
by varying the time between 30-120 s. From the XRD data in Figure 8.1, it was
observed that the smallest particle size, where the broadening of {220}
inflection was maximum, was obtained for 50 s. So, the other experiments
were performed at these conditions. The microwave durations affect the
temperature of the solution. So, at long microwave durations, 90 and 120 s,
aggressive heating may occur and this will result in a rapid growth or
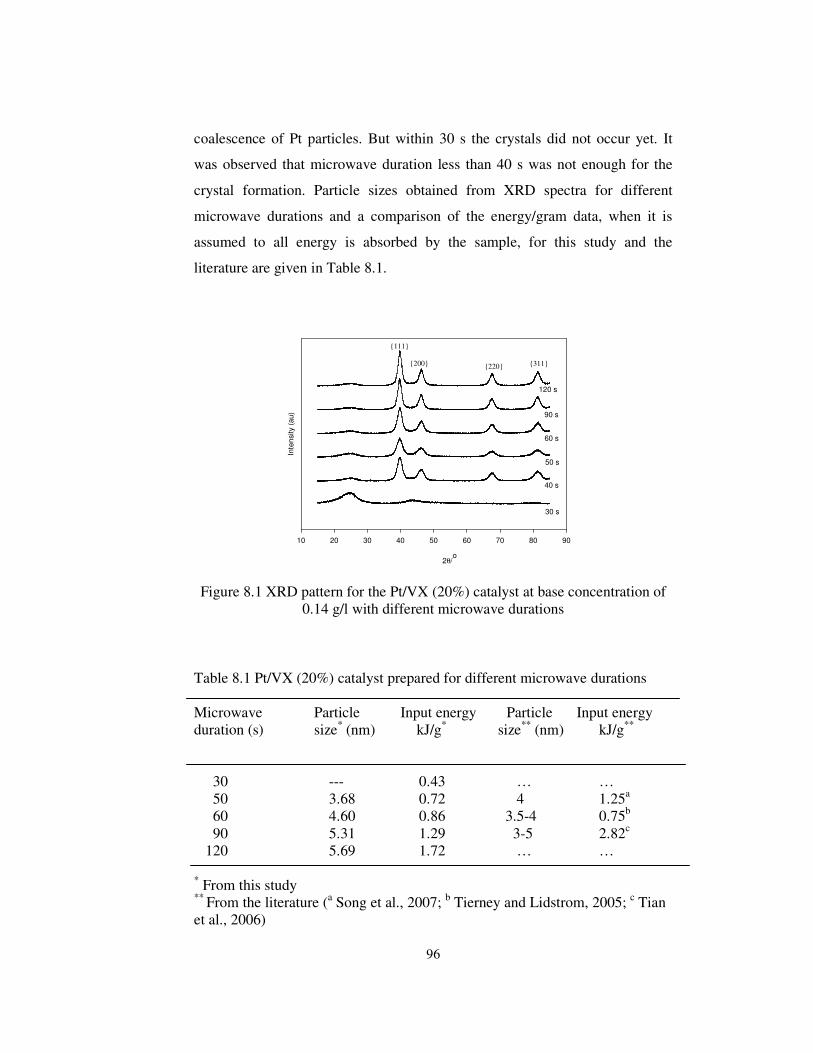
96
coalescence of Pt particles. But within 30 s the crystals did not occur yet. It
was observed that microwave duration less than 40 s was not enough for the
crystal formation. Particle sizes obtained from XRD spectra for different
microwave durations and a comparison of the energy/gram data, when it is
assumed to all energy is absorbed by the sample, for this study and the
literature are given in Table 8.1.
10 20 30 40 50 60 70 80 90
2θ/o
Inte
nsity (
au)
{111}
{200} {220} {311}
30 s
40 s
50 s
60 s
90 s
120 s
Figure 8.1 XRD pattern for the Pt/VX (20%) catalyst at base concentration of 0.14 g/l with different microwave durations
Table 8.1 Pt/VX (20%) catalyst prepared for different microwave durations Microwave Particle Input energy Particle Input energy duration (s) size* (nm) kJ/g* size** (nm) kJ/g**
30 --- 0.43 … … 50 3.68 0.72 4 1.25a 60 4.60 0.86 3.5-4 0.75b 90 5.31 1.29 3-5 2.82c
120 5.69 1.72 … …
* From this study ** From the literature (a Song et al., 2007; b Tierney and Lidstrom, 2005; c Tian et al., 2006)

97
Effect of base concentration on the particle size of Pt/VX (20%) catalyst was
investigated. For this purpose the base concentration was varied between 0.14
to 0.54 g/l. It was seen from Figure 8.2 that the peak of {220} inflection
broadened when the base concentration increased.
Increasing the base concentration lead to smaller particle size. Therefore, by
adjusting the base concentration in the solution, the particle size can be
controlled. The reason for the effect of base concentration on the particle size is
explained by the proposed mechanism (Li et al., 2005) given below:
CH2OHCH2OH CH3CHO + H2O (8.1)
2CH3CHO + (PtCl6)-2 + 6OH- 2CH3COO- +Pt + 6Cl- + 4H2O (8.2)
The acetate formed in reaction (8.2) can serve as stabilizer for Pt colloids. So,
at low base concentration values a low interaction between the acetate and Pt
colloids occur. Poor stabilization at low base concentrations (BCs) resulted in
high agglomeration and so large particle sizes. Effect of different carbon
supports, which have various surface areas, on particle size of Pt was
investigated and XRD spectrum is given in Figure 8.3.
The stabilizers are used in catalyst preparation to prevent the agglomeration of
the metals by covering them. SB12 was used as the stabilizer in this study.
Effect of different SB12/H2PtCl6 (S/Pt) molar ratios on particle size of Pt was
investigated and XRD spectrum is given in Figure 8.4, also the XRD pattern
for commercial Pt/C (ETEK) catalyst is given. The stabilization of the Pt
nanoparticles provided by adding SB12 (CH3(CH2)11N(CH3)2(CH2)3SO3)
surfactant via an electrosteric stabilization, i.e. the combination of electrostatic
(SO3-) and steric (-C12 H25) stabilization. A stable electrosteric repulsion exist
between the Pt particles covered by SB12: the positively charged part is
adsorbed on the particle surface. The negatively charged part (SO3-) and the

98
bulky alkyl chain (-C12 H25) are pointed away from the particles (Li and
Hsing, 2006).
Binary PtRu/VX (30%) catalyst was prepared with and without surfactant and
the XRD spectra is given in Figure 8.6. XRD spectra for commercial binary
PtRu/C (ETEK, 20 and 40%) catalysts are given in Figure 8.7. From the figure
and the particle size calculation it was seen that as the Pt loading on the carbon
support increases, the particles get larger and, as a consequence, the available
Pt surface area is decreasing. So electrocatalysts with higher Pt-loadings yield
thinner active catalyst layers in MEAs and electrodes which will enhance the
accessibility of the metals, therefore they are gaining increased interest (Starz
et al, 1999). The tabulated particle sizes of the prepared catalysts are given in
Table 8.2 where the particle sizes were calculated by using the corresponding
XRD patterns of the catalysts.
10 20 30 40 50 60 70 80 90
2θ/o
Inte
nsity (
au)
BC=0.14 g/l
BC=0.27 g/l
BC=0.54 g/l
{111}
{200}
{220}{311}
Figure 8.2 XRD pattern for the Pt/VX (20%) catalyst with different base concentrations (BCs), 50 s microwave duration
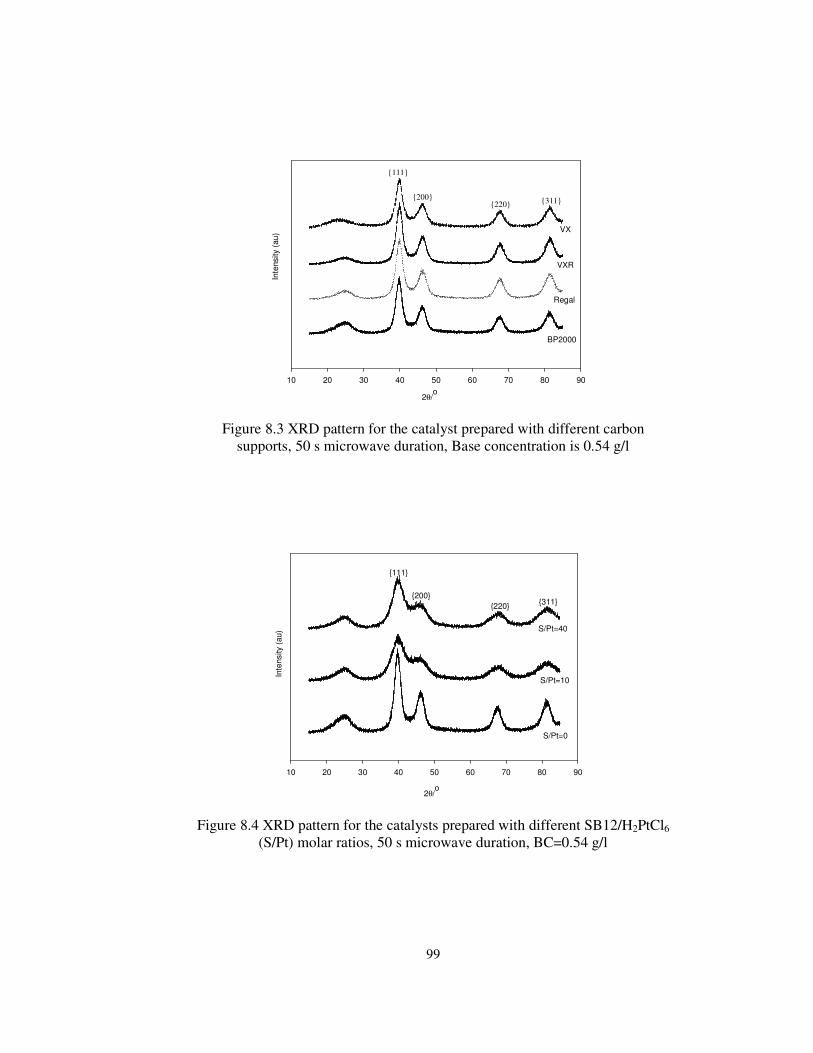
99
10 20 30 40 50 60 70 80 90
2θ/o
Inte
nsity (
au
)
BP2000
Regal
VX
VXR
{111}
{200}{220} {311}
Figure 8.3 XRD pattern for the catalyst prepared with different carbon supports, 50 s microwave duration, Base concentration is 0.54 g/l
10 20 30 40 50 60 70 80 90
2θ/o
Inte
nsity (
au)
S/Pt=0
S/Pt=10
S/Pt=40
{111}
{200}
{220}{311}
Figure 8.4 XRD pattern for the catalysts prepared with different SB12/H2PtCl6 (S/Pt) molar ratios, 50 s microwave duration, BC=0.54 g/l
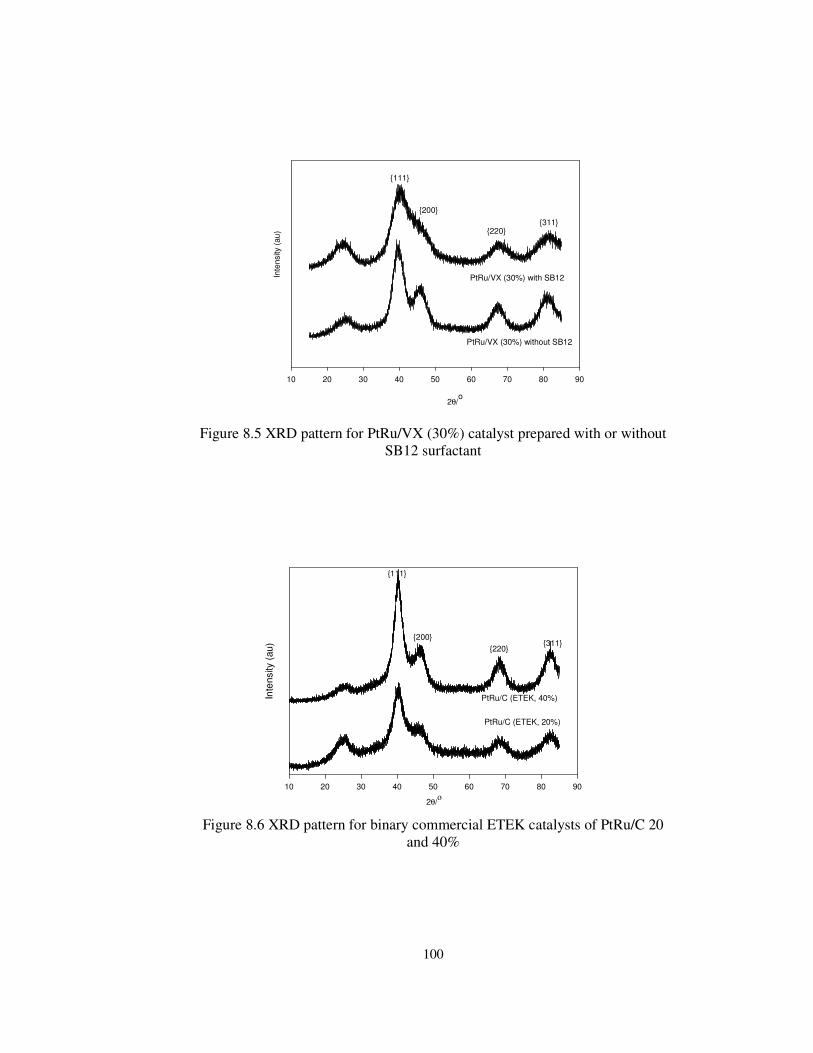
100
10 20 30 40 50 60 70 80 90
{111}
{200}
{220}{311}
2θ/o
Inte
nsity (
au
)PtRu/VX (30%) with SB12
PtRu/VX (30%) without SB12
Figure 8.5 XRD pattern for PtRu/VX (30%) catalyst prepared with or without SB12 surfactant
10 20 30 40 50 60 70 80 90
Inte
nsity (
au)
2θ/ο
PtRu/C (ETEK, 40%)
{111}
{200}
{220}{311}
PtRu/C (ETEK, 20%)
Figure 8.6 XRD pattern for binary commercial ETEK catalysts of PtRu/C 20 and 40%

101
Table 8.2 Particle sizes calculated for the commercial ETEK and the prepared catalysts by using XRD patterns Catalyst Initial BC Microwave S/Pt Particle Pt (%) (g/l) duration (s) size (nm)
Pt/VX 20 0.14 50 0 3.98 Pt/VX 20 0.27 50 0 3.85 Pt/VX 20 0.54 50 0 3.32 Pt/VX 20 0.14 30 0 … Pt/VX 20 0.14 60 0 4.60 Pt/VX 20 0.14 90 0 5.31 Pt/VX 20 0.14 120 0 5.69 Pt/Regal 20 0.54 50 0 3.41 Pt/BP2000 20 0.54 50 0 3.68 PtRu/VX 30 0.54 50 0 2.39 Pt/VX (SB12) 20 0.54 50 10 2.52 Pt/VX (SB12) 20 0.54 50 40 2.28 PtRu/VX (SB12) 30 0.54 50 80 2.00 Pt/C (ETEK) 20 ... ... ... 2.65 PtRu/C (ETEK) 20 ... ... ... 2.67 PtRu/C (ETEK) 40 ... ... ... 2.83
8.1.2 Characterization by XPS
XPS was used to determine the surface oxidation states of the catalysts
prepared by microwave irradiation. Figures 8.7-8.10 represent the Pt 4f regions
of the XPS spectrum of the Pt/C (ETEK), Pt/VX, Pt/Regal and Pt/BP2000
catalysts, respectively. The spectra show the doublets containing a low energy
band (Pt 4f7/2) and a high energy band (Pt 4f5/2) in which the theoretical area
ratio is 4/3 (Shao et al., 2006). For all the catalysts the Pt 4f signal consisted of
three pairs of Pt peaks which correspond to Pt0, Pt+2 and Pt+4.

102
The analysis of the Pt 4f doublet showed the presence of three different states
of Pt, with Pt 4f7/2 and 4f5/2 bands located at 71.2, 72.6, 74.4 eV and 74.4, 76.1,
77.8 eV for Pt0, Pt+2 and Pt+4 , respectively (Liu et al., 2002). In Pt/C (ETEK)
catalyst XPS spectra (Figure 8.7), the most intense peaks were observed at 71.2
and 74.5 eV binding energies which could be assigned to metallic Pt (Şen and
Gökağaç, 2007). Second region which include the doublets at 72.6 and 76.1 eV
were assigned to Pt+2 which will be seen as PtO or Pt(OH)2. The third and the
least intense peak at 74.4 and 77.8 eV binding energies were assigned to Pt+4 in
the form of PtO2. From the area under the curves the relative intensities of the
ETEK catalysts were obtained. The catalyst has 62% Pt0, 25% Pt+2 and 13%
Pt+4. It is known that the surface functional groups affect the catalytic activity
(Tian et al., 2006). The higher the metallic platinum (Pt0) present in the catalyst
indicates the better the catalytic activity obtained.
Figure 8.8 represents the XPS spectra for Pt/VX catalyst. Similarly, the most
intense peaks were observed at 71.2 and 74.4 eV binding energies. From the
area under the curves the relative intensities of the catalyst was obtained as
60% Pt0, 27.5% Pt+2 and 12.5% Pt+4.
Pt 4f
Binding energy, eV
666870727476788082
Inte
nsity
(a.
u.)
Pt/C (ETEK, 20%)Pt0
Pt+2
Pt+4
Figure 8.7 XPS core level spectra for Pt 4f for Pt/C (ETEK) catalyst

103
6870727476788082
Inte
nsit
y (a
. u.)
Binding energy, eV
Pt 4f
Pt/VX (20%) Pt0
Pt+2
Pt+4
Figure 8.8 XPS core level spectra for Pt 4f for Pt/VX catalyst
Figure 8.9 represents the XPS spectra for Pt/Regal catalyst. Similarly, the most
intense peaks were observed at 71.2 and 74.5 eV binding energies for metallic
Pt. From the area under the curves the relative intensities of the catalyst was
obtained as 61% Pt0, 28% Pt+2 and 11% Pt+4.
From Figure 8.10 which shows the XPS spectra of Pt/BP2000, similar results
for the binding energies of 71.45 and 74.8 were obtained that represents the
metallic Pt. The corresponding relative intensities were 52% Pt0, 30% Pt+2 and
18% Pt+4.
When the prepared and the commercial catalysts were compared, it was seen
that the Pt/C (ETEK),Pt/VX and Pt/Regal catalysts approximately have the
same surface oxidation states related with Pt, whereas Pt/BP2000 has the
highest oxide formation. While comparing the surface oxidation characteristic
of these catalysts it will be meaningful to take into account the surface areas

104
and pore diameters of the carbon support used in the synthesis of the catalysts.
The biggest surface area was belonging to the BP2000 carbon support which
may lead to the surface oxidation because of having larger mesoporous area
and pore volume may lead easy attack of oxygen atom onto the surface. Wang
et al (2007) studied the carbon black support corrosion on the stability of Pt/C
catalyst where they used the VX and BP2000 as the carbon supports. From
their XPS results they also get the similar results for BP2000. They obtained
the surface functional groups for Pt/VX as 59.4% Pt0 and 40.6% Pt+2 and for
Pt/BP2000 as 50% Pt0, 35.6% Pt+2, 15.4% Pt+4. From this study, the results
were for Pt/VX as 60% Pt0, 27.5% Pt+2 and 12.5% Pt+4 and for Pt/BP2000 as
52% Pt0, 30% Pt Pt+2 and 18% Pt+4.
Figure 8.11 also shows the survey for the commercial and prepared catalysts.
From the figure it is obvious that the O1s spectrum for the Pt/BP2000 catalyst
is quantitatively higher than the others which clarify the results found from the
Pt 4f spectra.
68707274767880
Inte
nsit
y (a
. u.)
Binding energy, eV
Pt 4f
Pt/Regal (20%) Pt0
Pt+2
Pt+4
Figure 8.9 XPS core level spectra for Pt 4f for Pt/Regal catalyst

105
68707274767880
Pt 4f
Binding energy, eV
Inte
nsit
y (a
. u.)
Pt/BP2000 (20%)Pt0
Pt+2
Pt+4
Figure 8.10 XPS core level spectra for Pt 4f for Pt/BP2000 catalyst
Binding energy, eV
02004006008001000
Inte
nsit
y (a
. u.)
Pt/BP2000
Pt/VX
Pt/Regal
Pt/C (ETEK)
O1sC1s
Pt 4f
Figure 8.11 Survey XPS spectra for commercial and prepared catalysts

106
From the XPS core levels of C1s spectra the carbon oxidation was also
investigated. From the literature it is known that the extent of graphitization
affects the catalytic activity. The more graphitic carbon used the more catalytic
activity obtained (Wang et al., 2007). The C1s spectrum obtained were
composed of graphitic carbon (284.6 eV) and carbon with oxygen-containing
functional groups (C-O: 286.1 eV, C=O: 287.6 eV) (Shao et al., 2006). The
same results were obtained for the prepared catalysts and the higher oxygen-
containing groups were obtained for BP2000 as given in Table 8.3.
Table 8.3 Results of the fits of the XPS spectra for carbon oxidation states (%) Catalyst C-C (284.6 eV) C-O (286.1 eV) C=O (287.6 eV) Pt/C (ETEK) 76 16 8 Pt/VX 78 15 7 Pt/Regal 76 18 6 Pt/BP2000 70 19 11
282284286288290
Binding energy, eV
Inte
nsity
(a.
u.)
C1s
Pt/C (ETEK, 20%)
Figure 8.12 XPS core level spectra for C1s for Pt/C (ETEK) catalyst

107
Binding energy, eV
Inte
nsit
y (a
. u.)
282284286288290
Pt/VX (20%)
C1s
Figure 8.13 XPS core level spectra for C1s for Pt/VX catalyst
Binding energy, eV
Inte
nsit
y (a
. u.)
282284286288290
Pt/Regal (20%)C1s
Figure 8.14 XPS core level spectra for C1s for Pt/Regal catalyst

108
282284286288290
Binding energy, eV
Inte
nsity
(a.
u.)
Pt/BP2000 (20%)C1s
Figure 8.15 XPS core level spectra for C1s for Pt/BP2000 catalyst
Figure 8.16 showed the whole XPS spectra and core level spectra for Ru3p for
PtRu based catalysts. From both figures it is obvious that the Ru is
incorporated into the catalyst.
02004006008001000
Pt/VX
PtRu/VX
PtRu/VX (SB12)
Binding energy, eV
O1s
C1s
Pt 4fRu3p
Inte
nsit
y (a
. u.)
(a)
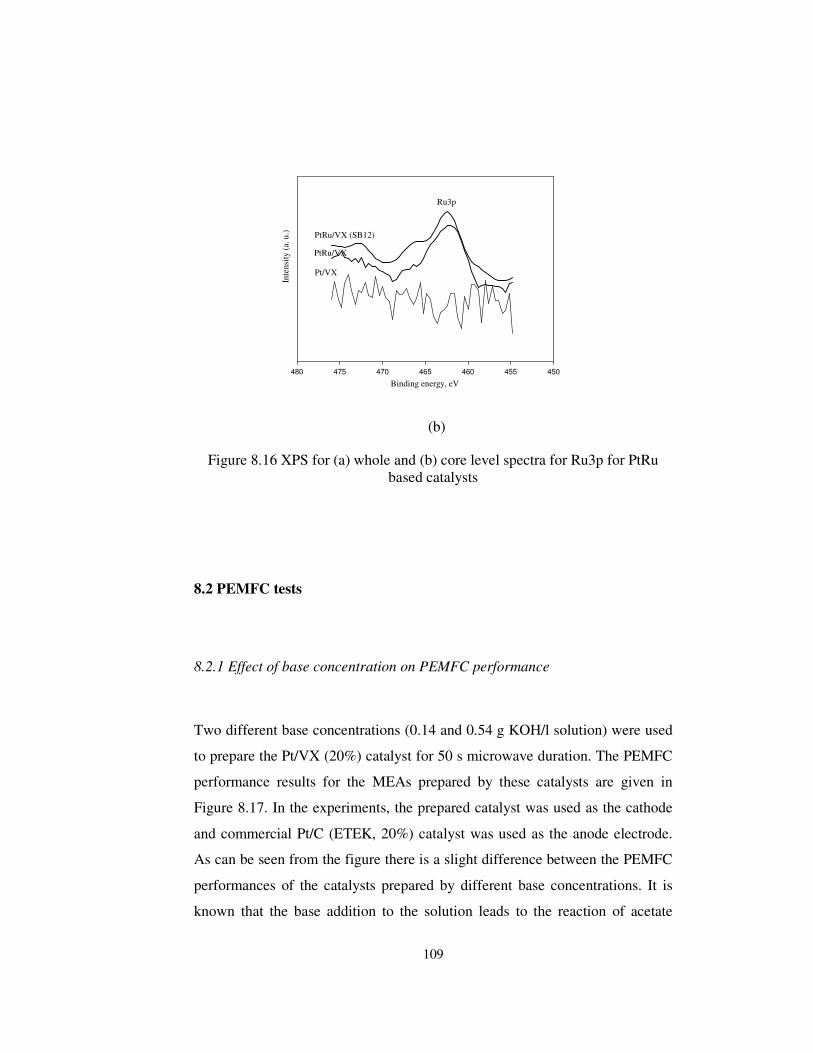
109
450455460465470475480
Binding energy, eV
Inte
nsity
(a.
u.)
Pt/VX
PtRu/VX
PtRu/VX (SB12)
Ru3p
(b)
Figure 8.16 XPS for (a) whole and (b) core level spectra for Ru3p for PtRu based catalysts
8.2 PEMFC tests
8.2.1 Effect of base concentration on PEMFC performance
Two different base concentrations (0.14 and 0.54 g KOH/l solution) were used
to prepare the Pt/VX (20%) catalyst for 50 s microwave duration. The PEMFC
performance results for the MEAs prepared by these catalysts are given in
Figure 8.17. In the experiments, the prepared catalyst was used as the cathode
and commercial Pt/C (ETEK, 20%) catalyst was used as the anode electrode.
As can be seen from the figure there is a slight difference between the PEMFC
performances of the catalysts prepared by different base concentrations. It is
known that the base addition to the solution leads to the reaction of acetate

110
formation which behaves as a stabilizer, so when the amount of the base
concentration is increased it helps to obtain smaller particle sizes.
Current density, mA/cm2
0 200 400 600 800 1000
Vo
ltag
e, V
Pow
er
den
sity,
W/c
m2
BC=0.14
BC=0.54
0.0
0.2
0.4
0.6
0.8
1.0
0.0
0.1
0.2
0.3
0.4
0.5
Figure 8.17 Effect of base concentration (BC) on PEMFC performance (Pt/VX, 20%, 50 s microwave duration)
At 0.6 V, current densities obtained for base concentrations 0.14 and 0.54 g/l
were 489 and 474 mA/cm2 with power densities of 0.29 and 0.28 W/cm2,
respectively, whereas at 0.4 V these current density values altered to 988 and
836 mA/cm2 with corresponding power densities of 0.4 and 0.33 W/cm2,
respectively. For high current density region where the water formation
increased, the catalyst prepared in the low base concentration gave better
performance. At high current density region, the flooding in the pores that the
Pt particles exist may affect the performance of the fuel cell especially for low
particle sizes. The particle sizes for the catalysts prepared at the condition of
0.14 and 0.54 g/l base concentrations were 3.98 and 3.32 nm, respectively.
Wikander et al (2007) prepared Pt/C nanoparticles by using colloidal methods

111
with particle sizes between 1.6 and 2.6 nm. And in the range of these
nanoparticle diameters, no significant difference in catalytic performance for
the ORR reaction was detected when normalized to the Pt-loading.
8.2.2 Effect of microwave duration on PEMFC performance
The effect of microwave duration to the PEMFC performance is given in
Figure 8.18. The best performance was obtained for the microwave duration of
60 s where the particle size was 4.6 nm. It is known that the metal particle size
increases when the temperature of the solution medium increased because of
the agglomeration of the particles at high temperatures. The temperature of the
solution put into the microwave oven is significantly changed with the
microwave duration. In these experiments the microwave duration was
changed between 50 to 120 s. By varying the microwave duration between 50
to 120 s, the particle sizes obtained ranged between 3.98 to 5.69 nm (see Table
8.2). Because the microwave duration affects the temperature of the solution in
the microwave oven, and the higher the temperature is the higher the particles
agglomerate. The corresponding current and power densities for the prepared
catalysts with different microwave durations at 0.6 V and 0.4 V are tabulated in
Table 8.4. The table indicates that especially at higher current density region
the performance difference becomes more significant. Maximum power
density was obtained for both 0.6 V and 0.4 V potentials for the 60 s
microwave duration. The increase in the particle size had a positive effect on
the performance up to an extent and after some point the performance started to
decline. These results showed that smaller particle size does not mean that the
performance will be high. In small particle sizes, other effects such as different
lattice constants at smaller sizes, edge effects or different governing crystal
planes for smaller particles may lower the activity when decreasing the size of
the catalyst particles (Ekström, 2007). Also, Wikander et al (2007) emphasized
that the particles lower than 3 nm are unstable and to make them stable it is
needed to stabilize the particles from electrochemical sintering during the fuel
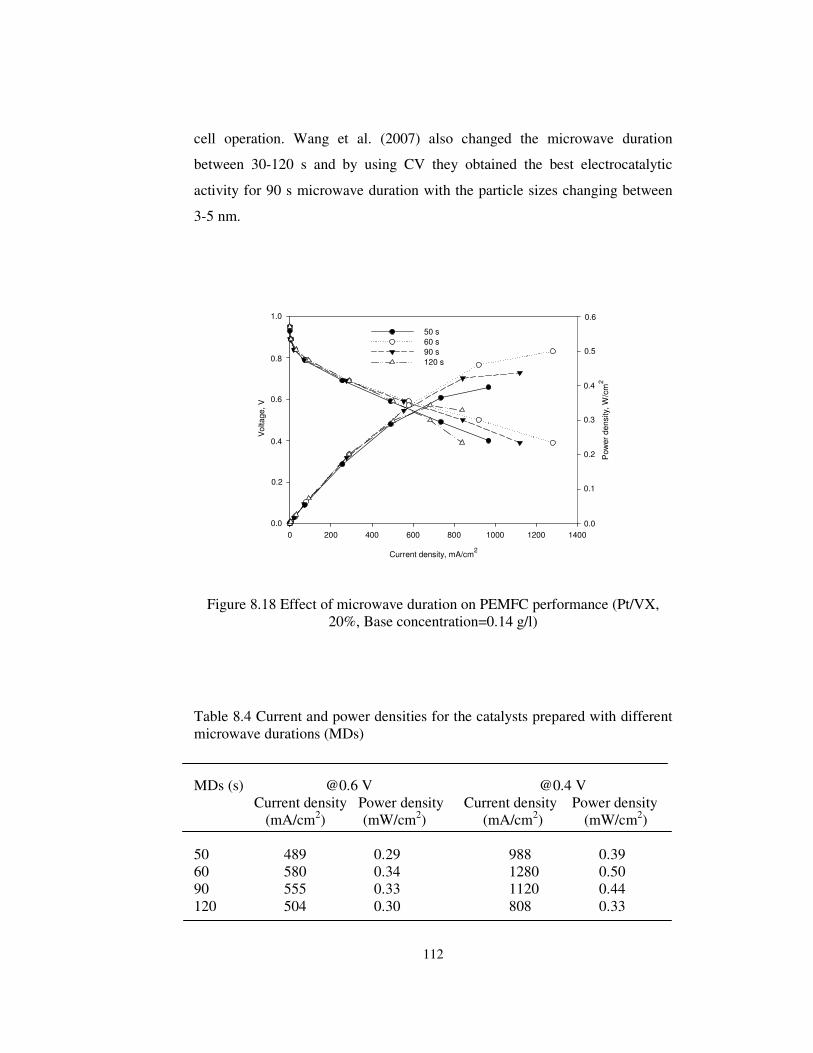
112
cell operation. Wang et al. (2007) also changed the microwave duration
between 30-120 s and by using CV they obtained the best electrocatalytic
activity for 90 s microwave duration with the particle sizes changing between
3-5 nm.
Current density, mA/cm2
0 200 400 600 800 1000 1200 1400
Vo
ltage, V
Pow
er
de
nsity,
W/c
m2
50 s
60 s
90 s
120 s
0.0
0.2
0.4
0.6
0.8
1.0
0.0
0.1
0.2
0.3
0.4
0.5
0.6
Figure 8.18 Effect of microwave duration on PEMFC performance (Pt/VX, 20%, Base concentration=0.14 g/l)
Table 8.4 Current and power densities for the catalysts prepared with different microwave durations (MDs) MDs (s) @0.6 V @0.4 V
Current density Power density Current density Power density (mA/cm2) (mW/cm2) (mA/cm2) (mW/cm2)
50 489 0.29 988 0.39 60 580 0.34 1280 0.50 90 555 0.33 1120 0.44 120 504 0.30 808 0.33

113
8.2.3 Effect of carbon support on PEMFC performance
The PEMFC performance of the catalysts prepared with different carbon
supports is given in Figure 8.18. As can be seen from the figure, the VX carbon
support gave the best performance when compared to Regal and BP2000. The
particle size of the catalysts were not differing significantly, it was in the range
of 3.32 and 3.68 nm, the performance showed an extreme difference either for
low and high current density regions. Structural properties of the carbon
supports and the functional groups formed on the support surface play an
important role on the catalytic activity of the catalysts. The dispersion of the Pt
metal on the support which affects the particle size, and also the accessibility of
the metal on the support is very crucial in fuel cells to provide the good contact
between the electrolyte and the Pt metal. VX, Regal and BP2000 carbon
supports which have 235, 94 and 1500 m2/g surface areas, respectively, were
used as the carbon supports.
Current density, mA/cm2
0 200 400 600 800 1000
Vo
ltag
e, V
Pow
er
den
sity,
W/c
m2
Pt/VX
Pt/Regal
Pt/BP2000
0.0
0.2
0.4
0.6
0.8
1.0
0.0
0.1
0.2
0.3
0.4
Figure 8.19 Effect of different carbon supports on PEMFC performance (50 s microwave duration, base concentration=0.54 g/l)

114
From Figure 8.19, at 0.6 V, the corresponding current densities were 474, 200
and 100 mA/cm2 and power densities were 0.28, 0.12 and 0.06 mW/cm2 for
Pt/VX, Pt/Regal and Pt/BP2000, respectively. At 0.4 V, the corresponding
current densities were 836, 606 and 310 mA/cm2 and power densities were
0.33, 0.24 and 0.12 mW/cm2 for Pt/VX, Pt/Regal and Pt/BP2000, respectively.
It is observed that the carbon supports used do not affect the particle size but
the performance. The probable surface functional groups formed on the carbon
supports may vary significantly which may affect the performance. Also, the
higher range of the surface areas of the carbon supports may affect the
performance. As the carbon surface area increases, the available catalytic
surface area increases while the support durability decreases because the extent
of graphitization decreases as in the case of BP2000 (Stevens et al., 2005). The
graphitization of the carbon supports plays a role in support stability, with
more graphitic carbons being more thermally stable. VX has lower surface area
than BP2000 and more graphitic in nature. The carbon support with high
surface area is susceptible to corrosive conditions in PEMFC electrode (Wang
et al., 2007). Pt may be lost from the support, if the support is oxidized. If the
support is partially oxidized to surface oxide, this may weaken the platinum-
support interaction resulted in the increase of Pt particle size, because the
presence of surface oxides leading to a lower resistance to surface migration of
Pt particles. From the XPS results, it is detected that the surface oxidation
states of Pt/BP2000 catalyst are the highest and this might be explain their low
performance in the fuel cell.
Tafel Equation is used to show the activation losses. Two Tafel slope regions
were reported on bulk platinum in liquid electrolytes, one lower slope (around
60 mV/dec) at low current densities/high potentials, and one steeper, close to
doubled, Tafel slope for high current densities/low potentials. The lower slope
has been ascribed to ORR on a platinum oxide-covered surface, and the steeper
slope to ORR on bare lpatinum (Hoare, 1968). Tafel slopes for the prepared
catalysts at high potentials for Pt/VX, Pt/Regal and Pt/BP2000 were 52, 68 and

115
76 mV/dec, respectively (see Appendix A). Oxygen reduction reaction also
occurs on carbon support, however the mechanism is different. In this reaction
hydrogen peroxide is produced while two electrons are exchanged per oxygen
molecule. Tafel slope in this case is 120 mV/dec. Thus, the larger the carbon
BET active area (at fixed Pt area), the larger the Tafel slope (in the range 60 to
120 mV/dec). It is the case for VX and BP2000. But although Regal has a
lower surface area its Tafel slope is more than VX. The higher Tafel slopes
may arise from the non-negligible ORR activity of the carbon support. (Marie
et al., 2004). The Tafel slopes close to 70 mV dec-1 in the intermediate region
indicates that the oxygen reduction reaction kinetics can be explained with a
mechanism of four electron transfer pathway involving a single electron
transfer step yielding adsorbed O-containing species under Temkin adsorption
conditions as the rate determining step (Jiang and Li, 2005).
8.2.4 Effect of surfactant/Pt precursor ratio on PEMFC performance
In order to decrease the agglomeration and obtain small particles various
surfactants were used in catalyst preparation. SB12 is one of the surfactants
that commonly used. The role of the surfactant is the prevention of the
agglomeration by covering the Pt metal and not allowing Pt particles to
coalesence. The S/Pt ratio in the experiments was varied between 0 to 40. The
corresponding PEMFC performance results are given in Figure 8.20.
The addition of the surfactant decrease the particle size of the Pt as shown in
Table 8.2 but that had an adverse effect on the performance. Further increase in
the surfactant amount did not affect the performance significantly. Because the
particle sizes for S/Pt ratios of 10 and 40 were very close to each 2.52 and 2.28
nm, respectively. At 0.6 V, current densities obtained for S/Pt ratios of 0, 10
and 40 were 474, 427 and 432 mA/cm2 and corresponding power densities
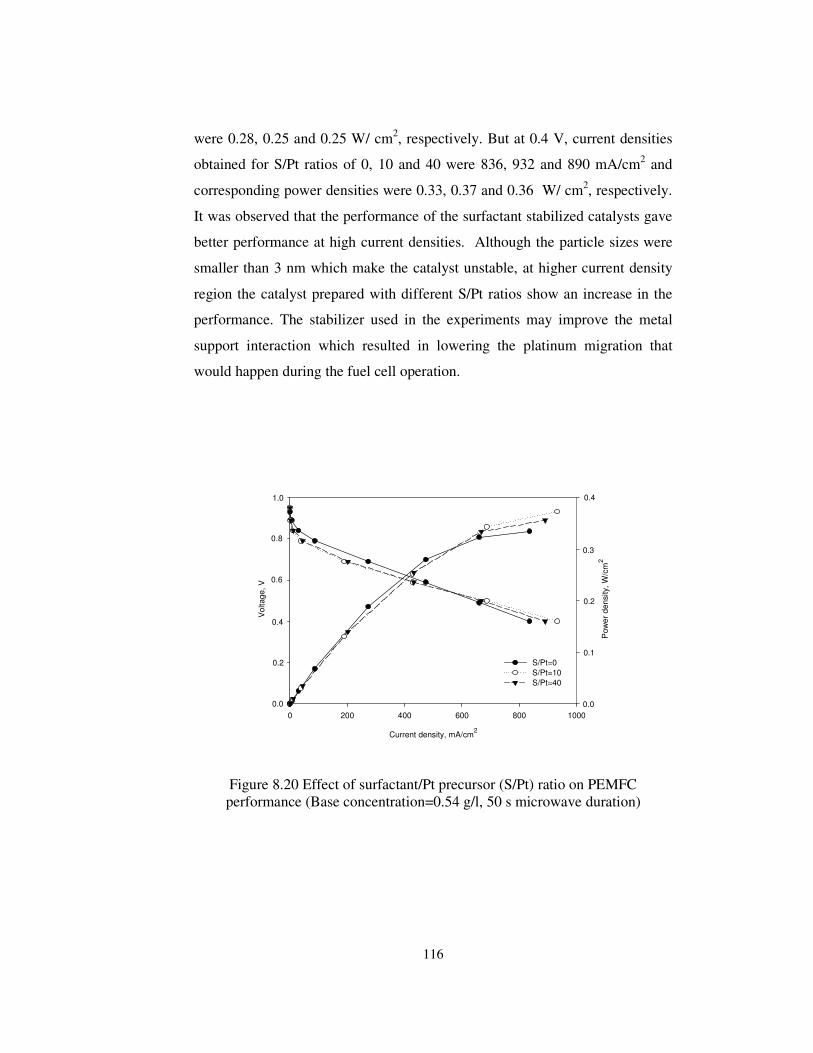
116
were 0.28, 0.25 and 0.25 W/ cm2, respectively. But at 0.4 V, current densities
obtained for S/Pt ratios of 0, 10 and 40 were 836, 932 and 890 mA/cm2 and
corresponding power densities were 0.33, 0.37 and 0.36 W/ cm2, respectively.
It was observed that the performance of the surfactant stabilized catalysts gave
better performance at high current densities. Although the particle sizes were
smaller than 3 nm which make the catalyst unstable, at higher current density
region the catalyst prepared with different S/Pt ratios show an increase in the
performance. The stabilizer used in the experiments may improve the metal
support interaction which resulted in lowering the platinum migration that
would happen during the fuel cell operation.
Current density, mA/cm2
0 200 400 600 800 1000
Voltage, V
Pow
er
density,
W/c
m2
S/Pt=0
S/Pt=10
S/Pt=40
0.0
0.2
0.4
0.6
0.8
1.0
0.0
0.1
0.2
0.3
0.4
Figure 8.20 Effect of surfactant/Pt precursor (S/Pt) ratio on PEMFC performance (Base concentration=0.54 g/l, 50 s microwave duration)

117
8.2.5 Effect of catalyst properties on PEMFC performance
The Pt particle size change considerably with respect to different catalyst
preparation conditions such as microwave duration, base concentration,
surfactant/Pt precursor ratio, carbon support used. In Figure 8.21 current
density versus the particle diameter at 0.6 V and 0.4 V is plotted. This figure
shows that there is an optimum value for the particle size. A similar result was
given in a study of Antoine et al. (2001). They proposed that the size effect
appeared to be due to the stronger adsorption of oxygenated intermediate
species on the smaller particles, which hinders the rate determining step. In
another study, Wikander et al (2007) obtained the Pt nanoparticles on VX by a
colloidal method by using alkylamine as the stabilizer. They investigated the
particle size effects of the catalysts on PEMFC performance, and they found
that nanoparticle diameters below 3 nm do not seem to be stable in the high
potential electrochemical environment at the PEMFC cathode.
Particle size, nm
2 3 4 5 6
Curr
en
t den
sity, m
A/c
m2
200
400
600
800
1000
1200
1400
@0.6 V
@0.4 V
Figure 8.21 Current density versus the particle size for Pt/VX (20% ) with different conditions
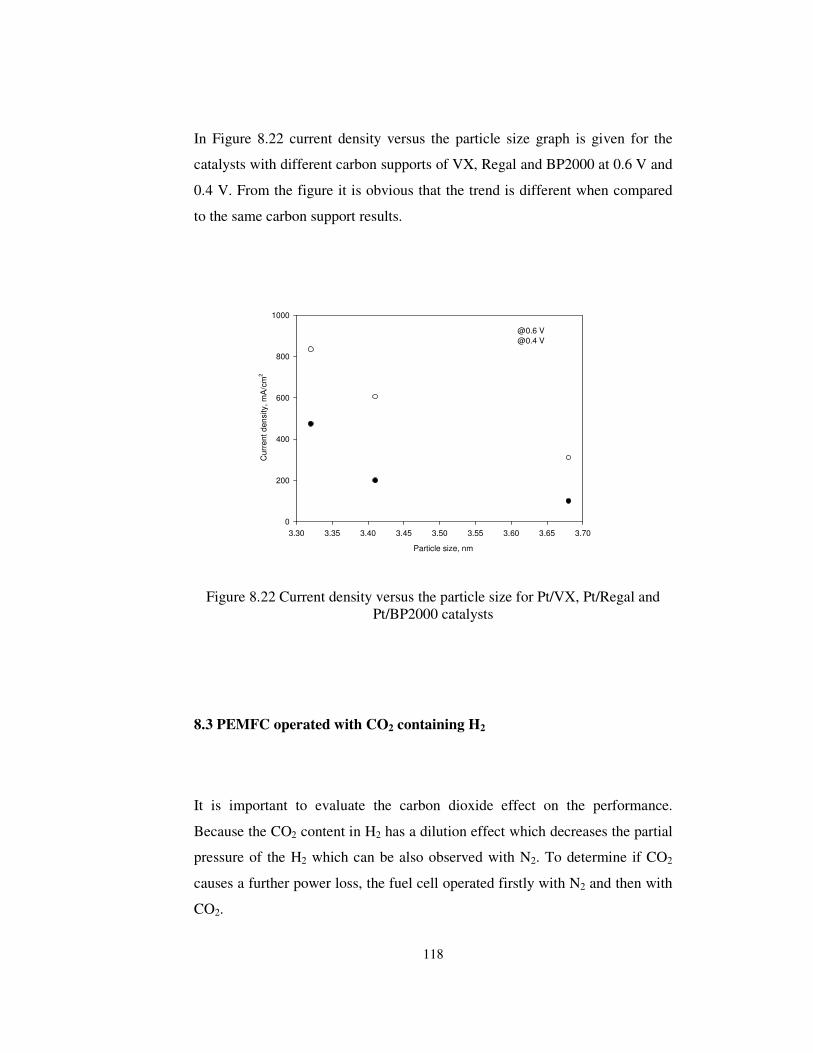
118
In Figure 8.22 current density versus the particle size graph is given for the
catalysts with different carbon supports of VX, Regal and BP2000 at 0.6 V and
0.4 V. From the figure it is obvious that the trend is different when compared
to the same carbon support results.
3.30 3.35 3.40 3.45 3.50 3.55 3.60 3.65 3.70
0
200
400
600
800
1000
@0.6 V
@0.4 V
Particle size, nm
Curr
ent
density, m
A/c
m2
Figure 8.22 Current density versus the particle size for Pt/VX, Pt/Regal and Pt/BP2000 catalysts
8.3 PEMFC operated with CO2 containing H2
It is important to evaluate the carbon dioxide effect on the performance.
Because the CO2 content in H2 has a dilution effect which decreases the partial
pressure of the H2 which can be also observed with N2. To determine if CO2
causes a further power loss, the fuel cell operated firstly with N2 and then with
CO2.

119
8.3.1 Effect of N2 on PEMFC performance
Prior to the CO2 experiments, the effect of N2 on PEMFC performance was
investigated. It is known that the dilution of the fuel at anode side has an
adverse effect on the performance. To diminish this effect at the anode feed
gas, the percentage of the second gas (either N2 or CO2) was arranged by
keeping the hydrogen flow rate constant as 0.1 slm in all cases. A
commercially available MEA was used in this experiment and N2 percentage
was changed between 0 to 50%. The performance results are given in Figure
8.23. Although, the hydrogen flow rate was set to 0.1 slm in the gas
composition to eliminate the dilution effect, from the figure it is clear that the
performance still decreases as N2 percentage increases.
0 200 400 600 800 1000 1200
0%
20%
30%
40%
50%
Current density, mA/cm2
Voltage,
V
0.0
0.2
0.4
0.6
0.8
1.0
1.2
% N2
Figure 8.23 Effect of N2 percentage in the H2 gas fed to the fuel cell on PEMFC performance with commercial MEA (Electrochem)

120
It was calculated that under conditions of CO-free feed gas, the performance
loss should not exceed 10% of full stack power with hydrogen concentrations
as low as 40% (Bhatia et al, 2004). The current densities for the anode feed gas
of H2 including 0 and 50% N2 at 0.6 V were 426 and 407 mA/cm2,
respectively. The current loss for 50% N2 at 0.6 V was 19 mA/cm2. Similarly at
0.4 V, the current densities for the anode feed gas of H2 including 0 and 50%
N2 were 800 and 738 mA/cm2, respectively. The current loss was 62 mA/cm2.
At 0.6 V and 0.4 V for 50% N2 the percent power losses were % 6.2 and % 7.8,
respectively.
8.3.2 Effect of CO2 on PEMFC performance
The adverse effect of CO2 on PEMFC performance is supposed to be because
of either the reverse water gas shift reaction or electroreduction. In both
mechanisms the reason for performance loss is resulted from CO formation
which poisons the Pt electrode. The effect of CO2, ranging between 0 to 50%,
on PEMFC performance is given in Figure 8.24. The current densities for the
anode feed gas of H2 including 0 and 50% CO2 at 0.6 V were 426 and 395
mA/cm2, respectively. The current loss for 50% CO2 at 0.6 V was 31 mA/cm2.
Similarly at 0.4 V, the current densities for the anode feed gas of H2 including
0 and 50% CO2 were 800 and 728 mA/cm2, respectively. The current loss was
72 mA/cm2. At 0.6 V and 0.4 V for 50% CO2 the percent power losses were %
8.8 and % 9.1, respectively. There is a small power loss difference between N2
and CO2 is observed. Also Divisek et al showed that with a 75% hydrogen,
25% CO2, and 100 ppm CO fuel feed, the steady state cell performance was
lower than that with a 100% hydrogen, 100 ppm CO feed which shows that the
addition of CO2 cause further decrease in the performance. In another study,
Bruijn et al (2002) found that diluting the hydrogen with CO2 to H2/CO2 ratio
of 80:20 in the same set up led to a performance loss of 7% and further
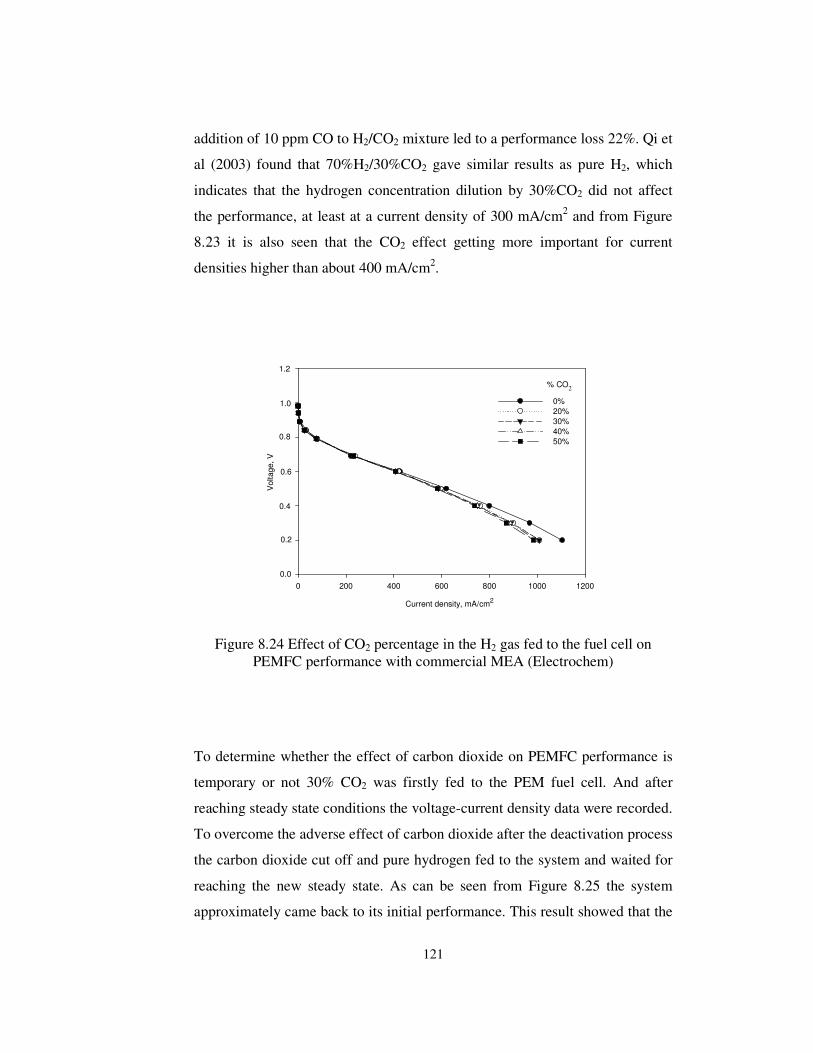
121
addition of 10 ppm CO to H2/CO2 mixture led to a performance loss 22%. Qi et
al (2003) found that 70%H2/30%CO2 gave similar results as pure H2, which
indicates that the hydrogen concentration dilution by 30%CO2 did not affect
the performance, at least at a current density of 300 mA/cm2 and from Figure
8.23 it is also seen that the CO2 effect getting more important for current
densities higher than about 400 mA/cm2.
0 200 400 600 800 1000 1200
0%
20%
30%
40%
50%
Current density, mA/cm2
Voltage, V
0.0
0.2
0.4
0.6
0.8
1.0
1.2
% CO2
Figure 8.24 Effect of CO2 percentage in the H2 gas fed to the fuel cell on
PEMFC performance with commercial MEA (Electrochem)
To determine whether the effect of carbon dioxide on PEMFC performance is
temporary or not 30% CO2 was firstly fed to the PEM fuel cell. And after
reaching steady state conditions the voltage-current density data were recorded.
To overcome the adverse effect of carbon dioxide after the deactivation process
the carbon dioxide cut off and pure hydrogen fed to the system and waited for
reaching the new steady state. As can be seen from Figure 8.25 the system
approximately came back to its initial performance. This result showed that the
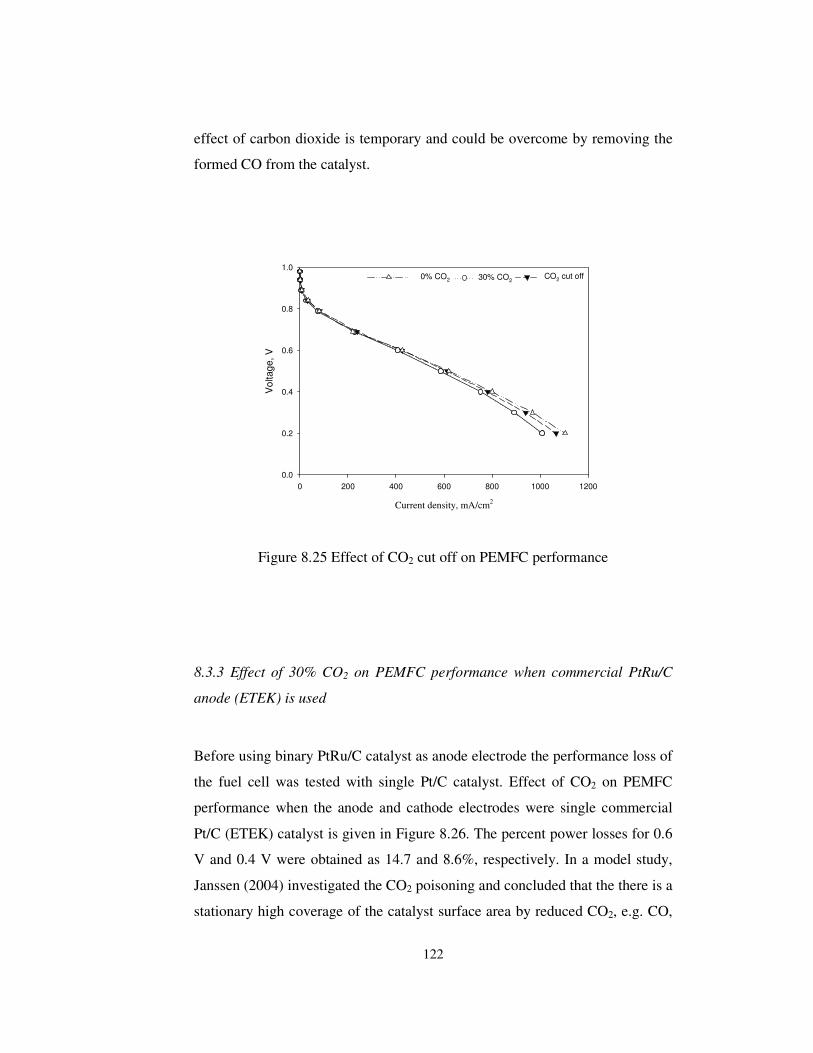
122
effect of carbon dioxide is temporary and could be overcome by removing the
formed CO from the catalyst.
Current density, mA/cm2
0 200 400 600 800 1000 1200
Voltage, V
0.0
0.2
0.4
0.6
0.8
1.030% CO2
CO2 cut off0% CO2
Figure 8.25 Effect of CO2 cut off on PEMFC performance
8.3.3 Effect of 30% CO2 on PEMFC performance when commercial PtRu/C
anode (ETEK) is used
Before using binary PtRu/C catalyst as anode electrode the performance loss of
the fuel cell was tested with single Pt/C catalyst. Effect of CO2 on PEMFC
performance when the anode and cathode electrodes were single commercial
Pt/C (ETEK) catalyst is given in Figure 8.26. The percent power losses for 0.6
V and 0.4 V were obtained as 14.7 and 8.6%, respectively. In a model study,
Janssen (2004) investigated the CO2 poisoning and concluded that the there is a
stationary high coverage of the catalyst surface area by reduced CO2, e.g. CO,
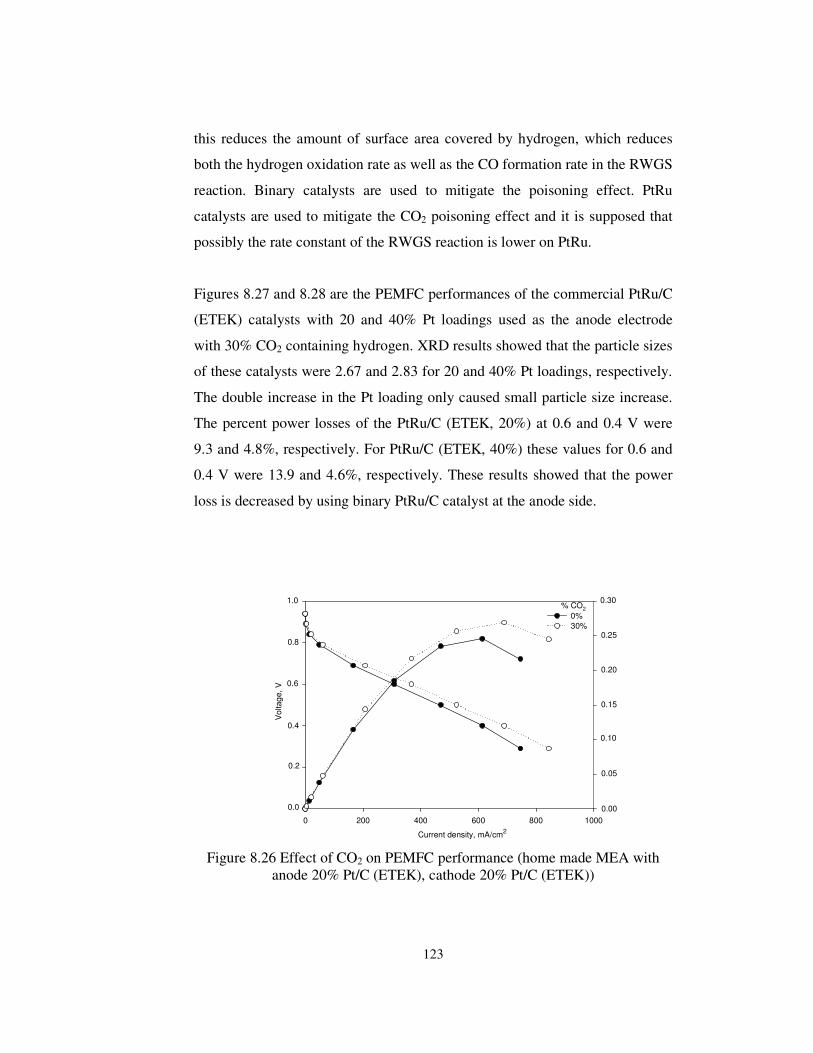
123
this reduces the amount of surface area covered by hydrogen, which reduces
both the hydrogen oxidation rate as well as the CO formation rate in the RWGS
reaction. Binary catalysts are used to mitigate the poisoning effect. PtRu
catalysts are used to mitigate the CO2 poisoning effect and it is supposed that
possibly the rate constant of the RWGS reaction is lower on PtRu.
Figures 8.27 and 8.28 are the PEMFC performances of the commercial PtRu/C
(ETEK) catalysts with 20 and 40% Pt loadings used as the anode electrode
with 30% CO2 containing hydrogen. XRD results showed that the particle sizes
of these catalysts were 2.67 and 2.83 for 20 and 40% Pt loadings, respectively.
The double increase in the Pt loading only caused small particle size increase.
The percent power losses of the PtRu/C (ETEK, 20%) at 0.6 and 0.4 V were
9.3 and 4.8%, respectively. For PtRu/C (ETEK, 40%) these values for 0.6 and
0.4 V were 13.9 and 4.6%, respectively. These results showed that the power
loss is decreased by using binary PtRu/C catalyst at the anode side.
0 200 400 600 800 1000
0%
30%
Current density, mA/cm2
Voltag
e,
V
0.0
0.2
0.4
0.6
0.8
1.0
0.00
0.05
0.10
0.15
0.20
0.25
0.30% CO2
Figure 8.26 Effect of CO2 on PEMFC performance (home made MEA with anode 20% Pt/C (ETEK), cathode 20% Pt/C (ETEK))

124
Current density, mA/cm2
0 200 400 600 800 1000
Vo
lta
ge,
V
Pow
er
density,
W/c
m2
0%
30%
0.0
0.2
0.4
0.6
0.8
1.0
0.00
0.05
0.10
0.15
0.20
0.25
0.30% CO2
Figure 8.27 Effect of CO2 on PEMFC performance (home made MEA with anode PtRu/C (ETEK, 40%), cathode 20% Pt/C (ETEK))
Current density, mA/cm2
0 200 400 600 800
Voltage
, V
Pow
er
density, W
/cm
20%
30%
0.0
0.2
0.4
0.6
0.8
1.0
0.00
0.05
0.10
0.15
0.20
0.25
0.30% CO2
Figure 8.28 Effect of CO2 on PEMFC performance (home made MEA with anode PtRu/C (ETEK, 20%), cathode 20% Pt/C (ETEK))
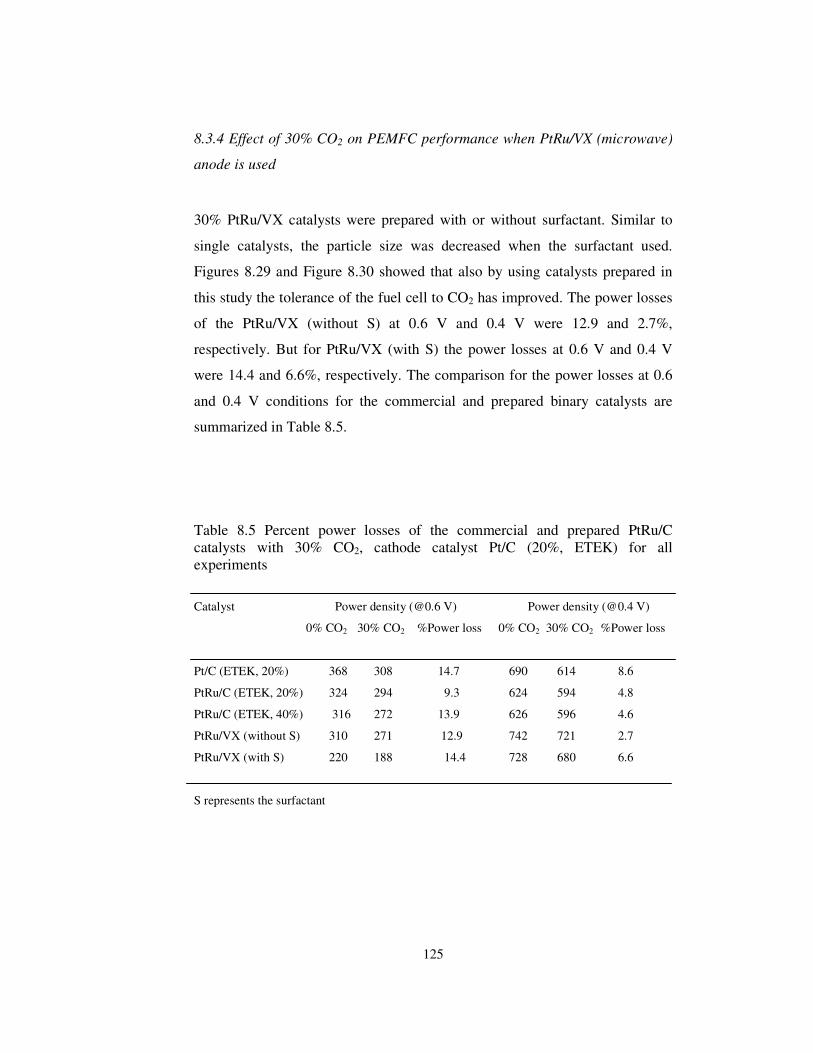
125
8.3.4 Effect of 30% CO2 on PEMFC performance when PtRu/VX (microwave)
anode is used
30% PtRu/VX catalysts were prepared with or without surfactant. Similar to
single catalysts, the particle size was decreased when the surfactant used.
Figures 8.29 and Figure 8.30 showed that also by using catalysts prepared in
this study the tolerance of the fuel cell to CO2 has improved. The power losses
of the PtRu/VX (without S) at 0.6 V and 0.4 V were 12.9 and 2.7%,
respectively. But for PtRu/VX (with S) the power losses at 0.6 V and 0.4 V
were 14.4 and 6.6%, respectively. The comparison for the power losses at 0.6
and 0.4 V conditions for the commercial and prepared binary catalysts are
summarized in Table 8.5.
Table 8.5 Percent power losses of the commercial and prepared PtRu/C catalysts with 30% CO2, cathode catalyst Pt/C (20%, ETEK) for all experiments
Catalyst Power density (@0.6 V) Power density (@0.4 V)
0% CO2 30% CO2 %Power loss 0% CO2 30% CO2 %Power loss
Pt/C (ETEK, 20%) 368 308 14.7 690 614 8.6
PtRu/C (ETEK, 20%) 324 294 9.3 624 594 4.8
PtRu/C (ETEK, 40%) 316 272 13.9 626 596 4.6
PtRu/VX (without S) 310 271 12.9 742 721 2.7
PtRu/VX (with S) 220 188 14.4 728 680 6.6
S represents the surfactant

126
0 200 400 600 800 1000 1200
0%
30%
Current density, mA/cm2
Voltag
e, V
Pow
er
de
nsity, W
/cm
2
0.0
0.2
0.4
0.6
0.8
1.0
0.0
0.1
0.2
0.3
0.4% CO2
Figure 8.29 Effect of CO2 on PEMFC performance (home made MEA with anode PtRu/VX (microwave, 30% PtRu), cathode 20% Pt/C (ETEK))
0 200 400 600 800 1000 1200
0%
30%
Current density, mA/cm2
Voltag
e,
V
Po
wer
den
sity,
W/c
m2
0.0
0.2
0.4
0.6
0.8
1.0
0.0
0.1
0.2
0.3
0.4% CO2
Figure 8.30 Effect of CO2 on PEMFC performance (home made MEA with anode PtRu/VX (microwave with SB12, 30% PtRu), cathode 20% Pt/C
(ETEK))

127
The improvement in the carbon dioxide tolerance can be explained by the
mechanism given for the carbon monoxide oxidation with binary catalyst as
follows:
M* + H2O M*OHads + H+ + e- (8.3)
Pt* + CO Pt*COads + H+ + e- (8.4)
M*OHads + Pt*COads CO2 + H+ + e- + M* + Pt* (8.5)
M, metal has to provide water oxidation and then subsequent CO oxidation will
result in carbon monoxide oxidation. M can be Pt or Ru (CO may be bonded to
Pt or Ru) (Giorgi et al., 2001). A potential of only 0.2 V is required to adsorb
water onto Ru, compared to 0.7 V for Pt due to the greater adsorption strength
of OHads onto Ru, which will ultimately lower the oxidation potential of CO to
~0.25 V.
8.4 Comparison of the PEMFC performances of the prepared and commercial
Pt and PtRu based catalysts
It will be worthy to compare the PEMFC performance results of the Pt based
catalysts prepared in this study with commercial ETEK catalyst as shown in
Figure 8.31. Two prepared catalysts were selected for comparison. One of the
chosen catalysts had the particle size close to ETEK catalyst and the other was
the catalyst that gave the best performance in fuel cell. It was observed that for
low current density region the performance was similar whereas for high
current density region commercial catalyst showed a performance decrease that
may be due to the flooding. At 0.6 V the corresponding current densities were
580, 524 and 427 mA/cm2 for microwave (60 s duration), ETEK and
microwave (S/Pt=10) catalysts, respectively. Maximum power density obtained
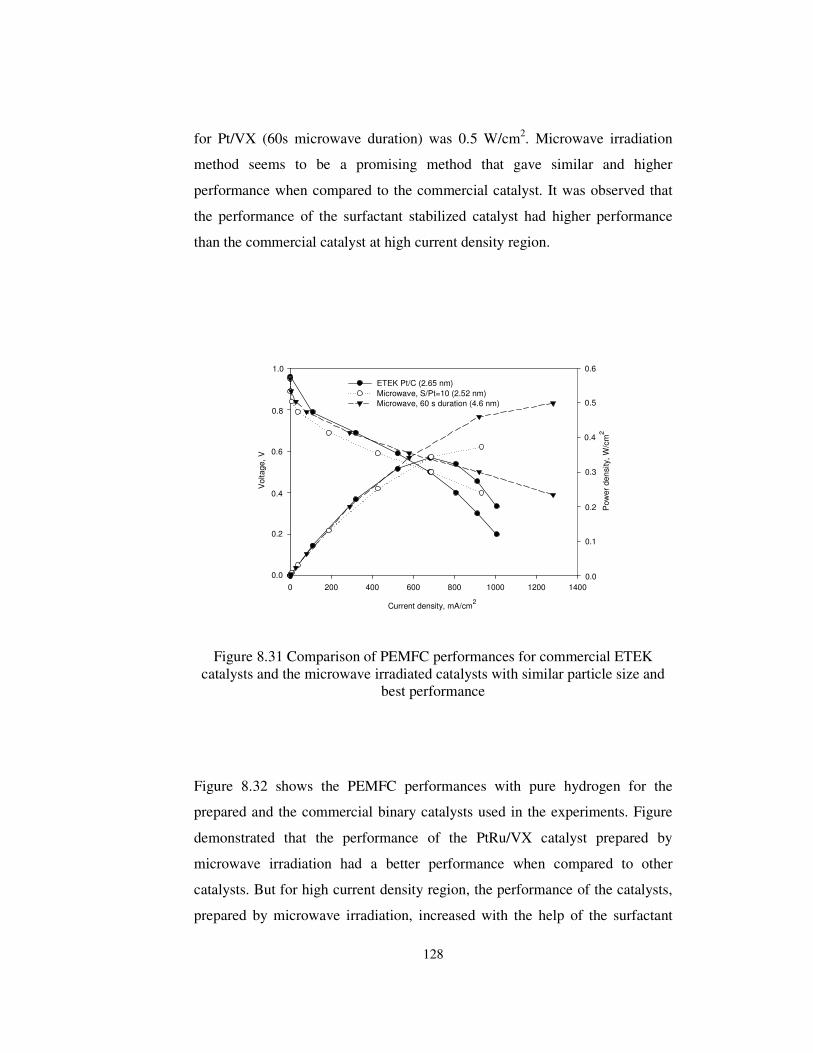
128
for Pt/VX (60s microwave duration) was 0.5 W/cm2. Microwave irradiation
method seems to be a promising method that gave similar and higher
performance when compared to the commercial catalyst. It was observed that
the performance of the surfactant stabilized catalyst had higher performance
than the commercial catalyst at high current density region.
0 200 400 600 800 1000 1200 1400
Voltage,
V
ETEK Pt/C (2.65 nm)
Microwave, S/Pt=10 (2.52 nm)
Microwave, 60 s duration (4.6 nm)
Current density, mA/cm2
Pow
er
den
sity,
W/c
m2
0.0
0.2
0.4
0.6
0.8
1.0
0.0
0.1
0.2
0.3
0.4
0.5
0.6
Figure 8.31 Comparison of PEMFC performances for commercial ETEK catalysts and the microwave irradiated catalysts with similar particle size and
best performance
Figure 8.32 shows the PEMFC performances with pure hydrogen for the
prepared and the commercial binary catalysts used in the experiments. Figure
demonstrated that the performance of the PtRu/VX catalyst prepared by
microwave irradiation had a better performance when compared to other
catalysts. But for high current density region, the performance of the catalysts,
prepared by microwave irradiation, increased with the help of the surfactant

129
and gave the best performance. In the case of the Pt based catalyst, similar
results were obtained and the microwave irradiated catalyst treated with
surfactant exhibited increased performance at high current densities and the
performance surpassed the commercial catalyst’s performance. Especially, for
high current densities where the water formation increased, the water
management becomes more important. So, the utilization of the surfactant in
the catalyst preparation may enhance the hydrophobicity of the catalyst which
diminish the flooding effects occurred at high current densities.
It was also observed that conditions for the catalyst preparation have an impact
on the catalyst properties of the binary catalysts. Previously, the effect of the
particle size on the current density has been shown and a trend has been
obtained. Similarly, Figure 8.33 showed the current densities of the binary
catalysts at 0.4 and 0.6 V potentials versus the particle size. As can be seen
from the figure, particle diameter is one of the most important parameters that
has to be taken into account to access the desired performances of a fuel cell.
0 200 400 600 800 1000 1200
ETEK PtRu/C (40%)
ETEK PtRu/C (20%)
Microwave PtRu/VX (30%)
Microwave PtRu/VX with SB12 (30%)
Current density, mA/cm2
Pow
er
den
sity, W
/cm
2
Vo
ltag
e, V
0.0
0.2
0.4
0.6
0.8
1.0
0.00
0.05
0.10
0.15
0.20
0.25
0.30
0.35
Figure 8.32 Comparison of commercial and microwave PtRu based catalysts

130
Particle diameter, nm
Curr
ent
den
sity, m
A/c
m2
1.8 2.0 2.2 2.4 2.6 2.8 3.0
100
200
300
400
500
600
700
800
0.4 V, 0%CO2
0.4 V, 30%CO2
0.6 V, 0%CO2
0.6 V, 30%CO2
Figure 8.33 Current density versus the particle size for PtRu based catalysts
The experimental results showed that microwave irradiation method gave
promising PEMFC performance results with the catalysts being either single or
binary. It is concluded that the catalyst properties affect the catalytic activity
significantly. Especially the particle size effect is a key parameter to obtain
high performances in the fuel cell. The particle size of the prepared catalysts
can be controlled by changing the catalyst preparation conditions.
131
CHAPTER 9
CONCLUSION AND RECOMMENDATION
The aim of this study was to prepare the catalytically highly active Pt and PtRu
based catalysts by using two different catalyst preparation methods which were
supercritical carbondioxide deposition and microwave irradiation. Since two
different preparation methods were used, the results were also separated into
two parts.
In experiments described in the first part, the catalysts were prepared by the
help of supercritical carbon dioxide deposition method. Adsorption
phenomenon was very important for determining the maximum metal loading
that can be achieved at the reaction medium conditions. The support properties
were also very important which affect the properties of the metal deposited.
Adsorption studies showed that the carbon support properties (total,
macroporous and micro/mesoporous surface areas) affect the maximum
loading.
The carbon supports used in the experiments of supercritical carbon dioxide
deposition were VXR, MWCNT and BP2000. The adsorption experiments
showed that the higher the total surface area of the support the higher is the Pt
loading achieved. For the VXR and MWCNT supports, which have surface
areas close to each other, the Pt loadings were 9 and 15%, respectively. But for
the BP2000 Pt loading as high as 47.5% was achieved. Similar results were
obtained for Ru catalyst, but the loadings for the supports were not as high as
Pt catalyst. For binary catalyst preparation, the bare carbon supports and
132
Pt/MWCNT and Pt/BP2000 catalysts were used as the subtrate. The Langmuir
fits of the adsorption curves helped to understand the adsorption behavior.
The prepared Pt based catalysts were characterized by using XRD, TEM and
CV. XRD results showed that in catalysts prepared by using supercritical
carbon dioxide deposition method, the particle sizes could be as low as 1-2 nm.
Also the TEM results supported the findings from the XRD data. After
physical characterization of the catalysts they were subjected to
electrochemical characterization by using cyclic voltammetry. The real
electrochemical surface area of the catalysts can be determined by CV. From
the CV results the electrochemical surface areas of the Pt/VXR, Pt/MWCNT
and Pt/BP2000 were found to be 173, 130 and 102 m2/g, respectively. These
catalysts were also compared with a commercial Pt/C (Tanaka, 46.5 %)
catalyst. Besides the ESA values the Pt utilization is very important which
represents the utilized parts of the catalytically active sites. Although the
highest ESA was achieved for Pt/VXR, the highest utilization was achieved for
Pt/MWCNT. Also, for similar particle sized catalysts Pt/VXR (1.2 nm) and
Pt/BP2000 (1 nm), the Pt utilization differed too much, which can be explained
by the difference of the carbon support properties such as total surface area,
high microporous surface area etc. For all the experiments discussed up to now
the reduction of the precursor was achieved by using thermal reduction in an
inert nitrogen atmosphere. To pass through the high Pt loadings another in situ
reduction method was tested. Pt loadings on the VXR carbon support were
obtained as 15 and 35% with the particle sizes of 1.3 and 2 nm, respectively.
But the ESAs of the catalysts prepared with thermal reduction in supercritical
carbon dioxide gave lower performance when compared to the catalysts
prepared by thermal reduction in nitrogen. CV measurements were also used to
determine the oxygen reduction reaction performance of the catalysts. From
these experiments number of electrons transferred per oxygen molecule was
calculated as 3.5, 3.6 and 3.7 for Pt/BP2000, Pt/VXR and Pt/MWCNT,
respectively. These values indicate that the oxygen reduction reaction is close

133
to the 4e- pathway, which results in an almost complete water formation
reaction and negligible hydrogen peroxide formation.
In the second part, the experiments comprised the preapration and testing of the
Pt and PtRu based catalysts that were prepared by using microwave irradiation.
In other words the required thermal environment was achieved by using
microwave heating. The carbon supports used in the experiments were VX,
Regal and BP2000. The experiments revealed that the microwave duration,
base concentration, carbon support used and surfactant/precursor ratio have a
significant impact on the properties of the catalysts. The particle sizes of the
catalysts were ranging between 2-6 nm. From the XRD results, it was observed
that the base concentration did not affect the paticle size significantly. But for
different microwave durations the particle sizes varied. This result showed that
as the microwave duration increases the temperature of the reaction medium
increases which resulted in the agglomeration of the Pt metals. The XRD
results also showed that the addition of the surfactant to the reaction
environment lowers the particle size of the single and binary catalysts because
of covering the Pt metal and inhibiting the coalescence. The XPS was used to
determine the surface oxidation states of the catalysts. For all the catalysts the
Pt 4f signal consisted of three pairs of Pt peaks which correspond to Pt0, Pt+2
and Pt+4. From the XPS core levels of C1s spectra the carbon oxidation was
also investigated. The C1s spectrum obtained were composed of graphitic
carbon and carbon with oxygen-containing functional groups. The same results
were obtained for the prepared catalysts and the presence of higher oxygen-
containing groups were detected for BP2000.
Prepared Pt based catalysts were tested in PEMFC as cathode electrode to
determine the oxygen reduction reaction performance. The performance results
for the catalysts prepared by different base concentration showed very similar
results. For the catalysts prepared with different microwave durations, the best
performance was obtained for microwave duration of 60s which resulted in
134
4.65 nm particle size. The higher particle sizes caused performance losses. The
huge performance difference was obtained for the catalysts prepared with
different carbon supports. The performance was ordered as
Pt/VX>Pt/Regal>Pt/BP2000. It was seen that the carbon supports used did not
only affect the particle size but also the performance. From the XPS results, it
was observed that the surface oxidation states of Pt/BP2000 catalyst were the
highest and this may clarify the low performance in the fuel cell. The addition
of the surfactant decrease the particle size of the Pt, but this behavior had an
adverse effect on the performance. Further increase in the surfactant amount
did not affect the performance significantly. It was observed that the
performance of the surfactant stabilized catalysts gave better performance at
high current densities.
The binary catalysts were used in the anode compartment to see if the carbon
dioxide tolerance can be increased or not. Binary catalysts either commercial or
prepared showed the better tolerance to CO2 than Pt based catalysts. It can be
conluded that the catalyst properties not only depend on the catalyst
preparation method but also depended on the preparation conditions, carbon
supports used, oxidation states that occurred on the support or metal. So, it is
crucial to optimize the conditions for getting higher catalytic activities.
Recommendations:
• The prepared binary PtRu/VX catalysts which were carbon dioxide
tolerant can be tested in the fuel cell stack.
• The prepared binary PtRu/VX catalysts can also be tested with carbon
monoxide.
• The long term operation tests are important to determine the life time of
the catalysts.
• In supercritical carbon dioxide deposition PtRu based catalysts were
prepared by using sequential impregnation which may afffect the

135
catalyst properties, so the co-impregnation can also be used to prepare
PtRu based catalysts.
• CV tests can be performed to the catalysts prepared by microwave
irradiation.
• In order to decrease the Pt amount at the cathode side a low cost metal
such as Co, Ni can be added.
• Mesoporous carbon supports can be used to eliminate the pure
accessibility of the metals in the micropores.
• The oxidation states of the catalysts can be controlled by either
chemical or physical treatments.
136
REFERENCES
Akay R. G., “Development and characterization of composite proton exchange membranes for fuel cell applications", PhD Thesis, METU, Ankara, 2008. Amine K., Yasuda K., Takenaka H., "New process for loading highly active platinum on carbon black surface for application in polymer electrolyte fuel cell", Ann. Chim. Sci. Mat. 23 (1998) 31. Antoine O., Bultel Y., Durand R., "Oxygen reduction reaction kinetics and mechanism on platinum nanoparticles inside Nafion", Electroanal. Chem. 499 (2001) 85-94. Antolini E., Giorgi L., Pozio A., Passalacqua E., "Influence of nafion loading in the catalyst layer of gas-diffusion electrodes for PEFC", J. Power Sources 77 (1999) 136-142. Arai Y., Sako T., Takebayashi Y., “Supercritical fluids: molecular interactions, physical properties, and new applications”, Springer-Verlag Berlin Heidelberg New York, 2002. Avcı A. K., Trimm D. L., Önsan Z. İ., “On-board fuel conversion for hydrogen fuel cells: comparison of different fuels by computer simulations”, Applied Catalysis A: General 216 (2001) 243-256. Avcı A. K., Trimm D. L., Önsan Z. İ., “Heterogeneous reactor modeling for simulation of catalytic oxidation and steam reforming of methane”, Chemical Engineering Science 56 (2001) 641-649. Avcı A. K., Trimm D. L., Önsan Z. İ., “Quantitative investigation of catalytic natural gas conversion for hydrogen fuel cell applications”, Chemical Engineering Journal 90 (2002) 77-87.
Babić B.M., Vračar Lj.M., Radmilović V., Krstajić N.V., "Carbon cryogel as support of platinum nano-sized electrocatalyst for the hydrogen oxidation reaction", Electrochimica Acta 51 (2006) 3820-3826.
Barbir F., “PEM fuel cells: Theory and practice”, Elsevier Academic Pres, USA, 2005.

137
Baschuk J.J., Li X., “Modelling CO Poisoning and O2 Bleeding in a PEM Fuel Cell Anode”, International journal of Energy Research, 27 (2003) 1095-1116. Bayrakçeken A., “Determination of the factors that affect the performance of proton exchange membrane fuel cells”, Ms Thesis, METU, Ankara, 2004.
Bayrakçeken A., Erkan S., Türker L., Eroğlu İ., "Effects of membrane electrode assembly components on proton exchange membrane fuel cell performance", 33 (2007) 165-170. Bhatia K.K., Wang C.Y., “Transient carbon monoxide poisoning of a polymer electrolyte fuel cell operating on diluted hydrogen feed”, Electrochimica Acta 49 (2004) 2333-2341.
Bron M., Fiechter S., Hilgendorff, M., Bogdanoff, P., "Catalysis for oxygen reduction from heat treated carbon-supported iron phenantrolin complexes", J. Appl. Chem. 32 (2002) 211-216. Bruijn F. A., Papageorgopoulos D. C., Sitters E. F., Janssen G. J. M., "The influence of carbon dioxide on PEM fuel cell anodes", Journal of Power Sources 110 (2002) 117-124. Choi K.H., Kim H.S., Lee T.H., “Electrode fabrication for proton exchange membrane fuel cells by pulse electrodeposition”, Journal of Power Sources, 75 (1998) 230-235. Chu H.S., Yeh C., Chen F., “Effects of porosity change of gas diffuser on performance of proton exchange membrane fuel cell”, Journal of Power Sources 123 (2003) 1-9. Cirimile V., Kintz P., Majdalini R., Mangin P., "Supercritical fluid extraction of drugs in drug addict hair", Journal of Chromatography B 673 (1995) 173-181. Cooper K. R., Ramani V., Fenton J. M., Kunz H. R., "Experimental methods and data analyses for polymer electrolyte fuel cells", Scribner Associates Inc., USA, 2005. Copson D. A., “Microwave Heating: In freeze drying, electronic ovens and other applications”, Westport, Connecticut-USA, The AVI publishing Company Inc., 1962. Costamagna P., Srinivasan S., "Quantum jumps in the PEMFC science and technology from the 1960s to the year 2000: Part I. Fundamental scientific aspects", Journal of Power Sources 102 (2001) 242.

138
Danmarks Tekniske Universitetet, www.kemi.dtu.dk last accessed at 13.01.2008. Denis M.C., Lalande G., Guay D., Dodelet J.P., Schulz R., “High energy ball-milled Pt and Pt-Ru catalysts for polymer electrolyte fuel cells and their tolerance to CO”, Journal of Applied Electrochemistry 29 (1999) 951-960. Divisek J., Oetjen H.F., Peimecke V., Schmidt V.M., Stimming U., “Components for PEM Fuel Cell systems using hydrogen and CO containing fuels”, Electrochimica Acta 43 (1998) 3811-3815. Dundar F., Smirnova A., Dong X., Ata A., Sammes N., "Rotating disk electrode study of supported and unsupported catalysts for PEMFC application", J. Fuel Cell Sci. Technol. 3 (2006) 428-433. Ekström H., "Evaluating cathode catalysts in the polymer electrolyte fuel cell", PhD Thesis, Stockholm, 2007. Erdener H., “Development of organic-inorganic composite membranes for fuel cell applications”, Ms Thesis, METU, Ankara, 2007. Erkan S., Synthesis of some metalophythalocyanines and their effects on the performance of PEM fuel cells", Ms Thesis, METU, Ankara, 2005. Erkey C., “Supercritical carbon dioxide extraction of metals from aqueous solutions: a review”, Journal of Supercritical Fluids 17 (2000) 259-287. Eroğlu E., Eroğlu İ., Gündüz U., Türker L., Yücel M., “Biological hydrogen production from olive mill wastewater with two-stage processes”, International Journal of Hydrogen Energy 31 (2006) 1527-1535. Escudero M. J., Hontañόn E., Schwartz S., Boutonnet B., Daza L., "Development and performance characterisation of new electrocatalysts for PEMFC", Journal of Power Sources 106 (2002) 206-214. Gasteiger H. A., Panels J. E., Yan S. G., "Dependence of PEM fuel cell performance on catalyst loading", J. Power Sources 127 (2004) 162-171. Ghadamian H., Saboohi Y., "Quantitative analysis of irreversibilities causes voltage drop in fuel cell (Simulation&Modelling)", Electrochimica Acta 50 (2004) 699-704. Giorgi L., Pozio A., Bracchini C., Giorgi R., TurtÙ S., “H2 and H2/CO oxidation mechanism on Pt/C, Ru/C and Pt-Ru/C electrocatalysts”, Journal of Applied Electrochemistry 31 (2001) 325-334.

139
Gloaguen F., Leger J.M., Lamy C., "Electrocatalytic oxidation of methanol on platinum nanoparticles electrodeposited onto porous carbon substrates", J. Appl. Electrochem. 27 (1997) 1052-1060. González-Cruz R., Solorza-Feria O., "Oxygen reduction in acid media by a Rux FeySez(CO)n cluster catalyst dispersed on a glassy carbonsupported Nafion film", J. Solid State Electrochem. 7 (2003) 289-295. Götz M., Wendt H., "Binary and ternary anode catalyst formulations including the elements W, Sn and Mo for PEMFCs operated on methanol or reformate gas”, Electrochimica Acta 43 (1998) 3637-3644. Grujicic M., Zhao C. L., Chittajallu K. M., Ochterbeck J. M., "Cathode and interdigitated air distributor geometry optimization in polymer electrolyte membrane (PEM) fuel cells”, Materials Science and Engineering B-108 (2004) 241-252. Halseid R., Vie J. S. P., Tunold R., "Effect of ammonia on the performance of polymer electrolyte membrane fuel cells", Journal of Power Sources 154 (2006) 343-350. Haji S., Zhang Y., Kang D., Aindow M., Erkey C., “Hydrodesulfurization of model diesel using Pt/Al2O3 catalysts prepared by supercritical deposition”, Catlysis Today 99 (2005) 365-373. Hamann C. H., Hamnett A., Vielstich W., "Electrochemistry", 1st Edn., Wiley-VCH, Weinheim, 1998. Hoare J. P., "The electrochemsitry of oxygen", John Wiley and Sons, New York, 1968. Hoogers G., “Fuel Cell Technology Handbook”, CRC Press, USA, 2003. Hou Z., Yi B., Yu H., Lin Z., Zhang H., “CO tolerance electrocatalyst of PtRu-HxMeO3/C(Me=W,Mo) made by composite support method, Journal of Power Sources 123 (2003) 116-125. Hui C.L., Li X.G., H. I.M., “Well-dispersed surfactant stabilized Pt/C nanocatalysts for fuel cell application: Dispersion control and surfactant removal”, Electrochimica Acta 51 (2005) 711-719. Hyatt J. A., “Liquid and supercritical carbon dioxide a organic solvents”, J. Org. Chem. 49 (1984) 5097-5101.

140
Isono T., Suzuki S., Kaneko M., Akiyama Y., Miyake Y., Yonezu I., “Development of a high-performance PEFC module operated by reformed gas”, Journal of Power Sources 86 (2000) 269-273. Janssen G. J. M., "Modeling study of CO2 poisoning on PEMFC anodes", Journal of Power Sources 136 (2004) 45-54. Jiang J., Yi B., "Thickness effects of a carbon-supported platinum catalyst layer on the electrochemical reduction of oxygen in sulfuric acid solution", J. Electroanal. Chem. 577 (2005) 107-115. Jiang R., Zhang Y., Swier S., Wei X., Erkey C., Kunz H. R., Fenton J. M. “Preparation via supercritical fluid route of Pd-impregnated Nafion membranes which exhibit reduced methanol crossover for DMFC", Electrochemical and Solid-State Letters 8 (11) (2005) A611-A615. Kappe O. C., “Controlled microwave heating in modern organic synthesis”, Angew. Chem. Int. Ed. 43 (2004) 6250-6284. Kawaguchi T., Sugimoto W., Murakami Y., Takasu Y., "Particle growth behavior of carbon-supported Pt, Ru, PtRu catalysts prepared by an impregnation reductive-pyrolysis method for direct methanol fuel cell anodes" Journal of Catalysis 229 (2005) 176-184. Kemmere F. M., Meyer, T., “Supercritical carbon dioxide: in polymer reaction engineering”, Wiley, Weinheim, 2005. Kıran E., Brennecke J. F., “Supercritical fluid engineering science: Fundamentals and applications”, American Chemical Society, California, USA, 1991. King D. A., “From supersonic beams and single crystal microcalorimetry to the control of catalytic reactions”, Studies in Surface Science and Catalysis 109 (1997) 79-89. Korsgaard A. R., Refshauge R., Nielsen M. P., Banga M., Kær S. K., "Experimental characterization and modeling of commercial polybenzimidazole-based MEA performance", Journal of Power Sources 162 (2006) 239-245. Kruk, M., Jaroniec, M., Bereznitski, Y., "Adsorption study of porous structure developmencarbon blacks", Journal of Colloid and Interface Science 182 (1996) 282-288. Kunimoto T., Inaba M., Nakayama Y., Ogata K., Umebayashi K., Tasaka A., Iriyama Y., Abe T., Ogumi Z., “Durability of perfluorinated ionomer

141
membrane against hydrogen peroxide”, Journal of Power Sources 158 (2006) 1222-1228. Larminie J., Dicks A., "Fuel Cell Systems Explained", 2nd Edn., John Wiley&Sons, USA, 2003. Lee H. K., Park J. H., Kim D. Y., Lee T. H., "A study on the characteristics of the diffusion layer thickness and porosity of the PEMFC", Journal of Power Sources 131 (2004) 200-206. Lee S. J., Mukerjee S., McBreen J., Rho Y. W., Kho Y. T., Lee T. H., "Effects of nafion impregnation on performances of PEMFC electrodes", Electrochimica Acta 43 (1998) 3693-3701. Lee W.K., Ho C.H., Zee J.W.V., Murthy M., “The effects of compression and gas diffusion layers on the performance of a PEM fuel cell”, Journal of Power Sources 84 (1999) 45-51. Leitner W., “Supercritical carbon dioxide as a green reaction medium for catalysis”, Acc. Chem. Res. 35 (2002) 746-756. Li W., Liang C., Zhou W., Qiu J., Zhou Z., Sun G., Xin Q., "Preparation and characterization of multiwalled carbon nanotube-supported platinum for cathode catalysts of direct methanol fuel cell", J. Phys. Chem B 107 (2003) 6292-6299. Li X., Chen W. X., Zhao J., Xing W., Xu Z. D., "Microwave polyol synthesis of Pt/CNTs catalysts: Effects of pH on particle size and electrocatalytic activity for methanol electrooxidization", Carbon 43 (2005) 2168-2174. Li X., Hsing I. M., "The effect of the Pt deposition method and the support on Pt dispersion on carbon nanotubes", Electrochimica Acta 51 (2006) 5250-5258. Liang Y., Zhang H., Zhong H., Zhu X., Tian Z., Xu D., Yi B., "Preparation and characterization of carbon-supported PtRuIr catalyst with excellent CO-tolerant performance for proton-exchange membrane fuel cells", Journal of Catalysis 238 (2006) 468-476. Lin Y., Cui X., Clive Y. H., Wai C. M., "PtRu/carbon nanotube nanocomposite synthesized in supercritical fluid: a novel electrocatalyst for direct methanol fuel cells", Langmuir 21 (2005) 11474-11479. Lin Y., Cui X., Clive Y., Wai C. M., "Platinum/Carbon nanotube nanocomposite synthesized in supercritical fluid as electrocatalysts for low-temperature fuel cells", J. Phys. Chem. B 109 (2005) 14410-14415.
142
Liu Z., Lee J. Y., Han M., Chen, W., Gan L. M., “Synthesis and characterization of PtRu/C catalysts from microemulsion and emulsions”, J. Mater. Chem. 12 (2002) 2453-2458. Liu Z. L., Lin X., Lee J. Y., Zhang W., Han M., Gan L. M., "Preparation and Characterization of Platinum-Based Electrocatalysts on Multiwalled Carbon Nanotubes for Proton Exchange Membrane Fuel Cells", Langmuir 18 (2002) 4054-4060. Liu Z. L., Lee J. Y., Chen W., Han M., Gan L. M., "Physical and electrochemical characterizations of microwave-assisted polyol preparation of carbon-supported PtRu nanoparticles", Langmuir 20 (2004) 181-189. Liu Z., Gan L. M., Hong L., Chen W., Lee J. Y., "Carbon-supported Pt nanoparticles as catalysts for proton exchange membrane fuel cells", Journal of Power Sources 139 (2005) 73-78. Liu Z., Guo B., Hong L., Lim T. H., "Microwave heated polyol synthesis of carbon-supported PtSn nanoparticles for methanol electrooxidation", Electrochemistry Communications 8 (2006) 83-90. Liu Z. L., Hong L., Tham M. P., Lim T. H., Jiang H., "Nanostructured Pt/C and Pd/C catalysts for direct formic acid fuel cells", Journal of Power Sources 161 (2006) 831-835. Londhe, V. P., Gupta, N. M., “Adsorption and microcalorimetric measurements on the interaction of CO and H2 with polycrystalline Ru and Ru/TiO2 catalyst”, Journal of Catalysis 169 (1997) 415-422. Luna A.M.C, Camara G.A., Paganin V.A., Ticianelli E.A., Gonzalez E.R., “Effect of thermal treatment on the performance of CO-tolerant anodes for polymer electrolyte fuel cells”, Electrochemistry Communications 2 (2000) 222-225. Ma L., Zhang H., Liang Y., Xu D., Ye W., Zhang J., Yi B., "A novel carbon supported PtAuFe as CO-tolerant anode catalyst for proton exchange membrane fuel cells", Catalysis Communications 8 (2007) 921-925. Marie J., Berthon-Fabry S., Achard P., Chatenet M., Pradourat A., Chainet E., "Highly dispersed platinum on cabon aerogels as supported catalysts for PEM fuel cell-electrodes:comparison of two different sythesis paths", Journal of Non-crystalline Solids 350 (2004) 88-96. Marković N. M., Gasteiger H. A., Ross P. N., "Oxygen reduction on Platinum low-index single-crystal surfaces in sulfuric acid solutions: rotating ring-Pt(hkl) disk studies”, Journal of Physical Chemistry 99 (1995) 3411-3415.

143
Marković N. M., Gasteiger H. A., Grgur B. N., Ross P. N., "Oxygen reduction reaction on Pt(111): effects of bromide", Journal of Electroanalytical Chemistry 467 (1999) 157-163. Marković N. M., Schmidt T. J., Stamenković V., Ross P. N., "Oxygen reduction reaction on Pt and Pt bimetallic surfaces: A selective review", Fuel Cells 1 (2001) 105-116. Maruyama J., Abe I., "Application of conventional activated carbon loaded with dispersed Pt to PEFC catalyst layer", Electrochimica Acta 48 (2003) 1443-1450. Mello R. M. Q., Ticianelli E. A., "Kinetic study of the hydrogen oxidation reaction on platinum and Nafion ® covered platinum electrodes", Electrochimica Acta 42 (1997) 1031-1039. Mulcahey L. J., Taylor L. T., "Supercritical extraction of active components in a drug formulation", Anal. Chem. 64 (1992) 981-984. Nalawade S. P., Picchioni F., Janssen L. P. B. M., “Supercritical carbon dioxide as a green solvent for processing polymer melts: Processing aspects and applications”, Progress in Polymer Science 31 (2006) 19-43. Paddison S.J., “Proton Conduction Mechanism at Low Degrees of Hydration in Sulfonic Acid-based Polymer Electrolyte Membranes”, Annu. Rev. Mater. Res. 33 (2003) 289-319. Pan M., Tang H. L., Jiang S. P., Liu Z. "Self-assembled membrane-electrode-assembly of polymer electrolyte fuel cells", Electrochemistry Communications 7 (2005) 119-124. Papageorgopoulos D.C., Keijzer M., De Bruijn F.A., “The inclusion of Mo, Nb and Ta in Pt and PtRu carbon supported 3electrocatalysts in the quest for improved CO tolerant PEMFC anodes”, Electrochimica Acta 48 (2002) 197-204. Passalacqua E., Lufrano F., Squadrito G., patti A., Giorgi L., “Nafion content in the catalyst layer of polymer electrolyte fuel cells: Effects on structure and performance”, Electrochimica Acta 46 (2001) 799-803. Passos R.R., Ticianelli E.A., “Effects of the operational conditions on the membrane and electrode properties of a polymer electrolyte fuel cell”, J. Braz. Chem. Soc. 13 (2002) 483-489.

144
Pozio A., Francesco M. DE, Cemmi A., Cardellini F., Giorgi L., "Comparison of high surface Pt/C catalysts by cyclic voltammetry", J. Power Sources 105 (2002) 13-19. Qi Z., Lefebvre M.C., Pickup P.G., “Electron and proton transport in gas diffusion electrodes containing electronically conductive proton-exchange polymers”, Journal of Electroanalytical Chemistry 459 (1998) 9-14.
Qi Z., Kaufman A., “CO-tolerance of low-loaded Pt/Ru anodes for PEM fuel cells”, Journal of Power Sources 113 (2003) 115-123. Raghuveer V., Manthiram A., "Mesoporous carbon with larger pore diameter as an electrocatalyst support for methanol oxidation", Electrochemical and Solid State Letters 7 (2004) A336-A339. Resources for electrochemistry, www.consultrsr.com/resources last accessed at 13.01.2008. Reubroycharoen P., Vitidsant T., Liu Y., Yang G., Tsubaki N., "Highly active Fischer–Tropsch synthesis Co/SiO2 catalysts prepared from microwave irradiation", Catalysis Communications 8 (2007) 375-378. Robinson J. P., Kingman S. W., Onobrakpeya O., “Microwave-assisted stripping of oil contaminated drill cuttings”, Journal of Environmental Management, Article in press. Rodríguez J. M. D., Melián J. A. H., Peńa J. P., "Determination of the real surface area of Pt electrodes by hydrogen adsorption using cyclic voltammetry", Journal of Chemical Education 77 (9) (2000) 1195-1197. Rohland B., Plzak V., “The PEMFC-integrated CO oxidation –a novel method of simplifying the fuel cell plant”, Journal of Power Sources 84 (1999) 183-186. Royal Society of Chemistry, http://pubs.rsc.org last accessed at 13.01.2008. Saquing C. D., Cheng T. T., Aindow M., Erkey C., "Preparation of platinum/carbon aerogel nanocomposites using a supercritical deposition method", J. Phys. Chem. B 108 (2004) 7716-7722. Saquing C. D., Kang D., Aindow M., Erkey C., "Investigation of the supercritical deposition of platinum nanoparticles into carbon aerogels", Microporous and Mesoporous Materials 80 (2005) 11-23.

145
Shao Y., Yin G., Wang J., Gao Y., Shi P., “Multi-walled carbon nanotubes based Pt electrodes prepared with in situ ion Exchange method for oxygen reduction”, Journal of Power Sources 161 (2006) 47-53.
Shan J., Pickup P. G., "Characterization of polymer supported catalysts by cyclic voltammetry and rotating disk voltammetry", Electrochimica Acta 46 (2000) 119-125.
Shi W., Yi B., Hou M., Shao Z., "The effect of H2S and CO mixtures on PEMFC performance", International Journal of Hydrogen Energy 32 (2007) 4412-4417. Smirnova A., Dong X., Hara H., Vasiliev A., Zammes N., "Novel carbon-aerogel supported catalysts for PEM fuel cell applications"International Journal of Hydrogen Energy 30 (2005) 149-158. Song S., Wang Y., Shen P., "Pulse-microwave assisted polyol synthesis of highly dispersed high loading Pt/C electrocatalyst for oxygen reduction", Reaction Journal of Power Sources 170 (2007) 46-49. Sperling D., Cannon J. S., “The hydrogen energy transition: Moving toward the post petroleum age in transportation”, Elsevier Science and Technology Books, Academic Press 2004. Spiewak B. E., Cortright R. D., Dumesic J. A., “Microcalorimetric measurements of differential heats of adsorption on reactive catalyst surfaces”, Thermochimica Acta 290 (1996) 43-53. Spiewak B. E., Dumesic J. A., “Microcalorimetric Studies of H2, C2H4, and C2H2 Adsorption on Pt Powder”, Journal of Catalysis 176 (1998) 405-414. Spiewak B. E., Dumesic J. A., “Applications of adsorption microcalorimetry for the characterization of metal-based catalysts”, Thermochimica Acta 312 (1998) 95-104. Sridhar P., Perumal R., Rajalakshmi N., Raja M., Dhathathreyan K.S., “Humidification Studies on Polymer Electrolyte Membrane Fuel Cell”, Journal of Power Sources 101 (2001) 72-78. Starz K.A., Auer E., Lehmann Th., Zuber R., “Characteristics of Platinum-based Electrocatalysts for Mobile PEMFC Applications”, Journal of Power Sources 84 (1999) 167-172. Stevens D. A., Hicks M. T., Haugen G. M., Dahn J. R., "Ex situ and in situ stability studies of PEMFC catalysts: Effect of carbon type and humidification

146
on degradation of the carbon, Journal of the Electrochemical Society 152 (12) (2005) A2309-A2315. Suárez-Alcantara K., Rodríguez-Castellanos A., Dante R., Solorza-Feria O., "RuxCrySez electrocatalyst for oxygen reduction in a polymer electrolyte membrane fuel cell", J. Power Sources 157 (2006) 114-120. Subramaniam B., Rajewski R. A., Snavely K., "Pharmaceutical processing with supercritical carbon dioxide", Journal of Pharmaceutical Sciences 86 (1997) 885-890. Sun Z., Liu Z., Han B., An G. "Supercritical carbon dioxide assisted deposition of tin oxide on carbon nanotubes", Materials Letters 61 (2007) 4565-4568. Şen F., Gökağaç G., “Different sized platinum nanoparticles supported on carbon: An XPS study on these methanol oxidation catalysts”, J. Phys. Chem. C 111 (2007) 5715 -5720. Şengül E., “Preparation and performance of membrane electrode assemblies with Nafion and alternative polymer electrolyte membranes”, Ms Thesis, METU, Ankara, 2007. Şengül E., Erkan S., Baç N., Eroğlu İ., “Development of gas diffusion electrodes for polymer electrolyte membrane fuel cells”, Somer Symposium Series 1, Ankara-Türkiye, (2007). Tian Z. Q., Wang X. L., Zhang H. M., Yi B. L., Jiang S. P., "Microwave-assisted synthesis of PTFE/C nanocomposite for polymer electrolyte fuel cells", Electrochemistry Communications 8 (2006) 1158-1162. Tierney J. P., Lidström P., "Microwave assisted organic synthesis", CRC Press, USA and Canada, 2005. Udomi, www.udomi.de./images/fcm.gif last accessed at 13.01.2008. Urian R.C., Gulla A.F., Mukerjee S., “Electrocatalysis of reformate tolerance in proton exchange membrane fuel cells:Part 1”, Journal of Electroanalytical Chemistry, 554 (2003) 307-324. Wang H. W., Dong R-X., Chang H-Y, Liu C-L, Chen-Yang Y-W., "Preparation and catalytic activity of Pt/C materials via microwave irradiation", Materials Letters 61 (2007) 830-833. Wang J., Yin G., Shao Y., Zhang S., Wang Z., Gao Y., "Effect of carbon black support corrosion on the durability of Pt/C catalyst", Journal of Power Sources 171 (2007) 331-339.

147
Wang L., Liu H., “Performance studies of PEM fuel cells with interdigitated flow fields”, Journal of Power Sources, 134 (2004) 185-196. Weibel G. L., Ober C. K.,“An overview of supercritical CO2 applications in microelectronics processing”, Microelectronic engineering 65 (2003) 145-152. White A., Burns D., Christensen T. W., "Effective terminal sterilization using supercritical carbon dioxide", Journal of Biotechnology, 123 (2006) 504-515. Wikander K., Ekström H., Palmqvist A. E. C., Lindbergh,G., “On the influence of Pt particle size on the PEMFC cathode performance”, Electrochimica Acta 52 (2007) 6848-6855. Williams M.V., Kunz H.R., Fenton J.M., “Operation of Nafion-based PEM fuel cells with no external humidification: Influence of operating conditions and gas diffusion layers”, Journal of Power Sources 135 (2004) 122-134. Xiong L., Manthiram A. "High performance membrane-electrode assemblies with ultra-low Pt loading for proton exchange membrane fuel cells", Electrochimica Acta 50 (2005) 3200-3204. Yamada Y., Ueda A., Shioyama H., Kobayashi T., “High-througput Screening of PEMFC Anode Catalysts by IR Thermography”, Applied Surface Science 223 (2004) 220-223. Yazaydın A. Ö, “Investigation of new horizons on H2/O2 proton exchange membrane fuel cells”, Ms Thesis, METU, Ankara, 2003. Yu H., Hou Z., Yi B., Lin Z., “Composite anode for CO tolerance proton exchange membrane fuel cells”, Journal of Power Sources 105 (2002) 52-57. Yu E. H., Scott K., Reeve R. W., "Electrochemical reduction of oxygen on carbon supported Pt and Pt/Ru fuel cell electrodes in alkaline solutions", Fuel Cells 3 (2003) 169-176. Yu K. M. K., Yeung C. M. Y., Thompsett D., Tsang S. C., "Aerogel-coated metal nanoparticle colloids as novel entities for the synthesis of defined supported metal catalysts", J. Phys. Chem. B 107 (2003) 4515-4526. Yurdakul, A. Ö, “Acid-doped polybenzimidazole membranes for high temperature proton exchange membran fuel cells”, Ms Thesis, METU, Ankara, 2007. Zečević S. K., Wainright J. S., Litt M. H., Gojković S. LJ., Savinell R. F., J. "Kinetics of O2 reduction on Pt electrode covered with a thin film of solid polymer electrolyte", Electrochem. Soc. 144 (1997) 2973-2982.
148
Zhang J., Wang X., Wu C., Wang H., Yi B., Zhang H., "Preparation and characterization of Pt/C catalysts for PEMFC cathode: effect of different reduction methods", React. Kinet. Catal. Lett. 83 (2004) 229-236. Zhang, Y., Erkey, C., “Preparation of Platinum-Nafion-Carbon black nanocomposites via a supercritical fluid route as electrocatalysts for Proton Exchange Membrame Fuel Cells”, Ind. Eng. Chem. Res. 44 (2005) 5312-5317. Zhang Y., Kang D., Aindow M., Erkey C., "Preparation and characterization of ruthenium/carbon aerogel nanocomposites via a supercritical fluid route", J. Phys. Chem. B 109 (2005) 2617-2624. Zhang Y., Kang D., Saquing C., Aindow M., Erkey C., "Supported platinum nanoparticles by supercritical deposition", Ind. Eng. Chem. Res. 44 (2005) 4161-4164. Zhang Y., Erkey C., “Preparation of supported metallic nanoparticles using supercritical fluids: A review”, J. of Supercritical Fluids 38 (2006) 252-267. Zhao J., Wang P., Chen W., Liu R., Li X., Nie Q., "Microwave synthesis and characterization of acetate-stabilized Pt nanoparticles supported on carbon for methanol electro-oxidation", Journal of Power Sources 160 (2006) 563-569. Zhao Z. W., Guo Z. P., Ding J., Wexler D., Ma Z. F., Zhang D. Y., Liu H. K., "Novel ionic liquid supported synthesis of platinum-based electrocatalysts on multiwalled carbon nanotubes", Electrochem. Commun. 8 (2006) 245-250.

149
APPENDIX A
SAMPLE CALCULATIONS
A.1 Calculation of particle size
The particle sizes of the catalysts were calculated by using Scherrer equation
and the XRD spectra. The required parameters are given in Figure A.1.
Figure A.1 XRD pattern

150
2121 )22(2
1θθθθ −=−≈B (A.1)
The Scherrer equation was as follows:
BB
Kt
θ
λ
cos= (A.2)
where, K is the Scherrer constant, λ is the wavelength of radiation
(λCu,Kα=0.154 nm), and B is the integral breadth of peak (in radians 2θ) located
at angle θB. The particle size of the Pt/VX (50s microwave duration, BC=0.54
g/l) catalyst was calculated from the (220) plane.
For Pt/VX catalyst:
B= 2.88º= 2.88º*2*π/360=0.0502 rad
2 θB= 67.6º
K=0.9
nmt 32.3)2/6.67cos(0502.0
)154.0)(9.0(==
A.2 Calculation of metal total surface area (SA)
If the metal particles are assumed to be spherical the surface area per mass can
be expressed as:
drr
rSA
ρρπρ
π 33
3
2 10.610.3
)3/4(
4=== (A.3)

151
where ρ is the density of Pt (21.4 g/cm3), d is the XRD particle size of Pt in
nm. The total surface area was calculated by using the equation above and the
Pt particle size obtained from the XRD data. SA for Pt/MWCNT which has a
particle size of 2 nm is given below:
Pt/MWCNT; 123
2.140)2)(4.21(
10.6 −== gmSA
A.3 Calculation of electrochemical surface area (ESA)
Electrochemical surface areas (ESAs) of the catalysts were calculated by using
the equation below taking into account the hydrogen reduction peak.
SLK
AESA
..= (A.4)
where A is the area under the curve for hydrogen reduction part excluding
double layer capacitance up to second inflection point, K=0.21mC/cm2, S is the
scan rate (50 mV/s) and L is the Pt loading on the electrode. The ESA
calculation for the prepared Pt/MWCNT catalyst is given below. The area
under the curve of the hydrogen reduction peak from the figure was determined
by using a computer program named Origin Lab 7.5. A sample graph for
Pt/MWCNT is given in Figure A.2.
Pt/MWCNT; A= 0.000382432 A.V/cm2, K=0.21 mC/ cm2 (1 C= 1A. 1s) L=28 µg/cm2, S=50 mV/s
128 13010)50)(28)(21.0(
000382432.0 −== gmESA

152
E/V vs NHE
I/A
cm
-2
0.0 0.2 0.4 0.6 0.8 1.0
-0.003
-0.002
-0.001
0.000
0.001
0.002
0.003
Pt/MWCNT (9.9%)
Area
Figure A.2 Sample ESA graph for Pt/MWCNT
A.4 Calculation of Pt utilization
The Pt utilization is related with the contact of the metal and the acccessibility
of the metals with the electrolyte. It is expressed by the ratio of ESA to SA as
given below:
100(%)SA
ESAPt ut = (A.5)
The Pt utilization for the prepared Pt/MWCNT is given below:
Pt/MWCNT; %931002.140
130(%) ==utPt

153
A.5 Calculation of Tafel slope
By using the voltage-current density data and the formula given below the
Tafel slope was calculated for Pt/Regal as given in Figure A3.
( )ibaVact log+=∆ and cellrevact VVV −=∆ (A.6)
Slope= 68 mV/dec
log (i)
0.0 0.2 0.4 0.6 0.8 1.0 1.2 1.4
Vac
t
0.30
0.32
0.34
0.36
0.38
0.40
0.42
Figure A.3 Tafel slope for Pt/Regal

154
APPENDIX B
MEA PREPARATION PROTOCOL
1. Nafion 112 is cut into 5cm*5cm dimensions.
2. GDL 31BC type gas diffusion layer is cut into 2.1cm*2.1 cm
dimensions and weighed with a balance (X=tare of the GDL).
3. Catalyst solution is prepared. The amounts of the chemicals given
below are based on 20% Pt/C catalyst and 0.4 mgPt/cm2 on the
electrode.
Pt/C amount=(0.4 mgPt/cm2)*(5 cm2)(100 mgPt/C/20mgPt)/1000
=0.01 g Pt/C
Nafion amount=(0.01)*(0.3)/(0.7)=0.0043 g Nafion
Nafion solution amount=(0.0043)*100/5=0.0857 g Nafion solution
3 times more than required amounts per 1 electrode to compensate the
losses arised from spraying;
0.03 g Pt/C (20%)
0.2571 g Nafion solution (5%)
2 ml H2O
4 ml
This chemicals are mixed and then ultrasonicated for 1 hour and then
sprayed onto the GDL by using spray gun and dried by a hot air gun.
155
4. After sprayed and dried the GDL weighed periodically to see if the
weight of the GDL is reached to: Xfinal=X+(0.01)+(0.0043) g. If the
weight is reached to Xfinal then the GDLs are ready for hot pressing.
5. Two electrodes are prepared in the same way and then they placed on
two sides of the Nafion 112 membrane reciprocally. Then the MEA is
hot pressed at 130ºC and 250 psi.
6. After the hot press waited for a while for the MEA to cool down and
then it is ready for use in fuel cell.

156
APPENDIX C
CYCLIC VOLTAMMETRY (CV)
By using rotating disk electrode electrochemical characterization of the
catalysts can be made. By this technique some kinetic parameters such as Tafel
slope, reaction orders, and apparent activation enthalpies can be determined in
the absence of mass transport effects. To make the electrochemical
characterization by using RDE mostly a three electrode cell configuration
which includes counter, working and reference electrodes was used.
Working electrode (WE): The desired reaction takes place at the WE. Mostly a
glassy carbon disk or ring electrode were used. The functions of the reference
and counter electrodes are to ensure that the WE actually experiences the
desired conditions, i.e. correct potential intended to be applied.
Reference electrode (RE): Function is to measure the potential at the interface
of the WE and the sample as accurately as possible. In an ideal situation, no
current passes through the RE. Ag-AgCl, Hg-HgSO4 can be used.
Counter electrode (CE): function is to ensure that the correct potential
difference between the RE and the WE is being applied. Platinum wire can be
used as CE.
The potential difference between the WE and the RE is assumed to be the same
as the desired potential at the WE. If the potential measured at the WE is not
the potential desired at the WE, the potential that is applied between the CE

157
and WE is altered accordingly, i.e. the potential is either increased or
decreased.
The reaction at the CE is also equal and opposite to the charge transfer reaction
occuring at the WE, i.e. if an oxidation reaction is occuring at the WE then a
reduction reaction will take place at the CE, thereby allowing the sample to
remain electrically neutral.
A RE provides a reference for the voltage applied at the WE. The voltage
applied must be sufficient to oxidize or reduce the species (molecule or ion) of
interest at the surface of the WE. The voltage required is determined by the
ease of removing or adding an electron to the species of interest. Because this
voltage is applied externally (by means of potentiostat or battery), the reference
point should be maintained at a constant value. If the value of the reference
point changes with time, the external voltage applied should be varied
accordingly. The three electrode cell configuration for CV measurements is
given in Figure C.1.
As counter electrode mostly Pt wire is used because it is assumed to be an inert
metal. In the WE desired oxidation or reduction reactions occur and if a
reduction reaction occurs in WE in the CE oxidation reaction occurs and vice
versa. The reaction at the WE needs to be examined to determine the
relationship between the current and the voltage that is required to drive this
reaction. Measurement of the potential between the WE and RE allows the
change in potential of the WE needed to cause current to flow to be found.
Normally the RE is seperated from the WE with a compartment which is then
connected with the WE with a salt bridge which contains the electrolyte. This
permits separation of the bulk properties of the electrolyte from the interfacial
properties. To minimize the additional resistance placed two as close as
possible without disturbing the current flow to the WE.

158
Figure C.1 Three electrode cell configuration
RE provides a standard redox reaction that will accept or give up electrons to
the electrolyte. Ag/AgCl RE consists of a Ag metal wire and a AgCl salt. The
basic reaction:
Ag Ag+ + e- (C.1)
The Ag and Ag+ are surrounded by a solution of KCl which maintains
electrical neutrality. When the reaction goes to the right then a K+ is released to
the electrolyte through the salt bridge because salt bridge only allows ions to
pass not electrolyte. When the reaction goes to the left then a Cl- is released
through the salt bridge.
V
i
Potentiostat
Computer
Working electrode
Counter electrode
Reference electrode
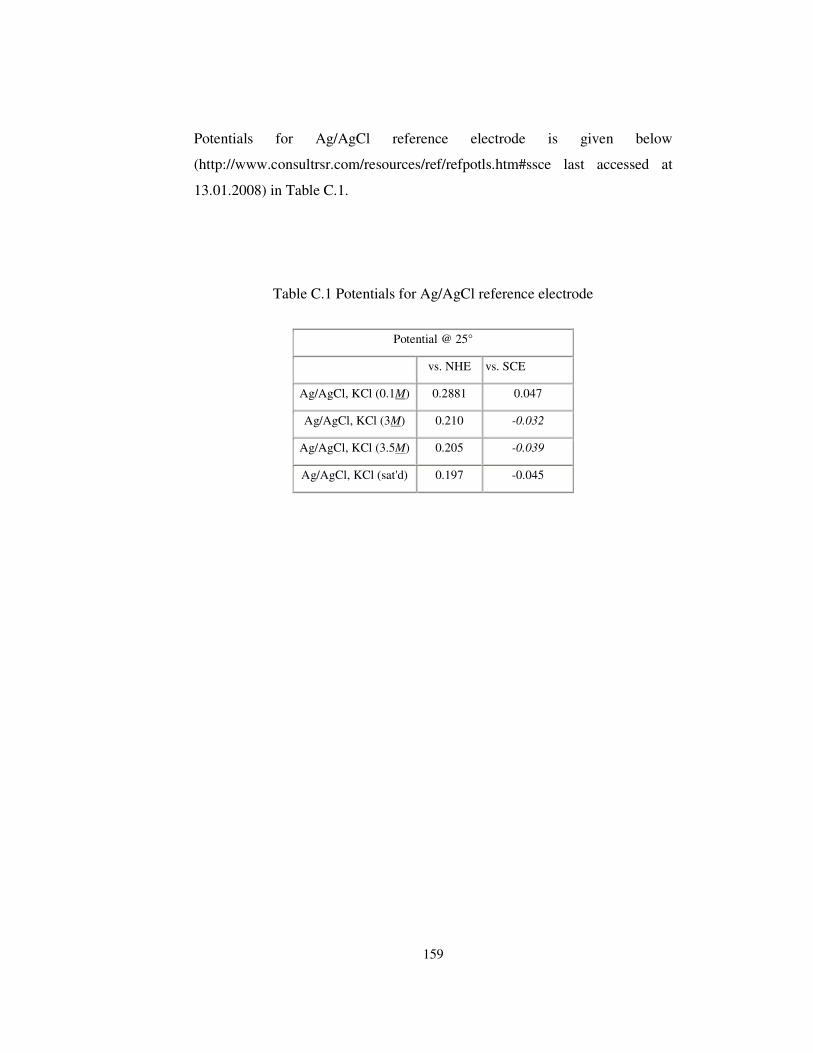
159
Potentials for Ag/AgCl reference electrode is given below
(http://www.consultrsr.com/resources/ref/refpotls.htm#ssce last accessed at
13.01.2008) in Table C.1.
Table C.1 Potentials for Ag/AgCl reference electrode
Potential @ 25°
vs. NHE vs. SCE
Ag/AgCl, KCl (0.1M) 0.2881 0.047
Ag/AgCl, KCl (3M) 0.210 -0.032
Ag/AgCl, KCl (3.5M) 0.205 -0.039
Ag/AgCl, KCl (sat'd) 0.197 -0.045

160
APPENDIX D
FUEL CELL OPERATING PROTOCOL
After the fuel cell is connected to the home made test station the following
procedure is followed:
• The humidifiers temperatures were set to 70ºC.
• The fuel cell temperature was set to 70ºC.
• The gas lines coming from humidifiers to fuel cell are heated to 75ºC.
• Before the gases opened anode side of the fuel cell was purged with
nitrogen.
• After the set temperatures were reached then the hydrogen and oxygen
gases were opened with a flow rate of 0.1 slm.
• The fuel cell operated at 0.5 V overnight.
• The current density-potential data were recorded in the period of 15
min time intervals. When the steady state is reached the system closed.

161
APPENDIX E
REPRODUCIBILITY
To determine the reproducibility of the prepared catalysts a Pt/VX catalts was
prepared by microwave irradiation in different batch of experiments. Then the
PEMFC test results were performed to see the reproducubility. The Figure E.1
shows the PEMFC performance results for 2 batches of the Pt/VX catalyst.
0 200 400 600 800 1000
0.0
0.2
0.4
0.6
0.8
1.0
Run 1
Run 2
Current density, mA/cm2
Vo
lta
ge,
V
Figure E1 Reproducibility of the catalyst of Pt/VX (20%)

162
CURRICULUM VITAE
Ayşe Bayrakçeken Middle East Technical University
Department of Chemical Engineering 06531 Ankara/Turkey
PERSONAL INFORMATION Nationality: Turkish (TC) Place of Birth: Erzurum Phone: +90 312 210 43 54 Fax: +90 312 210 26 00 E-mail: [email protected] EDUCATION Degree Institution Year of Graduation Ph. D. METU Chemical Engineering 2008 M. Sc. METU Chemical Engineering 2004 B. Sc Atatürk University Chemical Engineering 2000 High School Erzurum
Anatolian High School 1996 WORK EXPERIENCE Year Place Enrollment 1998 July Erzurum Sugar Factory Internship 1999 July Doyasan Butter Factory Internship MEMBERSHIPS 2006 - Catalysis Society of Turkey
163
FOREIGN LANGUAGES Fluent English, Beginner German PROFESSIONAL 2002- 2008, Research Assistant; Middle East Technical University (METU), Department of Chemical Engineering, Ankara, Turkey. 2006 January - August, Visiting Scientist; University of Connecticut, Department of Chemical, Materials and Biomolecular Engineering, Storrs, Connecticut, USA, “Preparation of Carbon Supported Platinum and Ruthenium Alloy Catalysts Using Supercritical Fluids”. PUBLICATIONS Refereed Journals: 1. Bayrakçeken, A., Smirnova, A., Kitkamthorn, U., Aindow, M., Türker, L.,
Eroğlu, İ., Erkey, C., “Vulcan supported Pt electrocatalysts for PEMFCs by using supercritical carbon dioxide deposition”, Chemical Engineering Communications, Article in press.
2. Bayrakçeken, A., Smirnova, A., Kitkamthorn, U., Aindow, M., Türker, L.,
Eroğlu, İ., Erkey, C., “Pt-based electrocatalysts for polymer electrolyte fuel cells prepared by supercritical deposition technique”, Journal of Power Sources 179 (2008) 532-540.
3. Bayrakçeken, A., Erkan, S., Türker, L., Eroğlu, İ., “Effects of membrane
electrode assembly components on proton exchange membrane fuel cell performance”, International Journal of Hydrogen Energy, 33 (2008) 165-170.
4. Bayrakceken, A., Kitkamthorn, U., Aindow, M., Erkey, C., “Decoration of
multi-wall carbon nanotubes with platinum nanoparticles using supercritical deposition with thermodynamic control of metal loading”, Scripta Materialia 56 (2007) 101-103.

164
National and International Conference Presentations 1. Bayrakçeken, A., Smirnova, A., Kitkamthorn, U., Aindow, M., Türker, L.,
Eroğlu, İ., Erkey, C., “High Pt loading Pt/Vulcan electrocatalysts for PEMFCs by Using Supercritical Carbon Dioxide technique”, Somer Symposium Series 1, Ankara-Türkiye, May 2007.
2. Bayrakçeken, A., Smirnova, A., Kitkamthorn, U., Aindow, M., Türker, L.,
Eroğlu, İ., Erkey, C., “Synthesis and Characterization of Pt Based Electrocatalysts by Supercritical Carbon Dioxide Deposition Method”, First National Catalysis Conference, Güzelyurt-Kıbrıs, January 2007.
3. Bayrakçeken, A., Smirnova, A., Kitkamthorn, U., Aindow, M., Türker, L.,
Eroğlu, İ., Erkey, C., “Preparation and Characterization of Pt-based Electrocatalysts for PEM Fuel Cells by Using Supercritical Carbon Dioxide Deposition”, International Hydrogen Energy Congress and Exhibition, İstanbul-Türkiye, July 2007.
4. Aindow, M., Kang, D., Kitkamthorn, U., Saquing, C.D., Zhang, Y.;
Bayrakceken, A., and Erkey, C. “Transmission Electron Microscopy Studies of Mesoporous Carbon Aerogels and Carbon/Metal Nanocomposites Produced using Supercritical Carbon Dioxide Based Processes”, Brazilian MRS Meeting, Florianopolis-Brazil, October 2006.
5. Eroğlu, İ., Erkan S., Bayrakçeken, A., Türker, L., “Utilization of Metal
Phthalocyanines as Cathode Catalysts of Proton Exchange Membrane Fuel Cells”, AIChE Annual Meeting, San Francisco, CA-USA, November-2006.
6. Erkan, S., Bayrakçeken, A., Türker, L., Eroğlu, İ., “Synthesis of
Metallophthalocyanines and Their Effects on the Performance of Fuel Cells”, Hydrogen is the Future Workshop, İstanbul-Türkiye, March 2005.
7. Bayrakçeken, A., Erkan, S., Türker, L., Eroğlu, İ., “Development of Membrane Electrode Assembly for Proton Exchange Membrane Fuel Cells”, Hydrogen is the Future Workshop, İstanbul-Türkiye, March 2005.
8. Erkan S., Bayrakçeken, A., Türker, L., Eroğlu, İ., “Utilization of
Metallophthalocyanines as Cathode Catalyst of Proton Exchange Membrane Fuel Cells”, International Hydrogen Energy Congress and Exhibition, İstanbul-Türkiye, July 2005.
9. Bayrakçeken, A., Erkan, S., Türker, L., Eroğlu, İ., “Effect of Different
Construction Materials on Proton Exchange Membrane Fuel Cell Performance”, International Hydrogen Energy Congress and Exhibition, İstanbul-Türkiye, July 2005.

165
10. Bayrakçeken, A., Türker, L., Eroğlu, İ., “Proton Değişim Zarlı bir Yakıt Hücresinin Performansı Üzerine Farklı Parametrelerin Etkisi”, Ulusal Kimya Mühendisliği Kongresi 6, İzmir-Türkiye, September 2004.
AWARDS: 1. 2nd Rank Student Award, Faculty of Engineering, Atatürk University, 2000. 2. 2nd Rank Student Award, Department of Chemical Engineering, Atatürk
University, 2000. SUMMER SCHOOLS: 1. First Anatolian School on Catalysis (ASC-I), September 25 – October 6,
2006, Middle East Technical University, Ankara, Turkey, (Workshop I: Master class Catalysis. Workshop II: Computational Catalysis).
RESEARCH PROJECTS: 1. “Platinum and Platinum-Ruthenium based catalysts on various carbon
supports prepared by different methods foe PEM fuel cell applications”, METU Foundation, Researcher.
2. “Yüksek sıcaklıkta çalışabilen Proton Değişim Zarlı Yakıt Hücresi geliştirilmesi”, TÜBİTAK, Researcher.
3. “Hidrojen gazı üretimi, depolanması ve yakıt hücrelerinde elektrik elde edilmesi”, DPT-YUUP, Researcher.