plastics and friction
DESCRIPTION
Twenty-one different commercial-grade engineering polymers, including virgin and composite types, wereselected for testing, based on mechanical engineering practices. Three groups were formed according to typical applications: 1) Sliding machine element materials; 2)Mechanically load-carrying machine element materials that are often subjected to friction and wear effects; and 3) Additional two amorphous materials used as chemically resistant materials thathave rare sliding load properties. The friction running-in state was tested using a dynamic pin-on-plate test rig. Duringsteady-state friction tests, two pv regimes (0.8 and 2MPa"ms–1) were analysed by a pin-on-disc test system. Based on themeasured forces on ground structural steel, surface friction coefficients were calculated and analysed with respect to themechanical effects of friction. The friction results were evaluated by the measured mechanical properties: yield stress,ShoreD hardness, Young’s modulus and elongation at the break.The three material groups exhibited different trends in friction with respect to changing mechanical properties. Linear (withvarying positive and negative slopes), logarithmic and exponential relationships were observed, and occasionally therewere no effects observed. At steady-state friction, the elongation at the break had less effect on the friction coefficients. Thedynamic sliding model, which correlates better to real machine element applications, showed that increasing hardness andyield stress decreases friction. During steady-state friction, an increase in pv regime often changed the sign of the linearrelationship between the material property and the friction, which agrees with the frictional theory of polymer/steel slidingpairs.TRANSCRIPT
1. IntroductionThe effect of friction on the wear of engineeringpolymers is a complex and intricate consequence ofthe micro- and macroscopic interactions of surfacesmoving against one another. Friction and the result-ing wear are not material properties of plastics;therefore, they cannot be reduced to tabular data ofmaterial characteristics that can be found in relevantmanuals. Determining friction and the resulting wear
involves more complex examination because theyare characteristics of a frictional contact systemwhere the effects of the entire system are manifest.Precise knowledge of system conditions is essentialto evaluate the friction and resulting wear [1]. Thesematerials have system-dependent tribological behav-iour; thus, trends can be defined at a given condi-tion, and the materials can be compared. The sys-tem approach is well-known from the literature [2,
199
An engineering approach to dry friction behaviour ofnumerous engineering plastics with respect to themechanical propertiesG. Kalácska*
*Institute for Mechanical Engineering Technology, Faculty of Mechanical Engineering, Szent István University, H-2100Gödöll!, Hungary
Received 5 August 2012; accepted in revised form 13 October 2012
Abstract. Twenty-one different commercial-grade engineering polymers, including virgin and composite types, wereselected for testing, based on mechanical engineering practices. Three groups were formed according to typical applica-tions: 1) Sliding machine element materials; 2) Mechanically load-carrying machine element materials that are often sub-jected to friction and wear effects; and 3) Additional two amorphous materials used as chemically resistant materials thathave rare sliding load properties. The friction running-in state was tested using a dynamic pin-on-plate test rig. Duringsteady-state friction tests, two pv regimes (0.8 and 2 MPa"ms–1) were analysed by a pin-on-disc test system. Based on themeasured forces on ground structural steel, surface friction coefficients were calculated and analysed with respect to themechanical effects of friction. The friction results were evaluated by the measured mechanical properties: yield stress,Shore D hardness, Young’s modulus and elongation at the break.The three material groups exhibited different trends in friction with respect to changing mechanical properties. Linear (withvarying positive and negative slopes), logarithmic and exponential relationships were observed, and occasionally therewere no effects observed. At steady-state friction, the elongation at the break had less effect on the friction coefficients. Thedynamic sliding model, which correlates better to real machine element applications, showed that increasing hardness andyield stress decreases friction. During steady-state friction, an increase in pv regime often changed the sign of the linearrelationship between the material property and the friction, which agrees with the frictional theory of polymer/steel slidingpairs.
Keywords: material testing, friction of plastics, mechanical properties
eXPRESS Polymer Letters Vol.7, No.2 (2013) 199–210Available online at www.expresspolymlett.comDOI: 10.3144/expresspolymlett.2013.18
*Corresponding author, e-mail: [email protected]© BME-PT
3] and was published in the former German stan-dard DIN 50322 [4] in the section on wear test cate-gories.The tribology of polymeric materials involves com-plicated frictional systems where the deformationand thermal effects of the contact zone, time-depen-dent stress states, surface energy characteristics,etc., play important roles [5]. Because polymershave gained a more accepted position among indus-trial materials, plastics are no longer second–classmaterials. They have become elements of realmachines, and the need for tribological knowledgehas risen from the many frictional applications nowinvolving plastics. Some general knowledge of poly-mers and composites has been published summaris-ing global experiences, e.g., wear mechanism andparticle detachment, transfer films, and the effectsof reinforcements and lubricants [6–8]. Large num-bers of papers have addressed a given material fam-ily, e.g., polyamides, under different conditions, suchas abrasive effects [9–12]. With respect to dry orlubricated conditions of polymer sliding, the princi-ples of some commonly used material families havebeen tested, and the role of adhesion and surfaceenergy has been discussed [13, 14]. There have beeninitiatives to find the correlation between the wearbehaviour and the mechanical properties of poly-mers, but difficult or weak correlations have beenfound, primarily because of the limited condition ofthe wear systems and the selected material families[15–18]. In recent years, research has focused onthe surface-modified engineering polymers andnano-composites because of new technology thatenhances the tribological behaviour by changing themolecular or matrix structure to change the surfaceor bulk properties [19–21].
In the tribological literature of engineering poly-mers, most of the research is related to materials,material families or operating conditions. Littleinformation is available regarding mechanical engi-neering applications to compare the different mate-rial families and typically applied material groups.The present research investigates the frictional behav-iour of several engineering polymers in sliding andmechanical load-carrying applications to determinetrends between the mechanical properties and fric-tion.
2. Selected materials and their mechanicalproperties
The engineering plastic samples tested weremachined from commercially available semi-fin-ished stock shapes, namely, from rods. The rodswere manufactured by Sustaplast GmbH (Ger-many), Quadrant EPP (Belgium), Ensinger GmbH(Germany), Teraglobus Ltd. (Hungary) and Quat-troplast Ltd. (Hungary), and they were procuredfrom Teraglobus (Hungary) and Quattroplast (Hun-gary). The mechanical properties were measuredaccording to the appropriate standards (tensile MSZEN ISO 527-1 and hardness MSZ EN ISO 868:2003). Then, the mechanical and tribological testsamples were machined. After one week of condi-tioning in the laboratory (23ºC/60% RH), mechani-cal measurements were repeated five times andaveraged. The measured data were not equal to theproducers’ indicative values, not even for the condi-tioned polyamide-type materials. At TeraglobusLtd.’s laboratory (Instron 3366 for tensile tests,THS-180 hardness tester for Shore D), the follow-ing properties were determined: yield stress (R),Young’s modulus (E), elongation at break (A) and
Kalácska – eXPRESS Polymer Letters Vol.7, No.2 (2013) 199–210
200
Table 1. Selected materials
*Mg catalytic casting process**Na catalytic casting process
Simplified name (code) Known composition Simplified name
(code) Known composition
PTFE PTFE unmodified PETP PETP unmodifiedPTFE/graphite PTFE+(graphite) PETP TF PETP+(PTFE)UHMW-PE HD500 UHMW-PE HD500 unmodified l POM C POM C unmodifiedUHMW-PE HD1000 UHMW-PE HD1000 unmodified PPS HPV PPS+(GF+oil)PA 4.6 PA 4.6 unmodified PSU PSU unmodifiedPA6E PA6 Extruded, unmodified PES PES unmodified*PA6G(Mg) *PA6G(Mg) cast, unmodified PVDF PVDF unmodified*PA6G(Mg)/oil *PA6G(Mg)+(oil) PEEK PEEK unmodified**PA6G(Na)/MoS2
**PA6G(Na)+(MoS2) PEEK GF PEEK+(GF)**PA6G/PE **PA6G(Na)+(PE) PEEK Mod PEEK+(CF+PTFE+graphite)PA 66 GF30 PA 66+(GF)
Shore D hardness (H). Table 1 shows the materialsand the published compositions, while Table 2 showsthe measured properties in the three material groups:a) sliding, b) load-carrying and c) other amorphousstructural materials. The selected sliding materialsare typically used for slide bearings, trust washers,sliding supports and pads, gears and worms, wherepv (normal load multiplied by sliding speed) is thebasis of the construction and the design. The plasticsof the second group often face significant mechani-cal loads in addition to friction effects. The thirdgroup (amorphous PES and PSU) is rarely sub-jected to frictional loads, although it is possible. Thetarget applications for PES and PSU focus mainlyon chemical and heat resistance. The knowledge,experiences and suggestions for engineering solu-tions of the main producers (Quadrant, Ensinger,and Röchling) serve as the basis for the grouping.
3. Experimental design3.1. Pin-on-disc and dynamic pin-on-plate test
systemsTo measure the friction in comparative test systems,the pin-on-disc test method and the dynamic pin-on-plate test system are selected, using classical
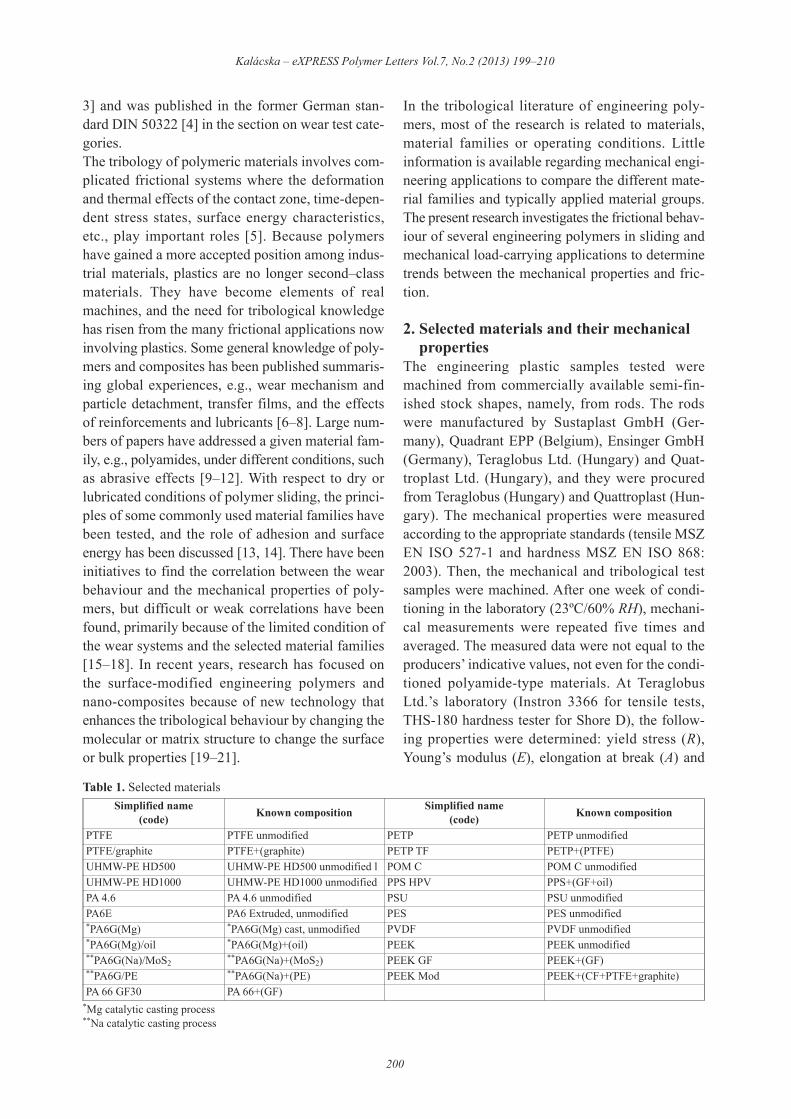
(not overloaded) polymer/steel friction processes[1], as shown in Figure 1 [22]. The load and slidingspeed values of the test systems correspond to dryslide bearing applications of engineering plasticswith high safety factors.After starting, the friction coefficient increases dur-ing the running-in period. During the running-inperiod, the contact zone is being reformed andrestructured (e.g., the topographical and surface lay-ers), strongly influencing the steady-state frictionbehaviour and the real working lifetime. After therunning-in period, a transient zone appears where themaximum coefficient of friction can be measured.During the running-in, a polymeric film forms on themicro-topography of the steel surface. An increas-ing force is then required to continue the slidingprocess because of the interfering mechanical cuttingand forming of the contact zone and adhesive effectsbetween the materials. As the polymer film forms, theadhesive component of the friction increases fromthe polymer/polymer contact, which has strongeradhesion than the steel/polymer contact. At themaximum point of friction in the transition zone,the re-adhesion process of the polymer film starts toprovide a dynamic balance during further sliding,resulting in what is termed the steady-state of fric-tion (force and coefficient). This phenomenon isshown in Figure 2 [22].As shown in Figure 1, the pin-on-disc measuringsystem evaluates the friction process at steady-statein two pv regimes, characterising the µmax and µav(average). The pv regimes set for the tests are typicalfor the normal application of plastic machine ele-ments having a high safety factor. The difference
Kalácska – eXPRESS Polymer Letters Vol.7, No.2 (2013) 199–210
201
Table 2. Material groups and mechanical properties (mea-sured and averaged values)
Simplified name R[MPa]
A[%]
E[MPa]
H[Shore D]
Sliding materials (Material Group 1)PTFE 30.9 384 544.8 55.2PTFE/graphite 33.1 222 606.5 58.6UHMW-PE HD500 28.4 585 1350.8 66.0UHMW-PE HD1000 20.6 298 744.6 62.3PA6G(Mg)/oil 52.5 58 1808.2 81.5PA6G(Na)/MoS2 65.5 53 2020.4 82.1PA6G/PE 45.1 78 1811.4 77.4PETP TF 75.3 12 2806.3 82.8PPS HPV 74.1 8 3712.8 80.1PEEK Mod 121.5 5 7808.2 85.3PETP 85.6 19 2991.7 83.3
Load-carrying materials (Material group 2)PA 4.6 56.5 106 11288.8 78.5PA6E 47.2 81 1603.6 79.2PA6G(Mg) 57.9 69 2034.4 82.3PA 66 GF30 89.2 19 3900.8 84.7POM C 74.5 34 2996.4 83.6PVDF 58.3 30 2110.5 81.4PEEK 108.4 25 3904.6 87.2PEEK GF 156.9 5 9688.5 89.1
Other amorphous (Material Group 3)PSU 77.8 19 2608.5 83.1PES 87.1 16 2689.3 82.6
Figure 1. Friction stages between polymer/steel pairs andthe placement of pin-on-disc and dynamic pin-on-plate test systems.dynamic1: 1 cycle of sliding path test within the
running-in phasedynamicc: Complete (5 cycles of sliding path)
dynamic sliding testpin-on-disc I, II test systems: After the running-in
period, µmax and µav are measured
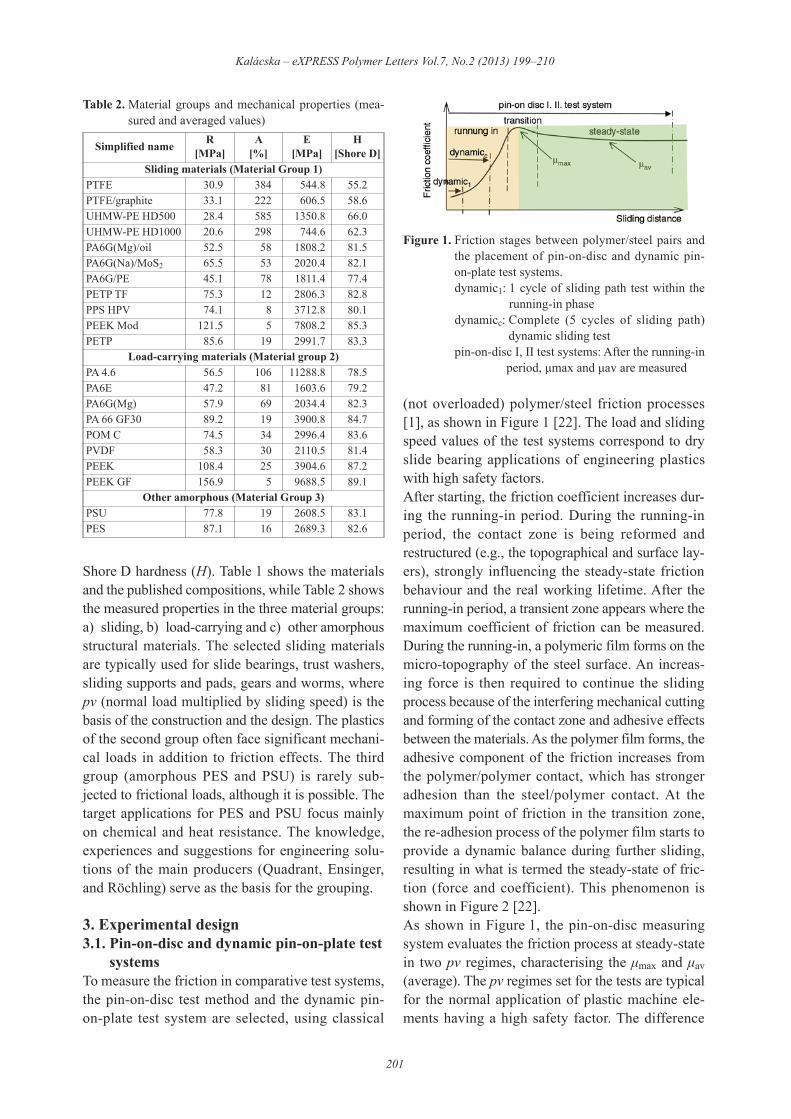
between the two systems is the normal load; the slid-ing speed is held constant. During the evaluation, itis important to know how the change in normal loadinfluences the frictional force and coefficient [1, 22,23] (Figure 3). According to the theory of friction[5, 23], the dry friction force, Ff, is equal to the sumof the adhesion and the deformation components,Ff = Fa + Fd. The special case at low loads, whenthe deformation component may be orders of mag-nitude smaller than the adhesion component(Fa >>Fd), leads to the relation Ff#Fa. The researchresults will show that the set pv-s yields near-opti-mum (Figure 3) friction values for most of theselected materials.The dynamic pin-on-plate test system was utilisedduring the running-in period. Dynamic1 representsone sliding cycle of the programmed sliding path,while dynamicc refers to the complete dynamic testprogram, i.e., five repeated cycles of the pro-grammed sliding path. The dynamic modellingmethod and test rig were developed at Szent IstvánUniversity, where a better laboratory model of thereal dynamic effects of the machine elements couldbe made. The details of the method have beendescribed previously [24].
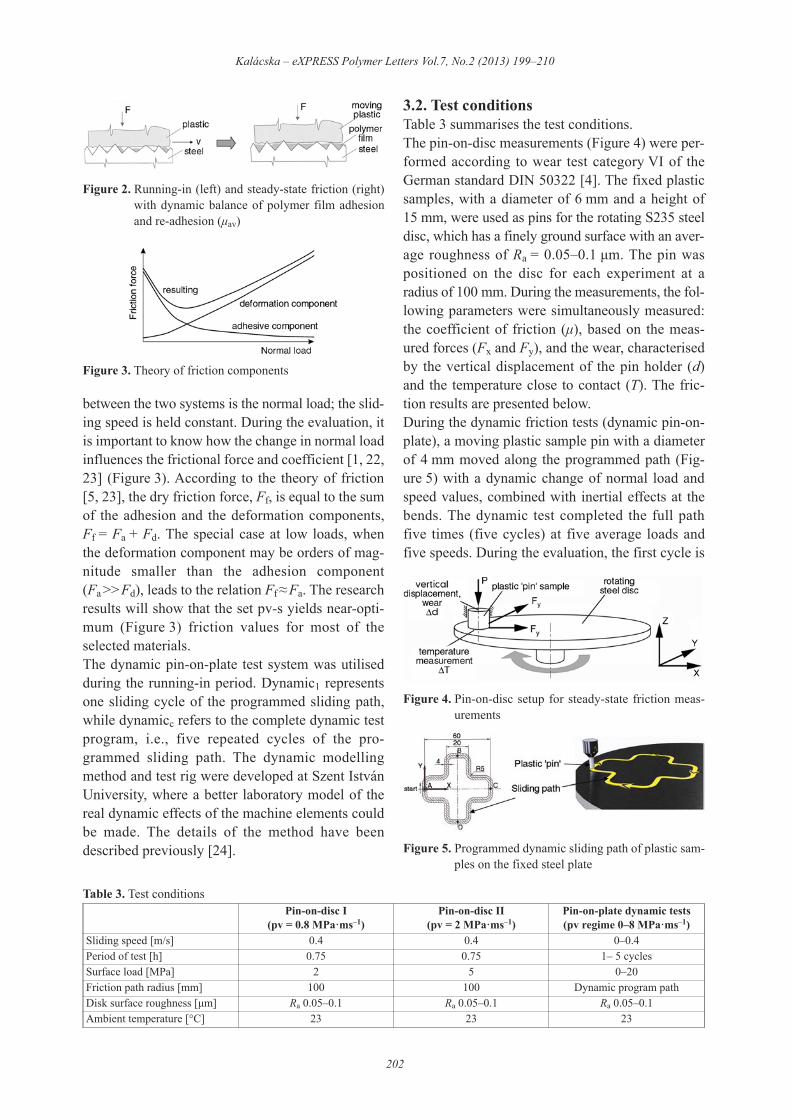
3.2. Test conditionsTable 3 summarises the test conditions.The pin-on-disc measurements (Figure 4) were per-formed according to wear test category VI of theGerman standard DIN 50322 [4]. The fixed plasticsamples, with a diameter of 6 mm and a height of15 mm, were used as pins for the rotating S235 steeldisc, which has a finely ground surface with an aver-age roughness of Ra = 0.05–0.1 µm. The pin waspositioned on the disc for each experiment at aradius of 100 mm. During the measurements, the fol-lowing parameters were simultaneously measured:the coefficient of friction (µ), based on the meas-ured forces (Fx and Fy), and the wear, characterisedby the vertical displacement of the pin holder (d)and the temperature close to contact (T). The fric-tion results are presented below.During the dynamic friction tests (dynamic pin-on-plate), a moving plastic sample pin with a diameterof 4 mm moved along the programmed path (Fig-ure 5) with a dynamic change of normal load andspeed values, combined with inertial effects at thebends. The dynamic test completed the full pathfive times (five cycles) at five average loads andfive speeds. During the evaluation, the first cycle is
Kalácska – eXPRESS Polymer Letters Vol.7, No.2 (2013) 199–210
202
Figure 2. Running-in (left) and steady-state friction (right)with dynamic balance of polymer film adhesionand re-adhesion (µav)
Figure 3. Theory of friction components
Table 3. Test conditionsPin-on-disc I
(pv = 0.8 MPa!ms–1)Pin-on-disc II
(pv = 2 MPa!ms–1)Pin-on-plate dynamic tests(pv regime 0–8 MPa!ms–1)
Sliding speed [m/s] 0.4 0.4 0–0.4Period of test [h] 0.75 0.75 1– 5 cyclesSurface load [MPa] 2 5 0–20Friction path radius [mm] 100 100 Dynamic program pathDisk surface roughness [µm] Ra 0.05–0.1 Ra 0.05–0.1 Ra 0.05–0.1Ambient temperature [°C] 23 23 23
Figure 4. Pin-on-disc setup for steady-state friction meas-urements
Figure 5. Programmed dynamic sliding path of plastic sam-ples on the fixed steel plate
illustrated separately (as shown in Figure 1) fromthe averaged values of the completed five cycles.
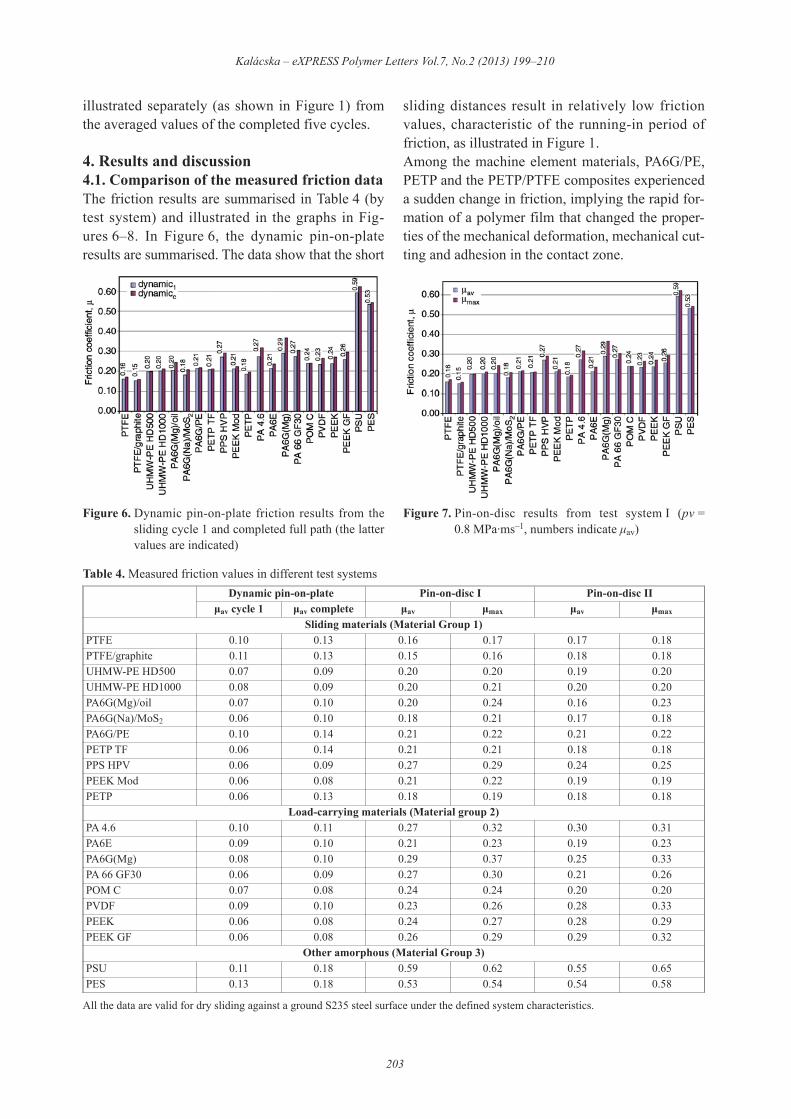
4. Results and discussion4.1. Comparison of the measured friction dataThe friction results are summarised in Table 4 (bytest system) and illustrated in the graphs in Fig-ures 6–8. In Figure 6, the dynamic pin-on-plateresults are summarised. The data show that the short
sliding distances result in relatively low frictionvalues, characteristic of the running-in period offriction, as illustrated in Figure 1.Among the machine element materials, PA6G/PE,PETP and the PETP/PTFE composites experienceda sudden change in friction, implying the rapid for-mation of a polymer film that changed the proper-ties of the mechanical deformation, mechanical cut-ting and adhesion in the contact zone.
Kalácska – eXPRESS Polymer Letters Vol.7, No.2 (2013) 199–210
203
Table 4. Measured friction values in different test systems
All the data are valid for dry sliding against a ground S235 steel surface under the defined system characteristics.
Dynamic pin-on-plate Pin-on-disc I Pin-on-disc IIµav cycle 1 µav complete µav µmax µav µmax
Sliding materials (Material Group 1)PTFE 0.10 0.13 0.16 0.17 0.17 0.18PTFE/graphite 0.11 0.13 0.15 0.16 0.18 0.18UHMW-PE HD500 0.07 0.09 0.20 0.20 0.19 0.20UHMW-PE HD1000 0.08 0.09 0.20 0.21 0.20 0.20PA6G(Mg)/oil 0.07 0.10 0.20 0.24 0.16 0.23PA6G(Na)/MoS2 0.06 0.10 0.18 0.21 0.17 0.18PA6G/PE 0.10 0.14 0.21 0.22 0.21 0.22PETP TF 0.06 0.14 0.21 0.21 0.18 0.18PPS HPV 0.06 0.09 0.27 0.29 0.24 0.25PEEK Mod 0.06 0.08 0.21 0.22 0.19 0.19PETP 0.06 0.13 0.18 0.19 0.18 0.18
Load-carrying materials (Material group 2)PA 4.6 0.10 0.11 0.27 0.32 0.30 0.31PA6E 0.09 0.10 0.21 0.23 0.19 0.23PA6G(Mg) 0.08 0.10 0.29 0.37 0.25 0.33PA 66 GF30 0.06 0.09 0.27 0.30 0.21 0.26POM C 0.07 0.08 0.24 0.24 0.20 0.20PVDF 0.09 0.10 0.23 0.26 0.28 0.33PEEK 0.06 0.08 0.24 0.27 0.28 0.29PEEK GF 0.06 0.08 0.26 0.29 0.29 0.32
Other amorphous (Material Group 3)PSU 0.11 0.18 0.59 0.62 0.55 0.65PES 0.13 0.18 0.53 0.54 0.54 0.58
Figure 6. Dynamic pin-on-plate friction results from thesliding cycle 1 and completed full path (the lattervalues are indicated)
Figure 7. Pin-on-disc results from test system I (pv =0.8 MPa·ms–1, numbers indicate µav)
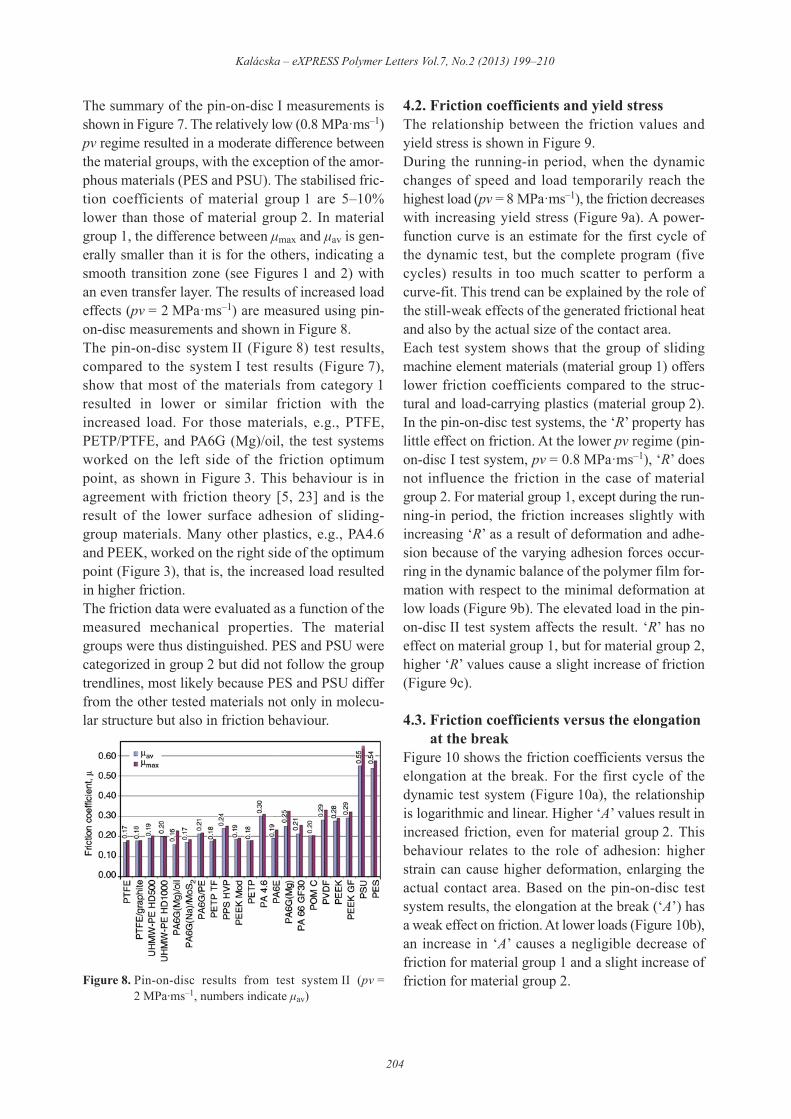
The summary of the pin-on-disc I measurements isshown in Figure 7. The relatively low (0.8 MPa"ms–1)pv regime resulted in a moderate difference betweenthe material groups, with the exception of the amor-phous materials (PES and PSU). The stabilised fric-tion coefficients of material group 1 are 5–10%lower than those of material group 2. In materialgroup 1, the difference between µmax and µav is gen-erally smaller than it is for the others, indicating asmooth transition zone (see Figures 1 and 2) withan even transfer layer. The results of increased loadeffects (pv = 2 MPa"ms–1) are measured using pin-on-disc measurements and shown in Figure 8.The pin-on-disc system II (Figure 8) test results,compared to the system I test results (Figure 7),show that most of the materials from category 1resulted in lower or similar friction with theincreased load. For those materials, e.g., PTFE,PETP/PTFE, and PA6G (Mg)/oil, the test systemsworked on the left side of the friction optimumpoint, as shown in Figure 3. This behaviour is inagreement with friction theory [5, 23] and is theresult of the lower surface adhesion of sliding-group materials. Many other plastics, e.g., PA4.6and PEEK, worked on the right side of the optimumpoint (Figure 3), that is, the increased load resultedin higher friction.The friction data were evaluated as a function of themeasured mechanical properties. The materialgroups were thus distinguished. PES and PSU werecategorized in group 2 but did not follow the grouptrendlines, most likely because PES and PSU differfrom the other tested materials not only in molecu-lar structure but also in friction behaviour.
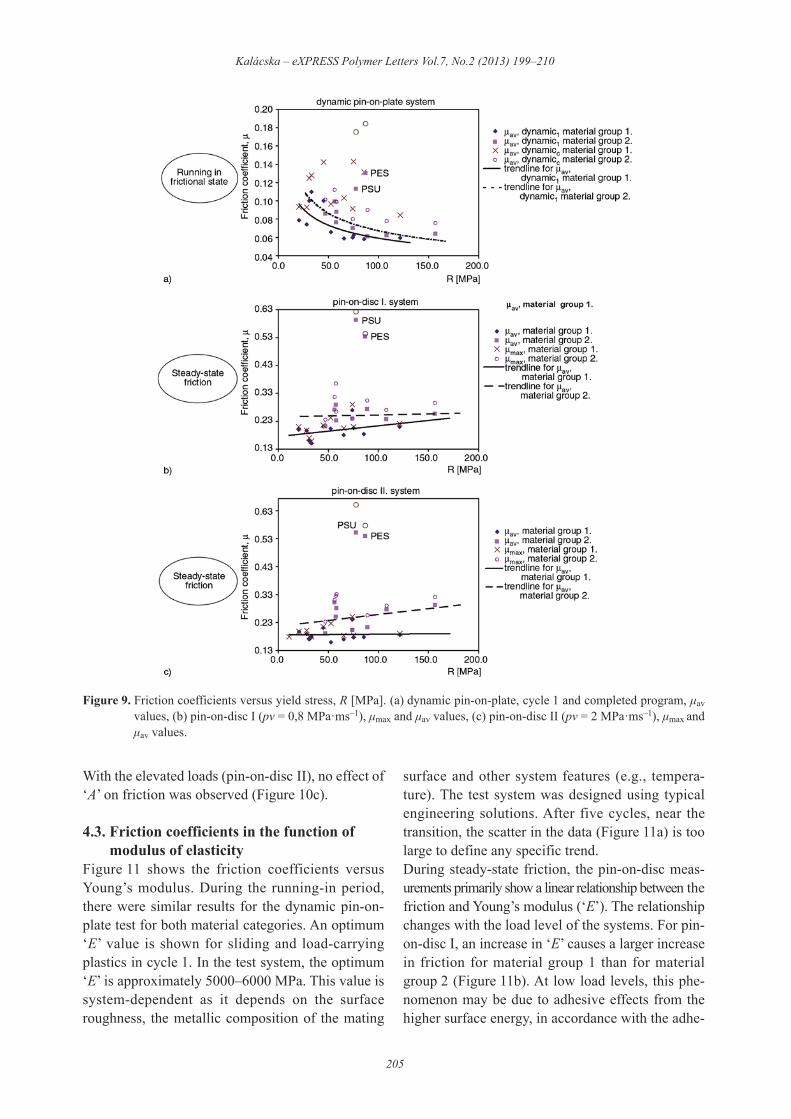
4.2. Friction coefficients and yield stressThe relationship between the friction values andyield stress is shown in Figure 9.During the running-in period, when the dynamicchanges of speed and load temporarily reach thehighest load (pv = 8 MPa"ms–1), the friction decreaseswith increasing yield stress (Figure 9a). A power-function curve is an estimate for the first cycle ofthe dynamic test, but the complete program (fivecycles) results in too much scatter to perform acurve-fit. This trend can be explained by the role ofthe still-weak effects of the generated frictional heatand also by the actual size of the contact area.Each test system shows that the group of slidingmachine element materials (material group 1) offerslower friction coefficients compared to the struc-tural and load-carrying plastics (material group 2).In the pin-on-disc test systems, the ‘R’ property haslittle effect on friction. At the lower pv regime (pin-on-disc I test system, pv = 0.8 MPa"ms–1), ‘R’ doesnot influence the friction in the case of materialgroup 2. For material group 1, except during the run-ning-in period, the friction increases slightly withincreasing ‘R’ as a result of deformation and adhe-sion because of the varying adhesion forces occur-ring in the dynamic balance of the polymer film for-mation with respect to the minimal deformation atlow loads (Figure 9b). The elevated load in the pin-on-disc II test system affects the result. ‘R’ has noeffect on material group 1, but for material group 2,higher ‘R’ values cause a slight increase of friction(Figure 9c).
4.3. Friction coefficients versus the elongationat the break
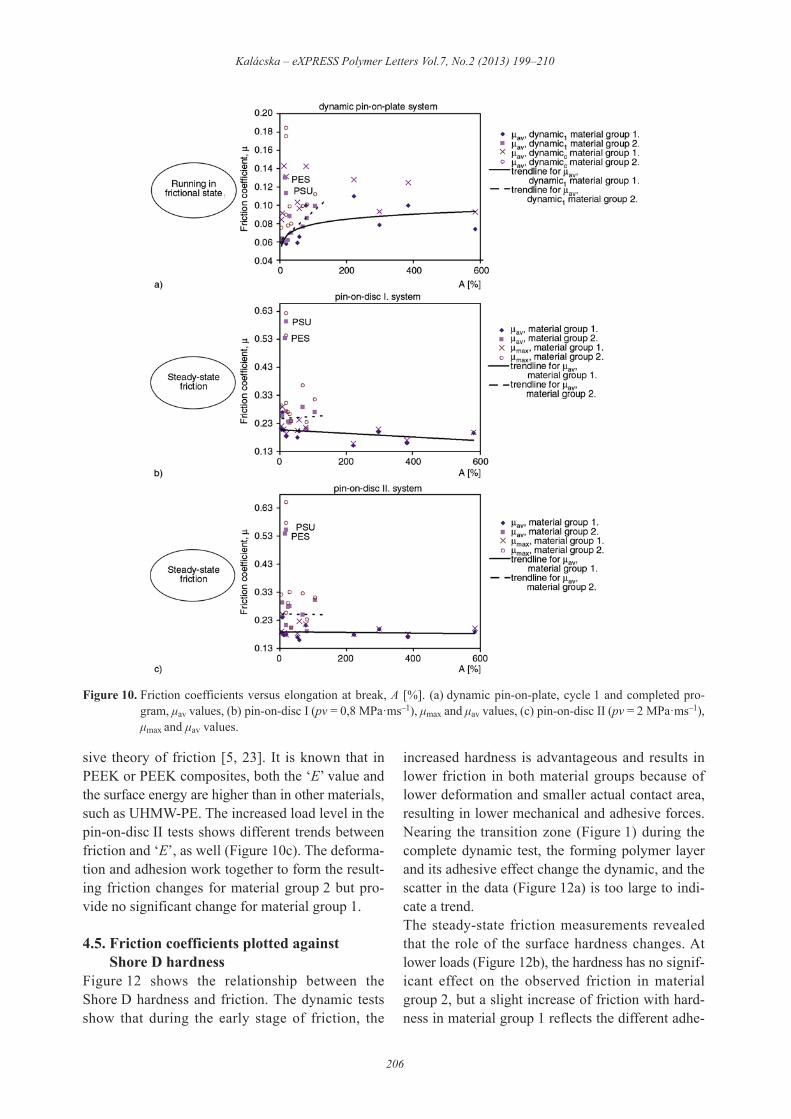
Figure 10 shows the friction coefficients versus theelongation at the break. For the first cycle of thedynamic test system (Figure 10a), the relationshipis logarithmic and linear. Higher ‘A’ values result inincreased friction, even for material group 2. Thisbehaviour relates to the role of adhesion: higherstrain can cause higher deformation, enlarging theactual contact area. Based on the pin-on-disc testsystem results, the elongation at the break (‘A’) hasa weak effect on friction. At lower loads (Figure 10b),an increase in ‘A’ causes a negligible decrease offriction for material group 1 and a slight increase offriction for material group 2.
Kalácska – eXPRESS Polymer Letters Vol.7, No.2 (2013) 199–210
204
Figure 8. Pin-on-disc results from test system II (pv =2 MPa·ms–1, numbers indicate µav)
With the elevated loads (pin-on-disc II), no effect of‘A’ on friction was observed (Figure 10c).
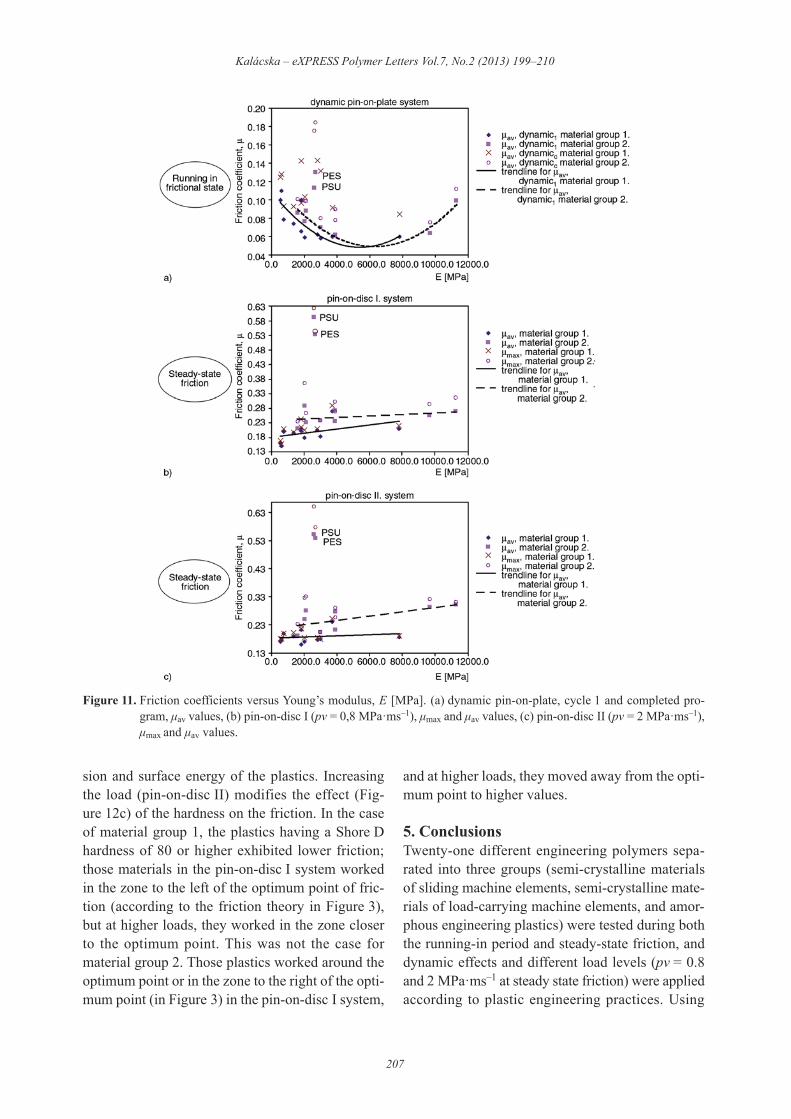
4.3. Friction coefficients in the function ofmodulus of elasticity
Figure 11 shows the friction coefficients versusYoung’s modulus. During the running-in period,there were similar results for the dynamic pin-on-plate test for both material categories. An optimum‘E’ value is shown for sliding and load-carryingplastics in cycle 1. In the test system, the optimum‘E’ is approximately 5000–6000 MPa. This value issystem-dependent as it depends on the surfaceroughness, the metallic composition of the mating
surface and other system features (e.g., tempera-ture). The test system was designed using typicalengineering solutions. After five cycles, near thetransition, the scatter in the data (Figure 11a) is toolarge to define any specific trend.During steady-state friction, the pin-on-disc meas-urements primarily show a linear relationship between thefriction and Young’s modulus (‘E’). The relationshipchanges with the load level of the systems. For pin-on-disc I, an increase in ‘E’ causes a larger increasein friction for material group 1 than for materialgroup 2 (Figure 11b). At low load levels, this phe-nomenon may be due to adhesive effects from thehigher surface energy, in accordance with the adhe-
Kalácska – eXPRESS Polymer Letters Vol.7, No.2 (2013) 199–210
205
Figure 9. Friction coefficients versus yield stress, R [MPa]. (a) dynamic pin-on-plate, cycle 1 and completed program, µavvalues, (b) pin-on-disc I (pv = 0,8 MPa"ms–1), µmax and µav values, (c) pin-on-disc II (pv = 2 MPa"ms–1), µmax andµav values.
sive theory of friction [5, 23]. It is known that inPEEK or PEEK composites, both the ‘E’ value andthe surface energy are higher than in other materials,such as UHMW-PE. The increased load level in thepin-on-disc II tests shows different trends betweenfriction and ‘E’, as well (Figure 10c). The deforma-tion and adhesion work together to form the result-ing friction changes for material group 2 but pro-vide no significant change for material group 1.
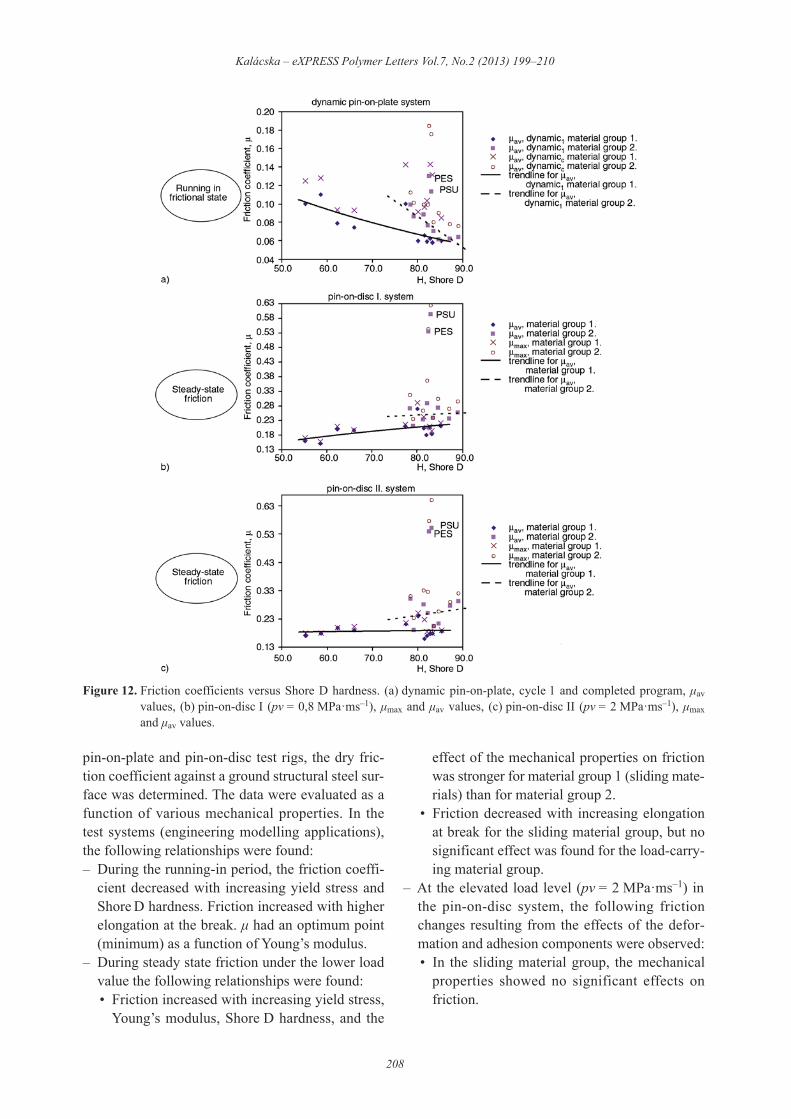
4.5. Friction coefficients plotted againstShore D hardness
Figure 12 shows the relationship between theShore D hardness and friction. The dynamic testsshow that during the early stage of friction, the
increased hardness is advantageous and results inlower friction in both material groups because oflower deformation and smaller actual contact area,resulting in lower mechanical and adhesive forces.Nearing the transition zone (Figure 1) during thecomplete dynamic test, the forming polymer layerand its adhesive effect change the dynamic, and thescatter in the data (Figure 12a) is too large to indi-cate a trend.The steady-state friction measurements revealedthat the role of the surface hardness changes. Atlower loads (Figure 12b), the hardness has no signif-icant effect on the observed friction in materialgroup 2, but a slight increase of friction with hard-ness in material group 1 reflects the different adhe-
Kalácska – eXPRESS Polymer Letters Vol.7, No.2 (2013) 199–210
206
Figure 10. Friction coefficients versus elongation at break, A [%]. (a) dynamic pin-on-plate, cycle 1 and completed pro-gram, µav values, (b) pin-on-disc I (pv = 0,8 MPa"ms–1), µmax and µav values, (c) pin-on-disc II (pv = 2 MPa"ms–1),µmax and µav values.
sion and surface energy of the plastics. Increasingthe load (pin-on-disc II) modifies the effect (Fig-ure 12c) of the hardness on the friction. In the caseof material group 1, the plastics having a Shore Dhardness of 80 or higher exhibited lower friction;those materials in the pin-on-disc I system workedin the zone to the left of the optimum point of fric-tion (according to the friction theory in Figure 3),but at higher loads, they worked in the zone closerto the optimum point. This was not the case formaterial group 2. Those plastics worked around theoptimum point or in the zone to the right of the opti-mum point (in Figure 3) in the pin-on-disc I system,
and at higher loads, they moved away from the opti-mum point to higher values.
5. ConclusionsTwenty-one different engineering polymers sepa-rated into three groups (semi-crystalline materialsof sliding machine elements, semi-crystalline mate-rials of load-carrying machine elements, and amor-phous engineering plastics) were tested during boththe running-in period and steady-state friction, anddynamic effects and different load levels (pv = 0.8and 2 MPa"ms–1 at steady state friction) were appliedaccording to plastic engineering practices. Using
Kalácska – eXPRESS Polymer Letters Vol.7, No.2 (2013) 199–210
207
Figure 11. Friction coefficients versus Young’s modulus, E [MPa]. (a) dynamic pin-on-plate, cycle 1 and completed pro-gram, µav values, (b) pin-on-disc I (pv = 0,8 MPa"ms–1), µmax and µav values, (c) pin-on-disc II (pv = 2 MPa"ms–1),µmax and µav values.
pin-on-plate and pin-on-disc test rigs, the dry fric-tion coefficient against a ground structural steel sur-face was determined. The data were evaluated as afunction of various mechanical properties. In thetest systems (engineering modelling applications),the following relationships were found:–$During the running-in period, the friction coeffi-
cient decreased with increasing yield stress andShore D hardness. Friction increased with higherelongation at the break. µ had an optimum point(minimum) as a function of Young’s modulus.
–$During steady state friction under the lower loadvalue the following relationships were found:• Friction increased with increasing yield stress,
Young’s modulus, Shore D hardness, and the
effect of the mechanical properties on frictionwas stronger for material group 1 (sliding mate-rials) than for material group 2.
• Friction decreased with increasing elongationat break for the sliding material group, but nosignificant effect was found for the load-carry-ing material group.
–$At the elevated load level (pv = 2 MPa"ms–1) inthe pin-on-disc system, the following frictionchanges resulting from the effects of the defor-mation and adhesion components were observed:• In the sliding material group, the mechanical
properties showed no significant effects onfriction.
Kalácska – eXPRESS Polymer Letters Vol.7, No.2 (2013) 199–210
208
Figure 12. Friction coefficients versus Shore D hardness. (a) dynamic pin-on-plate, cycle 1 and completed program, µavvalues, (b) pin-on-disc I (pv = 0,8 MPa"ms–1), µmax and µav values, (c) pin-on-disc II (pv = 2 MPa"ms–1), µmaxand µav values.
• In the load-carrying material group, the elon-gation at the break had no effect on friction,while increasing the yield stress, Young’s mod-ulus and the Shore D hardness increased fric-tion.
–$The results from the amorphous PES and PSUmaterials showed poor friction performance.These materials cannot be compared to the semi-
crystalline engineering plastics and are not rec-ommended as structural materials supporting africtional load.
AcknowledgementsMany thanks to L. Zsidai, R. Keresztes, M. Andó for theirlaboratory assistance and to Quattroplast Ltd. for supportingthis research work.
Kalácska – eXPRESS Polymer Letters Vol.7, No.2 (2013) 199–210
209
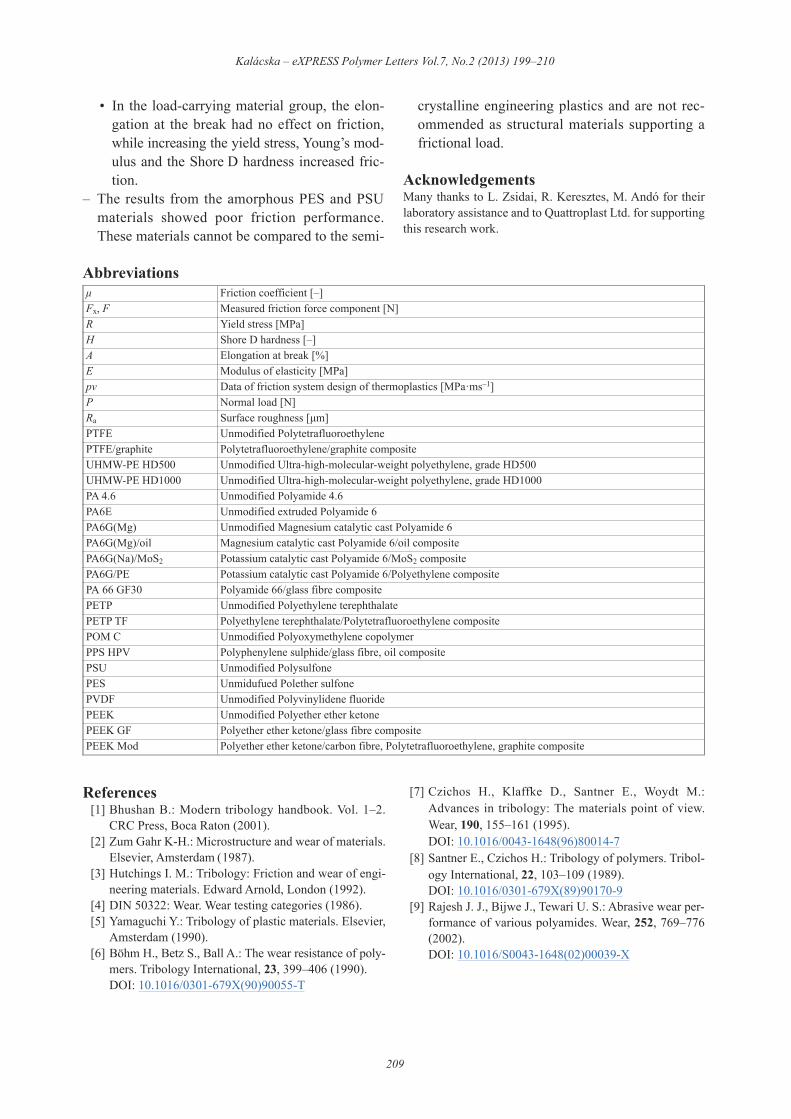
Abbreviationsµ Friction coefficient [–]Fx, F Measured friction force component [N]R Yield stress [MPa]H Shore D hardness [–]A Elongation at break [%]E Modulus of elasticity [MPa]pv Data of friction system design of thermoplastics [MPa"ms–1]P Normal load [N]Ra Surface roughness [µm]PTFE Unmodified PolytetrafluoroethylenePTFE/graphite Polytetrafluoroethylene/graphite compositeUHMW-PE HD500 Unmodified Ultra-high-molecular-weight polyethylene, grade HD500UHMW-PE HD1000 Unmodified Ultra-high-molecular-weight polyethylene, grade HD1000PA 4.6 Unmodified Polyamide 4.6PA6E Unmodified extruded Polyamide 6PA6G(Mg) Unmodified Magnesium catalytic cast Polyamide 6PA6G(Mg)/oil Magnesium catalytic cast Polyamide 6/oil compositePA6G(Na)/MoS2 Potassium catalytic cast Polyamide 6/MoS2 compositePA6G/PE Potassium catalytic cast Polyamide 6/Polyethylene compositePA 66 GF30 Polyamide 66/glass fibre compositePETP Unmodified Polyethylene terephthalatePETP TF Polyethylene terephthalate/Polytetrafluoroethylene compositePOM C Unmodified Polyoxymethylene copolymerPPS HPV Polyphenylene sulphide/glass fibre, oil compositePSU Unmodified PolysulfonePES Unmidufued Polether sulfonePVDF Unmodified Polyvinylidene fluoridePEEK Unmodified Polyether ether ketonePEEK GF Polyether ether ketone/glass fibre compositePEEK Mod Polyether ether ketone/carbon fibre, Polytetrafluoroethylene, graphite composite
References [1] Bhushan B.: Modern tribology handbook. Vol. 1–2.
CRC Press, Boca Raton (2001). [2] Zum Gahr K-H.: Microstructure and wear of materials.
Elsevier, Amsterdam (1987). [3] Hutchings I. M.: Tribology: Friction and wear of engi-
neering materials. Edward Arnold, London (1992). [4] DIN 50322: Wear. Wear testing categories (1986). [5] Yamaguchi Y.: Tribology of plastic materials. Elsevier,
Amsterdam (1990). [6] Böhm H., Betz S., Ball A.: The wear resistance of poly-
mers. Tribology International, 23, 399–406 (1990).DOI: 10.1016/0301-679X(90)90055-T
[7] Czichos H., Klaffke D., Santner E., Woydt M.:Advances in tribology: The materials point of view.Wear, 190, 155–161 (1995).DOI: 10.1016/0043-1648(96)80014-7
[8] Santner E., Czichos H.: Tribology of polymers. Tribol-ogy International, 22, 103–109 (1989).DOI: 10.1016/0301-679X(89)90170-9
[9] Rajesh J. J., Bijwe J., Tewari U. S.: Abrasive wear per-formance of various polyamides. Wear, 252, 769–776(2002).DOI: 10.1016/S0043-1648(02)00039-X
[10] Tewari U. S., Bijwe J., Mathur J. N., Sharma I.: Stud-ies on abrasive wear of carbon fibre (short) reinforcedpolyamide composites. Tribology International, 25, 53–60 (1992).DOI: 10.1016/0301-679X(92)90121-3
[11] Keresztes R., Kalácska G., Zsidai L., Eberst O.: Abra-sive wear of polymer-based agricultural machine ele-ments in different soil types. Cereal Research Commu-nications, 36, 903–907 (2008).
[12] Arribas A., Bermúdez M-D., Brostow W., Carrión-Vilches F. J., Olea-Mejía O.: Scratch resistance of apolycarbonate + organoclay nanohybrid. ExpressPolymers Letters, 3, 621–629 (2009).DOI: 10.3144/expresspolymlett.2009.78
[13] Unal H., Findik F.: Friction and wear behaviours ofsome industrial polyamides against different polymercounterparts under dry conditions. Industrial Lubrica-tion and Tribology, 60, 195–200 (2008).DOI: 10.1108/00368790810881542
[14] Byett J. H., Allen C.: Dry sliding wear behaviour ofpolyamide 66 and polycarbonate composites. Tribol-ogy International, 25, 237–246 (1992).DOI: 10.1016/0301-679X(92)90061-Q
[15] Kato K.: Wear in relation to friction – A review. Wear,241, 151–157 (2000).DOI: 10.1016/S0043-1648(00)00382-3
[16] Khan M. S., Franke R., Gohs U., Lehmann D., Hein-rich G.: Friction and wear behaviour of electron beammodified PTFE filled EPDM compounds. Wear, 266,175–183 (2009).DOI: 10.1016/j.wear.2008.06.012
[17] Myshkin N. K., Petrokovets M. I., Kovalev A. V.: Tri-bology of polymers: Adhesion, friction, wear, and mass-transfer. Tribology International, 38, 910–921 (2005).DOI: 10.1016/j.triboint.2005.07.016
[18] Xu D., Karger-Kocsis J., Schlarb A. K.: Rolling wearof EPDM and SBR rubbers as a function of carbonblack contents: Correlation with microhardness. Jour-nal of Materials Science, 43, 4330–4339 (2008).DOI: 10.1007/s10853-008-2637-7
[19] Khan M. S., Lehmann D., Heinrich G., Gohs U.,Franke R.: Structure-property effects on mechanical,friction and wear properties of electron modifiedPTFE filled EPDM composite. Express Polymers Let-ters, 3, 39–48 (2009).DOI: 10.3144/expresspolymlett.2009.7
[20] Brostow W., Dutta M., de Souza J. R., Rusek P., deMedeiros A. M., Ito E. N.: Nanocomposites of poly(methyl methacrylate) (PMMA) and montmorillonite(MMT) Brazilian clay: A tribological study. ExpressPolymers Letters, 4, 570–575 (2010).DOI: 10.3144/expresspolymlett.2010.71
[21] Kalácska G., Zsidai L., Keresztes R., Tóth A., MohaiM., Szépvölgyi J.: Effect of nitrogen plasma immer-sion ion implantation of polyamide-6 on its slidingproperties against steel surface. Wear, 290–291, 66–73(2012).DOI: 10.1016/j.wear.2012.05.011
[22] Keresztes R.: Tribology research of polymer/steel gearpairs. PhD thesis (in Hungarian). Szent István Univer-sity, Gödöll! (2009).
[23] Bowden F. P., Tabor D.: Friction and lubrication ofsolids. Oxford University Press, London (1954).
[24] Samyn P., Kalacska G., Keresztes R., Zsidai L., DeBaets P.: Design of a tribotester for evaluation of poly-mer components under static and dynamic sliding con-ditions. Proceedings of the Institution of MechanicalEngineers Part J: Journal of Engineering Tribology,221, 661–674 (2007).DOI: 10.1243/13506501JET266
Kalácska – eXPRESS Polymer Letters Vol.7, No.2 (2013) 199–210
210