plastic additives initiative supplementary information on
TRANSCRIPT

Plastic additives initiative Supplementary Information on Scope and Methods 15.02.2019
This document provides supplementary information to the publication on ECHA website https://echa.europa.eu/plastic-additives-initiative
Contents
1. Background ..........................................................................................2 2. Aims and deliverables of the initiative ......................................................2
3. Plastic additives overview ......................................................................3
3.1. Establishing an overview of confirmed plastic additives ...................................................... 4 3.2. Present overview ........................................................................................................... 6 3.3. Additional substances ..................................................................................................... 6 4. Ranking method and outcome .................................................................7
4.1. Data compilation by ECHA .............................................................................................. 7 4.2. Approach for estimating the relative release potential ........................................................ 7 4.3. List of additives with release indicators ............................................................................ 8 5. Working with the additives’ list ...............................................................8 5.1. Preconditions................................................................................................................. 8 5.2. Use by authorities in common screening........................................................................... 9 6. Learnings and recommendations ........................................................... 10
ANNEX: Details on Method for determining the relative potential for release

2
1. Background
ECHA’s Integrated Regulatory Strategy1 brings all REACH and CLP processes together to achieve the aims of these Regulations and contributes to meeting the 2020 goals of the World Summit on Sustainable Development. The strategy aims to achieve the following objectives:
• Select efficiently substances that raise potential concern, generating the necessary information for assessing their safety through a compliance check or other means so that any remaining concerns can subsequently be addressed through the most suit-able regulatory risk management instrument;
• Ensure appropriate and timely intervention of ECHA, Member States, industry and the European Commission within the different REACH and CLP processes so that chemicals of concern are addressed as soon as possible through (regulatory) risk management measures;
• Provide confidence amongst stakeholders and the public that registrants meet REACH information requirements, and follow up by improved communication on safe use in the supply chain.
ECHA’s ambition is to map by 2020 all substances that have been registered under REACH at 100 t/a or more through a number of actions. These actions are intended to reduce the pool of substances of potential concern and conclude for as many substances as possible the need for specific action or that they are currently of low priority for further work. The work is carried out in collaboration with the relevant industry sectors.
2. Aims and deliverables of the initiative
The release of hazardous substances from plastic materials is an area of high public inter-est, and an EU Strategy for Plastics in the Circular Economy was adopted in January 2018. During the first two registration deadlines under REACH, several hundred substances po-tentially used as additives in plastics have been registered in volumes of 100 tonnes/year or more. For many of these substances, there are significant uncertainties on hazard char-acteristic and on releases from plastic matrices. In late 2016, ECHA and a number of industry sector organisations (see Table 1 for the list of contributors) started a joint initiative for characterising the uses of various plastic ad-ditives and the corresponding potential for release from articles. The project was coordi-nated by Cefic, PlasticsEurope, EuPC and ECHA. The main aims of the plastic additives initiative were to: • Develop a methodology for comparing the potential for release of additives during
plastic articles service life; • Contribute to setting priorities among those registered substances for which we have
highest uncertainties on hazardous properties and potential for release and (de)pri-oritising based on release potential;
• Provide learnings on information that is relevant for authorities, for registrants to efficiently update their registration dossiers and chemical safety assessments therein;
• Support communication in supply chains on uses and conditions of safe use; • Support informed substitution; and • Improve predictability of regulatory actions and promote a level playing field amongst
manufacturers, importers and users of substances by applying consistent approaches within a sector, across substances and uses.
1 Integrated Regulatory Strategy, https://echa.europa.eu/echa-irs

3
The initiative produced the following deliverables: 1. An overview of substances confirmed by industry to be used as additives in plastic
together with, for each of these substances, information on their properties rele-vant for determining release potential, additive function and usual concentration, as well as the polymers and article types in which they are usually used in.
2. A method for comparing/ranking the release potential of additives from plastic ma-trices, including exemplification.
3. Calculated release indicator values for those substances in the overview which have not been under regulatory scrutiny so far (list available to Member States authori-ties and industry project partners only).
4. Learnings and corresponding recommendations from the project. Table 1. List of industry group contributors to the initiative. Amines Amines Sector group, Cefic
APAG European Oleochemicals and Allied Products Group
ASASP Association of Synthetic Amorphous Silica Producers
BSEF Bromine Science Environmental Forum
CEES Organisation representing the European Silicate Industry
Cefic European Chemical Industry Council
CEPAD European Alkylphenols and Derivatives Association
ELISANA European Light Stabilisers and Antioxidants
ESPA European Stabiliser Producers Association
ETICA European Tin Catalysts
EuPC European Plastics Converters
Euro Chlor Association of chloralkali process plant operators in Europe
Eurocolour Manufacturers of pigments, dyes and fillers in Europe
Eurometaux Non-ferrous metals producers and recyclers in Europe
European Plasticisers
FCA Food Contact Additives, Cefic
HARRPA Hydrocarbon and Rosin Resins Producers Association
ICBA International Carbon Black Association
PINFA Phosphorus, Inorganic and Nitrogen Flame Retardants Association
PlasticsEurope Plastics manufacturers
TDMA Titanium Dioxide Manufacturers Association
3. Plastic additives overview
Plastic additives can be roughly divided into four groups: 1) functional additives (e.g. sta-bilisers, flame retardants and plasticisers), 2) colourants, 3) fillers and 4) reinforcements. This initiative addressed two of the four groups, functional additives and colourants (pig-ments). In the Food Contact Material regulation (10/2011 EU), a plastic additive is defined as follows:
“additive” means a substance which is intentionally added to plastics to achieve a physical or chemical effect during processing of the plastic or in the final material or article; it is intended to be present in the final material or article.

4
This can include additives that are meant to chemically react to deliver their function (e.g. light stabilisers), and where the reaction products may be of concern. Substances contrib-uting to the formation of the polymer matrix (e.g. cross-linkers) are not part of the pro-ject 2. Also impurities, non-intentionally added substances, or contaminations (incl. from recycling) are not covered. Substances that are no longer used in the EU but which may be present in imported articles are also outside the scope of the overview.
Establishing the plastic additives overview consisted of two parts: establishing a list of confirmed plastic additives and collecting use information on the confirmed substances.
3.1. Establishing an overview of confirmed plastic additives
ECHA compiled an initial list of additives based on information retrieved from REACH reg-istrations in REACH-IT as of 15 November 2016. Additionally, substances in the ECPI plas-ticiser list 3 which ECHA had received previously, were included. We searched for the fol-lowing functions4 of substances that had been registered at 100 t/a or above:
• additives by converters • additives in polymer production • antioxidant* • antistatic agents* • blowing agents* • coupling agents* • curing agents* • fillers* • flame retardants*
• heat stabilisers* • nucleating agent* • pigment* • plastic additive • plasticisers* • stabilisers* • UV (light) stabilisers* • viscosity modifier*
Dyes, slip promoters, polymeric impact modifiers were not covered in the search, although they fall within the additive definition above.
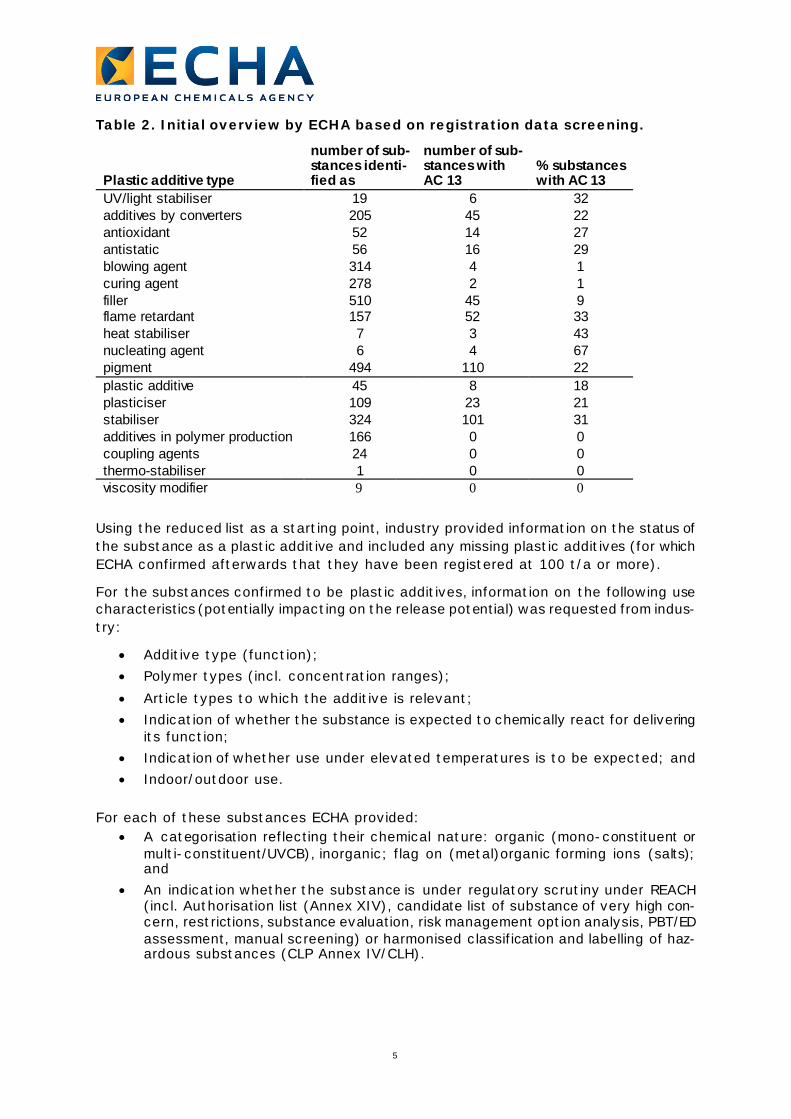
A total of 1550 potential plastic additives were initially identified, a substantial number of substances with more than one substance function (Table 2). The table shows the propor-tion of substances per additive type for which a service life in article category for plastic articles (AC 13) had been reported in IUCLID. This list was refined by removing those additive types for which the association with AC 13 was less than 10% (i.e. use in plastic material plays a minor role), such as fillers and blowing agents, and substances which had been identified based on non-public or confidential data. The reduced list was given to the industry sector associations as a starting point for further work.
2 Even though an additive may not be present in the final article anymore, due to its intended reaction in one of the processing steps before, a Chemicals Safety Assessment under REACH needs to cover also the reaction products of the substance (which may be present in the article) to be assessed. 3 https://www.plasticisers.org/plasticisers/ 4 Those marked with * correspond to the list of additive types contained in the Pestool (Plastic Industries Sup-ply Chain Exposure Scenario Tool). The other more generic terms are frequently used in the registrants’ use descriptions.
5
Table 2. Initial overview by ECHA based on registration data screening.
Plastic additive type
number of sub-stances identi-fied as
number of sub-stances with AC 13
% substances with AC 13
UV/light stabiliser 19 6 32 additives by converters 205 45 22 antioxidant 52 14 27 antistatic 56 16 29 blowing agent 314 4 1 curing agent 278 2 1 filler 510 45 9 flame retardant 157 52 33 heat stabiliser 7 3 43 nucleating agent 6 4 67 pigment 494 110 22 plastic additive 45 8 18 plasticiser 109 23 21 stabiliser 324 101 31 additives in polymer production 166 0 0 coupling agents 24 0 0 thermo-stabiliser 1 0 0 viscosity modifier 9 0 0
Using the reduced list as a starting point, industry provided information on the status of the substance as a plastic additive and included any missing plastic additives (for which ECHA confirmed afterwards that they have been registered at 100 t/a or more).
For the substances confirmed to be plastic additives, information on the following use characteristics (potentially impacting on the release potential) was requested from indus-try:
• Additive type (function); • Polymer types (incl. concentration ranges); • Article types to which the additive is relevant; • Indication of whether the substance is expected to chemically react for delivering
its function; • Indication of whether use under elevated temperatures is to be expected; and • Indoor/outdoor use.
For each of these substances ECHA provided:
• A categorisation reflecting their chemical nature: organic (mono-constituent or multi-constituent/UVCB), inorganic; flag on (metal)organic forming ions (salts); and
• An indication whether the substance is under regulatory scrutiny under REACH (incl. Authorisation list (Annex XIV), candidate list of substance of very high con-cern, restrictions, substance evaluation, risk management option analysis, PBT/ED assessment, manual screening) or harmonised classification and labelling of haz-ardous substances (CLP Annex IV/CLH).

6
3.2. Present overview
The present plastic additives overview contains 418 substances which have been con-firmed by industry or registrants to be plastic additives. In total, 58% of the substances were not under regulatory scrutiny under REACH or CLP (Table 3). 11% of the substances remained without any information on their function. 6% of the substances had functions that were outside the scope of the project (for example lubricants, viscosity modifiers and mould release agents).
Table 3. Overview of the number of substances per function group and the pro-portion of substances under regulatory scrutiny
Function No of additives (one function per additive)
Under regulatory scrutiny (%)
Antioxidants 26 65 Antistatics 16 43 Flame retardants 40 67 Nucleating Agents 5 20 Plasticisers 66 54 Pigments 127 30 Heat stabilisers 27 66 UV Stabilisers 16 62 Other stabilisers 23 45 Other functions 72 12 Total number of substances 418 41
The overview contains information on confirmed polymer matrices for 65% of the sub-stances, and information on concentration ranges for 58% of the substances. Information on increased temperature and indoor/outdoor use was so scarce that it was not included in the final overview. The potential presence of reaction products of the additive in the article was reported for antioxidants, light stabilisers and nucleating agents. However, information referring to reaction products was provided for less than 40% of substances, consequently the information was not systematically included into the present overview.
Information on article categories was provided by some industry groups, but as in most cases the information did not provide enough distinction among the article categories, this information was not included in the final overview.
3.3. Additional substances
In parallel to the overview established in collaboration with industry, ECHA compiled a list of 200 substances registered at 100 t/a or more for which a use as a plastic additive is plausible but could not be confirmed by Industry. The list contains substances for which in the registration dossiers at least one registrant had a reported use with article category AC 13 (plastic articles). These substances originated from three sources:
• Substances that were contained in the initial overview but were set to an uncertain status by industry;
• Substances which had not been selected to ECHA’s initial overview as the only

7
indication of a potential plastic additive function was an AC13 assignment in the registration data; or
• Substances that had been set aside because their initial identification from ECHA’s database made (partly) use of on non-public data.
From this group of substances, ECHA removed obvious false positives and included, where possible, a tentative substance function, based on internet searches. These substances were not included in the data collection exercise with industry sectors, in order to focus resources on confirmed additives and in order to enable publication of the overview. The 200 additional additives will be made available to Member State authorities, and can be considered in the authorities’ common screening5 (see section 5.2).
4. Ranking method and outcome
4.1. Data compilation by ECHA
The release potential of the additives from the plastic material is correlated with the prop-erties of the polymer matrix, the concentration of the additive and a number of its chem-ical-physical properties. Therefore, ECHA compiled the following data for each substance: • Chemical structure based on structure and substance name information published
on ECHA’s dissemination website (Brief Profile). • Molecular weight calculated from the chemical structure6. • Chemical-physical properties for neutral organic substances based on the OECD
QSAR Toolbox. This provides experimental and predicted values from EPISUITE. In some cases, where the value from the OECD toolbox was not plausible, it was replaced by a value from the registration dossier.
• Chemical-physical properties for inorganic substances and salts based on: data available via public dossiers published on ECHA’s dissemination website.
4.2. Approach for estimating the relative release potential
The starting point of the method are existing models (no measurements) for estimating release from plastic articles to food, skin, indoor air, saliva and water. In order to compare the relative release potential of the plastic additives within the scope of this work, the method needs to be based on input data that are likely to be available for the majority of the substances. The area of food contact materials (FCM) is historically the most advanced in modelling release estimation. Fit for purpose measurements and tools have been de-veloped to simulate releases from plastics to food (aqueous, fatty and dry) and drinking water. The current knowledge on how additives are released from plastics to food is sum-marised in the JRC Technical Report 20157.
Release potential is a result of diffusion-speed through the plastic matrix and partitioning from plastic surface to the contact medium. These two basic mechanisms are driven by the following parameters:
• Molecular volume (weight being used as a proxy) and other intrinsic properties of the additive;
• Diffusivity of the polymer matrix (depending also on particular interaction between
5 Common screening, https://echa.europa.eu/screening 6 Note: for UVCBs which make about half of the neutral organics on the list, in some cases more than one representative structure needs to be determined, in order to correctly address the chemical-physical properties of the substance in the ranking. 7 Practical guidelines on the application of migration modelling for the estimation of specific migration – JRC Technical Report In support of Regulation (EU) No 10/2011 on plastic food contact materials (2015)

8
additive and polymer-type); • Relative affinity of the additive to the polymer-matrix compared to the contact me-
dium (e.g. tendency to become airborne driven by vapour pressure; kow); and • Temperature.
The amount of substance released from an article surface in contact is further driven by:
• Concentration of the additive in the plastic matrix; • Dimension of the article and velocity of the contact medium (may be relevant for
dynamic contact like flowing water or flowing air over a plastic surface). Note: It is assumed that this second driver has a relatively low impact on the relative release estimate at this level of screening. It may become more important in case exposure assessment for the actual uses is then made.
• The structure of the article itself (thickness, geometry, number of layers, barrier effect). Note: Like for the release driver above, the structure of the article can potentially be considered for in-depth assessments, but not for the screening method developed under the current initiative.
For comparing the release potential at a screening level, no differentiation is needed be-tween water, saliva and skin, as the predictive models are all driven by the same input parameters (see Annex Chapter 3). For estimating the release potential to air, a specific model is needed as the release mechanism is different if compared to water/saliva/skin. For example, the partitioning between the plastic surface and air can be estimated with the substance-specific partition coefficient octanol-air.
The quantitative method used is applicable to neutral organics (with some limitation re-garding pigments with very low solubility in water and octanol), but not to inorganics or charged migrants. For such substance types, the release potential has been determined based on qualitative considerations (pigments and antistatic agents) or has not been de-termined at all.
For the relative release potential related to the environment via water, the tonnage of the additive used in water contact articles would be a key information, which is, however, not available in the registration database. Additionally, industry sector organisation state that such information is also not available to them. Therefore, tonnage has not been considered in the comparison of the relative release potential.
More details regarding the methodology used to determine the relative release potential of additives from the polymer matrix can be found in the Annex.
4.3. List of additives with release indicators
The ranking methods (either quantitative or qualitative) have been applied to 155 organic plastic additives. The additive lists with assigned release indicators are available to Mem-ber state competent authorities and industry project partners. An example is contained in Chapter 5 of the Annex to this report. 5. Working with the additives’ list
5.1. Preconditions
For interpretation and further utilisation of the overview on additives and ranking tables, it is important to acknowledge the following preconditions:
The work does not cover all functional plastic additives being present on the European market. In addition, the lists cover only substances which have been registered under REACH above 100 t/a. The overview is based on non-confidential data and information

9
provided by industry. No additional substance searches were carried out as part of the project. Therefore, the overview should not be considered complete and final.
The comparison of the release potential among the additives is meant to support screening, i.e. being able to prioritise further work on certain substances compared to others.
The relative release potential ranking is based on substance properties and information on uses. Where information was missing, assumptions have been made. Also, in order to generate a data set based on a consistent methodology across all substances, the chemi-cal-physical data for the additives have been derived from QSARs where possible. There-fore, the relative release potential of an additive is an indicative value and does not reflect the outcome of an in-depth assessment.
The relative release potential ranking is not a risk-based priority list. The value indicating the relative release potential must not be confused with an exposure estimate as one would need for a risk assessment. Several simplifications on substances/matrix interac-tions had to be made. E.g. the structure of articles (thickness, geometry, number of layers) or use patterns were not considered. Also, the relative ranking does not include any hazard considerations. Even a high ranked additive may not pose a risk at all, if such additive does not cause adverse effects in human body or the environment. Therefore, the rela-tive rank of a substance alone does not support any conclusion on whether or not the use of a particular additive would be of concern regarding human health or environment.
5.2. Use by authorities in common screening
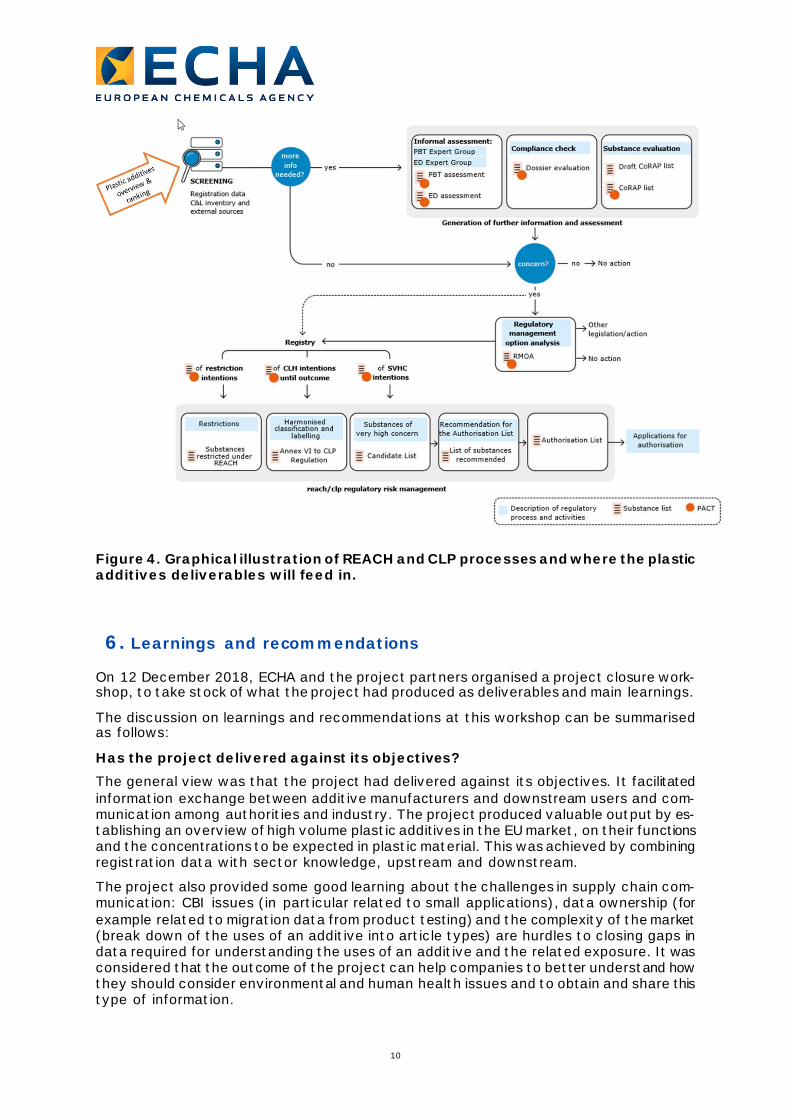
The screening of registered substances by ECHA and Member States for the initiation of any of the REACH processes following registration aims to distinguish between substances that matter (having the greatest potential for adverse impacts on human health and the environment) from those, which are not a priority. The hazard indication for a substance comes from the common screening scenarios and algorithms developed together with grouping of structurally similar substances8. The functional substance groups identified in this project and the outcome of the relative release potential ranking will be considered by authorities as one element in the risk based prioritisation of groups of substances in the upcoming common screening (Fig. 4).
8 Screening definition document, https://echa.europa.eu/documents/10162/19126370/screening_defini-tion_document_en.pdf/e588a9f8-c55e-4412-a760-49ddbf7ac687
10
Figure 4. Graphical illustration of REACH and CLP processes and where the plastic additives deliverables will feed in.
6. Learnings and recommendations
On 12 December 2018, ECHA and the project partners organised a project closure work-shop, to take stock of what the project had produced as deliverables and main learnings.
The discussion on learnings and recommendations at this workshop can be summarised as follows:
Has the project delivered against its objectives? The general view was that the project had delivered against its objectives. It facilitated information exchange between additive manufacturers and downstream users and com-munication among authorities and industry. The project produced valuable output by es-tablishing an overview of high volume plastic additives in the EU market, on their functions and the concentrations to be expected in plastic material. This was achieved by combining registration data with sector knowledge, upstream and downstream.
The project also provided some good learning about the challenges in supply chain com-munication: CBI issues (in particular related to small applications), data ownership (for example related to migration data from product testing) and the complexity of the market (break down of the uses of an additive into article types) are hurdles to closing gaps in data required for understanding the uses of an additive and the related exposure. It was considered that the outcome of the project can help companies to better understand how they should consider environmental and human health issues and to obtain and share this type of information.
11
The project provided an approach/tool for determining where information and assessment would need to be improved from the use and exposure perspective. It was highlighted that the relative ranking values are indicative for the potential need for a more in-depth as-sessment, rather than being the outcome of a risk assessment or a demonstration of safe use. The methodology has its limitations, as it only addresses the release potential from materials rather than route-specific exposure from the use of representative articles. Ad-ditionally, there is a lack of information on the identity and concentration of additives in imported plastics.
How was the collaboration? The collaboration among the different actors was considered good, in particular also be-tween industry and ECHA. There was an open-network collaboration with positive engage-ment. Regular workshops among the industry contributors were considered important for ensuring a common understanding of the scope of the work, and there was appreciation on the possibility of participating in refining the methodology and overview of substances. However, there was reluctance from some companies to participate due to the fear of blacklisting. Communication from associations to the companies was also considered chal-lenging (e.g. on the scope of the project) as there can be several hundred members.
What learning/ideas do you take from this project to your future work? This initiative has made some registrants consider how to improve knowledge on the use of substances and to cover relevant information on use and exposure in their REACH reg-istrations. The work should encourage companies to gather people with relevant knowledge and sharing this knowledge in a constructive way. The project also demon-strated the importance of making companies in the supply chain aware that data gaps in use and exposure data seem to be more common than expected. These gaps can have an impact on how substances are prioritised by authorities (authorities use worse case as-sumptions if no better information is available). Quite a few industry participants ex-pressed their readiness to update the registration dossiers, including the Chemicals Safety Report (CSR). Industry asked ECHA for brief guidance/orientation on what to focus on, e.g. a decision tree with few explanations around it.
Possible follow-up
Based on the needs expressed by the workshop participants, the following follow-up ac-tivities were proposed:
• ECHA to consider developing a brief guidance (“two-pager”) on how to approach the safety assessment for the article service-life stage for additives in plastics, with feed-back from industry and Member States.
• EuPC to explore whether (and how) extending the existing sector use map with infor-mation on service life, in order to support dossier updates by registrants.
• Cefic to explore whether and how industries’ current modelling tool to estimate dermal and oral exposure from plastic articles (to demonstrate safe use under REACH) could be improved. Experience and models from food contact materials could help in this.
• ECHA to analyse the impact of the additives overview and quantification of release potential on the outcome of the common screening process under REACH.
• Project coordination group to organise a follow-up workshop in 1 or 1.5 years to take stock on the changes the project may have induced, including the results of the impact analysis on common screening and changes in the quality of registration dossiers.
1
ANNEX Details on Method for Determining the Relative Potential for Release 15.02.2019
Contents
Introduction .............................................................................................2 1. Parameters to predict the release potential ..............................................2
1.1. Diffusion ....................................................................................................................... 2 1.2. Partition........................................................................................................................ 3 1.2.1. Partition to skin .......................................................................................................... 4 1.2.2. Partition to water / saliva ............................................................................................. 4 1.2.3. Partition to air ............................................................................................................ 5 1.2.4. Transport velocity ....................................................................................................... 5 1.2.5. Concentration ............................................................................................................. 5 2. Models used for estimating the potential for release ..................................6
2.1. Release potential to aqueous (polar) contact..................................................................... 6 2.2. Release potential to indoor air ......................................................................................... 7 2.3. Applicability domains for the models and uncertainties....................................................... 7 3. Sensitivity analysis ................................................................................8 3.1. Dermal route ................................................................................................................. 9 3.2. Release potential for polar low diffusivity matrices............................................................10 3.3. Comparing dermal route to oral and water.......................................................................11 3.3.1. Oral route (saliva) ......................................................................................................11 3.3.2. Environment (water) ..................................................................................................13 3.4. Comparing dermal route to the inhalation route ...............................................................14 4. Calculating the indicator for relative release potential .............................. 17
4.1. Neutral organics ...........................................................................................................17 4.1.1. Matrix and concentration ............................................................................................17 4.1.2. Physical chemical data ................................................................................................18 4.1.3. Diffusion and partition coefficient .................................................................................18 4.2. Other additives .............................................................................................................18 5. Example for comparing the release potential........................................... 19
2
Introduction
This annex provides details on the methodology applied for determining the relative po-tential for release of additives from the polymer matrix (chapters 1-3), the outcome of the sensitivity analysis (chapter 4), and an example how the comparison of the release potential looks like.
1. Parameters to predict the release potential
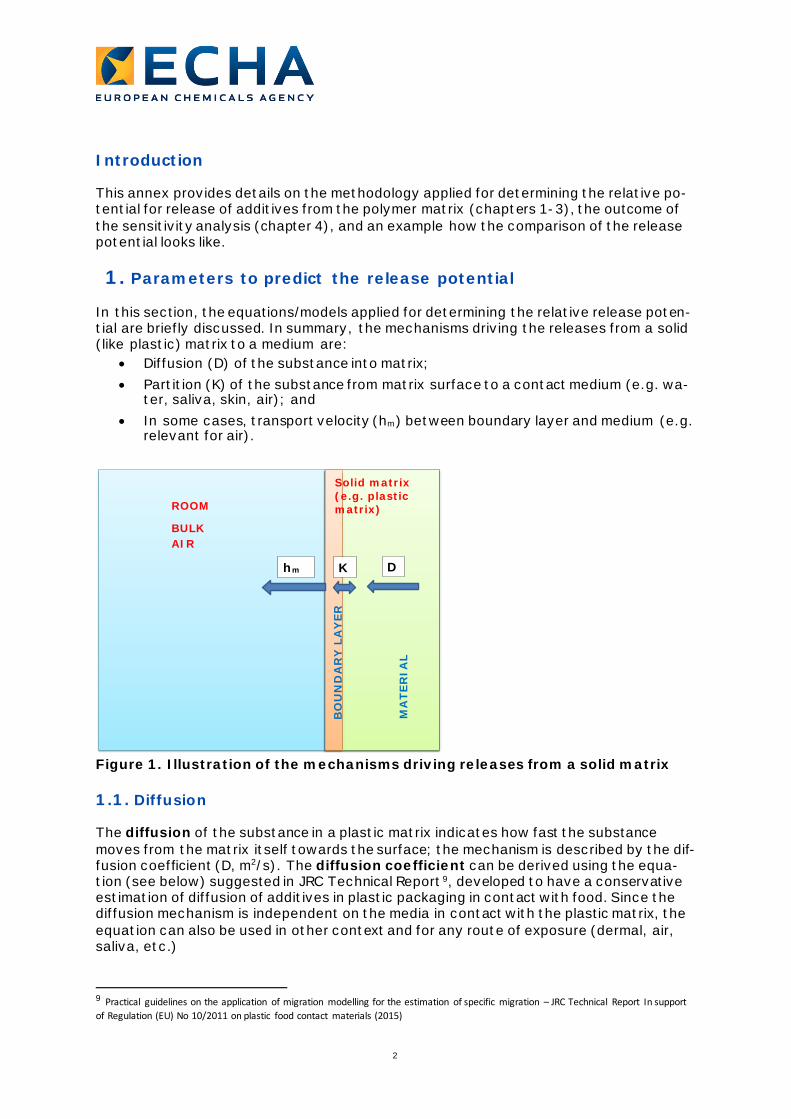
In this section, the equations/models applied for determining the relative release poten-tial are briefly discussed. In summary, the mechanisms driving the releases from a solid (like plastic) matrix to a medium are:
• Diffusion (D) of the substance into matrix; • Partition (K) of the substance from matrix surface to a contact medium (e.g. wa-
ter, saliva, skin, air); and • In some cases, transport velocity (hm) between boundary layer and medium (e.g.
relevant for air).
Figure 1. Illustration of the mechanisms driving releases from a solid matrix
1.1. Diffusion
The diffusion of the substance in a plastic matrix indicates how fast the substance moves from the matrix itself towards the surface; the mechanism is described by the dif-fusion coefficient (D, m2/s). The diffusion coefficient can be derived using the equa-tion (see below) suggested in JRC Technical Report 9, developed to have a conservative estimation of diffusion of additives in plastic packaging in contact with food. Since the diffusion mechanism is independent on the media in contact with the plastic matrix, the equation can also be used in other context and for any route of exposure (dermal, air, saliva, etc.)
9 Practical guidelines on the application of migration modelling for the estimation of specific migration – JRC Technical Report In support of Regulation (EU) No 10/2011 on plastic food contact materials (2015)
ROOM
BULK AIR
Solid matrix (e.g. plastic matrix)
MA
TER
IAL
BO
UN
DA
RY
LA
YER
D K hm
3
Dp* = exp[Ap*- 0.1351 x MW2/3 + 0.003 x MW – Rx10454/(RxT)] Where: Dp* = upper-bound diffusion coefficient (m2/s) Ap* = this parameter is linked to the polymer and describes the basic diffusion behavior of the polymer matrix in relation to the migrants (* stands as the upper bound for this value) MW = Molecular weight of the additive (g/mol) T = temperature (K) R = the gas constant (8.3145 J mol−1 K−1) Therefore, the diffusion depends on the molecular weight (small molecules move easier in the polymer matrix than large molecules), temperature T (which enhance diffusion) and a coefficient Ap* which depends on the polymer type. Typical values (or equations) are provided in the JRC Technical Report1 for different types of plastic matrices (LDPE, HDPE, PP, rigid PVC, PET, etc.). For some polymer types also moisture may play a role. Note: There are specific equations covering diffusion of plasticisers in soft PVCs, as the plasticiser and the PVC matrix form a new system that cannot be described by the diffu-sivity of PVC. For the diffusion of other additives in soft PVC, no particular equations are available, however it can be assumed that the diffusivity of soft PVC is high, like for LDPE. Note: For specific polymers such as acrylonitrile butadiene styrene (ABS), polycar-bonates (PC), poly(methyl methacrylate) (PMMA) and polyurethanes (PUR), measure-ments or estimation methods for diffusion and migration are far more scarce. Therefore, there are no specific polymer parameters (Ap*) proposed in JRC document for these ma-trices. However, suggestions on how to roughly estimate diffusion for such polymers are available in literature and are considered suitable for screening purposes. In a recent publication10, a correlation between Ap* and polymer glass transition temperature (Tg) is calculated. High Tg (>50 C) are correlated to low diffusivity materials (PA, PET, PS), while low Tg (< -40 C) are correlated to high diffusivity polymers (HDPE, LDPE). Since ABS, PMMA and PC have Tg > 100 C, they can be associated to low diffusivity polymer such as PA; the opposite should be done for PUR, for which wide range of Tg is reported (-50 to 50 C); therefore for PUR is regarded a high diffusivity material such as LDPE can serve as a proxy.
1.2. Partition
The second mechanism is the partition between the matrix surface and another layer. It is described by a partition coefficient (K, -) which represents the ratio between concen-tration in the plastic matrix at the surface and the concentration in the contact medium. It might be correlated to different substance properties depending on the layer in contact with plastics. From the perspective of a REACH chemical’s safety assessment for a sub-stance in plastic articles, the following release routes may need to be addressed: release to skin, to saliva, to air and to water. Note: the estimation of partition coefficient K is far less robust than the diffusion coeffi-cient D; however it is crucial parameter to estimate release potential from a matrix and the available equations allow for a rough estimate from the basic substance properties. 10 Probabilistic migration modelling focused on functional barrier efficiency and low migration concepts in sup-port of risk assessment, Rainer Brandsch, Food Additives & Contaminants: Part A, Volume 34, 2017 - Issue 10. Available at: https://www.tandfonline.com/doi/full/10.1080/19440049.2017.1339235

4
Note: Fraunhofer Institute and UBA11, integrated with the advice received from FABES at the Workshop on release potential held in Brussels on 25th June 2018, suggest values of 0.1 and 1000 as lower and upper values for K. This approach has also been used in the context of the present project.
1.2.1. Partition to skin
There are no general equations available to determine the partition between the plastic matrix and skin, based on substance properties. The following has been used instead: - Equations derived from a few experimental data correlating
o the partitioning of a number of organic substances between certain plastic matrices (LDPE, Polyamide) and different food simulants (10% of ethanol, 50% of ethanol, etc.).
o to the log kow of these substance12. - An experimental study indicating that for PAHs the migration from rubber and other
elastomeric article surfaces to skin is in good agreement with migrations between ar-ticles and 20% of ethanol food simulant. This finding can be applied to plastic sur-faces as well13.
Using the above mentioned reference, the partition coefficient from plastic to skin can be conservatively estimated using to 50% of ethanol food simulant equation proposed by Fraunhofer Institute. Log K = 0.39 x Log kow – 0.96 (R=0.8), where R represents the correlation coefficient between the log kow and the measured partition coefficient. The lower and upper value of the range for K proposed by Fraunhofer institute and UBA, modified as advised at the expert Workshop held in Brussels on 25th June 2018, also ap-ply to the calculated K (0.1<K<1000). Note: For soft-PVC and HDPE we assume a partitioning behaviour similar to that of LDPE, and thus have applied the correlation for LDPE from the Fraunhofer study12. To polymers like PC, PMMA or ABS the correlation for Polyamind-6 was applied.
1.2.2. Partition to water / saliva
Also for water/saliva, no general equations are available to determine the partition from the plastic matrix, based on substance properties (e.g. solubility). Using as reference the above mentioned literature, the partition coefficient from plastic to water can be conser-vatively estimated using to 10% of ethanol food simulant equation proposed by Fraunho-fer Institute. Log K = 1.07xLog kow – 1.70 (R=0.98, where R represents the correlation coefficient) The lower and upper value of the range of (0.1<K<1000) also apply to the calculated K.
11 Guideline for a mathematical estimate of the migration of the individual substances from organic material in drinking water, Federal Environment Agency (UBA), 2008 12 Correlation of partition coefficients KPolymer/Food and KOctanol/Water for potential migrants in food contact polymers, Asako Ozaki, Anita Gruner, Angela Störmer, Rainer Brandsch, Roland Franz, Poster presentation at the 4th in-ternational Symposium on Food Packaging, 19-21 November 2008, Prague 13 Skin permeation of polycyclic aromatic hydrocarbons: a solvent based in vitro approach to assess dermal ex-posure against benzo(a)pyrene and dibenzopyrenes, N. MBartsch, J. Heidler, B. Vieth, C. Hutzler, A. Luch, Journal of Occupational and Environmental Hygiene, 2016

5
Note: the partition to saliva is well described by the partition to water14.
1.2.3. Partition to air
In a recent publication15, a correlation between material-air partition coefficient (Kma) and octanol air partition coefficient (Koa) has been proposed for several polymer, includ-ing polyethylene and polyamide matrices. The Koa depends on Kow and Henry constant (H), and hence on the basic substance properties (Vapour Pressure VP, Solubility S and Molecular Weight MW) used in this screening exercise. There are three equations availa-ble, one for high diffusivity polymers (polyethylene, LDPE and HDPE), one for low diffu-sivity (Nylon, Polyamide, PA) and one for generic plastics 1) Kma = 0.17 x Koa for Polyethylene (R2 = 0.88) 2) Kma = 0.09 x Koa for Nylon (R2 = 0.99) 3) Kma = 0.06 x Koa for “all plastic matrices” (R2 = 0.86) Note: Following the same approach as for skin, for LDPE/HDPE or soft PVC, the equation 1) is used; for polyamide the equation 2) applies; in all other cases the equation 3) is used.
1.2.4. Transport velocity
For some routes (e.g. partition from plastics to air), also the transport velocity (dis-tance per time) of the substance from the material (boundary layer) to the contact me-dium plays a role; this is described by hm, the so called mass transfer coefficient, which is in fact expressed as a velocity in m/s. In the case of matrix in contact to air, mass transfer coefficient depends on air velocity and diffusion coefficient to air; RIVM suggests18 that values of hm are within a relatively narrow range, i.e. 0.0003-0.005 m/s. We propose to use an equation provided by CEM model17 (equation n. 52) where the mass transfer coefficient depends on molecular weight (MW). The values estimated using this equation fall into the range proposed by RIVM for all MW of plastic additives. The coefficient seems however to have little impact on the release rate to air.
1.2.5. Concentration
The above mechanism (described by the respective coefficients) are (largely) independ-ent on the substance concentration in the matrix. However, the substance concentra-tion always plays a role in the estimation of the release-rate from plastic. A proportional relationship between release rate and concentration (i.e. half concentration resulting in half release rate) is valid for all release routes. 14 Oomen et al. (2003), RIVM report n. 320102003. 15 Screening-level models to estimate partition ratios of organic chemicals between polymeric materials, air and water; Efstathios Reppas-Chrysovitsinos, Anna Sobek and Matthew MacLeod, Environ. Sci.: Processes Impacts, 2016, 18, 667. Available at: https://pubs.rsc.org/en/content/articlepdf/2016/em/c5em00664c
6
2. Models used for estimating the potential for release
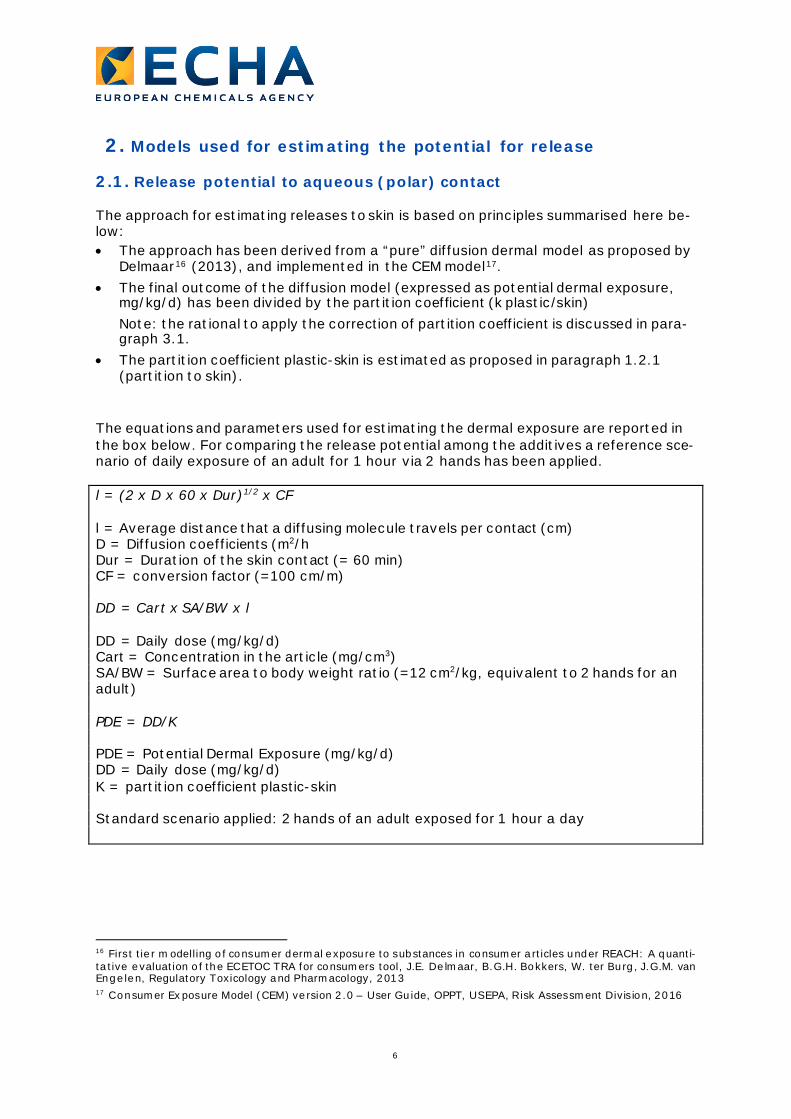
2.1. Release potential to aqueous (polar) contact
The approach for estimating releases to skin is based on principles summarised here be-low: • The approach has been derived from a “pure” diffusion dermal model as proposed by
Delmaar16 (2013), and implemented in the CEM model17. • The final outcome of the diffusion model (expressed as potential dermal exposure,
mg/kg/d) has been divided by the partition coefficient (k plastic/skin) Note: the rational to apply the correction of partition coefficient is discussed in para-graph 3.1.
• The partition coefficient plastic-skin is estimated as proposed in paragraph 1.2.1 (partition to skin).
The equations and parameters used for estimating the dermal exposure are reported in the box below. For comparing the release potential among the additives a reference sce-nario of daily exposure of an adult for 1 hour via 2 hands has been applied. l = (2 x D x 60 x Dur)1/2 x CF l = Average distance that a diffusing molecule travels per contact (cm) D = Diffusion coefficients (m2/h Dur = Duration of the skin contact (= 60 min) CF = conversion factor (=100 cm/m) DD = Cart x SA/BW x l DD = Daily dose (mg/kg/d) Cart = Concentration in the article (mg/cm3) SA/BW = Surface area to body weight ratio (=12 cm2/kg, equivalent to 2 hands for an adult) PDE = DD/K PDE = Potential Dermal Exposure (mg/kg/d) DD = Daily dose (mg/kg/d) K = partition coefficient plastic-skin Standard scenario applied: 2 hands of an adult exposed for 1 hour a day
16 First tier modelling of consumer dermal exposure to substances in consumer articles under REACH: A quanti-tative evaluation of the ECETOC TRA for consumers tool, J.E. Delmaar, B.G.H. Bokkers, W. ter Burg, J.G.M. van Engelen, Regulatory Toxicology and Pharmacology, 2013 17 Consumer Exposure Model (CEM) version 2.0 – User Guide, OPPT, USEPA, Risk Assessment Division, 2016
7
2.2. Release potential to indoor air
The Emission model18 as implemented in Consexpo web19 (2017) has been used to esti-mate the potential release and subsequent indoor air exposure. The model estimates re-leases (and exposure) from solid matrices, characterised by large surfaces like those used as building materials (e.g. plastics used for flooring or wall covering). The main input parameters needed by the model are:
• Diffusion coefficient D; • Partition (to air) coefficient Kma; • Mass transfer coefficient hm; • Concentration of substance in matrix.
The reference scenario used to calculate the indoor air exposure is summarised here be-low:
• Plastic panel of 10 m2 and 0.5 cm of thickness; • Releases in standard room of 20 m2 and 0.6 air exchange per hour; • Indoor air concentrations calculated after 30 days from the application of the sub-
stance in matrix. Two assumptions have been made for the exposure estimations:
• The emission tool as implemented by Consexpo does not accept values of Kma higher than 1015. If Kma calculated according paragraph 1.2.3 is higher than this limit, 1015 will be taken for calculation purposes.
• The Consexpo calculation was run for a subset of substances, covering all ranges of D, Kma and hm values. A proportional relation between exposure prediction and Kma was observed. Therefore, the exposure values were directly calculated from Kma, to ease the calculation steps. This approach might be slightly over conserva-tive for volatile substances (showing low Kma), as the fraction already emitted during the first days (and hence not present anymore on day 30) is ignored. This simplification however does not impact on the outcome in terms of relative poten-tial for release.
2.3. Applicability domains for the models and uncertainties
The models/equations available are in general applicable to neutral organic substances. For the UVCBs among the neutral organics, one or more representative structures have been assigned with the corresponding calculated substance property parameters. This means that for UVCBs, where the molecular weight or functional groups of the constitu-ents are spread over a wide range, also maximum and minimum release potential have been determined. The release behaviour of charged migrants is difficult to predict, as the interaction be-tween different types of polymer matrices and charged migrants is not well understood yet. In consequence, a group of organic substances need to be treated separately out-side the quantification of the relative release potential. The same applies to inorganics, for which no method is available to model the release.
18 Emission of chemical substances from solid matrices - A method for consumer exposure assessment, Report 320104011/2010, J.E. Delmaar 19 Web access via: https://login-ext.rivm.nl/nidp/idff/sso?id=85&sid=0&option=credential&sid=0&tar-get=https://esp-ext.rivm.nl/LAGBroker?%22http://consexpoweb.nl/%22
8
Major work-arounds have been made regarding the partitioning behaviour of the sub-stance between the surface of the polymer material and the contact medium. • Partitions to air are based on the equations reported in 1.2.3. For certain plastic ma-
trices there is not equation to estimate Kma; in such case, the generic equation for plastic matrices is used. It has not been established to which extent the generic equation is sufficiently representative for the polymer-surfaces to which it is applied (PC, PMMA, ABS, PUR).
• Experimental data from few studies have been used for predicting K between poly-mer surface (LDPE) and i) skin or ii) saliva/water. In these experiments skin has been simulated with a 50% solution of ethanol in water and saliva/water simulated with a 10% concentration of ethanol in water. The only validation we are aware of supporting the assumption that 50% ethanol solution simulates release to skin refers to migration of PAH from rubber material13; partition to water has been cross checked with the estimation method reported in a recent publication by Reppas-Chrysovitsinos, Sobek and MacLeod 15, largely confirming the values proposed.
Also for diffusion estimation, simplifications have been made:
• The diffusion model is only applicable to substances with a low concentration (< 2%), as at higher concentration the additive itself may start changing the diffusivity of the matrix. For plasticisers, particular diffusion coefficients in soft PVC exist (applicable to the typical concentration of plasticisers). For other plastic additives, plasticised PVC is expected to behave like LDPE in terms of diffusivity. The major uncertainty exists for flame retardants, which can be applied in high concentrations (> 20%), and for which no specific method for calculating diffusion coefficient is available.
• A workaround has been made to estimate diffusion coefficients for those matrices not covered in the JRC Technical Report (2015) (PMMA, PC, ABS, PUR); an association to low diffusivity (i.e. PA) or high diffusivity (i.e. LDPE) has been made, depending on glass transition temperatures (see also paragraph 1.1).
The diffusion model is also not applicable to substances that are intended to react to smaller structure (i.e. changing the molecular weight during service life) or by function to move to the surface (e.g. antistatics). We have considered organic antistatics to have a “high relative release potential” by default, regardless their physical chemical proper-ties. 3. Sensitivity analysis
The aim of this chapter is to provide a rational for choices made while building the rank-ing method, with particular reference to:
• Demonstrate that adapting the pure diffusion dermal model (Delmaar) by taking into consideration partition coefficient to skin (K plastic-skin) has a significant im-pact on the order of ranks when listing the additives according to their relative re-lease potential (paragraph 3.1).
• Demonstrate that differentiation between water, saliva and skin does not lead to significant differences in the ranking position of a substance. Therefore ECHA pro-poses for the purpose of ranking one single model (based on dermal diffusion cor-rected by partitioning to skin) to cover also the other routes (paragraph 3.3).
• Demonstrate that the inhalation route needs to be addressed by a stand-alone re-lease-indicator, though the expected contribution to exposure via inhalation seem to be very limited for most of the additives (due to their low vapour pressure) (paragraph 3.4).

9
The analysis is based on a sample of 141 plastic additives 20 and related information (e.g. substance properties, technical functions, etc.). It compares the ranking position of the substances
• within the same release route (dermal), with and without partition coefficient (in this case K plastic-skin);
• between different release route to polar contact medium (dermal vs water, der-mal vs saliva);
• between dermal route and inhalation route;
Moreover, in the present analysis we also report on two other sensitivity checks carried out:
• Estimation of release potential for polar matrices like PA 6 and • Comparing, if the ranking-order is maintained when estimating the release poten-
tial for low (PA) diffusivity matrices instead of high diffusivity matrix (LDPE). Both analysis in paragraph 3.2.
To run the estimation methods and then perform the sensitivity analysis, we set the fol-lowing input data:
• Phys.-chem. properties: molecular weight, octanol water partition coefficient, va-pour pressure (calculated by means of OECD QSARs tool box, see also paragraph 4.1 in the main report).
• Concentration of the additive in the matrix based on the technical function of the substance (PEST tool, based on the OECD ESD 2003 for plastic additives):
• Plasticisers: 35% • Flame retardants: 25% • Stabilisers: 2% • Antioxidants: 0.8% • Pigments: 5% • UV stabilisers: 0.5% • Antistatic agents: 1.5%.
• In absence of specific data, the plastic matrices selected for calculations was set to:
• Soft PVC for plasticisers • LDPE for all other additives.
3.1. Dermal route
The aim is to compare the ranking resulting from the pure diffusion dermal model, as proposed by Delmaar and implemented in CEM model, with the ranking coming from the “adapted” diffusion model (where the outcome of the first model is divided by the parti-tion coefficient plastic-skin, see paragraph 2.1).
The outcome of the analysis is reported in the following chart, showing the distribution of the difference in ranking “positions” using one model (only diffusion) or the other model (diffusion corrected with partitioning).
20 Test set account of 141 substances (all organic mono-constituent) selected from an early stage list provided by industry.

10
Figure 2. Dermal route - ranking difference with and without partition
The distribution shows that for a relevant number of substances (more than 35% of the total), the difference in ranking position between the two models is 20 positions or more. For 18% of the total the difference in ranking is even 30 or more positions.
Conclusions: We cannot disregard the partitioning mechanism when ranking the sub-stances for the dermal route, even when considering the uncertainty associated to the K estimation.
3.2. Release potential for polar low diffusivity matrices
The algorithm to calculate the dermal exposure potential was also applied where the substance is used in a low diffusivity polar matrix. For that, we have estimated the “re-lease potential” of polyamide matrix PA 6,6, for which literature provides both the diffu-sion and partition coefficient estimation methods. The diffusion coefficients are calculated as proposed in the JRC guidance9 for PA 6,6 in paragraph 3.2.4 (method only applicable to substances that have molecular weight lower than 600 g/mol). The partition coefficient K is calculated using the correlation proposed by Fraunhofer Institute12 for PA 6 in contact with 50% of ethanol food simulant (equation reported here below). Log K = 0.14 x Log Kow – 0.36 (R=0.72). The boundaries for K are set to 0.1<K<1000. The main outcome of the analysis is that in no case (n= 102 substances in the test data, with MW < 600 g/mol) the release potential for low diffusivity polar matrix is higher than the reference scenario for non-polar matrix (LDPE); instead, release poten-tial for the polar matrix (PA 6,6) in many cases is lower by 1-2 order of magnitude than
11
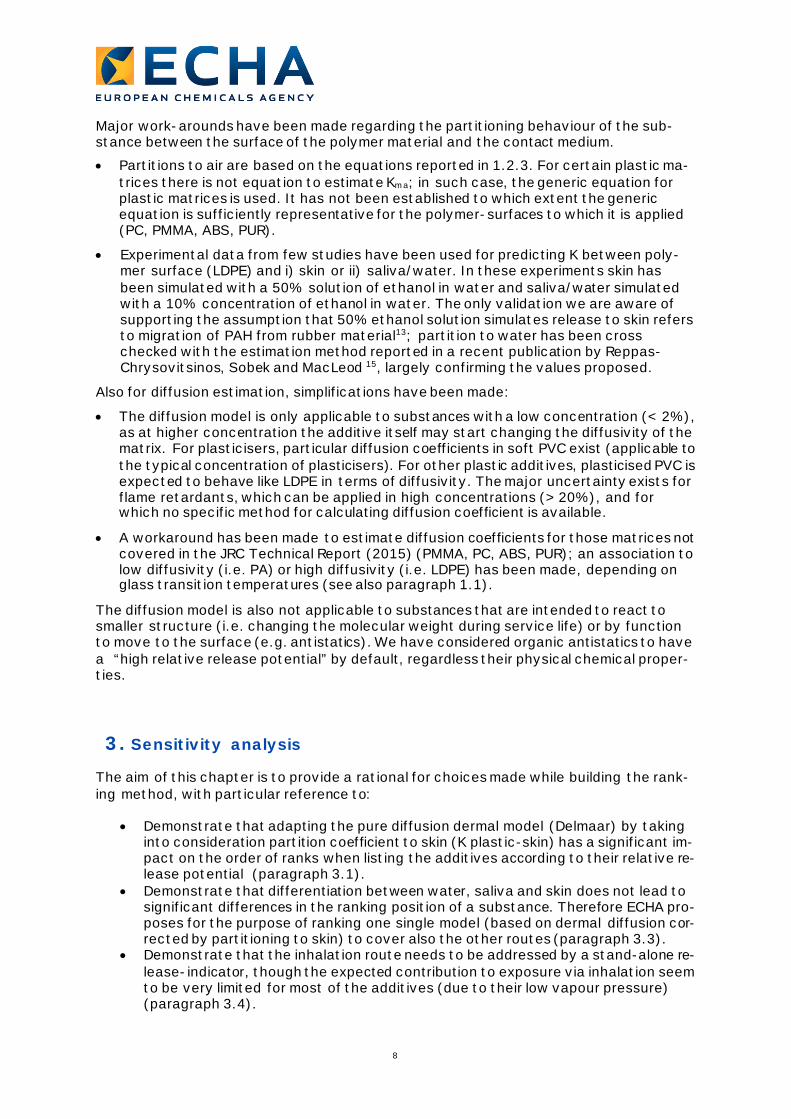
the one for LDPE scenario. Moreover, it was also investigated whether the ranking order within one matrix type among the substances significantly changed from high to low diffusivity matrices. For this purpose, the ranking positions of all the single plastic additives for LDPE have been compared to the position when ranked for PA 6.6. The test data used still corresponds to substances with molecular weight below 600 g/mol.
Figure 3. LDPE (high diffusivity) vs PA (low diffusivity)- ranking difference The graph above shows that there is no significant difference in the relative ranking posi-tion between plastic additives in high and low diffusivity matrices (please note that the ranges have been adapted to the reduced number of substances in the dataset). Only 4 % of substances show a significant change in ranking position between the 2 matrices.
3.3. Comparing dermal route to oral and water
The aim of this analysis is to compare the dermal route (with partition coefficient taken into account) to the other two routes, i.e. contact with saliva (oral) and water (environ-ment), in terms of ranking positions. This is to test the suitability of the dermal esti-mates to also cover the other two routes in terms of potential for release.
3.3.1. Oral route (saliva)
Method for exposure estimate During the expert workshop organized in November 2017, two “reasonable” assumptions were confirmed, when dealing with oral exposure to plastic articles:
12
• The migration process determining oral exposure is consistent with the diffusion- limited approach used for skin (i.e. surface concentration of substances can be estimated using the same approach).
• With the reference to the partition mechanism, saliva can be approximated to wa-ter.
Therefore, the approach proposed for water and saliva is the same as that one for der-mal (see paragraph 2.1) with the following exceptions:
• The contact-area to body-weight ratio has been reduced to take into account the limited surface of the mouth in contact with article (which is only partially com-pensated by the lower body weight of an infant). This change affects the scenario setting only, and does not have any influence on the ranking.
• The partition to saliva (assumed to be similar to the partition to water) can be ap-proximated to a food simulant containing 10% of ethanol (see also paragraph 1.2.2), while for skin a simulant with 50% ethanol seems more appropriate (see also paragraph 1.2.1)
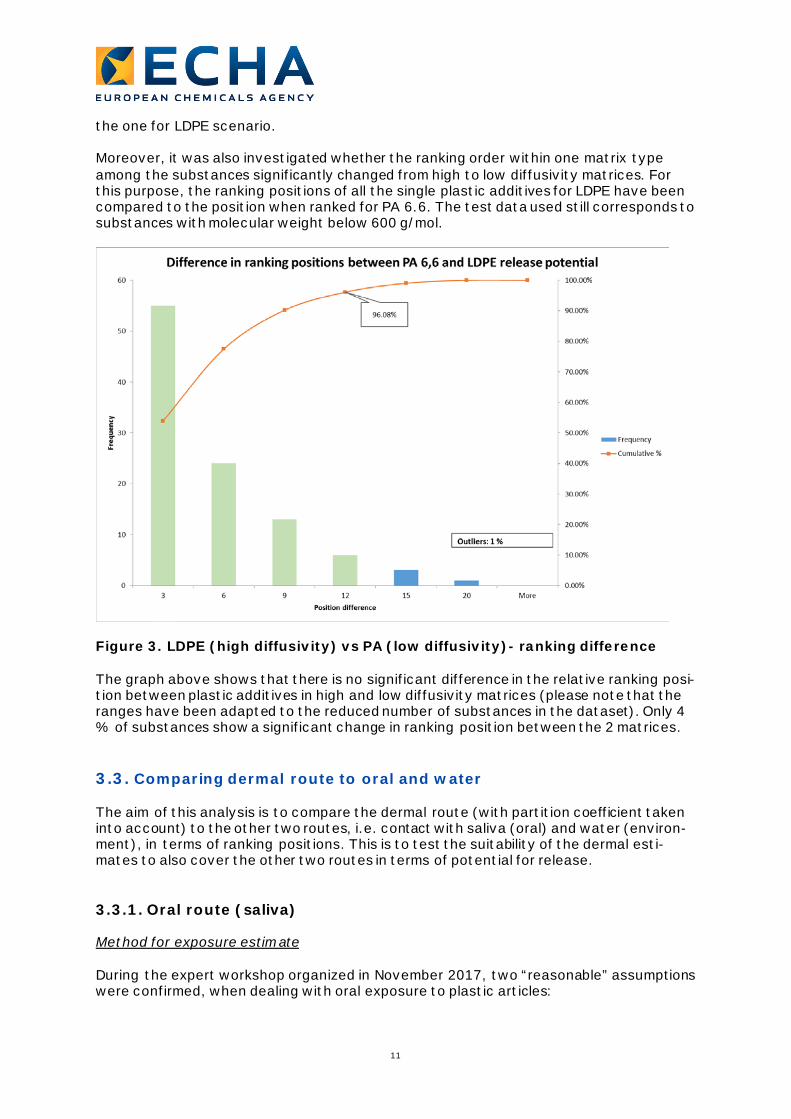
Comparison between oral and dermal route The outcome of the method for oral exposure has been compared (in terms of ranking positions) to that one for dermal exposure. Both methods are diffusion based with a cor-rection by partition coefficient. The difference results from the estimation of the partition coefficient to skin and to saliva. The outcome of the analysis is reported in the following chart, showing the distribution of the difference in ranking “positions” for oral and dermal exposure.
Figure 4. Dermal route vs oral exposure - ranking difference The graph above shows:

13
• For only a very limited number of substances (plastic additives), around 10% of the total, the difference in ranking position is 20 or more when comparing the oral and dermal route.
• For a very small number, around 2% of the total, the difference in ranking is 30 or more positions (outliers)
Conclusions: within the assumptions made, we can reasonably state that the ranking of the dermal route well represents also the ranking for the oral route.
3.3.2. Environment (water)
Method for exposure estimate We assume that the potential releases from plastic matrices to the environment can be described by the diffusion in plastics and partition to water (like for example happens water pipes); this would also be an indicator of the potential releases from outdoor plas-tic articles potentially in contact with rain. The approach proposed disregards the impact of the tonnage on potential release amount, as such tonnage information is not systematically available from industry. The model proposed is simple and the resulting indicator representing the potential re-lease to environment (water) can be calculated as follows: EI = D x C / K where EI = Environment indicator D = Diffusion coefficient (see paragraph 1.1) C = Concentration of additive in plastic K = partition to water (see paragraph 1.2.2) Comparison between environment and dermal route The outcome of the estimation in terms of environmental and dermal ranking position is reported in the following chart.

14
Figure 5. Dermal route vs environmental exposure - ranking difference The graph above shows:
• For only around 10% of the total number of substances, the difference of ranking-po-sition is 20 or more, when comparing the environment and dermal route.
• No substances (0% of the total!), showing a difference in ranking of 30 or more posi-tions (outliers).
Conclusions: within the assumptions made, we can reasonably state that the ranking of the dermal route well represents also the ranking for environment.
3.4. Comparing dermal route to the inhalation route
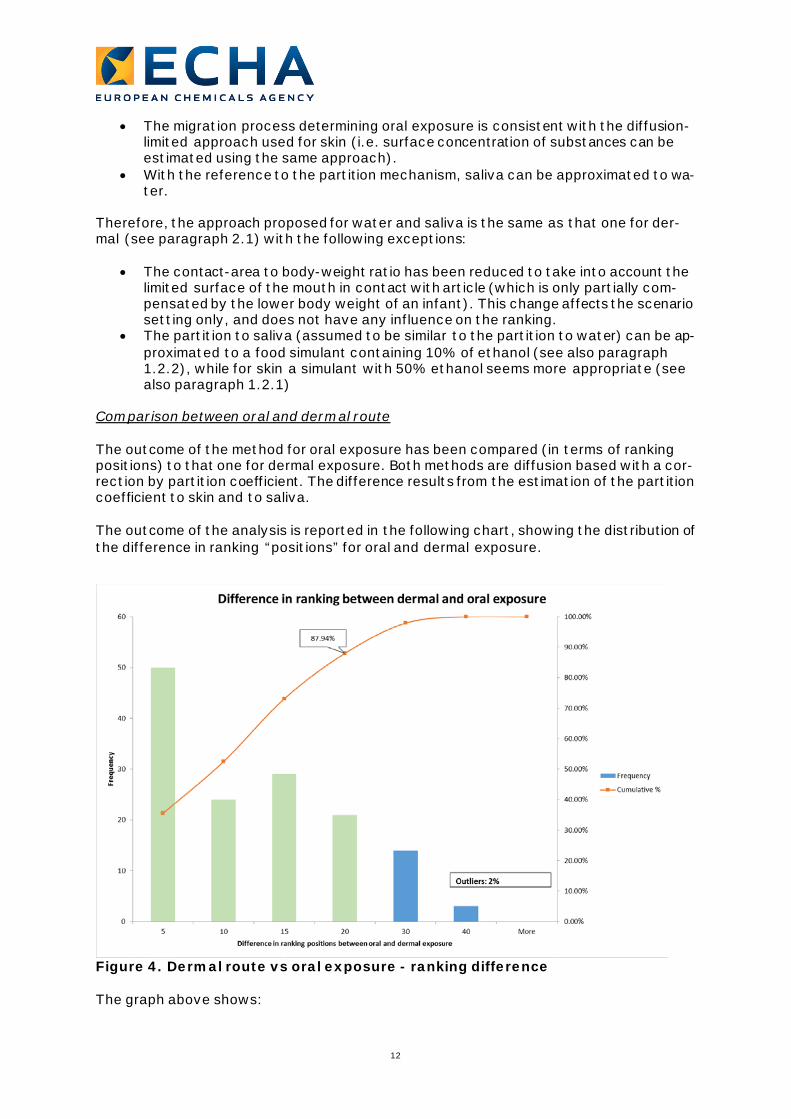
The aim of this analysis is to compare the dermal route (with partition coefficient taken into account) to the inhalation route. This is to test whether the relative release potential estimated for the dermal route would also represent the relative release potential to the inhalation route. For a test-set of 85 substances (only those with partitioning coefficient Kma < 1015 ) ex-posure values were calculated like described in section 2.1 and 2.2., and then ranked. Subsequently the position of each of the substances in the both ranking lists was com-pared.
15
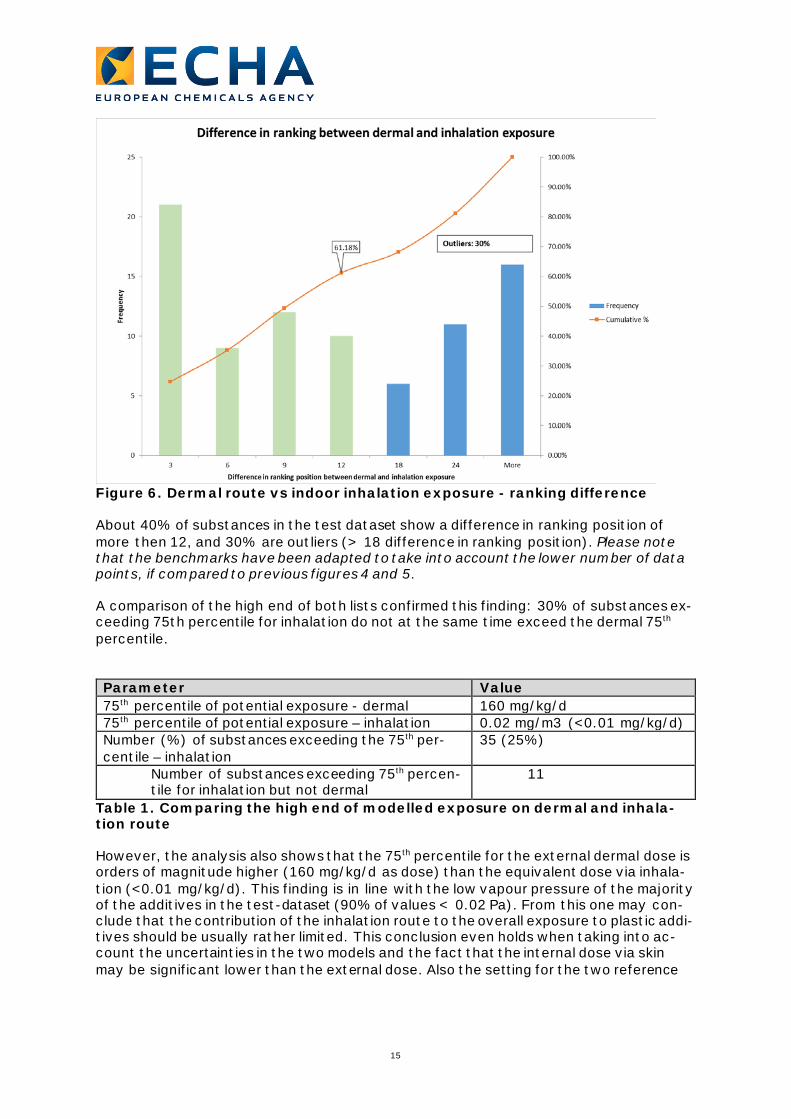
Figure 6. Dermal route vs indoor inhalation exposure - ranking difference About 40% of substances in the test dataset show a difference in ranking position of more then 12, and 30% are outliers (> 18 difference in ranking position). Please note that the benchmarks have been adapted to take into account the lower number of data points, if compared to previous figures 4 and 5. A comparison of the high end of both lists confirmed this finding: 30% of substances ex-ceeding 75th percentile for inhalation do not at the same time exceed the dermal 75th percentile.
Parameter Value 75th percentile of potential exposure - dermal 160 mg/kg/d 75th percentile of potential exposure – inhalation 0.02 mg/m3 (<0.01 mg/kg/d) Number (%) of substances exceeding the 75th per-centile – inhalation
35 (25%)
Number of substances exceeding 75th percen-tile for inhalation but not dermal
11
Table 1. Comparing the high end of modelled exposure on dermal and inhala-tion route However, the analysis also shows that the 75th percentile for the external dermal dose is orders of magnitude higher (160 mg/kg/d as dose) than the equivalent dose via inhala-tion (<0.01 mg/kg/d). This finding is in line with the low vapour pressure of the majority of the additives in the test-dataset (90% of values < 0.02 Pa). From this one may con-clude that the contribution of the inhalation route to the overall exposure to plastic addi-tives should be usually rather limited. This conclusion even holds when taking into ac-count the uncertainties in the two models and the fact that the internal dose via skin may be significant lower than the external dose. Also the setting for the two reference
16
scenarios21 impacts on the outcome of the comparison. However from the practical point of view, it is difficult to imagine a use scenario that would increase the inhalation expo-sure by more than a factor of 8 compared to the current scenario (20m2 room fully cov-ered with plastic panel instead of a plastic panel of only 10m2). Conclusion: The release potential corresponding to dermal exposure will usually drive the exposure. However, the additives with the highest release potential to air are not necessarily the same as having the highest dermal release potential. Therefore, a second indicator value is needed, in order not to miss out additives with high relative release potential on the inhalation route.
21 Daily contact to plastic article with 2 hand for 1 hour (dermal route) versus 10 m2 plastic panel in a 20 m3 room (inhalation route); see section 2.1 and 2.2
17
4. Calculating the indicator for relative release potential
4.1. Neutral organics
The method applied aims to assign a numerical indicator value for the relative release potential. Two indicators were defined, one corresponding to dermal exposure (also cov-ering oral and water) and one corresponding to inhalation. The indicator is calculated as the ratio between the modelled exposure value and the maximum value for a certain da-taset, and hence has no dimension. The ratio is then expressed in rounded logarithmic figures.
For organic UVCBs, whenever it was not possible to set a unique structure for the sub-stance, 3 different representative structures (light, middle and heavy molecular weight - MW) have been identified. Physical-chemical properties have been assigned to each of these structures. The middle MW is considered the most representative of the UVCB sub-stance; however, release potential is estimated for all 3 structures representing the UVCB substance.
For some organic plastic additives, a qualitative method (instead of the quantitative one) should be applied; the plastic additives affected are:
• Organic pigments, which are ranked low by default; this is based on very low sol-ubility in water, as reported in the registration dossiers. The partition coefficient octanol water (Kow), which is one of the input parameters for calculating the re-lease potential, would be misleading in this case, due to very low solubility of these substances in both water and octanol. The assignment to low release by default is provisional and should be confirmed by representative set of migration data.
• Antistatics, for which a high release potential has been assumed, regardless their physical chemical properties. This is due to their ability to move towards the sur-face to perform the antistatic function.
4.1.1. Matrix and concentration
The assignment of the concentration, technical function and polymer matrix is first based on data provided by industry; only in case these data are (partially) not available, con-servative assumptions have been made; the following cases are possible:
• Industry has provided both polymer matrices and concentration: the most con-servative combination of concentration and polymer matrix has been selected; Please note: when the determination of the most conservative combination of matrix and concentration was not obvious, the release estimation method has been run for each case to select the appropriate combination.
• Industry has provided the polymer matrix but not the concentration (but technical function is available): the concentration value is derived from the PEST tool (i.e. upper range value per technical function, see chapter 3) and associated to that polymer type (among those provided by industry) with highest diffusivity.
• Industry has only provided the technical function but no info on polymer matrix: The concentration is based on the above mentioned maximum value for the tech-nical function (see chapter 3) and associated with the polymer type with highest diffusivity (soft PVC for plasticisers and LDPE for all other plastic additives).
• Industry has not provided any info (even technical function is absent): the sub-stance will be considered as plasticiser in soft PVC and concentration set to the maximum (35%).

18
4.1.2. Physical chemical data
The following physical chemical parameters are used as input data for the estimation tools: Molecular weight (Da); vapour pressure (Pa); solubility (mg/l); log Kow (-). As mentioned in section 4.1 of the main report, they are generally derived from QSARs toolbox. Cases where the origin of the data is registration dossier will be highlighted.
4.1.3. Diffusion and partition coefficient
Diffusion and partition coefficients are calculated according the methods described in 1.1 and 1.2; here below main assumptions are summarized.
For the diffusion coefficient: • Diffusion coefficient is calculated according equation and parameters given in the
JRC Technical Document (2015) • Additives in soft PVC other than plasticizers are processed as they were in high
diffusivity LDPE • Additives in PMMA/PC/ABS are considered as they were in low diffusivity matrix
PA. • Additives in PUR are treated like additives in high diffusivity matrix LDPE.
For partition coefficient: • Partition to skin is approximated to partition to 50% solution of ethanol in water
and partition to saliva/water simulated with a 10% concentration of ethanol in water; the correlation curves proposed by Fraunhofer Institute are used for K es-timation
• In case of partition to skin/water/saliva from matrices other than LDPE and PA, the following assumption have been made: a) partition from soft PVC, HDPE and PUR is associated to partition from LDPE; b) partition from other matrices (e.g. ABS) associated to PA.
• Partition to air is calculated from plastic specific correlation equation for polyeth-ylenes (LDPE, HDPE) and PA; partition to soft PVCs assumed to be the same as that one for LDPE; for other matrices a “generic plastic” correlation has been used.
4.2. Other additives
For inorganics and for organic substances with charged migrants (i.e. ions), the above method is not applicable, and therefore the relative release potential is generally consid-ered uncertain. However, some of the inorganic substance show a very low solubility (< 0.01 mg/l in registration dossier), and hence are likely to have also a relatively low re-lease potential.
19
5. Example for comparing the release potential
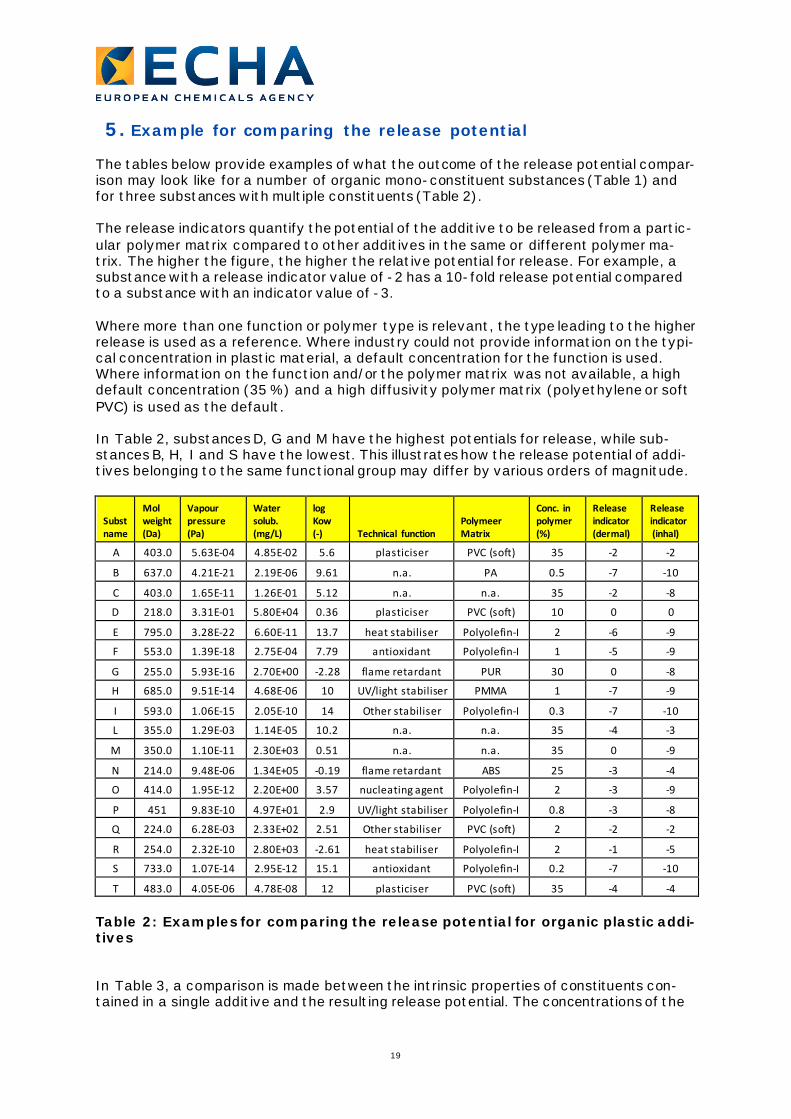
The tables below provide examples of what the outcome of the release potential compar-ison may look like for a number of organic mono-constituent substances (Table 1) and for three substances with multiple constituents (Table 2). The release indicators quantify the potential of the additive to be released from a partic-ular polymer matrix compared to other additives in the same or different polymer ma-trix. The higher the figure, the higher the relative potential for release. For example, a substance with a release indicator value of -2 has a 10-fold release potential compared to a substance with an indicator value of -3. Where more than one function or polymer type is relevant, the type leading to the higher release is used as a reference. Where industry could not provide information on the typi-cal concentration in plastic material, a default concentration for the function is used. Where information on the function and/or the polymer matrix was not available, a high default concentration (35 %) and a high diffusivity polymer matrix (polyethylene or soft PVC) is used as the default. In Table 2, substances D, G and M have the highest potentials for release, while sub-stances B, H, I and S have the lowest. This illustrates how the release potential of addi-tives belonging to the same functional group may differ by various orders of magnitude.
Subst name
Mol weight (Da)
Vapour pressure (Pa)
Water solub. (mg/L)
log Kow (-) Technical function
Polymeer Matrix
Conc. in polymer (%)
Release indicator (dermal)
Release indicator (inhal)
A 403.0 5.63E-04 4.85E-02 5.6 plasticiser PVC (soft) 35 -2 -2
B 637.0 4.21E-21 2.19E-06 9.61 n.a. PA 0.5 -7 -10
C 403.0 1.65E-11 1.26E-01 5.12 n.a. n.a. 35 -2 -8
D 218.0 3.31E-01 5.80E+04 0.36 plasticiser PVC (soft) 10 0 0
E 795.0 3.28E-22 6.60E-11 13.7 heat stabiliser Polyolefin-I 2 -6 -9
F 553.0 1.39E-18 2.75E-04 7.79 antioxidant Polyolefin-I 1 -5 -9
G 255.0 5.93E-16 2.70E+00 -2.28 flame retardant PUR 30 0 -8
H 685.0 9.51E-14 4.68E-06 10 UV/light stabiliser PMMA 1 -7 -9
I 593.0 1.06E-15 2.05E-10 14 Other stabiliser Polyolefin-I 0.3 -7 -10
L 355.0 1.29E-03 1.14E-05 10.2 n.a. n.a. 35 -4 -3
M 350.0 1.10E-11 2.30E+03 0.51 n.a. n.a. 35 0 -9
N 214.0 9.48E-06 1.34E+05 -0.19 flame retardant ABS 25 -3 -4
O 414.0 1.95E-12 2.20E+00 3.57 nucleating agent Polyolefin-I 2 -3 -9
P 451 9.83E-10 4.97E+01 2.9 UV/light stabiliser Polyolefin-I 0.8 -3 -8
Q 224.0 6.28E-03 2.33E+02 2.51 Other stabiliser PVC (soft) 2 -2 -2
R 254.0 2.32E-10 2.80E+03 -2.61 heat stabiliser Polyolefin-I 2 -1 -5
S 733.0 1.07E-14 2.95E-12 15.1 antioxidant Polyolefin-I 0.2 -7 -10
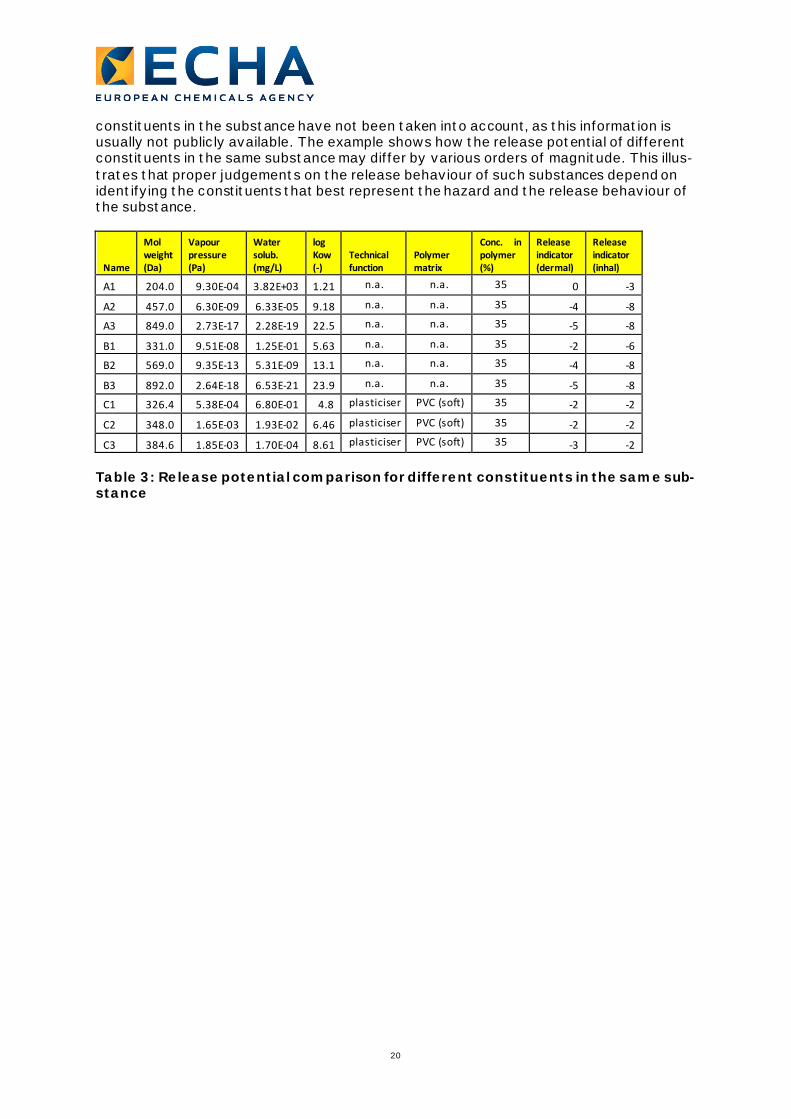
T 483.0 4.05E-06 4.78E-08 12 plasticiser PVC (soft) 35 -4 -4 Table 2: Examples for comparing the release potential for organic plastic addi-tives In Table 3, a comparison is made between the intrinsic properties of constituents con-tained in a single additive and the resulting release potential. The concentrations of the
20
constituents in the substance have not been taken into account, as this information is usually not publicly available. The example shows how the release potential of different constituents in the same substance may differ by various orders of magnitude. This illus-trates that proper judgements on the release behaviour of such substances depend on identifying the constituents that best represent the hazard and the release behaviour of the substance.
Name
Mol weight (Da)
Vapour pressure (Pa)
Water solub. (mg/L)
log Kow (-)
Technical function
Polymer matrix
Conc. in polymer (%)
Release indicator (dermal)
Release indicator (inhal)
A1 204.0 9.30E-04 3.82E+03 1.21 n.a. n.a. 35 0 -3
A2 457.0 6.30E-09 6.33E-05 9.18 n.a. n.a. 35 -4 -8
A3 849.0 2.73E-17 2.28E-19 22.5 n.a. n.a. 35 -5 -8
B1 331.0 9.51E-08 1.25E-01 5.63 n.a. n.a. 35 -2 -6
B2 569.0 9.35E-13 5.31E-09 13.1 n.a. n.a. 35 -4 -8
B3 892.0 2.64E-18 6.53E-21 23.9 n.a. n.a. 35 -5 -8
C1 326.4 5.38E-04 6.80E-01 4.8 plasticiser PVC (soft) 35 -2 -2
C2 348.0 1.65E-03 1.93E-02 6.46 plasticiser PVC (soft) 35 -2 -2
C3 384.6 1.85E-03 1.70E-04 8.61 plasticiser PVC (soft) 35 -3 -2 Table 3: Release potential comparison for different constituents in the same sub-stance