plasmoids in saturn’s magnetotail - ucla
TRANSCRIPT

Plasmoids in Saturn’s magnetotail
T. W. Hill,1 M. F. Thomsen,2 M. G. Henderson,2 R. L. Tokar,2 A. J. Coates,3
H. J. McAndrews,2 G. R. Lewis,3 D. G. Mitchell,4 C. M. Jackman,5 C. T. Russell,6
M. K. Dougherty,5 F. J. Crary,7 and D. T. Young7
Received 3 July 2007; revised 14 September 2007; accepted 10 October 2007; published 26 January 2008.
[1] Plasmoids in Saturn’s magnetotail are identified by a reversal (northward turning) ofthe normally southward component of the magnetic field across the tail current sheet.Three large plasmoids have been identified by the Cassini magnetometer, one near0300 local time at a planet-centered distance of 44 RS and two near midnight at 48–49 RS.(RS � 60,300 km is Saturn’s equatorial radius.) Two of these events, including inparticular the 0300 event, coincided with current-sheet crossings by the spacecraft andthus provided sufficient plasma fluxes to determine ion composition and velocity momentsfrom Cassini Plasma Spectrometer data. The composition was largely dominated by water-group ions, indicating an inner-magnetosphere source. The flow was subcorotational andstrongly tailward, as expected for a plasmoid. Just before the in situ detection of the0300 plasmoid, the Magnetospheric Imaging Instrument observed an outburst of energeticneutral atoms emanating from a location midway between Saturn and Cassini, probably asignature of the reconnection event that spawned the plasmoid.
Citation: Hill, T. W., et al. (2008), Plasmoids in Saturn’s magnetotail, J. Geophys. Res., 113, A01214,
doi:10.1029/2007JA012626.
1. Introduction
[2] A plasmoid is a transient magnetic loop structureformed by time-dependent magnetic reconnection in aplanetary magnetotail. It provides a mechanism for remov-ing plasma from the magnetosphere while conserving mag-netic flux. The magnetic flux and the plasma generally movetogether according to the idealMHD conditionE + v�B = 0.This condition is violated in a microscopic but finiteneighborhood of a reconnection line (� line), allowing themagnetic field topology to change and the plasma to escapefrom ‘‘closed’’ magnetospheric field lines (i.e., field lineshaving both ends attached to the planet).[3] Plasmoids are ubiquitous in Earth’s magnetotail,
where they play an important role in magnetospheric sub-storms [e.g., Russell and McPherron, 1973; Hones, 1984].They are also clearly observed in Jupiter’s magnetotail [e.g.,
Russell et al., 1998; Kronberg et al., 2005], where they playan integral part in the formation of a tailward planetary wind[Vasyliunas, 1983]. Recently Jackman et al. [2007] haveidentified and characterized three large plasmoids observedin Saturn’s magnetotail by the Cassini magnetometer(MAG). In this paper we present and analyze related plasmadata from the Cassini Plasma Spectrometer (CAPS) andenergetic neutral atom (ENA) images from the Magneto-spheric Imaging Instrument (MIMI). The MAG, CAPS, andMIMI instruments are described briefly by Dougherty et al.[2005], Young et al. [2005], and Krimigis et al. [2005],respectively.[4] During its several 2006 magnetotail excursions, the
Cassini spacecraft spent most of its time in the southern taillobe, not in the plasma sheet that separates the northern andsouthern lobes, probably because of the expected warpingof the plasma sheet as described by Arridge [2007] andJackman et al. [2007] and illustrated in Figure 1. Suchwarping of the magnetotail current sheet is quite familiarand well established at Earth [e.g., Fairfield, 1980, andreferences therein]. The plasma sheet lies close to the(observationally indistinguishable) magnetic and rotationalequatorial planes in the region close to the planet, within�10 RS, corresponding to �1=2 of the typical Chapman-Ferraro distance (the magnetopause distance on the planet-Sun line). Farther out, particularly in the tail, the plasmasheet bends over to follow the solar wind direction, whichdetermines the asymptotic symmetry axis of the tail. The2006 Cassini magnetotail orbits stayed close to Saturn’sequatorial plane, and therefore missed the plasma sheetexcept for the three fortuitous occasions analyzed here,
JOURNAL OF GEOPHYSICAL RESEARCH, VOL. 113, A01214, doi:10.1029/2007JA012626, 2008ClickHere
for
FullArticle
1Physics and Astronomy Department, Rice University, Houston, Texas,USA.
2Los Alamos National Laboratory, Los Alamos, New Mexico, USA.3Mullard Space Science Laboratory, University College London,
Surrey, UK.4Johns Hopkins University, Applied Physics Laboratory, Laurel,
Maryland, USA.5Blackett Laboratory, Imperial College, London, UK.6Institute of Geophysics, University of California, Los Angeles,
California, USA.7Space Science and Engineering, Southwest Research Institute, San
Antonio, Texas, USA.
Copyright 2008 by the American Geophysical Union.0148-0227/08/2007JA012626$09.00
A01214 1 of 9

and a few other plasma sheet encounters (not involvingplasmoids) reported recently by Arridge et al. [2007].
2. Observations
[5] We adopt the event labels defined in Figure 1 ofJackman et al. [2007], whereby plasmoids 1, 2, and 3occurred respectively on 4 August, 12 July, and 4 March2006 (inverse chronological order), events 1 and 2 nearmidnight and event 3 near 0300 local time. We presentMAG and CAPS data for events 1 and 3, and MIMI data forevent 3.
2.1. Plasmoid 1
[6] Figure 2 shows MAG data (top panel, reproducedwith lower time resolution from Figure 2 of Jackman et al.[2007]) and CAPS data (remaining panels) for the plasmoidevent on 4 August 2006, near midnight at 49 RS. Thesecond and third panels show, respectively, number densi-ties and temperatures for electrons and two species ofpositive ions, water-group ions, W+ (mass 16–18 amu)and protons, H+. The bottom three panels show the threecomponents of ion flow velocity in the same spin-alignedspherical (r, q, f) coordinate system as the magnetic fielddata in the top panel.[7] The electron moments are obtained by numerical
integration of differential fluxes observed by the CAPSElectron Spectrometer (ELS), after removal of spacecraftphotoelectrons, under the assumption of isotropy in thespacecraft frame of reference. These are obtained at 2–8 stime resolution for the data shown here, depending onCAPS instrument mode, but have been smoothed with arunning average to match the time resolution of the ionmoments.[8] Extraction of ion moments from the CAPS Ion
Mass Spectrometer (IMS) is complicated by three factors:(1) intrinsically lower fluxes for ions compared to elec-trons, (2) the presence of two distinct ion populations, and(3) supersonic flow velocities that often lie outside theCAPS field of view. With respect to point (1), ion datapoints are shown in the figure only at times for which ionfluxes were sufficiently large and steady to provide reliableion moments. Each ion data point is obtained from countsaccumulated during 14 consecutive instrument cycles(14�32 sec). To deal with point (2) we assumed that the
more energetic ion peak is due to water-group ions denotedW+ (mass between 16 and 18 amu) and that the lessenergetic peak is due to protons denoted H+. The twoenergy peaks are well separated, and their energy ratiosare appropriate to this assignment if the speeds are compa-rable. (The ion fluxes are much too low here to utilize thetime-of-flight mass-resolving capability of the IMS. Theidentification of the higher energy peak as W+ is alwaysconsistent with the time-of-flight analysis when the latter isavailable.) To overcome difficulty (3), we fit the observedcounts in the eight angular sectors to a pair of convectingMaxwellian velocity distributions (one each for W+ andH+), with the constraint that the two species share the sameflow velocity. This constraint is rigorously true only if thevelocity is perpendicular to B, which is not true in detail,but relaxing this constraint would result in unequal perpen-dicular velocities for the two species, which is manifestlyimplausible. Values for the flow velocity are plotted onlyfor those times when the true flow was clearly in theinstrument field of view, as determined by detailed exam-ination of count rates in the eight individual angular sectors(not shown here). The IMS field of view for this interval isshown in Figure A1 of the Appendix. The error bars on theion moments represent the widths of the minima of thestatistical cost function in parameter space.[9] The MAG data indicate that the Bq reversal occurred
near a true current-sheet crossing, with anticorrelatedreversals of Br and Bf.[10] The sum of number densities for the two ion species
is less than the electron number density by a factor of two orless. This difference is probably attributable to combinedmeasurement and fitting errors, although we cannot rule outthe possible admixture of multiply charged ions in the watergroup. It is interesting to note that the electron temperatureis generally closer to the W+ ion temperature than to theproton temperature, which is opposite to the trend observedin the inner magnetosphere [e.g., Young et al., 2005; Rymeret al., 2007]. This difference can plausibly be attributed tothe longer residence time for plasma observed at 49 RS inthe tail, coupled with the longer Coulomb equilibration timefor electrons with heavy ions versus protons.[11] It is unfortunate (but perhaps significant) that ion
fluxes became too small for moment extraction just about atthe time of the Bq reversal, announcing the arrival of thecenter of the plasmoid at Cassini. The electron density dropsby a factor �4 at about this time, possibly indicating the exitof the spacecraft from the central plasma sheet. This couldexplain the reduction of ion flux, but another possible causeis a deflection of the supersonic ion flow out of the CAPSfield of view (see Appendix). Just before the ion signal islost, there is a clear deflection of ion flow away from thecorotation direction (a decrease of vf) and toward thetailward direction (an increase of vr). A similar and strongeracceleration is evident in plasmoid 3 (below), for which ionmoments are more plentiful.
2.2. Plasmoid 2
[12] This plasmoid, also near midnight but on the previ-ous apoapsis (12 July 2006), did not involve a current sheetcrossing, as evidenced by the lack of Br and Bf reversals[Jackman et al., 2007]. It resembles a ‘‘traveling compres-sion region’’ in Earth’s magnetotail [Siscoe et al., 1984] that
Figure 1. Cartoon illustration of the expected warping ofthe magnetotail plasma sheet away from Saturn’s equatorialplane near the midnight meridian, and hence, unfortunately,away from most of the Cassini 2006 magnetotail orbits.
A01214 HILL ET AL.: PLASMOIDS IN SATURN’S MAGNETOTAIL
2 of 9
A01214

reflects a near-miss encounter with a tailward-movingplasmoid. Because the central plasma sheet was notencountered, ion fluxes were not sufficient to yield reliableion moments, so this event is not further discussed here.
2.3. Plasmoid 3
[13] This event, occurring on 4 March 2006 near 0300local time at a range of 44 RS, was more amenable toderivation of ion moments. The results are shown in Figure 3,in the same format as Figure 2. There were four notablenegative excursions of Bq, of which the last and largest
occurred at about 2300. The preceding hour was character-ized by small and variable field components with anticor-related perturbations of Br and Bf, indicative of closeproximity to the magnetotail current sheet. Correspond-ingly, the ion fluxes were large enough to provide reliablemoments for an extended interval surrounding the plas-moid(s). (For this event the geometry of Figure 1 does notapply–Saturn’s equatorial plane, and Cassini, were actuallyslightly above the ecliptic plane at 0300 local time. Saturnwas roughly midway between solstice and equinox.)
Figure 2. MAG and CAPS data for the plasmoid event on 4 August 2006. Top panel: magnetic fieldcomponents in a spin-aligned spherical (r, q, f) coordinate system. Next panel: number densities ofelectrons, water-group ions W+, and protons H+. Next panel: temperatures for the same species. Bottomthree panels: ion velocity components in the same (r, q, f) coordinate system. Rigid corotation wouldimply vf = 477 km/s, off the top of the vf scale.
A01214 HILL ET AL.: PLASMOIDS IN SATURN’S MAGNETOTAIL
3 of 9
A01214

[14] As in the 4 August event, the ion composition wasgenerally (but not always) dominated by W+. The electrontemperature again tracks the W+ temperature early in theevent but fails to keep up with the dramatic increase in thelatter after �2230. Instead, after that time, the electrontemperature matches (perhaps by coincidence) the peaksof the rapidly varying proton temperature, whichapproaches values comparable to the former W+ tempera-ture. After about 2310 the W+ energy (mostly flow energy)evidently went off scale above the top of the IMS energyrange, 50 keV (this is more evident in the energy-timespectrograms, not shown here), and thereafter the ionvelocity moments are based on the proton peak alone.
[15] Also as in the 4 August event, the flow vectorgenerally rotated away from the azimuthal direction andtoward the radial direction during the approach of theplasmoid(s), for �1 h before the largest Bq reversal at2300. Note, however, the brief interval around 2245 whenthe flow was almost entirely in the anticorotation direction.This was followed by a brief interval (�2305–2310) ofstrongly southward flow (positive vq), and a longer period(� 2315–2330) of extraordinarily fast radial flow alongwith a strong prograde azimuthal component approaching 1=2of rigid corotation (430 km/s at this distance). Toward theend of the plasmoid encounter the flow became generallytailward but with a strong southward component. (At 0300
Figure 3. MAG and CAPS data for the plasmoid event on 4 Mar 2006, in the same format as Figure 2.Rigid corotation would imply vf = 430 km/s, off the top of the vf scale.
A01214 HILL ET AL.: PLASMOIDS IN SATURN’S MAGNETOTAIL
4 of 9
A01214

local time, a purely antisunward flow would containapproximately equal radial and anticorotational compo-nents, roughly consistent with the r and f componentsobserved toward the end of this interval.) Some of thesmaller-scale velocity deflections (but probably not the
generally tailward rotation) may well result from atemporary mismatch between the planet-centered sphericalcoordinate system and the true (and undoubtedly fluctuat-ing) orientation of the current sheet. The IMS field of viewfor this interval is shown in Figure A2 of the Appendix.
Figure 4. MIMI ENA images for hydrogen (top five rows) and oxygen (bottom five rows) for timesranging from 2229 (left column) to 2311 (right column) on 4 March 2006. Hydrogen energies range from80–140 keV (top row) down to 10–20 keV (row 5) and oxygen energies range from 208–304 keV (row 6)to 48–64 keV (row 10). The inferred source location is indicated in Figure 5.
A01214 HILL ET AL.: PLASMOIDS IN SATURN’S MAGNETOTAIL
5 of 9
A01214

2.4. ENA Signature of Plasmoid 3
[16] During this event, an intense burst of energeticneutral atoms (ENAs) was detected by the MagnetosphericImaging Instrument, from a source located between Saturnand Cassini. The relevant ENA image sequence is shown inFigure 4, covering a time interval ranging from 2229 (leftcolumn) to 2311 (right column) on 4 March 2006. The topfive rows show hydrogen atom flux at energies rangingfrom 80–140 keV (top row) down to 10–20 keV (row 5).The bottom five rows show oxygen atom flux at energiesranging from 208–304 keV (row 6) down to 48–64 keV(row 10). The peak hydrogen flux arrived at the spacecraftat about 2254 with energies �10 keV (implying speeds�1.4 RS/min), and the peak oxygen flux arrived at about2259 with energies �100 keV (implying speeds �1.1 RS/min). If we assume that both species started at the same timeand the same distance, we can solve uniquely for that time(�2235) and distance (�26.5 RS).[17] The inferred source location of these ENA bursts is
shown by the shaded box in Figure 5. The left and rightsides of this box, as viewed from Cassini, are the viewingdirections of the MIMI detector at the first and next-to-lasttime frames shown in Figure 4, while the near and far sidesare the minimum and maximum ranges based on a morecareful analysis of the time-of-arrival-versus-velocity dis-persion that is evident in Figure 4. The above back-of-envelope estimate falls near the center of this box.
3. Discussion and Conclusions
[18] All three plasmoids identified by Jackman et al.[2007] display the classic magnetic signature of terrestrial
and Jovian plasmoids, a temporary but persistent reversalof the field component across the magnetotail current sheet.The magnetic signatures alone indicate that Cassini crossedthe current sheet during the passages of the 4 March and4 August plasmoids (cases 3 and 1 respectively) but notduring the 12 July event (case 2). Consistent with thesesignatures, we have found larger plasma densities in events 1and 3 than in event 2. The larger densities have enabled us toextract ion velocity moments for a short segment of event 1and a longer portion of event 3. In both cases, especially incase 3, we observe largely azimuthal flow early in the event,rotating to strongly tailward flow as the Bq reversal(magnetic O line) passes the spacecraft. Before the O linepassage, the azimuthal flow was �10–40% of the rigidcorotation speed in event 1, and �0–50% in case 3. Inevent 3, where ion moments are available after the O linepassage, the total velocity, largely tailward, approachedtwice the rigid corotation speed.[19] Thus like the magnetic signatures, the plasma sig-
natures, when available, are consistent with a plasmoidinterpretation. They differ, however, from Earth-like sub-storm plasmoids in two important respects. The ion com-position is similar to that in the inner magnetosphere(dominated by W+ [Young et al., 2005]), and the azimuthalflow component is predominantly prograde in the earlyportion of the event. These features are qualitatively con-sistent with the idea of plasmoids produced by a centrifu-gally driven planetary wind [Hill et al., 1974], as illustratedin Figure 6, reproduced from Figure 11.19 of Vasyliunas[1983]. This sketch was originally offered as a descriptionof a possible steady state (or time averaged) configuration in
Figure 5. From the observed direction of arrival, coupled with time-of-flight velocity dispersion, theENA bursts shown in Figure 4 can be inferred to have originated within the shaded box at a time�25 min before the in situ detection of the large Bq reversal at Cassini (denoted by the large dot).The view is in Saturn’s equatorial plane, and the dashed line is a cartoon illustration of a typicalmagnetopause location with the Sun to the right.
A01214 HILL ET AL.: PLASMOIDS IN SATURN’S MAGNETOTAIL
6 of 9
A01214

Jupiter’s magnetosphere. The theoretical arguments thatmotivated it are, however, equally applicable to Saturn.[20] The plasmoids that we have observed are clearly not
steady state structures, but there is nothing in the originalarguments of Vasyliunas [1983] that requires a steady statestructure. A time-dependent version of the same phenome-non has been discussed by Kivelson and Southwood [2005]and depicted in their Figure 4b. The formation and motionof a time-dependent plasmoid can be conceptualized as atime variation of the � and O line positions in Figure 6.Alternatively, the sequence 1–4 on the right side of Figure 6can be read as a time sequence on a given meridian (e.g., 4)rather than a spatial evolution with increasing local time.The qualitative message of Figure 6 is that plasmoidformation is expected to be more prevalent in the mid-night-dawn quadrant than in the dusk-midnight quadrant.The midnight-dawn quadrant is, of course, where the threeplasmoids described here were found, but Cassini has yet tovisit the dusk-midnight quadrant.[21] The ENA burst shown in Figure 4 can be attributed
to sudden plasma heating and acceleration at the newlyformed � line that creates the plasmoid and launches it onits tailward motion. (Another necessary ingredient, ofcourse, is a ready supply of neutral charge-exchange part-ners. The origin of this neutral water-group and hydrogencloud is outside the scope of this paper, but we note thatENA (O and H) bursts originating from this planet-centereddistance are not uncommon [Mitchell et al., 2005].) Theinferred location of the ENA source (Figure 5) is consider-ably Sunward of the expected location of the � line basedon a literal interpretation of Figure 6. However, Vasyliunas[1983] emphasized that the figure is a free-hand sketch andits details are not to be interpreted literally. There is,unfortunately, no quantitative theoretical model of theplanetary wind process with which to compare.
[22] If, as we suggest, the ENA burst signaled the forma-tion of a new magnetic � line, we can estimate the speed ofthe subsequent plasmoid motion by comparing the time andlocation of the ENA burst with that of the plasmoid passingthe spacecraft. The ENA burst is inferred to have occurredat �2235 at a location �26.5 RS upstream of Cassini. Themagnetic O line, which must have started at some interme-diate distance, arrived at Cassini at �2300 (the largest Bqreversal), implying an upper limit of �26.5 RS/25 min�1000 km/s for its average tailward speed. The arrival ofthe � line at Cassini is more difficult to pinpoint, butprobably occurred around 2325, when Bq returned to a valuenear zero (Figure 3). (The subsequent half hour when Bqlingers at slightly negative values may result from asmall mismatch between the idealized equatorial plane ofthe (r, q, f) coordinate system and the actual current-sheetsymmetry surface, as suggested by the fact that Br and Bfare not well anticorrelated after the O line passage.) Thiswould suggest an average � line speed of �26.5 RS/50 min�500 km/s, or half of the upper limit estimated above forthe O line speed.[23] These speed estimates are not definitive but they are
plausible. For example, the maximum measured ion flowspeed in this plasmoid, largely tailward, was �800 km/srelative to Saturn (Figure 3), comparable to our inferredupper limit on the average O line speed. The O line isexpected to move at the local plasma velocity in the planeperpendicular to the O line because the E � B flow istoward the O line from all sides in that plane [Vasyliunas,1980, 1983]. Our measured ion flow and inferred O-linevelocity are consistent with this expectation.[24] It is obvious that no general conclusions can be
drawn on the basis of only three events, of which onlytwo allowed a determination of plasma flow velocity. Allthat can be said is that these three events displayed signa-
Figure 6. Sketch of a centrifugally driven planetary wind, reproduced from Figure 11.19 of Vasyliunas[1983]. The left side shows plasma flow (open arrows) in the equatorial plane and possible locations ofsteady state magnetic � and O lines. The right side shows resulting magnetic field line configurations inthe four meridian surfaces marked on the left. Although the sketch was intended to describe a steady stateor time-averaged structure at Jupiter, it provides a useful context for the interpretation of the highly non-steady plasmoid observations at Saturn.
A01214 HILL ET AL.: PLASMOIDS IN SATURN’S MAGNETOTAIL
7 of 9
A01214
tures that are consistent with the plasmoid picture, and thereis no other theoretical picture available to explain them. Noestimate of occurrence frequency is possible because of theunfavorable observing geometry shown in Figure 1. (Alower limit of one event per month is justified, but isprobably very much smaller than the real occurrence fre-quency.) There is some hope of additional magnetotailorbits during an extended Cassini mission, and if so, thegeometry near midnight should be more favorable thanindicated in Figure 1 because Saturn would be near itsAugust 2009 equinox.
Appendix
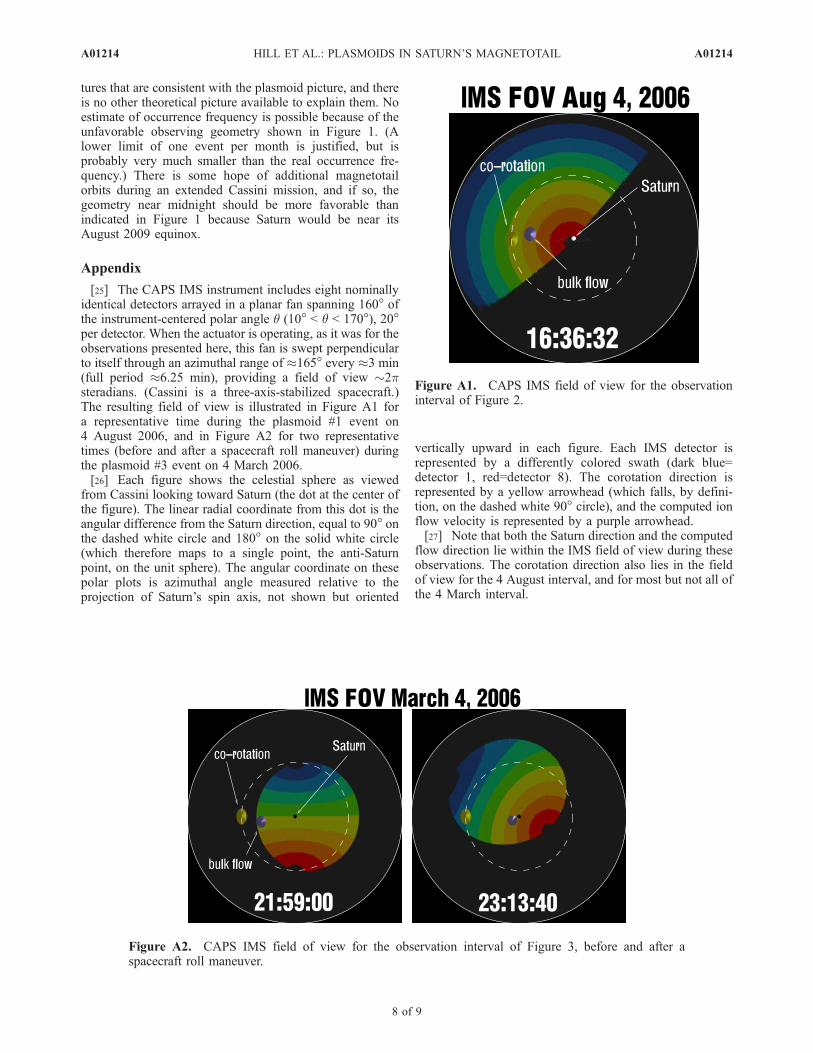
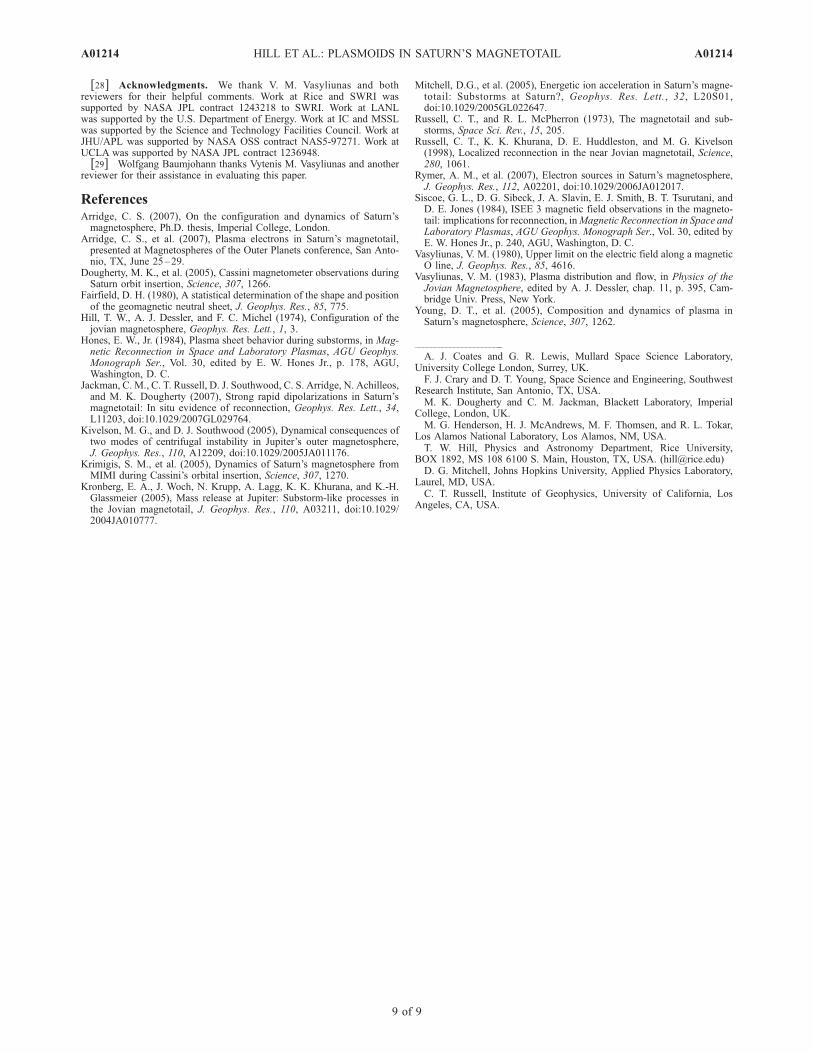
[25] The CAPS IMS instrument includes eight nominallyidentical detectors arrayed in a planar fan spanning 160� ofthe instrument-centered polar angle q (10� < q < 170�), 20�per detector. When the actuator is operating, as it was for theobservations presented here, this fan is swept perpendicularto itself through an azimuthal range of �165� every �3 min(full period �6.25 min), providing a field of view �2psteradians. (Cassini is a three-axis-stabilized spacecraft.)The resulting field of view is illustrated in Figure A1 fora representative time during the plasmoid #1 event on4 August 2006, and in Figure A2 for two representativetimes (before and after a spacecraft roll maneuver) duringthe plasmoid #3 event on 4 March 2006.[26] Each figure shows the celestial sphere as viewed
from Cassini looking toward Saturn (the dot at the center ofthe figure). The linear radial coordinate from this dot is theangular difference from the Saturn direction, equal to 90� onthe dashed white circle and 180� on the solid white circle(which therefore maps to a single point, the anti-Saturnpoint, on the unit sphere). The angular coordinate on thesepolar plots is azimuthal angle measured relative to theprojection of Saturn’s spin axis, not shown but oriented
vertically upward in each figure. Each IMS detector isrepresented by a differently colored swath (dark blue=detector 1, red=detector 8). The corotation direction isrepresented by a yellow arrowhead (which falls, by defini-tion, on the dashed white 90� circle), and the computed ionflow velocity is represented by a purple arrowhead.[27] Note that both the Saturn direction and the computed
flow direction lie within the IMS field of view during theseobservations. The corotation direction also lies in the fieldof view for the 4 August interval, and for most but not all ofthe 4 March interval.
Figure A1. CAPS IMS field of view for the observationinterval of Figure 2.
Figure A2. CAPS IMS field of view for the observation interval of Figure 3, before and after aspacecraft roll maneuver.
A01214 HILL ET AL.: PLASMOIDS IN SATURN’S MAGNETOTAIL
8 of 9
A01214
[28] Acknowledgments. We thank V. M. Vasyliunas and bothreviewers for their helpful comments. Work at Rice and SWRI wassupported by NASA JPL contract 1243218 to SWRI. Work at LANLwas supported by the U.S. Department of Energy. Work at IC and MSSLwas supported by the Science and Technology Facilities Council. Work atJHU/APL was supported by NASA OSS contract NAS5-97271. Work atUCLA was supported by NASA JPL contract 1236948.[29] Wolfgang Baumjohann thanks Vytenis M. Vasyliunas and another
reviewer for their assistance in evaluating this paper.
ReferencesArridge, C. S. (2007), On the configuration and dynamics of Saturn’smagnetosphere, Ph.D. thesis, Imperial College, London.
Arridge, C. S., et al. (2007), Plasma electrons in Saturn’s magnetotail,presented at Magnetospheres of the Outer Planets conference, San Anto-nio, TX, June 25–29.
Dougherty, M. K., et al. (2005), Cassini magnetometer observations duringSaturn orbit insertion, Science, 307, 1266.
Fairfield, D. H. (1980), A statistical determination of the shape and positionof the geomagnetic neutral sheet, J. Geophys. Res., 85, 775.
Hill, T. W., A. J. Dessler, and F. C. Michel (1974), Configuration of thejovian magnetosphere, Geophys. Res. Lett., 1, 3.
Hones, E. W., Jr. (1984), Plasma sheet behavior during substorms, in Mag-netic Reconnection in Space and Laboratory Plasmas, AGU Geophys.Monograph Ser., Vol. 30, edited by E. W. Hones Jr., p. 178, AGU,Washington, D. C.
Jackman, C. M., C. T. Russell, D. J. Southwood, C. S. Arridge, N. Achilleos,and M. K. Dougherty (2007), Strong rapid dipolarizations in Saturn’smagnetotail: In situ evidence of reconnection, Geophys. Res. Lett., 34,L11203, doi:10.1029/2007GL029764.
Kivelson, M. G., and D. J. Southwood (2005), Dynamical consequences oftwo modes of centrifugal instability in Jupiter’s outer magnetosphere,J. Geophys. Res., 110, A12209, doi:10.1029/2005JA011176.
Krimigis, S. M., et al. (2005), Dynamics of Saturn’s magnetosphere fromMIMI during Cassini’s orbital insertion, Science, 307, 1270.
Kronberg, E. A., J. Woch, N. Krupp, A. Lagg, K. K. Khurana, and K.-H.Glassmeier (2005), Mass release at Jupiter: Substorm-like processes inthe Jovian magnetotail, J. Geophys. Res., 110, A03211, doi:10.1029/2004JA010777.
Mitchell, D.G., et al. (2005), Energetic ion acceleration in Saturn’s magne-totail: Substorms at Saturn?, Geophys. Res. Lett., 32, L20S01,doi:10.1029/2005GL022647.
Russell, C. T., and R. L. McPherron (1973), The magnetotail and sub-storms, Space Sci. Rev., 15, 205.
Russell, C. T., K. K. Khurana, D. E. Huddleston, and M. G. Kivelson(1998), Localized reconnection in the near Jovian magnetotail, Science,280, 1061.
Rymer, A. M., et al. (2007), Electron sources in Saturn’s magnetosphere,J. Geophys. Res., 112, A02201, doi:10.1029/2006JA012017.
Siscoe, G. L., D. G. Sibeck, J. A. Slavin, E. J. Smith, B. T. Tsurutani, andD. E. Jones (1984), ISEE 3 magnetic field observations in the magneto-tail: implications for reconnection, inMagnetic Reconnection in Space andLaboratory Plasmas, AGU Geophys. Monograph Ser., Vol. 30, edited byE. W. Hones Jr., p. 240, AGU, Washington, D. C.
Vasyliunas, V. M. (1980), Upper limit on the electric field along a magneticO line, J. Geophys. Res., 85, 4616.
Vasyliunas, V. M. (1983), Plasma distribution and flow, in Physics of theJovian Magnetosphere, edited by A. J. Dessler, chap. 11, p. 395, Cam-bridge Univ. Press, New York.
Young, D. T., et al. (2005), Composition and dynamics of plasma inSaturn’s magnetosphere, Science, 307, 1262.
�����������������������A. J. Coates and G. R. Lewis, Mullard Space Science Laboratory,
University College London, Surrey, UK.F. J. Crary and D. T. Young, Space Science and Engineering, Southwest
Research Institute, San Antonio, TX, USA.M. K. Dougherty and C. M. Jackman, Blackett Laboratory, Imperial
College, London, UK.M. G. Henderson, H. J. McAndrews, M. F. Thomsen, and R. L. Tokar,
Los Alamos National Laboratory, Los Alamos, NM, USA.T. W. Hill, Physics and Astronomy Department, Rice University,
BOX 1892, MS 108 6100 S. Main, Houston, TX, USA. ([email protected])D. G. Mitchell, Johns Hopkins University, Applied Physics Laboratory,
Laurel, MD, USA.C. T. Russell, Institute of Geophysics, University of California, Los
Angeles, CA, USA.
A01214 HILL ET AL.: PLASMOIDS IN SATURN’S MAGNETOTAIL
9 of 9
A01214