plasma leptin turnover rates in lean and obese zucker rats*
TRANSCRIPT

0013-72 27/98/$03.0010 VoL 139, No. 11 Endocrino logy Printed in U.S .A Copyright © 1998 by The Endocrin e Society
Plasma Leptin Turnover Rates in Lean and Obese Zucker Rats*
R. VILA, c. ADAN, 1. RAFECAS, J. A. FERNANDEZ-LOPEZ, X. REMESAR, AND
M. ALEMANY
Depar tament de Bioqu imi ca i Biologia Molecular, Facultat de Biologia, Universitat de Barcelona, 08028 Barcelona, Sp ai n
ABSTRACT mine the decay cu rve pa rameters from which the h alf-life of leptin Conscious female ad ult lean a nd obese Zu cker ra ts were injected (5.46 ::!: 0.23 mi n for lean rats a nd 6.99 ::!: 0.75 min for obese ra ts) a s
through the j ugul ar vein with radioactive iodine-labeled murine lep well as the size ofi ts circulating pool (32 pmol/kg for lean ra ts and 267 tin ; in the en su ing 8 min , four blood samples were sequ en ti a lly ex pmol/kg for obes e r ats) a nd the overall degradation r ate (96 fka t/kg tracted from the carot id artery. The sa mpl es were use d in a modified for lea n rats and 645 fkat/k g for obese rats) were es timated . The se RIA for lep ti n , in whic h pa ired tu bes received the sa me a mo un t of val ues are cons is tent with the hor monal ro le of lep tin and the ne ed eith er labeled or unl a beled le ptin , th us allowing us to estimate both for speed y ch anges in its levels in r espon se to m eta bolic cha llenge . lept in levels a nd s peci fic radioa ctivity . Th e dat a were used to deter- (Endocrinology 139: 4466-4469 , 1998 )
L EPTIN, the product of the ob gen e (1), is a key factor in the regula tion of bod y weight. Its precise ro le, how
ever, has been subject to open controve rsy and di scu ssion (2) desp ite earlier claims th at its main ro le was that of a pon dero stat signal, able in itself to modify the ene rgy pa rtition in some strains of ro den ts (3). A large amo un t of resea rch has been carried ou t to estab lish the functions of leptin (4, 5) since its di scovery in 1994 (1), bu t our knowled ge of its in vivo d ynamics is sketchy , in part because of methodological d ifficul ty and in pa rt because of the priority given to even tua l pharmaco log ical use an d the need to cha racterize the mech an ism s regulating its expression and signal ing role.
The kinet ic ana lysis of circ ulating horm ones is a goo d source of in format ion abo u t th e theoretical speed of resp onse to change as well as on the demand for syn thesis and / or de grada tion that the living or ganism devotes to the maintenance of a full y functiona l and resp on sive sys tem . Sho rt half-lives repr esent a high er ene rgy expenditure but allow for faster resp ons es and more immediate adaptati on ; lon ger turnover rates are usually correlated wi th longer term regulatory activity . Leptin turnover has been estimated in huma ns (ha lf-life of abo ut 25 min) (6) using arterio-ven ous diff erences and in mice (half-live s of 1.5-3 h) (7, 8) by measuring the de cay of circula ting label after the inject ion of labeled leptin.
Our me thod for the est im ation of circu la ting pepti de hormone turnove r rat es in vivo, w hich we have appl ied to insulin
Received March 18, 1998. Ad dress all correspondence and reques ts for rep rin ts to: Prof. Dr.
Maria Alemany , Depart ament de l3ioquimica i Biologi a Molecu lar, Facultat de Biologia, Universitat de Barcelona, Avin guda Diagonal 645, 08028 Barcelona , Spain . E-ma il: alemany@portho s.bio .ub. es.
* Thi s work w as supported by Labor atoris SALVAT, SA, as we ll as by grants from the CIRIT of the Government of Catalonia and the Plan Naci onal de Cienci a de los Alimentos (ALI96- 1094) of the Go vernment of Spa in. Wo rk was ca rried out within thb frame of the EC Network on Met aboli c Int eg ratio n an d Energ y Contr ol ERBCHRX-CT94-0490.
(9), has the advan tages that only the label in the imm unoreactive pe ptide horm on e is taken into account, an d all the measurem ents are performed in a single an imal.
We chose the hyperlep tinemic Zucker Jalfa rat, because of overexpressio n of the ob gene (10), to test w he ther this ove rexpression affects the turnover rate of leptin. The ma in objective, however, was to dete rmine the range of the half-life of circul ating lep tin to elucidate th e p redo mina nce of its short or long term metabolic actions.
Materials and Methods
Material s and animals
Pure recom bin ant m urine lepti n (Bio trend, Koln, German y) and 1251_ labeled murine lep tin (specific radioactivi ty, 69.2 GBql f.lmOl; Anawa, Zurich, Sw itzerland) were used. The labe led lep tin used ha s a chroma tog raphic pur ity of 98.6%.
Zucker lean (Fa/?) and obese (ja/ja) female ad ult ra ts, we ighing 224 ::!: 4 and 398 ::!: 19 g, respe ctively, bre d at the Animal Servic e of the Universi ty of Barce lona (Barcelona, Spain) from he tero zygous stock obtained from Cha rles River Labo rato ries, Inc. (Wilming ton, MA), we re used . The an im als wer e housed in ind ividual polypropylene-bottomed cages under s tandard cond itions (ligh ts on from 0800 - 2000 h; 22-23 C; 70-75% relative hum id ity), an d w ere fed stan dard chow pe llets (type A04, Panlab, Barcelona, Spain). A series of four rat s of each phenotyp e w as cann ulated, under eth yl ether anesthesia , in the left caro tid artery (bringing the tip of the cannu la jus t to the hear t) with P-50 and in the right jugular vein w ith p olO polye thy lene tubes (Clay-Ada ms, Pa rsip pany, NJ). The can nu las were filled w ith heparinized saline an d sealed ; they were th readed sc. exiting the ra t throu gh the back, wher e they were coiled an d held in pl ace w ith surgical tape. The rats we re used for the experimen ts 5 h late r. At the end of the expe rimen t, the rats we re killed by decap ita tion. This study was con d ucted in accord ance w ith Eu rope an Com munity p rinciples, guidelines, and p roce d ure s for an imal experimentation.
Lep tin turnover measurement
Th e experimen t w as beg un (6 h after the beginn ing of the ligh t cycle) by in jecting each rat (within 5-8 sec) th rou gh the jugul ar venous cann ula with 80 kBq (1.16 pmol) labe led lepti n in 0.2 ml isotonic saline solution. The rad ioactivity initially p resent (and th at remaining after the injection)
4466
4467LEPTIN TURNOVER IN OBESE RATS
in the sy ringe wa s me asured with a y-cou n ter. At timed in terval s of 1, 2, 5, an d 8 min, ali quots of 0.4 m l blood wer e ext racte d through the caro tid cannu la and stor ed a t 4 C in hepari nized plastic via ls. Th e blood sam ples w ere im mediate ly cen trifug ed a t 4 C to separate the pl asma sam ples, wh ich we re used directly fo r labeled leptin esti mation and leptin turnover acco rding to ou r metho d for insulin turnover (9) m od ified for us e w ith leptin. The rat was main tained cons ciou s and un aware of the mani pula tions (except for the uncoilin g of the cannulas), as it rema ined in its cage out of sight of the researchers through out the experiment.
Plasma lep tin levels wer e es tima ted usi ng a s tand ard RIA procedure (Linco Research, Inc., St . Charles, MO ) w ith so me m od ifica tions: ea ch plasma samp le w as distrib uted in two tubes; in the first, in ad d ition to the p,lasma sa mp le [100 p.l (lean) or 40 p.l (obesej], 100 -160 p.l buffer, 100 p.l t 51-la beled lep tin solu tio n cont aining 0.43 kBq (i.e. 6.25 frnol ), and 100 p.l diluted spe cific lep tin antibody (L inco Resear ch) w ere added . In the re ma ining tube, the p lasma samples [loa p.l (lean) or 40 p.l (obe se)] recei ved 100- 160 p.1b uffe r, 100 p.l u nlab ele d m urine lep tin (6.25 frn ol), and 100 p.l specific lept in antibody. Th us, the second tube fina lly contained the same am ount of lep tin as the first (the am ou nt initially p resent and that added were the same as those in the first tub e), but the amount of labeled lept in presen t in either was different; the second tu be lacked the added labeled lep tin used for the st and ard RIA procedure. Since the to tal am ount of lep tin wa s the sa me in both se ries of tu bes , the lab eled leptin initially present in plasm a bound in the same propor tion to the antibody pr ep aration; thus, the second tube cou ld be used as a b lank for the first as in a stand ard RIA procedure. Th is a llowed es tima tion of the ap parent leptin concentration regardless of the amoun t an d d ist ribut ion in molecular sp ecies of ra d ioacti v ity initially p resent in the pla sm a. This approach circu mve nted the problems posed by the presence of rad ioactive sources (lep tin an d other) in the samples. Th e RIA wa s com pleted wi th a series of standards of m urine lep tin , bla nks, and several tubes for the estima tio n of non specific bind ing. All me asuremen ts we re carried ou t in du p lica te for each an imal and time poi nt.
Calculations
The lept in label pr esent in a give n sa m ple of p lasma wa s es tima ted ass um ing tha t labeled lept in w as bo und by the antibod y in the same proportion as un labeled leptin from the sa me source. From the RIA d at a, a p lot of lept in bou nd to the an tibody us. the co ncentra tion of lepti n in the tube wa s d rawn using m urine leptin as a stan d ard . Th e da ta were fitted to an as ymmetric sigmoid cu rve u sin g the FiC- P program (Bio sof r, Cambrid ge, UK); the calculated paramet ers of the curve were used to estima te the pe rcen tage of lep tin bo u nd to each of the blood samples ob tained in the exper iment. Thi s percentage also reflected the proportion of lept in rad ioacti v ity bound to the an tibod y; th us, the total am ou nt of lepti n rad ioactivity, 1'" pe r m l blood at a given tim e, t, wa s est ab lish ed for each samp le. Th e 1', va lues were plotted agai nst time t a nd fitted to a stand ard decay graph us ing the FiC-P prog ram: r, = 1'0 X e- K x '". from which, K the deca y cons tant, and reY the ini tial radi oactivity per ml blood , were obtained . The half-li fe, t1 / 2, o f leptin wa s ca lcula ted from K, since t 1/ 2 = 1 IK.Th e ra tio of total ra d ioactivity injected, Ro l 1'0' wa s used to establ ish the vo lume, V, o f di stribution of the injected label (i.e. the vir tu al or pr act ical leptin space): V = Ral ro. The content of leptin was calcu late d from tot alleptin rad ioac tivity an d the sp ecific activit y of the labeled leptin injec ted . Injected leptin w as a ma xim um of 16% (lean ) to 1% (obese) of the tot al body lept in. As this proportion w as small, its inf luen ce on circula ting lep tin was minimal. The rat leptin concentration in plasma di d no t vary du ring the ex periment.Th e conce ntra tion 1IS. tim e graphs w ere used to obta in a mean Ieptin concen tra tion value, 1M , and to check whether ther e w ere significant va ria tions in lep tin co ncen tration. As we kn ew both the virtual d istribu tion volume and the concentra tions , we cou ld derive the whole ma ss of circul ating lep tin La a t time zero: Lo = 1M X V. Th e ra te of loss of leptin (ra te of degr ada tion, 0) from this circulating pool could be derived from the decay cu rve an d the mass of lept in : 0 = K x La. In deed, as the virtu al di st ribution vo lume, V, did not change, the lept in ma ss at a g iven tim e, L" can be es tima ted from the plasma concen tra tions, I" and the degrad atio n ra tes for di fferent tim es, 0" may be calcula ted . Th e va lues obta ined in all cases w ere ve ry simila r, beca use the cha nges in leptin concentration during the 8-min analys is w ere insignificant.
Th e loss of radioactivity from the labeled leptin pool was stud ied by
est ablishing the to tal le ptin label val u es, R" a t a given time fro m the rad ioac tivity per ml p lasma and the virtual volu me of distrib ution : R, = 1', X V.
Statis tica l compar ison be twe en groups wa s es tablished with st and ard ANOVA programs and Student' s t test.
Results
Plasma leptin levels w ere maintained within a ma ximal ran ge of varia tion of 6 ::'::: 2% (lean ) and 20 ::'::: 7% (obese) of the ini tial va lues in the time elapsed between the injection and the las t blood ext racti on. The signifi cances of the effect of time on leptin conce ntrations we re P = 0.968 (lean ) and P = 0.250 (obese ; by ANOVA).
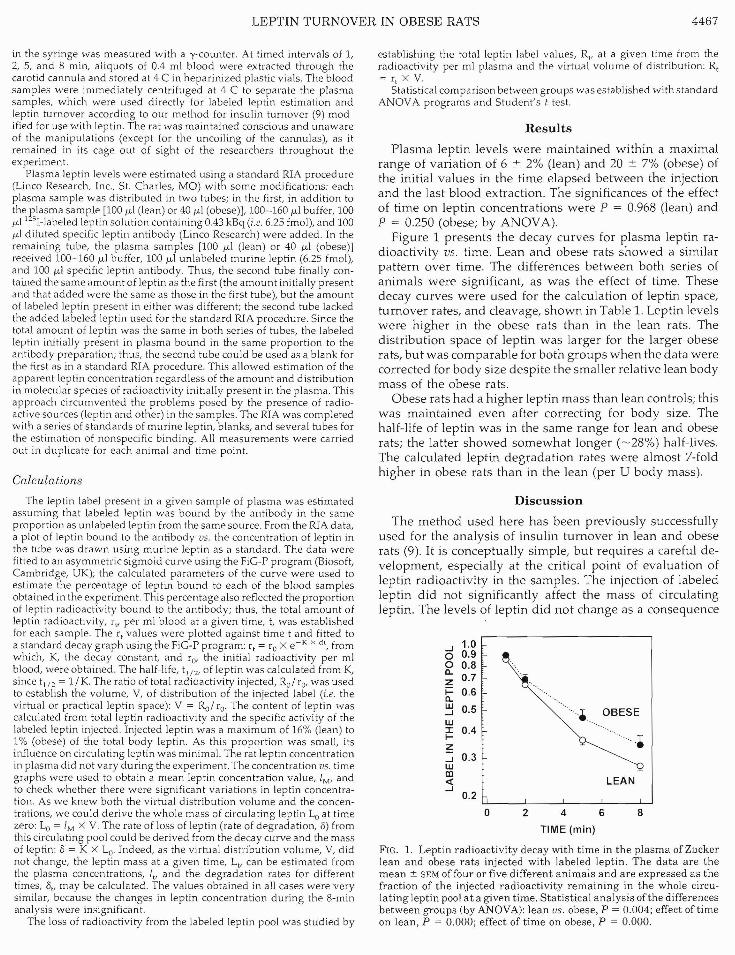
Figure 1 presents the decay curves for pl asma leptin radioactivity V5. time. Lean and obese ra ts sh owed a sim ilar pattern over time. The d ifferences bet we en both se ries of animals were sign ificant, as w as the effect of tim e. These decay curves were used for the calcula tio n of lept in space, tu rn over rates, an d cleavage, shown in Table 1. Leptin level s were high er in the obes e rats than in the lean ra ts . The d istribution space of leptin was lar ger for the larger obese rats, but w as com parab le for both gr oups w he n the data were corrected for bod y size despite the smaller re lative lean bod y mass of the obese rats.
Obese ra ts had a high er leptin mass than lean con tro ls; th is wa s maintained even after correcting for bo dy size. The half-life of leptin w as in the same ran ge for lean and obese rats; the latter sho wed some wha t lon ger ( ~ 28 %) half-li ves. The calculated lepti n degradation ra tes w ere almost 7-fold higher in obese rats tha n in the lean (pe r U bod y ma ss).
Discussion
The m ethod used here has been previously successfully used for the an alysi s of insulin turnover in lean and obese rats (9). It is con ceptually simple, bu t requires a careful de velopmen t, especially at the cri tica l point of eva luation of lep tin rad ioacti vity in the samples . The injection of lab eled lep tin did not sig nifican tly a ffect the mass of circulat ing leptin . The level s of leptin d id not change as a consequence
..J 0
1.0 0.9
0 0.8 0
z 0.7 i= 0 .6 0UJ ..J 0.5 ....•. OBESE UJ :I: t
~ ..J
0.4
0.3
' .
•••• UJ III <! LEAN ..J
0.2
0 2 4 6 8
TIME (min)
F IG. 1. Leptin radioac tivity decay with t ime in t he plasma of Zucker lean a nd obes e rats injected wit h lab el ed lep t in . Th e data a re the m ean z SEM offour or five different an imals and are expresse d a s th e fract ion of the injected ra dioa ct ivi ty re main in g in t he whole circ ula t in g lep tin pool a t a given time. S ta tistical analys is of the differ en ces between groups (by ANOVA): lean us. obese, P = 0.004; effect of t ime on lean , P = 0.000; effect of time on obese , P = 0.000.

End o e 1998 4468 LEPTI N TURN OVER IN OBESE RATS Vol 139 • Nu 11
TABLE 1. Comp arison of injected labeled leptin turn over in conscious lean and obese Zucker rat s
Parameter Units Lean rats P" Obese rats Obese/lean ratio
Plasma leptin nM 0.4 2 :!: 0.04 < 0.05 3.35 :: 0.23 7.98 Lep tin virt ual vol of ml 16 .88 :: 1.55 < 0.05 31.57 :': 2.21 1.87
distribution % ofBW 7.49 :: 0.56 NS 7.9 2 ::: 0 .29 1.06 Leptin pool mas s pmo l 7.17 :!: 1.32 0.05 107 :: 13 14.9
pmol/k g BW 31.7 :!: 5.4 0.05 267 :: 23 8.41 Leptin t'h min 5.46 :!: 0.23 NS 6.99 :: 0.75 1.28 Rate of leptin remo val/synthesis fkat 21.5 .,. 3. 1 < 0.05 259 ± 32 12.0
fkat/kg BW 95 .5 :!: 12.4 < 0.05 645 :!: 51 6.76
The data are th e mean:!: SEM of four or five animals in each gro up . See Materia ls and Methods for th e calculations and derived ma gnitudes. a Significan ce of the differences between lean a nd obese groups was determined by Student's t test. NS . P > 0.05 .
of the injection of labeled lep tin and rem ained u niform in all of the blood extractio ns. An additiona l advantage of th is me thod was its use of rela tively undisturbed animals.
A cri tica l point in the investigatio n of lep tin cleavage is the ass ignment of radioactivity measurements to intact (i.e. functional) leptin, without in terference by free iod ine or other labeled pep tid e fra gments eventua lly freed by the cleavage of leptin. Leptin tu rnover es timations calcu lated from the decay of label in the blood (7,8) tend to give longer half-lives. The met hod used here is not affected by th is interfe re nce , as only the label bo und to lep tin is measured; free iodine and labeled peptides are removed d uring the RIA proced ure . Only lab eled (com p lete) lep tin is bound to the an tibody, an d thus only this rad ioactive molecu lar species is taken into account.
The main difficu lty th at may ari se from a st udy based on calcula ted constants taken from calcu lated values an d used to derive the final results is a cumula tive effect o f residua ls in calculat ions, which m ay lead to err ors. This st udy has been de signed to m in im ize th is effec t. The adequacy of decay curve fitting is app aren t in Fig. 1, wh ich shows the loss of radioactive lep tin in plasma. The low d ispersion of da ta suggests an acceptab le degree of precision in the deriva tion of the virtua l vo lume of diffusion and decay rates shown in Tabl e 1.
The vi rtual vo lum e of d ist ribution of lep tin derived fro m data of ar terial blo od may no t be real, beca use we do not know whether the leptin levels are rep resenta tive; nevertheless, the data are useful and admi t comparison between differen t animals and situa tions. The lept in pool size, L, is more reliable, because it is derived d irectly from decay curves and lep tin levels . Leptin pool size w as much higher in obese th an in lean rats bo th in absolute terms and in relation to body weight; in the latter case, th e d ifferences dimi nis hed, p robably because of th e d ilu tion effect of th e large fat mass in obese rats. Th e relative unifo rm ity of the v irtua l volume of dis tribution vs. body weight in lea n and obese rats suggested th at the dis trib u tions of lep tin are comparable in lean and fat tissu es. As a consequ en ce, the compa risons between both groups were directly referred to body size to establish comparisons despite their different body weights .
The turnover ra tes found here are much shorter than those found in normal mice (3 h ) (7) or in db/db and ob/ob mice (1.5 h) (8) calculat ed from label decay curves, and they are also shor ter than th ose estimated in humans from ar ter io-venous differences (25 min) (6). These di fferences m ay be a con se
quence of th e me tho d ology applied; in our case , the circulating lev els of lep tin were no t m odified, and only leptin label was taken into acco unt. The timing of sam p le extraction w as also in the range of th e measured turnover, w hich gave higher precision to our estimat ions.
The Zucker fa/fa rats ar e hyperlept inemic, but this lep tin is inoperative because they lack a functional hypothalamic leptin recep tor (10, 11). Thi s deficiency has been postulated as th e cause of their obesity, becau se it de p rives the ra t of a key eleme nt in the contro l of energy pa r tition (12). The white adipose tissue of fa/fa ra ts overexpresses the ob ge ne, thus inducing m assive sy nthesis of lep tin (10). Th e syn thesis of lep tin in Zucker obese rats is further enhanced by their large fat mass, as lep tin production has been fou nd to be related to ad ip ose tiss ue mass in humans and rodents (13, 14). However, the half- life of lep tin is in a similar range in lean and obese rats; the latter show a mere 28% h igh er mean rate. As the lep tin pool size is much larger in the obese ra ts, the main tenance of similar tu rnover rates im plies a more ac tive degrading process in these animals than in the con trols. We have no clear idea where th is lep tin is de gr aded . Some reports suggest that the kidney plays a significant role in th e clearan ce of exce ss lep tin fro m the blood (15, 16). Lean and obese Zucker rats do not show different kidney blood flows (our unpublished res ults) , but the m uch higher concentration of leptin in the bloo d of th e obese rats m ay be a key factor facilita ting its removal; th e mean ratio of pl asm a concentrations (obese/lean) is 4.12, and that of the pool removal rates is 6.17 (3.49 when corrected fo r body size ).
As th e levels of lept in in un d isturbed anima ls are un iform, it may be assumed that the removal ra te is essen tia lly iden tical to the syn thes is rate of lep tin . This means that a 225-g lea n rat sy nthesizes (and d egrades) about 30 p.,g lep tin/ day (i.e. 260-fold the wh ole bo dy lept in mass), mu ch less (a mere 8%) than th at of a 400-g obese rat (358 p.,g / day, i.e. 210-fold th e leptin mass).
The d ifferences bet ween lean and obese rat s found fo r leptin were fairly similar to tho se for insulin in this same anim al model of obes ity . Zucker fa/fa rats are hyperinsulinem ic (17) and show insulin turnover rates similar to those of con trols (9). The range of t}/ 2 was also similar be tween leptin and ins ulin (only a few minutes) . This va lue is consis ten t wi th the ho rmonal ro le of lept in and th e eventual need for speedy changes in its levels as a response to metabolic cha llenge, such as th at fou nd und er starvation (18), d iet (19, 20), or hormonal manipu lation (21), an d may help explain the ultradian rhythms of thi s horm one (22).
LEPTIN TURNOVER IN OBESE RATS 4469
Ac knowle dgment
Thanks are given to Robin Rycroft from the Lan gua ge Advisory Service at the University of Barcelona fo r correc tion of the text .
References
I. Zh ang Y, Proe nca R, Ma ffe i M, Barone M, Leopold L, Friedman JM 1994 . Posit iona l clon ing of the mouse obese gen e and its hum an homologue . Nature 372:425-431
2. Wurtman RJ 1996 Wha t is lept in for, and doe s it act on the brain? Nat Med 2:492-493
3. Ha laas JL, Gaj iwala KS, Ma ffei M, Cohen SL, Chait BT, Rabinowitz 0 , Lallone RL, Burley SK, Fri ..dman JM 1995 Weight-red ucing effects of the plasm a protein enco de d by the obese gen e. Science 269:543-546
4. FIier JS, Elmquist JK 1997 Energeti c pursui t of lepti n fu nction . Nat Biotechn ol 15:20-21
5. Remesar X, Raf ecas I, Ferna nd ez-Lopez JA, Alemany M 1997 Leptin. Med Res Rev 17:225-234
6. KIein S, Coppack SW, Mc hamed-Ali V, Landt M 1996 Adipose tissu e lept in production and plas ma leptin kinetics in hum an s. Diabetes 45:984- 987
7. Ahima RS, Pra ba kara n 0 , Man tzoros CS, Qu 0 , Lowe ll B, Mar alos-Flier E, Flier JS 1996 Role of leptin in the neuroend ocrine resp onse to fastin g. Natu re 382:250-2 52
8. Van Heek M, Mullins DE, Wi rth MA , Graziano MP, Fawzi AB, Co mp ton DS, France CF, Hoos LM, Casal .. RL, Syb er tz EJ, St rad er CD , Davis HR 1996 The relationsh ip of tissue localiza tion, d istribu tion and tu rnove r to feedi ng after in tra peri tonea l l Pl-lepti n adm inis trat ion to oblob and dbldb mice. Horrn Metab Res 28:653- 658
9. Can as C, Fernandez-Lop ez JA, Ardevcl A, Ada n C, Est eve M, Rafec as I, Reme sa r X, AIemany M 1995 Rat insu lin tu rnover in vivo. Endocrinology 136:3871-3876
10. Chua SC, Chung WK, Wu-Peng XS, Zhang Y, Liu SM, Tartaglia L, Leib el RL 1996 Phe notypes of mo use diabetes and rat fatty due to mutations in the OB (Ieptin) receptor. Science 271:994-996
11. Iida M, Murakami T, Ishida K, Mizuno A, Kuwajima M, Shima K 1996 Phenoty pe-link ed amino acid altera tion in lep tin receptor eDNA fro m Zucker fat ty ifalfa) rat. Biochem Bioph ys Res Commun 222:19-26
12. Hamann A, Ma tthaei S 1996 Reg ulation of ene rgy balance by lep tin. Exp Clin Endocrinol Diab 104:293-300
13. Maffei M, Halaas], Ravu ssin E, Pralley RE, Lee GH , Zhang Y, Fei H, Kim S, Lallone R, Ran ganathan S, Kern PA, Friedman JM 1995 Lep tin levels in hu man and roden t: measur emen t of plas ma !ep tin and Db RN A in obes e and weight-reduced subjects. Nat Med 1:1155-1161
14. Con sidine RV, Sinha MK, Heiman ML, Kriauciunas A, S tephens TW, Nyce MR, Ohannesian JP, Marco CC, McKe e LJ, Bau er TL, Caro JF 1996 Serum im mu nor eactive leptin conce ntratio ns in normal-weight and obese huma ns . N Engl J Med 334:292- 295
15. Cu min F, Baum H-P, Levens N 1996 Lep tin is cleared from the circula tion pri ma rily by the kidney . In t J Obes 20:1120-112 6
16. Sha rma K, Co nsidine RV, Michael B, D unn SR, Weisb erg LS, Kurnik BR, Kurnik PB, O'Connor J, Sinha M, Caro JF 1997 Plasma lept in is partly cleared by the kid ney and is elev ated in hem od ialysis pat ients . Kidn ey Int 51:1980-1 985
17. Bray GA 1977 The Zucker fat ty ra t: a review . Fed Proc 36:148 - 153 18. Ha rdie LJ, Rayner DV, Ho lm es S, Tr ayh urn P 1996 Circu lating lept in levels
are modulared by fastin g, cold expos ure and insulin admini stration in lean but no t Zuc ker ifalfa) rat s as measured by ELISA. Biochern Biophy s Res Commun 223:660- 665
19. Masuzaki H, Ogawa Y, Hosoda K, Ka wada T, Fush iki T, Nakao K 1995 Augmented expre ss ion of the obese ge ne in the ad ipose tissue from ra ts fed high-fa l di e t. Biochem Biophys Res Com mu n 216:355- 358
20. Schrauwen P, Lichtenb e1t WDV , Westerterp KR, Sari s WHM 1997 Effect of compo sition on leplin con centration in lean subjects. Meta bolism 46:420- 424
21. Dagogo-Jack S, Selke G, Melso n AK, Newcomer JW 1997 Rob us t lept in sec retory responses to dexameth asone in obese subjects. J Clin Endocrinol Metab 82:3230-3233
22. Sinha MK, Ohannesian JP, Heiman ML, Kriauciunas A, Steph ens TW, Magosin S, Marco C, Caro JF 1996 Noc turnal rise of leptin in lean, obese, and non-insu lin-dep en de nt d iabet es me llitus subjects. J Clin Invest 97:1344-134 7