plant-originated glycoprotein (24 kda) has an inhibitory effect on proliferation of bnl cl.2 cells...
TRANSCRIPT

Plant‐originated glycoprotein (24 kDa) has an inhibitory effecton proliferation of BNL CL.2 cells in response todi(2‐ethylhexyl)phthalate
Jin Lee1 and Kye‐Taek Lim2*1Molecular Biochemistry Laboratory, Biotechnology Research Institute and Center for the Control of Animal Hazards Using Biotechnology(BK21), Chonnam National University, Gwangju, South Korea2Molecular Biochemistry Laboratory, Biotechnology Research Institute, Chonnam National University, Gwangju, South Korea
Di(2‐ethylhexyl)phthalate (DEHP) is one of the many environmental chemicals that are widely used in polyvinyl chloride products, vinylflooring, food packaging and infant toys. They cause cell proliferation or dysfunction of human liver. The purpose of this study is toinvestigate the inhibitory effect of a glycoprotein (24 kDa) isolated from Zanthoxylum piperitum DC (ZPDC) on proliferation of liver cell inthe DEHP‐induced BNL CL. 2 cells. [3H]‐thymidine incorporation, intracellular reactive oxygen species (ROS), intracellular Ca2+
mobilization and activity of protein kinase C (PKC) were measured using radioactivity and fluorescence method respectively. The expressionof mitogen‐activated protein kinases [extracellular signal‐regulated kinase (ERK) and c‐Jun N‐terminal kinase (JNK)], activator protein(AP)‐1 (c‐Jun and c‐Fos), proliferating cell nuclear antigen (PCNA) and cell cycle‐related factors (cyclin D1/cyclin‐dependent kinase [CDK]4) were evaluated using Western blotting or electrophoretic mobility shift assay. The results in this study showed that the levels of [3H]‐thymidine incorporation, intracellular ROS, intracellular Ca2+ mobilization and activity of PKCα were inhibited by ZPDC glycoprotein(100 µg/ml) in the DEHP‐induced BNL CL. 2 cells. Also, activities of ERK, JNK and AP‐1 were reduced by ZPDC glycoprotein (100 µg/ml). With regard to cell proliferation, activities of PCNA and cyclin D1/CDK4 were significantly suppressed at treatment with ZPDCglycoprotein (100 µg/ml) in the presence of DEHP. Taken together, these findings suggest that ZPDC glycoprotein significantly normalizedactivities of PCNA and cyclin D1/CDK4, which relate to cell proliferation factors. Thus, ZPDC glycoprotein appears to be one of thecompounds derived from natural products that are able to inhibit cell proliferation in the phthalate‐induced BNL CL. 2 cells. Copyright ©2011 John Wiley & Sons, Ltd.
key words—ZPDC glycoprotein (24 kDa); DEHP; [3H]‐thymidine incorporation; ERK; JNK; PCNA; cyclin D1/CDK4
INTRODUCTION
Phthalates are synthetic chemicals that act as estrogen‐mimicking hormone in the environment. They can bereadily detected in plastic materials used to cover foodsand polyvinyl chloride (PVC) plastic polymers to increasethe flexibility of finished products.1,2 Especially, Di(2‐ethylhexyl)phthalate (DEHP) is one of the many environ-mental chemicals that are widely used in PVC products,vinyl flooring, wall coverings, food packaging and infanttoys. Such chemicals can be absorbed by humans andanimals through various routes such as ingestion, inhalationor dermal contact. It has been reported that DEHP inducesdevelopmental, cell proliferative, and reproductive toxicityin mammals3 and is closely related to liver, ovarian andtesticular cancer.4 Liver is the most important and major
organ for nutrition metabolism. Also, it is the organ that isinitially damaged by toxic substances, xenobiotics andenvironmental hormones.Intracellular Ca2+ may act as a secondary messenger in cell
proliferation and carcinogenesis via the activation of proteinkinase and transcriptional factors.5 Protein kinase C (PKC) isone of the sensitive targets for ROS and is activated byintracellular Ca2+ in cell proliferation and tumor promotion.6 Ithas been reported that PKCα (classic group) among the PKCisoforms is activated by a variety of stimuli that originatedfrom physiological stresses. When PKC is activated, it istranslocated from cytosol to specialized cellular compart-ments.7 The activated PKCα subsequently transfers the signalto extracellular signal‐regulated kinase (ERK) and c‐Jun N‐terminal kinase (JNK) in the mitogen‐activated protein kinase(MAPK) pathways.7 MAPK is one of the signal‐relatedproteins that is activated by serine/threonine kinases andtransfers the signals to expression of the mitotic gene in thenucleus. Also, the activated MAPK is well known tocontribute to cell proliferation and carcinogenesis.8,9
* Correspondence to: Kye‐Taek Lim, Molecular Biochemistry Labora-tory, Biotechnology Research Institute, Chonnam National University,300 Yongbong‐Dong, Gwangju 500‐757, South Korea. E‐mail:[email protected]
Received 18 January 2011Revised 28 April 2011Accepted 3 June 2011Copyright © 2011 John Wiley & Sons, Ltd.
cell biochemistry and functionCell Biochem Funct 2011; 29: 496–505.Published online 1 July 2011 in Wiley Online Library(wileyonlinelibrary.com) DOI: 10.1002/cbf.1777
One of the transcriptional factors, activator protein (AP)‐1 is a redox‐sensitive oncogenic protein and controlsexpression of cell growth mediators. It consists of Jun/Fosproteins10 and is associated with malignant transformation,tumor promotion and carcinogenic development.11 In thecell proliferation, proliferating cell nuclear antigen (PCNA)and cell cycle factor for G0/G1 are very important signals.PCNA is one of the principal and indicative markers forcell proliferation. It is a nuclear protein that plays a criticalrole in cell proliferation, DNA repair and cell cyclecontrol.12 On the other hand, cyclin D1/CDK4 is one ofthe key regulatory factors in the transition of cell cyclephase from G1 to S phase in a variety of cell types.
To find natural compounds is a good strategy forprevention of damage or for healing of the liver tissuesdamaged/injured by exogenous chemicals, because naturalcompounds have less cytotoxicity and adverse effects than inthe artificial synthetic drugs.13 Zanthoxylum piperitum DC(ZPDC) has traditionally been used as a spice to produce afresh flavor as an ingredient of some spice mixes or tosuppress unpleasant fishy and meaty odor.14 It has been alsoused for a long time to heal vomiting, diarrhea andabdominal pain in Korea.15 Recently, it has been reportedthat crude extract isolated from ZPDC leaves or seeds haspharmacological activities such as antioxidative and hepato-protective effects.16 Recently, we isolated a glycoprotein(24 kDa) from the ZPDC fruit, which consists of acarbohydrate moiety (18%) and a protein moiety (82%).We previously reported that the glycoprotein has strongcharacteristics associated with antioxidative, cytoprotectiveand anti‐inflammatory activities.16 From these concepts, weassumed that ZPDC might contain functional substance withmultiple biological activities. However, it has yet to bedetermined whether or not the ZPDC glycoprotein inhibitsthe liver proliferation induced by DEHP.
Therefore, the purpose of this study is to investigate theinhibitory effect of a glycoprotein (ZPDC glycoprotein,24 kDa) isolated from ZPDC on proliferation of liver cell inthe DEHP‐induced BNL CL. 2 cells. [3H]‐thymidineincorporation, intracellular Ca2+ mobilization and activityof PKC were measured using radioactivity and fluorescencemethod, respectively. The expression of ERK and JNK, andAP‐1 (c‐Jun and c‐Fos), PCNA (cell proliferation marker)and cyclin D1/CDK4 were evaluated using Western blottingor electrophoretic mobility shift assay (EMSA).
MATERIALS AND METHODS
Chemicals
All the plastic materials used in this study were purchasedfrom Falcon Labware (Becton‐Dickinson, Franklin Lakes,NJ, USA). DEHP, penicillin and streptomycin wereacquired from Sigma (St Louis, MO, USA). Dulbecco’smodified essential medium (DMEM) and fetal bovine serum(FBS) were purchased from Gibco BRL (Grand Island, NY,USA). All other chemicals and reagents were of the highestavailable analytical grade.
Preparation of ZPDC glycoprotein
Fruits of ZPDCwere obtained in October 2006 fromNa‐Ju inthe Chonnam province of South Korea, and glycoprotein wasisolated and purified as described previously.16 The ZPDCwas cut into small pieces and soaked in 99% ethanol at 4 °Cfor 3months in a dark basement. The extract was filteredthrough Whatman filter paper (No. 2), and then evaporationwas performed to remove the 99% ethanol using a rotaryevaporator (B465; Buchi, Flawil, Switzerland). After theevaporation of ethanol, the remaining solution was dried witha freeze dryer (SFDS06; Sam won, Seoul, Korea) to make afine powder. The dried powder (5 g) was redissolved indistilled water and precipitated with 80% ammonium sulfateto obtain a protein. Following these steps, this sample wasdialyzed with membrane (MWCO 6000–8000) to obtainprotein with a molecular weight of more than 8 kDa and thencentrifuged with a Microcon (MWCO 30,000; Millipore,Bedford, MA, USA) according to the manufacturer’sprotocol (Amicon Inc., MA, USA). The final amount ofZPDC glycoprotein was 3·5mg (0·07%) from the initialamount (5 g) of dried ZPDC powder. To characterize thesample, SDS‐PAGE was carried out loading the sample ofprotein (1mg/10 µl) containing 0·1% SDS, using an 18%polyacrylamide mini‐gel and Mini‐PROTEIN II electropho-resis cell (Bio‐Rad) at 110V, 30mA for 2·5 h. The ZPDCglycoprotein on the gel was stained with Schiff’s reagent,17
which is a specific staining reagent for glycoprotein through aredox‐reaction. The sample of glycoprotein on the gelrevealed one band with 24 kDa, consisting of carbohydratecontent (18%) and protein content (82%).16
Cell culture and [3H]‐thymidine incorporation
BNLCL.2 cells (murine embryonic liver cell) were incubatedin DMEM containing 10% FBS, 100 U/ml penicillin and100mg/ml of streptomycin at 37 °C, under an atmosphere of5% CO2. The cells (1 × 10⁶ cells/ml) were divided into 96‐well flat bottom plates. The experiments assessing the level of[3H]‐thymidine incorporation were conducted as describedby Gabelman and Emerman.18 After the indicated incubationperiod, 1 μCi of [methyl‐3H] thymidine was added to thecultures. Incubation with [3H]‐thymidine continued for 5 h at37 °C. The cells were washed twice with PBS, fixed for15min in 10% trichloroacetic acid (TCA) at 23 °C and thenwashed twice in 5% TCA. The acid‐insoluble material wasdissolved for 12 h in 2N NaOH at 23 °C. The aliquots wereremoved to assess the radioactivity using a liquid scintillationcounter (LS 6500; Beckman Instruments, Fullerton, CA,USA). All experiments were conducted in triplicate, and thevalues were converted from absolute counts to a fold of thecontrol to compare the results between experiments.
Lactate dehydrogenase assay
The cellular cytotoxicity was also determined by assessingthe release of lactate dehydrogenase (LDH) into the mediumaccording to the method of Bergmeyer and Bernt.19 Cellswere treated with various concentrations of DEHP for an
497zpdc glycoprotein inhibits cell proliferation
Copyright © 2011 John Wiley & Sons, Ltd. Cell Biochem Funct 2011; 29: 496–505.
indicated time. After incubation, the culture medium (35 µl)was mixed with reaction mixture containing 0·6mMpyruvate in 48mM potassium phosphate buffer (pH 7·5),and the final volume of the reaction mixture was brought upto 3·15ml. The reaction was initiated by the addition of0·18mM β‐NADH (reduced nicotinamide adenine dinucleo-tide), and LDH activity was measured as the rate of loss ofβ‐NADH absorption at 340 nm for 2min. The cells weretreated with Triton X‐100 (1%) for 30min and centrifugedat 1000 × g for 10min. The resulting supernatants wereadded to the reaction mixtures, and LDH release wasmeasured at 340 nm using a SpectraCount™ (PackardInstrument Co., Downers Grove, IL, USA). It notes thatTriton X‐100 (1%) treatment is used as an internal control inLDH assay. After that, the measured data are calculated bycomparison with Triton X‐100 treatment, and the amount ofreleasing LDH was represented as the relative percentage tothe control, which means the supernatant without treatment,neither with ZPDC glycoprotein nor DEHP.
Determination of intracellular ROS
The intracellular ROS was measured using a nonfluorescentdye, 2′,7′‐dichlorodihydrofluorescein (H2DCF‐DA), which isa membrane‐permeable fluorogenic tracer that is oxidized byvarious species of ROS. The dye is deacetylated byintracellular esterases to nonfluorescent 2′,7′‐dichlorohydro-fluorescein (DCFH), which is oxidized to the fluorescentcompound 2′,7′‐dichlorofluorescein (DCF) by ROS. Thecells were pre‐incubatedwith 10 μMH2DCF‐DA for 30min at37 °C and then washed twice with PBS to remove theextracellular H2DCF‐DA. After that, the cells were treatedwith DEHP (100 μM) for the indicated time or cotreated withZPDCglycoprotein (25–100µg/ml) in the presence of 100 μMDEHP for 30min. Finally, the fluorescence intensity wasmeasured at an excitation of 485 nm and an emission of530 nmusing a fluorescencemicroplate reader (Dual ScanningSPECTRAmax; Molecular Devices Corporation, Sunnyvale,CA, USA). The values were calculated as the relative intensityof DCF fluorescence compared with the control.
Detection of intracellular Ca2+ mobilization
Determination of intracellular Ca2+ was performed asdescribed previously.20 In brief, cells were rinsed with abath solution [140mM NaCl, 5mM KCl, 1mM CaCl2,0·5 mM MgCl2, 10mM glucose, 5·5 mM 4‐(2‐hydro-xyethyl)‐1‐piperazineethanesulfonic acid (HEPES), pH7·5] and then pre‐incubated in a bath solution containing1 μM Fura‐2/AM (Molecular Probes, Eugene, OR, USA)with 5% CO2 at 37 °C for 45min and shaken gently. Aftershaking, cells were treated with ZPDC glycoprotein (25–100 µg/ml), DEHP (100 μM) and A23187 (1 μM) as apositive control. Fluorescence intensity was measured at anemission wavelength of 510 nm and an excitation wave-length of 340 and 380 nm using a fluorescence microplatereader (Dual Scanning SPECTRAmax; Molecular DevicesCorporation). The fluorescence ratio (340/380) was calcu-lated as an indicator of intracellular Ca2+ intensity.
Preparations of membrane, cytosolic, nucleic and wholeprotein extracts
To detect the translocation of PKC, membrane and cytosolicextracts were prepared according to Patton’s method.21 Inbrief, the BNL CL.2 cells were rinsed twice with PBS afterremoving the medium and scraped in 300 µl of buffer A(20mM Tris–HCl, pH 7·5, 0·25M sucrose, 2mM EDTAand 2mM EGTA) containing a protease inhibitor cocktail(Boehringer, Mannheim, Germany). The cells were soni-cated and centrifuged for 1 h at 10 000 × g to sediment allmembranes and the insoluble cytoskeletal components. Thesupernatant was designated as the cytosolic fraction. Themembrane proteins in the pellet were extracted with bufferB (20mM Tris–HCl, pH 7·5, 1% NP‐40, 150mM NaCl,1mM EGTA and 1mM EDTA) containing a proteaseinhibitor cocktail (Boehringer) on ice for 30min andcentrifuged for 15 min at 100 000 × g at 4 °C. Thesupernatant was saved as a detergent‐soluble membranefraction. On the other hand, either nucleic protein extract forthe immunoblotting of AP‐1 (c‐Jun and c‐Fos) and PCNAor whole cellular protein extract for the immunoblotting ofERK and JNK was isolated from BNL CL.2 cells aspreviously described.22 The amount of protein wasmeasured via the method developed by Lowry et al.,23
and the cellular proteins were stored at −70 °C before use.
Western blot analysis
Intracellular protein extracts were separated via 10% to 12%polyacrylamide mini‐gel electrophoresis at 100V for 2 h atroom temperature using a Mini‐Protein II electrophoresiscell (Bio‐Rad). After electrophoresis, the proteins weretransferred onto nitrocellulose membranes (Millipore). Thetransferred membranes were then incubated for 1 h at roomtemperature in Tris‐Buffered Saline‐Tween‐20 (TBS-T)solution [10mM Tris–HCl (pH 7·6), 150mM NaCl and0·1% (v/v) Tween‐20] containing 5% nonfat dry milk. Themembranes were subsequently incubated for 2 h at roomtemperature with rabbit polyclonal antibodies [PKCα, ERK,phosphor‐ERK, JNK and phospho‐JNK (Cell SignalingTechnology, Beverly, MA, USA) and α‐tubulin, c‐Jun, c‐Fos and PCNA (Santa Cruz Biotechnology, Santa Cruz, CA,USA)] in TBS‐T solution. After three washes with TBS‐T,the membranes were incubated for 1 h at room temperaturewith horseradish peroxidase‐conjugated goat anti‐rabbit IgG(1:10 000; Cell Signaling Technology) in TBS‐T. The proteinbands were visualized via enhanced chemiluminescence(Amersham Pharmacia Biotech, England, UK). The results ofthe immunoblot assay were calculated using Scion imagingsoftware (Scion Image Beta 4.02, Frederick, USA) todetermine the relative intensity.
Electrophoretic mobility shift assay
To construct the double‐stranded oligonucleotide, bothstrands of oligonucleotide for AP‐1 (5′‐TTCCGGCTGACC-TCATCAAGCG‐3′) were annealed in TE buffer (10mMTris–HCl and 1mM EDTA, pH 8·0) by 10 min of heating at
498 j. lee and k.‐t. lim
Copyright © 2011 John Wiley & Sons, Ltd. Cell Biochem Funct 2011; 29: 496–505.
94 °C. For the probing of AP‐1 double‐stranded oligonucleo-tide, they were labeled with [γ‐32P]dATP (0·25 mCi,Amersham Pharmacia Biotech, Buckinghamshire, UK)by T4 polynucleotide kinase and purified on a QIAquick® Nucleotide Removal Kit in accordance with themanufacturer’s recommended protocols (LRS LaboratoryInc., QIAGENDistributor, Seoul, Korea). The DNA–proteinbinding reaction was conducted via incubation of the AP‐1probe and 10 µg of nuclear protein extracts and 0·5 µg/mlpoly dI/dC (Sigma Chemical Co.) in a binding buffer [0·2MDithiothreitol (DTT), 20mg/ml BSA, buffer A (20mMHEPES, 20% glycerol, 100mMKCl, 0·5mM EDTA, 0·25%NP‐40), buffer D (20% Ficoll 400, 100mMHEPES, 300mMKCl)] at room temperature for 1–2 h. The DNA–proteincomplexes were resolved via the application of 6%nondenaturing polyacrylamide gel in 0·5 × Tris/Borate/EDTA (TBE; 45mM Tris‐borate, 1mM EDTA). Electro-phoresis was conducted for 3 h at 200V in a cold room. Thegels were then dried on Whatman filter paper and exposedovernight to X‐ray film at −70 °C.
Statistical analysis
All experiments were conducted in triplicate, and the dataare expressed as means ± SE. One‐way ANOVA andDuncan’s test were conducted to determine significantdifferences among multiple comparisons (Statistical Pack-age of the Social Sciences program, version 11.0).
RESULTS
Inhibitory effect of ZPDC glycoprotein on [3H]‐thymidineincorporation in DEHP‐induced BNL CL.2 cells
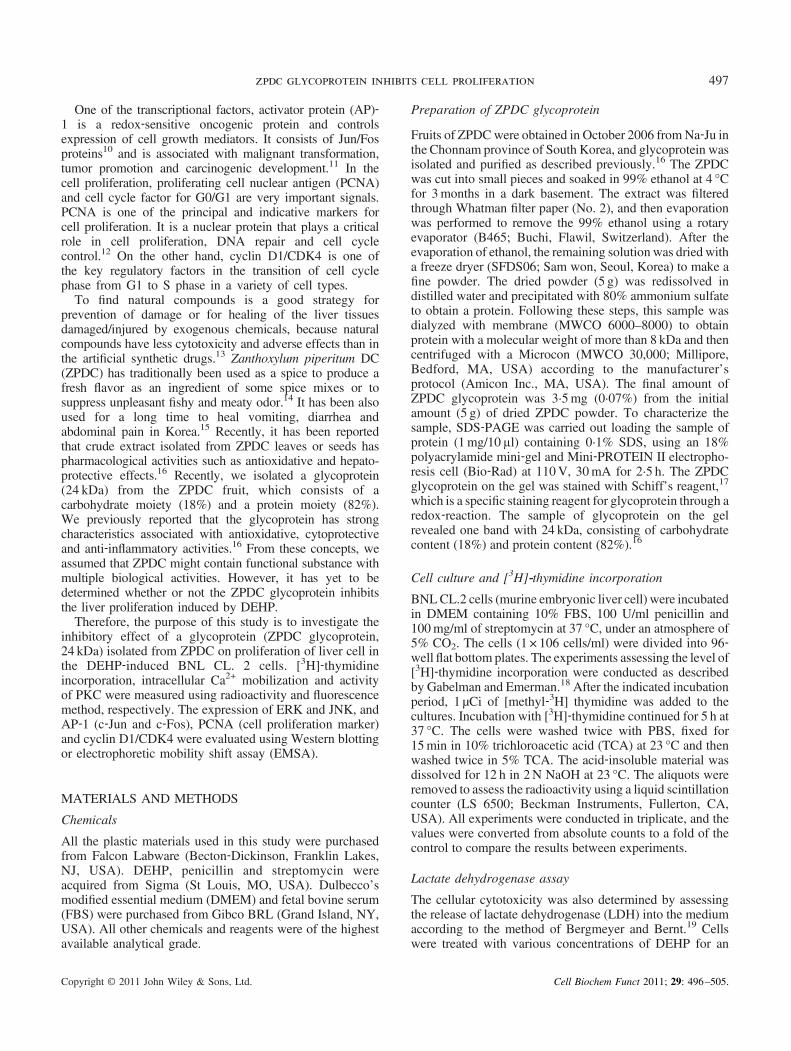
BNL CL.2 cells were treated with 100 μM DEHP for 12 hin the absence or presence of ZPDC glycoprotein (25, 50and 100 µg/ml). After that, the radioactivity was countedin [3H]‐thymidine incorporation using beta counter. Asshown in Figure 1, when BNL CL.2 cells were treatedwith 100 μM DEHP, the numbers of living cells wereincreased compared with the controls. However, when theBNL CL.2 cells were treated with ZPDC glycoprotein (50and 100 µg/ml) in the presence of DEHP, [3H]‐thymidineincorporation was reduced in the dose‐dependent mannercompared with DEHP treatment alone. For instance, therelative values of [3H]‐thymidine incorporation werediminished by 0‐fold , 0·18‐fold and 0·56‐fold for 25, 50and 100 µg/ml of ZPDC glycoprotein, respectively,compared with the DEHP treatment (Figure 1C). Also,the results obtained from LDH assay did not show anycytotoxicity (Figure 1A and B).
Inhibitory effect of ZPDC glycoprotein on production ofintracellular ROS in DEHP‐induced BNL CL.2 cells
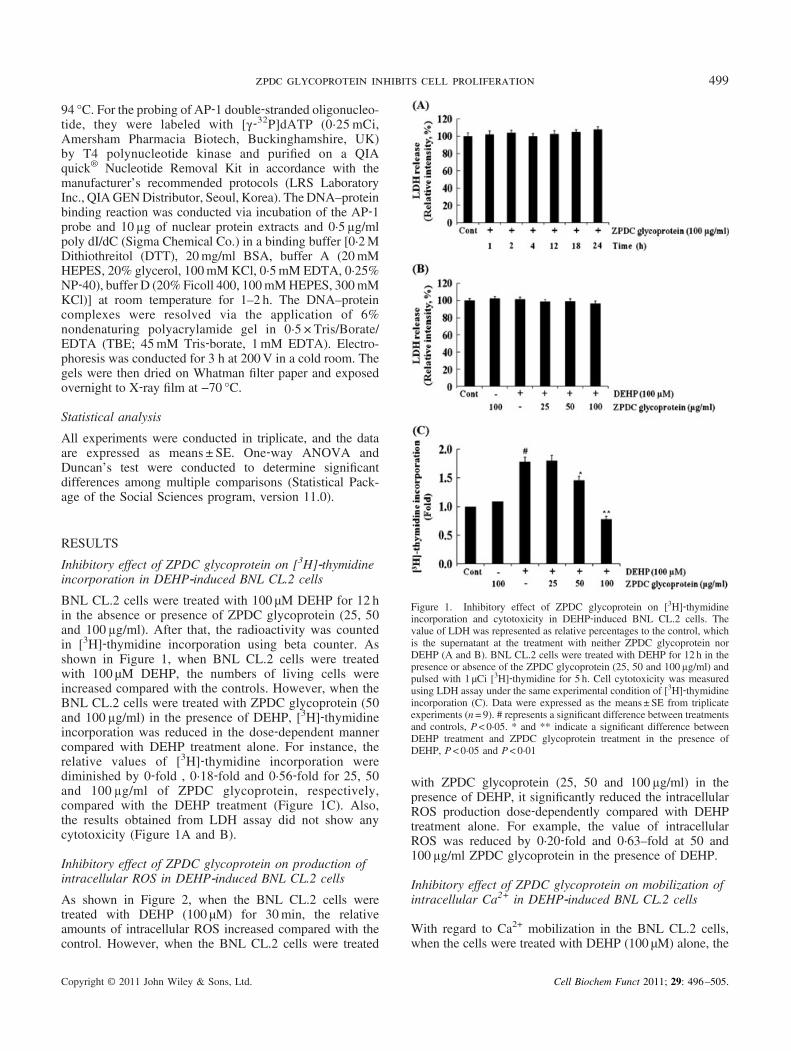
As shown in Figure 2, when the BNL CL.2 cells weretreated with DEHP (100 μM) for 30min, the relativeamounts of intracellular ROS increased compared with thecontrol. However, when the BNL CL.2 cells were treated
with ZPDC glycoprotein (25, 50 and 100 µg/ml) in thepresence of DEHP, it significantly reduced the intracellularROS production dose‐dependently compared with DEHPtreatment alone. For example, the value of intracellularROS was reduced by 0·20‐fold and 0·63–fold at 50 and100 µg/ml ZPDC glycoprotein in the presence of DEHP.
Inhibitory effect of ZPDC glycoprotein on mobilization ofintracellular Ca2+ in DEHP‐induced BNL CL.2 cells
With regard to Ca2+ mobilization in the BNL CL.2 cells,when the cells were treated with DEHP (100 μM) alone, the
Figure 1. Inhibitory effect of ZPDC glycoprotein on [3H]‐thymidineincorporation and cytotoxicity in DEHP‐induced BNL CL.2 cells. Thevalue of LDH was represented as relative percentages to the control, whichis the supernatant at the treatment with neither ZPDC glycoprotein norDEHP (A and B). BNL CL.2 cells were treated with DEHP for 12 h in thepresence or absence of the ZPDC glycoprotein (25, 50 and 100 µg/ml) andpulsed with 1 μCi [3H]‐thymidine for 5 h. Cell cytotoxicity was measuredusing LDH assay under the same experimental condition of [3H]‐thymidineincorporation (C). Data were expressed as the means ± SE from triplicateexperiments (n= 9). # represents a significant difference between treatmentsand controls, P< 0·05. * and ** indicate a significant difference betweenDEHP treatment and ZPDC glycoprotein treatment in the presence ofDEHP, P< 0·05 and P< 0·01
499zpdc glycoprotein inhibits cell proliferation
Copyright © 2011 John Wiley & Sons, Ltd. Cell Biochem Funct 2011; 29: 496–505.

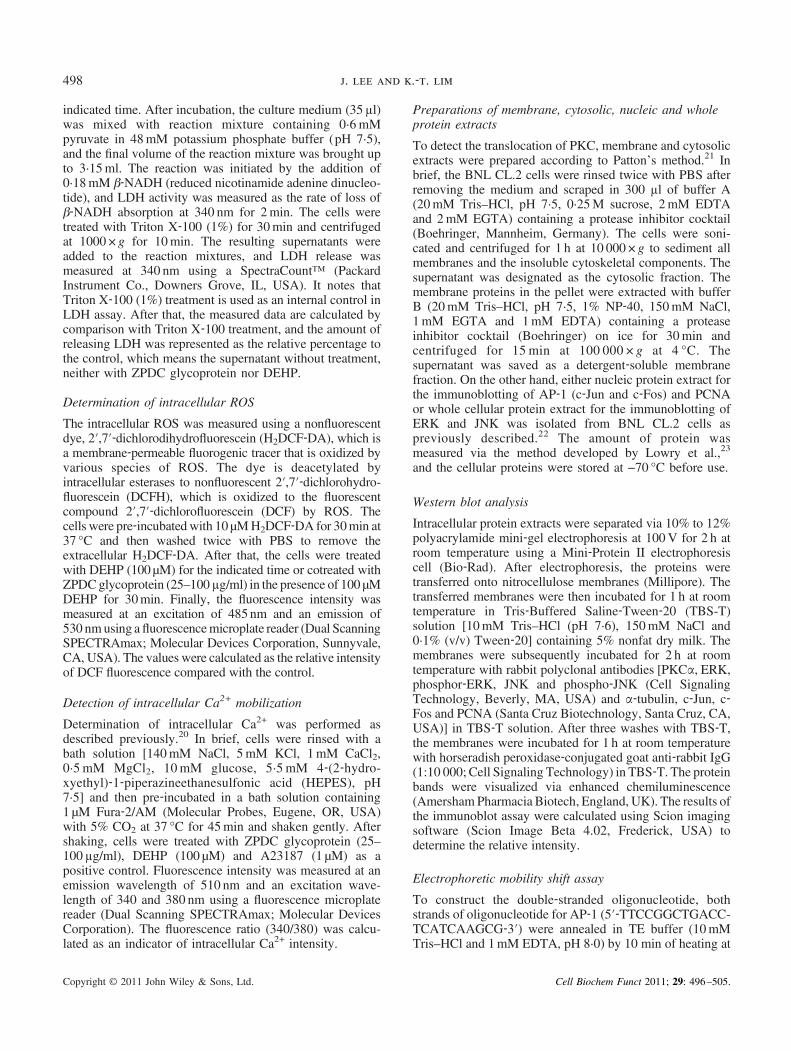
mobilization of the intracellular Ca2+ was significantlyaugmented by 1·59‐fold compared with the controls.However, when the BNL CL.2 cells were treated withZPDC glycoprotein (25, 50 and 100 µg/ml) in the presenceof DEHP, the mobilization of intracellular Ca2+ wassignificantly reduced in a dose‐dependent manner. Forexample, the value of intracellular Ca2+ was significantlyreduced by 0·20‐fold and 0·25‐fold at treatment with 50 and100 µg/ml of ZPDC glycoprotein, respectively, comparedwith treatment with DEHP (100 μM) alone (Figure 3).
Inhibitory effect of ZPDC glycoprotein on the activity ofPKCα in DEHP‐induced BNL CL.2 cells
As shown in Figure 4, when the cells were treated withDEHP, the translocation of PKCα was induced from thecytosol to the membrane in 30min after treatment withDEHP. At treatment with 100 μM DEHP, the band intensity
of PKCα was reduced by 0·68‐fold in the cytosolic extract,whereas it was increased by 2·59‐fold in the membraneextract compared with the controls. However, when the cellswere treated with DEHP in the presence of ZPDCglycoprotein, PKCα translocation was inhibited by treatmentwith the ZPDC glycoprotein in the DEHP‐induced BNLCL.2 cells in a concentration‐dependent manner. Indeed, therelative intensities of PKCα band in the membrane fractionwere effectively reduced by 0·37‐fold and 0·54‐fold attreatment with 50 and 100 µg/ml of ZPDC glycoprotein,respectively, compared with DEHP treatment alone.
Inhibitory effect of ZPDC glycoprotein on phosphorylationof ERK and JNK in DEHP‐induced BNL CL.2 cells
To determine whether the ZPDC glycoprotein inhibits ERKand JNK phosphorylation in the DEHP‐treated BNL CL.2cells, ERK and JNK phosphorylation was assessed aftertreatment with DEHP for 1 h using Western blot analysis.JNK and ERK activity were augmented at treatment with100 μM DEHP compared with the controls (Figure 5). Forinstance, the relative band intensities of ERK and JNK wereaugmented by 1·94‐fold and 1·44‐fold at treatment withDEHP treatment alone, respectively. However, when thecells were treated with DEHP in the presence of ZPDCglycoprotein (25, 50 and 100 µg/ml), the relative bandintensities were markedly reduced in a dose‐dependentmanner. That is, when the cells were treated with the ZPDCglycoprotein (100 µg/ml) in the presence of DEHP(100 μM), the band intensities of ERK and JNK weresignificantly reduced by 0·37‐fold and 0·50‐fold, respec-tively, compared with the DEHP treatment alone.
Inhibitory effect of ZPDC glycoprotein on the expression ofAP‐1 (c‐Jun and c‐Fos) in DEHP‐induced BNL CL.2 cells
To evaluate the impact of the ZPDC glycoprotein ondownstream signaling, we evaluated the effects of theZPDC glycoprotein on the activation of AP‐1 (c‐Jun and c‐Fos) using Western blotting analysis. When the cells weretreated with 100 μM DEHP for 6 h, AP‐1 activity wasmarkedly increased compared with the control. However,when the cells were treated with ZPDC glycoprotein (50and 100 µg/ml) in the presence of 100 μM DEHP, theactivity of AP‐1 (c‐Jun and c‐Fos) was significantly reducedin a concentration‐dependent manner compared with theDEHP treatment alone. For instance, the relative intensitiesof AP‐1 (c‐Jun and c‐Fos) were augmented by 1·82‐fold and2·03‐fold at 100 μM DEHP treatment alone compared withthe controls. However, when the cells were treated withZPDC glycoprotein (100 µg/ml) in the presence of DEHP,the activities of AP‐1 (c‐Jun and c‐Fos) were diminished by0·46‐fold and 0·65‐fold, respectively, compared with DEHPtreatment alone (Figure 6, lane 5). Similarly, when the cellswere treated with DEHP alone, the DNA‐binding activity ofthe AP‐1 complex in EMSA was increased compared withthe controls (Figure 6B, lane 2). However, when the cellswere treated with ZPDC glycoprotein (100 µg/ml) in thepresence of DEHP, the activities of AP‐1 (c‐Jun and c‐Fos)
Figure 3. Inhibitory effect of ZPDC glycoprotein on mobilization ofintracellular Ca2+ in DEHP‐induced BNL CL.2 cells. BNL CL.2 cells weretreated with 100 μM DEHP in the absence or presence of ZPDCglycoprotein (25, 50 and 100 µg/ml). Changes in intracellular Ca2+
concentration were monitored with Fura‐2/AM, as described in theMaterials and methods section. Data were expressed as the absoluteintensity of Ca2+ fluorescence and were the means ± SE from triplicates(n= 9). # represents a significant difference between the treatment andcontrol groups, P< 0·05. * indicates a significant difference between DEHPtreatment and ZPDC glycoprotein treatment in the presence of DEHP,P< 0·05. A23187 (Ca2+ ionophore) was used as a positive control
Figure 2. Inhibitory effect of ZPDC glycoprotein on production ofintracellular ROS in DEHP‐induced BNL CL.2 cells. Fluorescenceintensity is presented as relative intensity based on monitoring dichlor-odihydrofluorescein (DCF) fluorescence using a fluorescence microplatereader (Dual Scanning SPECTRAmax; Molecular Devices Corporation).Data are the means ± SE from triplicates (n= 9). # represents a significantdifference between treatments and control, P< 0·05. * and ** indicatesignificant differences between DEHP treatment and ZPDC glycoproteintreatment in the presence of DEHP, P< 0·05 and P< 0·01
500 j. lee and k.‐t. lim
Copyright © 2011 John Wiley & Sons, Ltd. Cell Biochem Funct 2011; 29: 496–505.

were reduced at treatment with ZPDC glycoprotein (25, 50and 100 µg/ml) in a dose‐dependent manner.
Inhibitory effect of ZPDC glycoprotein on the expression ofPCNAand cyclin D1/CDK4 inDEHP‐induced BNLCL.2 cells
To determine whether the ZPDC glycoprotein inhibitsexpression of PCNA and cyclin D1/CDK4 in the
DEHP‐treated BNL CL.2 cells, we evaluated the expres-sions of PCNA and cyclin D1/CDK4 after treatment withDEHP for 12 h using Western blot analysis. As shown inFigure 7, PCNA activity was augmented after treatment with100 μMDEHP compared with the controls. For instance, therelative band intensity of PCNAwas augmented by 1·40‐foldat DEHP treatment. However, when the BNLCL.2 cells weretreated with DEHP in the presence of ZPDC glycoprotein
Figure 5. Inhibitory effect of ZPDC glycoprotein on ERK and JNK phosphorylation in DEHP‐induced BNL CL.2 cells. BNL CL.2 cells were treated withDEHP (100 μM) for 1 h in the absence or presence of ZPDC glycoprotein (25, 50 and 100 µg/ml). The relative intensities of bands were calculated with ScionImaging Software (Scion Image Beta 4.02). Data were represented as absolute intensities and expressed as means ± SE from triplicates (n= 9) # represents asignificant difference between the treatment and control groups, P< 0·05. * indicates a significant difference between DEHP treatment and ZPDC glycoproteinin the presence of DEHP, P< 0·05. Lane 1, control; lane 2, 100 µg/ml ZPDC glycoprotein; lane 3, DEHP alone; lane 4, 25 µg/ml ZPDC glycoprotein in thepresence of DEHP; lane 5, 50 µg/ml ZPDC glycoprotein in the presence of DEHP; lane 6, 100 µg/ml ZPDC glycoprotein in the presence of DEHP
Figure 4. Inhibitory effect of ZPDC glycoprotein on PKCα activity in DEHP‐induced BNL CL.2 cells. BNL CL.2 cells were treated with DEHP (100 μM) orcotreated with the ZPDC glycoprotein (25, 50 and 100 µg/ml) and DEHP for 30min. The relative intensities of bands were calculated using Scion ImagingSoftware (Scion Image Beta 4.02). Data were represented as absolute intensity and were expressed as means ± SE from triplicates (n= 9). # represents asignificant difference between treatments and controls, P< 0·05. * indicates a significant difference between DEHP treatment and ZPDC glycoproteintreatment in the presence of DEHP, P< 0·05. Lane 1, control; lane 2, 100 µg/ml ZPDC glycoprotein; lane 3, DEHP alone; lane 4, 25 µg/ml ZPDC glycoproteinin the presence of DEHP; lane 5, 50 µg/ml ZPDC glycoprotein in the presence of DEHP; lane 6, 100 µg/ml ZPDC glycoprotein in the presence of DEHP
501zpdc glycoprotein inhibits cell proliferation
Copyright © 2011 John Wiley & Sons, Ltd. Cell Biochem Funct 2011; 29: 496–505.

(25, 50 and 100 µg/ml), the relative band intensities weremarkedly reduced in a concentration‐dependent manner.That is, the band intensities of PCNA at treatment withZPDC glycoprotein (50 and 100 µg/ml) in the presence ofDEHP (100 μM) were significantly reduced by 0·61‐fold and0·69‐fold compared with DEHP treatment alone.For cell cycle G0/G1 arrest assay, when the BNL CL.2
cells were treated with DEHP (100 μM), the expressions ofcyclin D1/CDK4 were increased compared with the control.That is, the relative band intensities of cyclin D1/CDK4 attreatment with DEHP alone were augmented by 1·40‐foldand 3·30‐fold compared with the controls. However, whenBNL CL.2 cells were treated with ZPDC glycoprotein(100 µg/ml) in the presence of DEHP, the relative bandintensities of cyclin D1/CDK4 were significantly reducedby 0·72‐fold and 0·76‐fold, respectively, compared with thetreatment with DEHP alone.
DISCUSSION
The liver plays a pivotal role in the regulation ofphysiological processes including metabolism, secretionand storage of nutrients. It has been reported that liver isunfortunately a common target for toxicants, which comeinto the body from outside.24 DEHP causes to produce livertumors in rodents, to enhance tumor promotion and toproliferate skin cells and liver cells of mice.25 To controlgrowth and proliferation of cells is very important, becauseit is closely related to the processes of regeneration,development, metabolic homeostasis and cancer.26 Ingeneral, to verify whether or not exogenous toxic chemicalshave cytotoxicity, it should be carried out at either cellproliferation using 3‐(4,5‐Dimethylthiazol‐2‐yl)‐2,5‐diphenyltetrazolium bromide (MTT) or [3H]‐thymidineincorporation or cell cycle arrest assay. In the presentstudy, we evaluated the proliferation of BNL CL.2 cellsinduced by DEHP and then assessed the subsequentinhibitory effect induced by the ZPDC glycoprotein forcell proliferation factors [3H]‐thymidine incorporation,PCNA and cyclin D1/CDK4, and PKC/Ca2+, MAPK(ERK and JNK) and AP‐1 after the indicated varioustreatment time with DEHP. In the effects of the ZPDCglycoprotein on proliferation in DEHP‐treated BNL CL.2cells using [3H]‐thymidine incorporation, the data demon-strated that the ZPDC glycoprotein inhibits cell proliferationin the DEHP‐induced BNL CL.2 cells without anycytotoxicity (Figure 1).More recent studies have postulated that ROS possibly
acts as a second messenger in cell proliferation andcarcinogenesis via activation of protein kinase and celltranscriptional factors.27 It has been reported that DEHP hasan ability to induce ROS as an environmental hormonalstimulator.28 Our result showed that DEHP induces anincrease in DCF fluorescence, whereas ZPDC glycoproteinpartially blocked this increased fluorescence (Figure 2). Itnotes that the intensity of fluorescence (DCF) is propor-tional to the amount of intracellular ROS. The underlying
Figure 6. Inhibitory effect of ZPDC glycoprotein on expression of AP‐1(c‐Jun and c‐Fos) in DEHP‐induced BNL CL.2 cells. BNL CL.2 cells weretreated with DEHP (100 μM) for 6 h in the absence or presence ofZPDC glycoprotein (25, 50 and 100 µg/ml). (A) Detections of AP‐1subunits (c‐Jun and c‐Fos) were conducted by Western blotting. Lane 1,control; lane 2, 100µg/ml ZPDC alone; lane 3, DEHP alone; lane 4, 25µg/mlZPDC glycoprotein in the presence of DEHP; lane 5, 50 µg/ml ZPDCglycoprotein in the presence of DEHP; lane 6, 100 µg/ml ZPDCglycoprotein in the presence of DEHP. α‐tubulin was used as an internalcontrol. The relative intensities of bands were calculated using ScionImaging Software (Scion Image Beta 4.02). Data were represented asabsolute intensity and were expressed as means ± SE from triplicates (n= 9)# represents a significant difference between treatments and control,P< 0·05. * indicates a significant differences between DEHP treatment andZPDC glycoprotein treatment in the presence of DEHP, P< 0·05. (B)Detection of AP‐1 DNA‐binding activity was conducted by EMSA. Lane 1,free probe alone (no nuclear extracts); lane 2, control; lane 3, DEHP alone;lane 4, 25 µg/ml ZPDC glycoprotein in the presence of DEHP; lane 5,50 µg/ml ZPDC glycoprotein in the presence of DEHP; lane 6, 100 µg/mlZPDC glycoprotein in the presence of DEHP; lane 7, 100 µg/ml ZPDCalone
502 j. lee and k.‐t. lim
Copyright © 2011 John Wiley & Sons, Ltd. Cell Biochem Funct 2011; 29: 496–505.

mechanism of the protective effects of ZPDC glycoproteinmight be performed by the direct/indirect stimulation ofantioxidant enzyme activities.
Cell growth and proliferation are associated with activitychange of kinase such as PKC, in particular, cellularcalcium levels. 29 This means that calcium level is requiredfor the modulation of cell proliferation pathways inhepatocytes.30 Both Ca2+ release and influx are tightlycontrolled by protein phosphorylation by serine/threonine ortyrosine kinases. Our results demonstrated that intracellularCa2+ was released by treatment with DEHP alone in BNLCl.2 cells, whereas ZPDC glycoprotein inhibited amountsof Ca2+ in the presence of DEHP (Figure 3). The change ofCa2+ amount is closely related to activation of PKC(mobilization) from cytosol to inside of cell membrane,because it depends on the existence of Ca2+ to activate PKC.In this study, the ZPDC glycoprotein suppressed thetranslocation of PKCα from the cytosol to the cell membranein DEHP‐stimulated BNL CL.2 cells (Figure 4). Theactivation of PKC plays a critical role in the cell survival,proliferation and tumor promotion.31 Conventional PKCisoforms can mediate the activation of the ERK1/2 and JNKpathways.32 PKC has also been shown to promotetranscriptional activity at the cyclin D1 promoter, which ismediated primarily through the AP‐1 enhancer element.33
The activation of ERK (one of the MAPKs) leading toproliferation is dependent on several intracellular signalssuch as increase in intracellular Ca2+.34 MAPKs are essentialcomponents of intracellular signal transduction and areactivated by phosphorylation in response to a variety ofextracellular stimuli, including growth factors, cytokines andenvironmental stress. It has been demonstrated that theMAPK superfamily plays a pivotal role in cell proliferationin response to several extracellular stimuli in eukaryoticcells.35 ERK is a key molecule that transfers signal into thenuclei to induce proliferation and differentiation, therebyresulting in cellular proliferation and differentiation bystimulating the transcription factors that induce the expres-sion of c‐Fos and other compounds.36 In addition, ERKpromotes G1 progression and S phase entry in the cell cycleunder in vitro conditions.37 It notes that p38 as one ofMAPKs is weakly related to cell proliferation. That is whyactivities of ERK and JNK in this study were evaluatedexception of p38.38 As shown in Figure 5, our findingsdemonstrated that phosphorylated ERK is strongly expressedby treatment with DEHP. Comparing the two MAPKs (ERKand JNK), the phosphorylated JNK is expressed at lowerlevels than ERK. The activation of the ERK and JNKpathways, which results in increased levels of the c‐Fos and/or c‐Jun proteins, has been previously documented in some
Figure 7. Inhibitory effect of ZPDC glycoprotein on expression of PCNA and cyclin D1/CDK4 in DEHP‐induced BNL CL.2 cells. For expression of PCNAand cyclin D1/CDK4, BNL CL.2 cells were treated with 100 μM DEHP for 12 h in the absence or presence of the ZPDC glycoprotein. After that, the relativeintensities of bands were calculated using Scion Imaging Software (Scion Image Beta 4.02). Data were represented as absolute intensity and were expressed asmeans ± SE from triplicates (n= 9) # represents a significant difference between treatments and control, P< 0·05. * indicates significant differences betweenDEHP treatment and ZPDC glycoprotein treatment in the presence of DEHP, P< 0·05. Lane 1, control; lane 2, 100 µg/ml ZPDC glycoprotein; lane 3, DEHPalone; lane 4, 25 µg/ml ZPDC glycoprotein in the presence of DEHP; lane 5, 50 µg/ml ZPDC glycoprotein in the presence of DEHP; lane 6, 100 µg/ml ZPDCglycoprotein in the presence of DEHP
503zpdc glycoprotein inhibits cell proliferation
Copyright © 2011 John Wiley & Sons, Ltd. Cell Biochem Funct 2011; 29: 496–505.

chemically treated cells.39 This means that the ZPDCglycoprotein indirectly prevents MAPK signaling viaDEHP‐stimulated PKCα activity.The AP‐1 transcription factor is assembled in homo-
dimeric or heterodimeric form from the Jun–Jun, Jun–Fosor Jun–ATF family proteins.40 AP‐1 activation is induced atmultiple levels by MAPK activation, which involves themajor pathways of ERK and JNK.41 In addition, it haspreviously been reported that signals from growth factorsand mitogens eventually are to activate AP‐1, which in turnactivates cyclin D1. For example, the cyclin D1 is regulatedby AP‐1 in breast cancer cells.41 In this study, AP‐1 wasactivated by treatment with DEHP but inhibited by thetreatment with ZPDC glycoprotein in the presence of DEHP(Figure 6).Proliferating cell nuclear antigen has been identified as a
cyclin or as an auxiliary protein for DNA polymerase‐δ.42
Our result demonstrated that the ZPDC glycoproteininhibits the activity of PCNA induced by DEHP, whichplays a pivotal role in DNA repair, cell proliferation and cellcycle control.12 The cell proliferation by various externalmitogenic factors ultimately has linkages to the cell divisioncycle. The cell cycle process depends on precise andrigorous regulation mediated by levels of cell cycleregulatory factors.43 In eukaryotes, the cell cycle is tightlyregulated by several protein kinases composed of CDKs andcorresponding regulatory cyclins, as well as CDK inhibi-tors.44 The activity of CDK/cyclin complexes is regulatedby PCNA, which binds to the cyclin D1/CDK4 complex,thus promoting the progression through G1 phase into Sphase. Cyclin D1 is an isoform of cyclin D, which isrequired for the proliferation of most tissues and has beenlucubrated upon fairly deeply. To confirm the induction ofcell proliferation by DEHP treatment in BNL CL.2 cells, weevaluated the activities of PCNA and cyclin D1/CDK4using immunoblot. As shown in Figure 7, the results in thisstudy indicated that ZPDC glycoprotein inhibits theinduction of cell proliferation factors (PCNA and cyclinD1/CDK4) by treatment with DEHP. With the resultsobtained from this experiment, we assume as follows: Thepossible mechanism about inhibition of cell proliferation byZPDC glycoprotein is that the glycoprotein firstly inhibitscalcium mobilization, and then translocation of PKC isdepressed. Subsequently, the downstream signals (ERK,JNK and AP‐1), which are located lower than the PKC,were not activated by ZPDC glycoprotein. That is why thecell proliferation indicators (PCNA and cyclin D1/CDK4)by ZPDC glycoprotein were normalized in this study.In conclusion, the results in this study showed that the
levels of [3H]‐thymidine incorporation, intracellular Ca2+
mobilization and activity of PKC were inhibited attreatment with ZPDC glycoprotein (100 µg/ml) in theDEHP‐induced BNL CL. 2 cells. Also, activities of ERK,JNK and AP‐1 were reduced by ZPDC glycoprotein(100 µg/ml). With regard to cell proliferation, activities ofPCNA and cyclin D1/CDK4 were significantly suppressedat treatment ZPDC glycoprotein (100 µg/ml) in the presenceof DEHP. It speculates that the ZPDC glycoprotein blocks
PCNA expression via the deactivation of JNK and ERK andAP‐1 in DEHP‐stimulated BNL CL.2 cells. Taken together,these findings suggest that ZPDC glycoprotein significantlynormalizes activities of PCNA and cyclin D1/CDK4. Thus,ZPDC glycoprotein appears to be one compound derivedfrom natural products that is able to inhibit cell proliferationin the phthalate‐induced BNL CL. 2 cells.
ACKNOWLEDGEMENTS
This work was financially supported by Chonnam NationalUniversity in 2011.
CONFLICT OF INTEREST
The authors have declared that there is no conflict ofinterest.
REFERENCES
1. Lahousse SA, Beall SA, Johnson KJ. Mono‐(2‐ethylhexyl) phthalaterapidly increases celsr2 protein phosphorylation in HeLa cells viaprotein kinase C and casein kinase 1. Toxicol Sci 2006; 91: 255–264.
2. Li X. Zhang S, Safe S. Activation of kinase pathways in MCF‐7 cellsby 17beta‐estradiol and structurally diverse estrogenic compounds. JSteroid Biochem Mol Biol 2006; 98: 122–132.
3. Barlow NJ, Foster PM. Pathogenesis of male reproductive tractlesions from gestation through adulthood following in utero exposureto Di(n‐butyl) phthalate. Toxicol Pathol 2003; 31: 397–410.
4. Schlezinger JJ, Howard GJ, Hurst CH, et al. Environmental andendogenous peroxisome proliferator‐activated receptor gamma ago-nists induce bone marrow B cell growth arrest and apoptosis:interactions between mono(2‐ethylhexyl)phthalate, 9‐cis‐retinoic acid,and 15‐deoxy‐Delta12,14‐prostaglandin J2. J Immunol 2004; 173:3165–3177.
5. Capiod T, Shuba Y, Skryma R, Prevarskaya N. Calcium signalling andcancer cell growth. Subcell Biochem 2007; 45: 405–427.
6. Gopalakrishna R, Jaken S. Protein kinase C signaling and oxidativestress. Free Radic Biol Med 2000; 28: 1349–1361.
7. Nakashima S. Protein kinase C alpha (PKC alpha): regulation andbiological function. J Biochem (Tokyo) 2002; 132: 669–675.
8. Ito Y, Sasaki Y, Horimoto M, et al. Activation of mitogen‐activatedprotein kinases/extracellular signal‐regulated kinases in humanhepatocellular carcinoma. Hepatology 1998; 27: 951–958.
9. Chang L, Karin M. Mammalian MAP kinase signalling cascades.Nature 2001; 410: 37–40.
10. Kouzarides T, Ziff E. The role of the leucine zipper in the fos–juninteraction. Nature 1988; 336: 646–651.
11. Shaulian E, Karin M. AP‐1 in cell proliferation and survival.Oncogene 2001; 20: 2390–2400.
12. Gramantieri L, Trerè D, Chieco P, et al. In human hepatocellularcarcinoma in cirrhosis proliferating cell nuclear antigen (PCNA) isinvolved in cell proliferation and cooperates with P21 in DNA repair. JHepatol 2003; 39: 997–1003.
13. Newman DJ. Natural products as leads to potential drugs: an oldprocess or the new hope for drug discovery? J Med Chem 2008; 51:2589–2599.
14. Jiang L, Kubota KJ. Formation by mechanical stimulus of the flavorcompounds in young leaves of Japanese pepper (Xanthoxylumpiperitum DC). J Agric Food Chem 2001; 49: 1353–1357.
15. Kim JK. Illustrated Natural Drugs Encyclopedia. Seoul: Namsandang,1984; 1: 359.
16. Lee SJ, Lim KT. Glycoprotein of Zanthoxylum piperitum DC has ahepatoprotective effect via anti‐oxidative character in vivo andin vitro. Toxicol In Vitro 2007; 22: 376–385.
504 j. lee and k.‐t. lim
Copyright © 2011 John Wiley & Sons, Ltd. Cell Biochem Funct 2011; 29: 496–505.
17. Neville Jr DM, Glossmann H. Molecular weight determinationof membrane protein and glycoprotein subunits by discontinuous gelelectrophoresis in dodecyl sulfate.Methods Enzymol 1974; 32: 92–102.
18. Gabelman BM, Emerman JT. Effects of estrogen, epidermal growthfactor, and transforming growth factor‐a on the growth of human breastepithelial cells in primary culture. Exp Cell Res 1992; 201: 113–118.
19. Bergmeyer HU, Bernt E. Lactate dehydrogenase. In Methods ofEnzymatic Analysis, 2nd edn. Bergmeyer HU (ed.). Academic Press:New York, 1974; 574–579.
20. Kamata H, Hirata H. Redox regulation of cellular signalling. CellSignal 1999; 11: 1–14.
21. Patton WF, Dhanak MR, Jacobson BS. Differential partitioning ofplasma membrane proteins into the triton X‐100‐insoluble cytoskel-eton fraction during concanavalin A‐induced receptor redistribution. JCell Sci 1989; 92: 85–91.
22. Oh PS, Lim KT. Blocking of intracellular ROS production byphytoglycoprotein (30 kDa) causes anti‐proliferation in bisphenolA‐stimulated Chang liver cells. J Appl Toxicol 2008; 28: 749–758.
23. Lowry OH, Rosebrough NJ, Farr AL, Randall RJ. Protein measure-ment with the Folin phenol reagent. J Biol Chem 1951; 193: 265–275.
24. Mayer SA, Kulkarni AP. Hepatotoxicity. In Introduction to BiochemicalToxicology. Hodgson E, Smart RC (eds).Wiley: NewYork, 2001; 599–628.
25. Kluwe WM, McConnell EE, Huff JE, Haseman JK, Douglas JF,Hartwell WV. Carcinogenicity testing of phthalate esters and relatedcompounds by the National Toxicology Program and the NationalCancer Institute. Environ Health Perspect 1982; 45: 129–133.
26. Rutkowski MJ, Sughrue ME, Kane AJ, Ahn BJ, Fang S, Parsa AT.The complement cascade as a mediator of tissue growth andregeneration. Inflamm Res 2010; 11: 897–905.
27. Martindale JL, Holbrook NJ. Cellular response to oxidative stress:signaling for suicide and survival. J Cell Physiol 2002; 192: 1–15.
28. Ghosh J, Das J, Manna P, Sil PC. Hepatotoxicity of di‐(2‐ethylhexyl)phthalate is attributed to calcium aggravation, ROS‐mediatedmitochondrial depolarization, and ERK/NF‐κB pathway activation.Free Radic Biol Med 2010; 11: 1779–1791.
29. Goodall H, Maro B. Major loss of junctional coupling during mitosisin early mouse embryos. J Cell Biol 1986; 102: 568–575.
30. Gearhart TL, Bouchard MJ. The hepatitis B virus X protein modulateshepatocyte proliferation pathways to stimulate viral replication. J Virol2010; 84: 2675–2686.
31. Li‐Ping Z, Da‐Lei Z, Jian H, et al. Proto‐oncogene c‐erbB2 initiates ratprimordial follicle growth via PKC and MAPK pathways. Reprod BiolEndocrinol 2010; 19: 8–66.
32. Dobkin‐Bekman M, Ben‐Navi LR, Shterntal B, et al. Differential roleof PKC isoforms in GnRH and phorbol 12‐myristate 13‐acetateactivation of extracellular signal‐regulated kinase and Jun N‐terminalkinase. Endocrinology 2010; 151: 4894–4907.
33. Soh JW, Weinstein IB. Roles of specific isoforms of protein kinase Cin the transcriptional control of cyclin D1 and related genes. J BiolChem 2003; 278: 34709–34716.
34. Harrison BC, Kim MS, van Rooij E, et al. Regulation of cardiac stresssignaling by protein kinase d1. Mol Cell Biol 2006; 26: 3875–3888.
35. Seger R, Krebs EG. The MAPK signaling cascade. FASEB J 1995; 9:726–735.
36. Lopez‐Ilasaca M. Signaling from G‐protein‐coupled receptors tomitogen‐activated protein (MAP)‐kinase cascades. Biochem Pharma-col 1998; 56: 269–277.
37. Parrales A, Palma‐Nicolás JP, López E, López‐Colomé AM.Thrombin stimulates RPE cell proliferation by promoting c‐Fos‐mediated cyclin D1 expression. J Cell Physiol 2010; 222: 302–312.
38. Rubinfeld H, Seger R. The ERK cascade: a prototype of MAPKsignaling. Mol Biotechnol 2005; 31: 151–174.
39. Chang CH, Yu FY, Wang LT, Lin YS, Liu BH. Activation of ERKand JNK signaling pathways by mycotoxin citrinin in human cells.Toxicol Appl Pharmacol 2009; 237: 281–287.
40. Shaulian E, Karin M. AP‐1 as a regulator of cell life and death. NatCell Biol 2002; 4: E131–E136.
41. Shen F, Fan X, Liu B, et al. Overexpression of cyclin D1‐CDK4 insilica‐induced transformed cells is due to activation of ERKs, JNKs/AP‐1 pathway. Toxicol Lett 2006; 160: 185–195.
42. Bravo R, Frank R, Blundell PA, Macdonald‐Bravo H. Cyclin/PCNA isthe auxiliary protein of DNA polymerase‐delta. Nature 1987; 326:515–517.
43. McKay JA, Douglas JJ, Ross VG, et al. Analysis of key cell‐cycle checkpoint proteins in colorectal tumours. J Pathol 2002; 196:386–393.
44. Graña X, Reddy EP. Cell cycle control in mammalian cells: role ofcyclins, cyclin dependent kinases (CDKs), growth suppressor genesand cyclin‐dependent kinase inhibitors (CKIs). Oncogene 1995; 11:211–219.
505zpdc glycoprotein inhibits cell proliferation
Copyright © 2011 John Wiley & Sons, Ltd. Cell Biochem Funct 2011; 29: 496–505.