plant biomass characterization: application of solution ... · 18 plant biomass characterization:...
TRANSCRIPT

18
Plant Biomass Characterization:
Application of Solution- and
Solid-state NMR Spectroscopy
Yunqiao Pu1,3, Bassem Hallac2,3 and Arthur J. Ragauskas1,2,31Georgia Institute of Technology, Atlanta, USA
2 School of Chemistry and Biochemistry, Georgia Institute of Technology, Atlanta, USA3BioEnergy Science Center, Oak Ridge, USA
18.1 Introduction
Releasing fermentable sugars from lignocellulosic materials remains challenging due to resistance of plants
to breakdown. A pretreatment stage is required to reduce this recalcitrance, which is considered to be the
most intensive operating cost component of cellulosic ethanol production. There are different features
that make plant biomass resistant to chemical and biological degradation, such as lignin content/structure,
lignin-carbohydrate complexes (LCCs), hemicellulose content, as well as cellulose ultrastructure and
degree of polymerization (DP). Research on this subject is therefore focused on understanding the effects
of pretreatment technologies on the reduction of biomass recalcitrance as well as on fundamental structural
characteristics of biomass that impact pretreatment and subsequent enzymatic hydrolysis. Improving our
fundamental knowledge of pretreatment technologies will lead to significant advances in the field of
sustainable low-cost cellulosic biofuels production [1].
Nuclear magnetic resonance (NMR) spectroscopy is a powerful tool for detailed structural elucidation of
the major constitutes of plant biomass, lignin, hemicellulose, and cellulose [2–8]. Many of the structural
details/characteristics of biopolymers (especially lignin) in native and transgenic plant biomass we know of
today were revealed with NMR measurements, in addition to key information about lignin/hemicellulose
synthesis in plants as well as plant genetic engineering [2,3]. This chapter focuses on the application of
solution- and solid-state NMR spectroscopy techniques to characterize the structural features of cellulose
Aqueous Pretreatment of Plant Biomass for Biological and Chemical Conversion to Fuels and Chemicals, First Edition.Edited by Charles E. Wyman.� 2013 John Wiley & Sons, Ltd. Published 2013 by John Wiley & Sons, Ltd.

and lignin during aqueous pretreatment of plant biomass for biological and chemical conversion to fuels and
chemicals. Specifically, the most commonly employed solution-state NMR techniques including one-
dimensional (1D) 1H, 13C, and 31P NMR and two-dimensional (2D) heteronuclear single quantum coher-
ence (HSQC) will be discussed for lignin structure characterization. Solid-state cross-polarization/magic
angle spinning (CP/MAS) 13C NMR will also be reviewed as the technique used for analysis of the crystal-
linity and ultrastructure of plant cellulose.
18.2 Plant Biomass Constituents
Plant biomass, including woody and herbaceous lignocellulosics, is a natural biocomposite primarily com-
posed of three major biopolymers (i.e., cellulose, hemicellulose, and lignin), usually with minor amounts of
inorganics and extractives. In a plant cell wall, these polymers typically interact with each other physically
and chemically to form an intricate three-dimensional network structure. Plants have a complicated and
dynamic cell wall which is generally composed of three anatomical regions, that is, middle lamella, the
primary cell wall, and the secondary cell wall. The cell types and chemical compositions vary among differ-
ent species as well as among various regions of the same plant.
The predominant polysaccharide in plant biomass is cellulose, which is a linear homopolymer of
(1! 4)-linked b-D-glucopyranosyl units with the degree of polymerization varying from 300 to c. 15 000
[9,10]. The hydroxyl groups on these glucopyranosyl units have a strong tendency to form intra- and inter-
molecular hydrogen bonds among the linear glucan chains, which stiffen the chains and can facilitate cellu-
lose aggregations to form highly ordered or crystalline cellulose fibril structures. Most plant celluloses also
contain varying degrees of amorphous domains that are more amenable to chemical and enzymatic attack.
After cellulose, the next major polysaccharide in plant biomass is hemicellulose. Hemicelluloses gener-
ally refer to a group of mixed heteroglycans of pentoses and hexanoses which link together in a plant with a
DP of c. 70–200 and frequently have branching and substitution groups [11,12]. The major hemicelluloses
in softwoods include glucomannans and arabinoglucuronoxylan, while in many hardwood and herbaceous
plants the predominant hemicellulose is glucuronoxylan.
Compared to cellulose and hemicellulose, lignin does not have a distinct chemical structure. Lignin is an
amorphous and irregular polyphenolic biopolymer that is synthesized by enzymatic dehydrogenative
polymerization of phenylpropanoid monolignols. Three types of phenylpropane units are generally consid-
ered as basic building blocks for biosynthesis of protolignin: coniferyl, sinapyl, and p-coumaryl alcohol
(Figure 18.1), which correspond to the guaiacyl (G), syringyl (S) and p-hydroxyphenyl (H) structures
of lignin, respectively [13–15]. Softwood lignin contains predominantly guaiacyl and minor amounts of
6 23
5
β
OH
OH
OH
OH
OCH3 OCH3
OH
OH
H3CO
Coniferylalcohol
Sinapylalcohol
p-Coumarylalcohol
4
1α
γ
Figure 18.1 Phenylpropanoid units involved in lignin biosynthesis [13].
370 Aqueous Pretreatment of Plant Biomass for Biological and Chemical Conversion to Fuels and Chemicals

p-hydroxyphenyl units, while hardwood lignin is primarily composed of guaiacyl and syringyl units. Lignin
in herbaceous plants generally contains all three types of monolignol units, with a core structure composed
mainly of guaiacyl and syringyl units and incorporated peripheral groups such as p-hydroxycinnamic acid
and ferulic acid units [14,15].
18.3 Solution-state NMR Characterization of Lignin
Lignin is considered as one of the most recalcitrant components in plant cell walls and protects plants
against microbial and enzymatic deconstruction. Lignin is intimately associated with carbohydrate
components in the cell walls of vascular plants, forming an amorphous network embedding microfibril
cellulosic materials. The lignin macromolecule is primarily connected through carbon-carbon and car-
bon-oxygen ether bonds among the building blocks of phenylpropane monomers [13]. The structure of
lignin is complex, irregular, and highly heterogeneous, with no regular extended repeating unit struc-
tures observed. Compared to other biopolymers, the structural determination of lignin is more chal-
lenging due to its complexity and the difficulty in isolation of a highly representative and structurally
unchanged lignin sample from plant species. Although the exact structure of protolignin in a plant is
still not fully understood, advances in spectroscopic methods (especially NMR techniques) and com-
putational modeling have enabled scientists to elucidate the predominant structural features of lignin,
such as inter-unit linkages and their relative abundances in plant biomass. Some common inter-unit
linkages identified in lignin, such as b-O-4, a-O-4/b-5 (phenylcoumaran), b-b (pinoresinol), dibenzo-
dioxocin, and 4-O-5, are presented in Figure 18.2. The relative proportions of such units are usually
dependent on the biomass species as well as the processing methods employed [11,16]. The discovery
of dibenzodioxocin in softwood lignins at a level of c. 10–15% in the early 1990s has initiated a
flurry of research efforts that led to detection/identification of several new subunit structures such as
spirodienone [17–21].
OH3CO
OHO
OCH3
O
OCH3
HO
HO
O
O
OCH3
O OCH3
H3CO
O
OH
O
HO
O
OCH3
HO
H3CO
HO
HO
H3COO
OOCH3
β−Ο−4 phenylcoumaran pinoresinol dibenzodioxocin α−Ο−4
β−1 5−5 4−Ο−5 β−5 spirodienone
O
O
H3COO
OOCH3
OCH3O O
O
H3CO
OHO
OOCH3H3CO
OCH3
OH
OA
B
A
B
OCH3H3CO
HO
OOCH3
O
H3CO
O
Figure 18.2 Typical inter-unit linkages in plant lignins.
Plant Biomass Characterization: Application of Solution- and Solid-state NMR Spectroscopy 371

18.3.1 Lignin Sample Preparation
No applicable method has yet been developed that can be regarded as ideal for the isolation of a highly
representative native lignin with unaltered structures from plant biomass materials. To date, the most com-
monly used methods for lignin isolation are ball-milled lignin isolation developed by Bjorkman and cellulo-
lytic enzyme lignin (CEL) preparation [22–24]. The Bjorkman method involves extensive milling of the
plant materials followed by extraction with neutral solvents of dioxane-water at room temperature [22]; the
resulting isolated material is usually referred to as milled wood lignin (MWL) when dealing with woody
biomass. The milling is carried out either in a non-swelling medium such as toluene or in the dry state,
usually under inert atmospheric gases such as nitrogen or argon in the milling jar. This method generally
offers a low or moderate lignin yield (up to c. 25%), depending upon various plant species. Despite its low/
moderate yield and possible structural alteration during milling, this methodology is widely accepted as a
typical lignin isolation method, affording a lignin sample with minimal structural alteration and the closest
native representation.
CEL preparation treats finely ground (i.e., ball-milled) plant powders with cellulolytic enzymes prior to
solvent extraction to partially remove polysaccharides [23]. The enzymatically treated plant meal is then
successively extracted with 96% and 50% aqueous dioxane, yielding two lignin fractions. Compared to the
traditional Bjorkman procedure, the CEL procedure offers a significantly improved lignin yield (up to 55%)
for various species, which is probably more representative of total lignin in a plant. However, this prepara-
tion usually suffers from higher carbohydrate contamination (c. 10–12% for a spruce wood compared to less
than 5% in the Bjorkman procedure) of the lignin and is a more tedious and time-consuming process [24].
18.3.2 1H NMR Spectroscopy
1H NMR spectroscopy is a valuable technique for characterization and classification of lignin structural
features. Earlier work on the characterization of lignin by NMR mainly relied on 1H NMR spectroscopy,
and extensive databases of 1H NMR chemical shifts were established for lignin model compounds and
functional groups [6,8]. One advantage of 1H NMR is that the 1H nucleus is the most abundant among the
nuclei that can be detected by NMR, thus giving a high signal to noise (S/N) ratio in a short experimental
time (typically within several minutes). The drawback of 1H NMR for lignin analysis is that it usually
suffers from severe signal overlaps due to its short chemical shift ranges (i.e., d c. 12–0 ppm) [8]. For1H NMR characterization of lignin, the samples can be examined either as acetate derivatives or underivat-
ized forms. Acetylated lignin generally provides improved spectral resolution; however, the acetylation pro-
cedure may cause some unwanted chemical modifications to the sample. 1H NMR of underivatized lignin is
informative about some key lignin functionalities. For example, Li and Lundquist showed that 1H NMR can
be employed to quantify carboxylic acids, aromatic hydrogens, and formyl and methoxyl groups in an
underivatized lignin [25]. Table 18.1 lists assignments and chemical shifts of typical structural features of
acetylated spruce MWL in a 1H NMR spectrum [8]. Figure 18.3 provides an example of 1H NMR spectrum
of underivatized MWL isolated from a poplar biomass which was recorded in a Bruker 400-MHz
NMR instrument.
18.3.3 13C NMR Spectroscopy
13C NMR spectroscopy is one of the most reliable and frequently used techniques for lignin characteriza-
tion, providing comprehensive information about the structures of all carbons in lignin molecules [5]. It
benefits from a broader spectral window (i.e., d c. 240–0 ppm) in comparison to 1H NMR, with better reso-
lution and less overlap of signals. A routine qualitative 13C NMR spectrum of lignin is generally recorded
372 Aqueous Pretreatment of Plant Biomass for Biological and Chemical Conversion to Fuels and Chemicals

with a pulse angle in the range 30–60�, a pulse delay of c. 0.5–2 s, and the transient number of about
10 000–20 000. Quantitative information about specific functional groups and structures present in lignin
can be also estimated when the 13C NMR spectrum is recorded under quantitative requirement conditions,
although the recording of spectra is time consuming. In general, a quantitative 13C NMR spectrum with a
satisfactory signal-to-noise ratio is obtained at c. 50 �C using a 90� pulse, a pulse delay of about 12 s, an
inversed gated decoupling pulse sequence, and thousands of transient acquisition numbers. The total experi-
ment time is much longer than typical 1H NMR, usually being up to 24–36 h.
OMe
–CH3 in acetyl
DMSOAromatic H
10 8 6 4 2 PPM
Hα in -O-4
Hβ in -O-4
Formyl H
Hα in phenylcoumaran
Figure 18.3 An example of 1H NMR spectrum of a poplar mill-wood lignin using DMSO as solvent.
Table 18.1 Typical signals assignment and chemical shifts in the 1HNMR spectrum of acetylated
spruce lignin using deuterated chloroform as solvent [8].
d (ppm) Assignment
1.26 Hydrocarbon contaminant
2.01 Aliphatic acetate
2.28 Aromatic acetate
2.62 Benzylic protons in b-b structures
3.81 Protons in methoxyl groups
4.27 Hg in several structures
4.39 Hg in, primarily, b-O-4 structures and b-5 structures
4.65 Hb in b-O-4 structures
4.80 Inflection possibly due to Ha in pinoresinol units and Hb in noncyclic benzyl aryl ethers
5.49 Ha in b-5 structures
6.06 Ha in b-O-4 structures (Ha in b-1 structures)
6.93 Aromatic protons (certain vinyl protons)
7.41 Aromatic protons in benzaldehyde units and vinyl protons on the carbon atoms adjacent
to aromatic rings in cinnamaldehyde units
7.53 Aromatic protons in benzaldehyde units
9.64 Formyl protons in cinnamaldehyde units
9.84 Formyl protons in benzaldehyde units
Plant Biomass Characterization: Application of Solution- and Solid-state NMR Spectroscopy 373

Quantitative data on lignin structural features is usually reported on the basis of the phenylpropane by
calculating the ratio of the integral value of a given carbon signal to one-sixth the integral of the aromatic
carbons whose signals are located in the range c. 102–162 ppm [5]. Corrections need to be made if a sample
contains structural features with vinyl carbons that appear in this region. Figure 18.4 shows a quantitative13C NMR spectrum for a milled wood lignin isolated from a hardwood Buddleja davidii. Table 18.2 summa-
rizes signal assignments and chemical shifts of structural features of a spruce milled wood lignin in a 13C
NMR measured using deuterated dimethyl sulfoxide (DMSO) as solvent [5,26,27].
Table 18.2 Typical chemical shifts and signal assignments for a spruce milled wood
lignin (MWL) in a 13C NMR spectrum [5,26,27]..
d (ppm) Assignment
193.4 C����O in Ar��CH����CH��CHO; C����O in Ar��CO��CH(��OAr)��C��191.6 C����O in Ar��CHO
169.4 Ester C����O in R0��O��CO��CH3
166.2 C����O in Ar��COOH; Ester C����O in Ar��CO��OR
156.4 C-4 in H-units
152.9 C-3/C-30 in etherified 5-5 units; C-a in Ar��CH����CH��CHO units
152.1 C-3/C-5 in etherified S units and B ring of 4-O-5 unitsa
151.3 C-4 in etherified G units with a-C����O149.4 C-3 in etherified G units
149.1 C-3 in etherified G type b-O-4 units
146.8 C-4 in etherified G units
146.6 C-3 in non-etherified G units (b-O-4 type)
145.8 C-4 in non-etherified G units
145.0 C-4/C-40 of etherified 5-5 units
143.3 C-4 in ring B of b-5 unitsa; C-4/C-40 of non-etherified 5-5 units
134.6 C-1 in etherified G units
132.4 C-5/C-50 in etherified 5-5 units
131.1 C-1 in non-etherified 5-5 units
129.3 C-b in Ar��CH����CH��CHO
128.0 C-a and C-b in Ar-CH����CH��CH2OH
125.9 C-5/C-50 in non-etherified 5-5 units
122.6 C-1 and C-6 in Ar��CO��C��C units
119.9 C-6 in G units
118.4 C-6 in G units
115.1 C-5 in G units
114.7 C-5 in G units
111.1 C-2 in G units
110.4 C-2 in G units
86.6 C-a in G type b-5 units
84.6 C-b in G type b-O-4 units (threo)
83.8 C-b in G type b-O-4 units (erythro)
71.8 C-a in G type b-O-4 units (erythro)
71.2 C-a in G type b-O-4 units (threo); C-g in G type b-b
63.2 C-g in G type b-O-4 units with a-C����O62.8 C-g in G type b-5, b-1 units
60.2 C-g in G type b-O-4 units
55.6 C in Ar��OCH3
53.9 C-b in b-b units
53.4 C-b in b-5 units
40-15 CH3 and CH2 in saturated aliphatic chain
a see Figure 18.2 for structures; Ar: aromatic.
374 Aqueous Pretreatment of Plant Biomass for Biological and Chemical Conversion to Fuels and Chemicals

Hallac et al. [28] employed quantitative 13C NMR to characterize structural features of milled wood
lignin isolated from a shrub Buddleja davidii as a potential feedstock for biofuels production, and reported
that the lignin had an approximate guaiacyl/syringyl (G/S) ratio of 81:19 with no H-units observed. They
further investigated the chemical transformations of Buddleja davidii lignin during ethanol organosolv pre-
treatment using 13C NMR together with other NMR techniques, and demonstrated quantitative changes of
lignin structural features such as substantive decrease of b-O-4 linkages after the pretreatments [29]. Using13C NMR, Samuel et al. [30] observed a 36% decrease in b-O-4 linkages and an S/G ratio decrease from
0.80 to 0.53 for ball-milled lignin isolated from Alamo switchgrass after dilute acid pretreatment. Sanni-
grahi et al. investigated lignin isolated from loblolly pine before and after ethanol organosolv pretreatment
and reported a c. 50% decrease in b-O-4 linkages utilizing quantitative 13C NMR analysis, suggesting that
acid-catalyzed cleavage of b-O-4 linkages was a major mechanism for lignin cleavage [31,32].
18.3.4 HSQC Correlation Spectroscopy
Although 1D 1H and 13C NMR are very efficient tools for lignin structural analysis, these classical 1D
NMR techniques usually suffer from signal overlaps in spectra. With advancements in NMR instrumenta-
tion, these issues are now addressed with a host of 2D and 3D NMR techniques, among which HSQC is the
most commonly applied. Heteronuclear multidimensional correlation NMR experiments can not only
increase the sensitivity of 13C nuclei by polarization transfer but also separate overlapped signals which
usually occur in 1D spectra, making 1H-13C correlation methods very efficient for lignin structural analysis.
Indeed, the use of 2D NMR has been instrumental in advancing the analysis of lignin structure, especially in
discovering new lignin subunits and the presence of lignin-carbohydrate complexes such as dibenzodioxo-
cin and spirodienone structures [4,17–21]. However, it has limitations in that it is not quantitative and a
spectral overlap of lignin functionality still occurs. The application of these techniques to lignin isolated
from native as well as genetically altered plants was recently summarized by Ralph et al. [33].
HSQC is the most frequently collected 2D NMR spectrum that is used not only for structural identi-
fication but also for estimation of the relative abundance of inter-unit linkages as well as S/G ratios in
lignin. Table 18.3 summarizes chemical shifts and assignments of cross-peaks of typical inter-unit link-
ages and/or subunits in HSQC spectra of lignin when using DMSO as solvent. Although this approach
OMeDMSO
–CH3 in acetyl CAr-O
COOH
40 20 PPM6080100120140160180
CAr-C CAr-H
CβCαCγ
CγHO
Figure 18.4 Quantitative 13C NMR spectrum of a milled wood lignin isolated from a hardwood Buddleja davidii [28]. Ar:
aromatic; OMe: methoxyl; DMSO: dimethyl sulfoxide.
Plant Biomass Characterization: Application of Solution- and Solid-state NMR Spectroscopy 375

is not considered quantitative, it has been widely employed in a semi-quantitative way to offer relative
comparisons of inter-unit linkage levels in biomass lignins, such as alfalfa, eucalyptus, and poplar
[34–37]. The well-resolved a-carbon contours in various linkages are generally used for volume inte-
gration, and the relative abundance of each respective inter-unit linkage is then calculated as the
percentage of integrals of total linkages [34,37].
Pu et al. [38] recently investigated structural characteristics of lignin isolated from wild-type alfalfa,
p-coumarate 3-hydroxylase (C3H) down-regulated, and hydroxycinnamoyl CoA:shikimate/quinate hydrox-
ycinnamoyl transferase (HCT) down-regulated alfalfa transgenic lines. The HSQC spectra of lignin in wild-
type and transgenic alfalfa shown in Figures 18.5 and 18.6 illustrate 1H-13C correlation signals in aromatic
regions and aliphatic side-chain ranges, respectively. The HSQC spectra demonstrated that C3H and HCT
down-regulated alfalfa lignins showed significantly more p-hydroxyphenyl units along with a substantial
Table 18.3 Chemical shifts and assignment of 13C -1H correlation signals in
HSQC spectra of lignin [34–39].
dc/dH (ppm) Assignmenta
53.1/3.44 Cb/Hb in phenylcoumaran substructure (B)
53.6/3.03 Cb/Hb in resinol substructure (C)
55.7/3.70 C/H in methoxyl group
59.8/3.62 Cg/Hg in b-O-4 ether linkage (A)
61.7/4.09 Cg/Hg in cinnamyl alcohol (F)
62.3/4.08,3.95 Cg/Hg in dibenzodioxocin
62.8/3.76 Cg/Hg in phenylcoumaran substructure (B)
71.1/3.77, 4.13 Cg/Hg in resinol substructure (C)
71.4/4.76 Ca/Ha in b-O-4 linked to a G unit (A)
72.1/4.86 Ca/Ha in b-O-4 linked to a S unit (A)
76.0/4.81 Ca/Ha in benzodioxane
78.2/4.00 Cb/Hb in benzodioxane
81.4/5.1 Cb/Hb in spirodienone substructure
83.7/4.31 Cb/Hb in b-O-4 linked to a G unit (A)
84.2/4.69 Ca/Ha in dibenzodioxocin
84.7/4.7 Ca/Ha in spirodienone substructure
85.2/4.63 Ca/Ha in resinol substructure (C)
86.3/4.13 Cb/Hb in b-O-4 linked to a S unit (A)
86.6/4.08 Cb/Hb in dibenzodioxocin
87.0/5.52 Ca/Ha in phenylcoumaran substructure (B)
103.8/6.70 C2,6/H2,6 in syringyl units (S)
105.5/7.3 C2,6/H2,6 in oxidized syringyl (S0) units with Ca¼O
111.0/6.98 C2/H2 in guaiacyl units (G)
114.8/6.73 C3,5/H3,5 in p-hydroxyphenyl units (H)
115.1/6.72, 6.98 C5/H5 in guaiacyl units
119.1/6.80 C6/H6 in guaiacyl units
128.0/7.17 C2,6/H2,6 in p-hydroxyphenyl units
128.2/6.75 Cb/Hb in cinnamaldehyde unit (E)
128.3/6.45 Ca/Ha in cinnamyl alcohol (F)
128.3/6.25 Cb/Hb in cinnamyl alcohol (F)
130.6/7.65, 7.87 C2,6/H2,6 in p-hydroxybenzoate units (D)
153.6/7.62 Ca/Ha in cinnamaldehyde unit (E)
aG: guaiacyl; S: syringyl; S00 ¼oxidized syringyl with Ca����O; H: p-hydroxy-phenyl; A: b-O-4 ether linkage; B: b-5/a-O-4 phenylcoumaran; C: resinol (b-b);D: p-hydroxybenzoate; E: cinnamaldehyde; F: cinnamyl alcohol.
376 Aqueous Pretreatment of Plant Biomass for Biological and Chemical Conversion to Fuels and Chemicals

decrease in the intensities of syringyl and guaiacyl correlations. Compared to the wild-type plant, the C3H
and HCT transgenic lines had an increased phenylcoumaran and resinol linkages in lignins. Using HSQC
NMR, Ralph et al. [34] also characterized the structures of acetylated alfalfa lignins isolated from severely
down-regulated C3H transgenic lines. They reported structural differences in inter-unit linkage distribution
with a decrease in b-aryl ether units, which were accompanied by relatively higher levels of phenylcoumar-
ans and resinols. In addition, Ralph et al. [34] provided data for coupling and cross-coupling propensities of
p-coumaryl alcohol and p-hydroxyphenyl units in C3H-deficient alfalfa lignin and revealed that (1) b-etherunits were from G, S, and p-hydroxyphenyl but with relatively low levels of the G- (especially) and S-units,
and (2) the phenylcoumarans were almost entirely from p-hydroxyphenyl units. Moinuddin et al. [39]
investigated lignin structures of Arabidopsis thaliana COMT mutant Atomt1 using HSQC NMR and
suggested that b-O-4 linkage frequency in the lignin isolates of both the Atomt1 mutant and wild-type
line was conserved.
18.3.5 31P NMR Spectroscopy
An approach to deal with the limitations of the general 1D 1H and 13C NMR and 2D correlation NMR
techniques is to “selectively tag” specific functional groups in lignin with an NMR active nucleus through
derivatization and then analyze the derivatized lignin with NMR. Phosphorous reagents have been
employed to tag hydroxyl groups or quinone structures in lignin for determining their concentration by31P NMR [28–30,40–43]. Hydroxyl groups, especially free phenoxy groups, are among the most important
functionalities affecting physical and chemical properties of lignin. These functional groups exhibit a prom-
inent role in defining reactivity of lignin to promote cleavage of inter-unit linkages and/or oxidative degra-
dation during pretreatment processes. The traditional wet chemistry methods employed to determine
Figure 18.5 Aromatic regions of 13C / 1H HSQC NMR spectra of alfalfa ball-milled lignins [38]. G: guaiacyl; S: syringyl;
H: p-hydroxyphenyl; D: p-hydroxybenzoate; E: cinnamaldehyde; F: cinnamyl alcohol. CTR1: wild type; C3H9a: p-coumarate
3-hydroxylase (C3H) transgenic line; HCT3a: hydroxycinnamoyl CoA:shikimate/quinate hydroxycinnamoyl transferase
(HCT) transgenic line.
Plant Biomass Characterization: Application of Solution- and Solid-state NMR Spectroscopy 377

hydroxyl contents in lignin typically involve time-consuming and/or laborious multistep derivatizations
[43]. The 31P NMR method has been shown to be very effective for determining the presence of hydroxyl
groups in lignin. It can provide quantitative information in a single spectrum for various types of major
hydroxyl groups including aliphatic, carboxylic, guaiacyl, syringyl, C5-substituted phenolic hydroxyls, and
p–hydroxyphenyls in a relatively short experimental time and with small sample size requirements. The
quantitative information gained from this technique has been verified against other techniques such as GC,1H NMR, 13C NMR, Fourier transform infrared (FTIR), and wet chemistry methods during an international
“round robin” lignin study [44,45]. Compared to 1H NMR, the large range of chemical shifts for 31P
nucleus generates a better separation and resolution of signals. In addition, the 100% natural abundance of
the 31P and its high sensitivity renders 31P NMR a rapid analytical tool in comparison to 13C NMR.
The 31P NMR technique usually involves treating lignin samples with the phosphorylation reagent
2-chloro-4,4,5,5 tetramethyl-1,3,2-dioxaphospholane (TMDP) to phosphorylate the labile hydroxyl protons
in lignin according to the reaction outlined in Figure 18.7. The 31P NMR spectrum of this derivatized sam-
ple is then recorded with an internal standard such as cyclohexanol or N-hydroxy-5-norbornene-2,3-dicar-
boximide. The 31P NMR spectrum contains well-separated peaks corresponding to the various types of
hydroxyl groups present in lignin. The fact that these peaks are well separated is very important in making
it possible to distinguish between regions containing various types of hydroxyl groups and allow for their
Figure 18.6 Aliphatic regions of 13C / 1H HSQC NMR spectra of alfalfa ball-milled lignins and the identified structures [38].
A: b-O-4 ether linkage; B: phenylcoumaran (b-5/a-O-4); C: resinol (b-b); OMe: methoxyl group; D: p-hydroxybenzoate; E: cinna-
maldehyde; F: cinnamyl alcohol; R¼H or C; CTR1: wild type; C3H9a: p-coumarate 3-hydroxylase (C3H) transgenic line; HCT3a:
hydroxycinnamoyl CoA:shikimate/quinate hydroxycinnamoyl transferase (HCT) transgenic line .
378 Aqueous Pretreatment of Plant Biomass for Biological and Chemical Conversion to Fuels and Chemicals

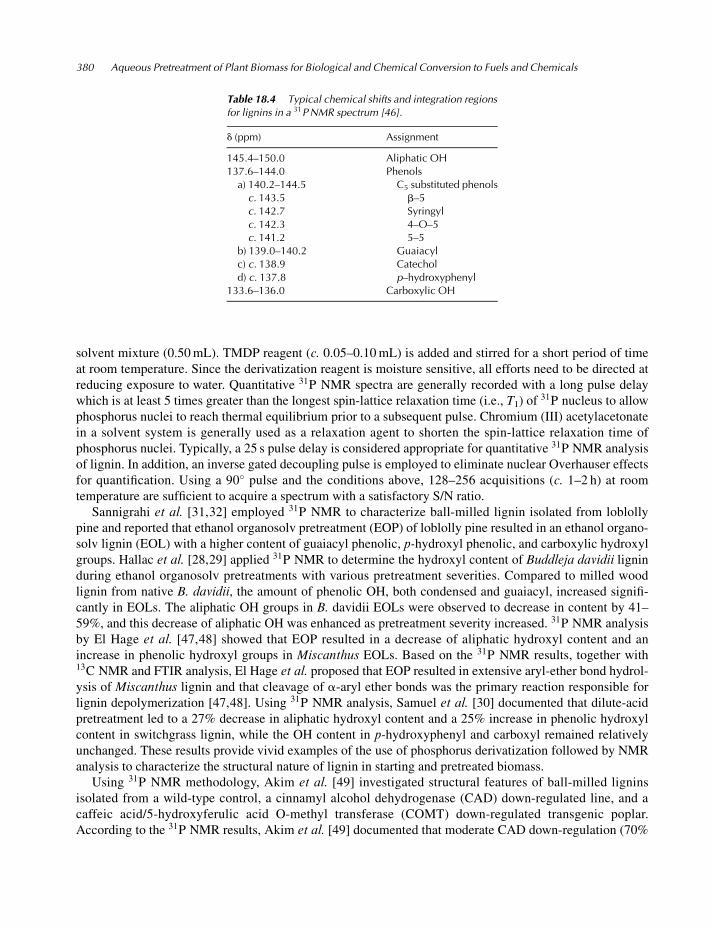
accurate integration. Figure 18.8, which is a 31P NMR spectrum of a hardwood lignin derivatized with
2-chloro-4,4,5,5 tetramethyl-1,3,2-dioxaphospholane, illustrates the well-separated signals arising from the
various hydroxyl groups in lignin. A compilation of typical assignments and chemical shifts/integration
ranges of hydroxyl groups in lignin using TMDP/31P NMR analysis is shown in Table 18.4 [46].
For 31P NMR analysis of lignin, the solvent employed is usually a mixture of anhydrous pyridine and
deuterated chloroform (c. 1.6 : 1.0 v/v) containing a relaxation agent (i.e., chromium (III) acetylacetonate)
and an internal standard. An accurately weighed dried lignin sample (10–25mg) is dissolved in a NMR
+
O
O
PCl
O
OP
CDCl3
Pyridine
Carboxylic hydroxyl
Guaiacyl p-hydroxyphenyl C5 substituted Aliphatic hydroxyl
+ HClLignin OH OLignin
O
OPOR
O
OP
O
O
R
OMe
O
O OP
OMe
O
O OP
MeO
O
O OP
OMe
O
O OP
R'
6 2
35
1
4
Figure 18.7 Reaction of labile hydroxyls present in lignins with 2-chloro-4,4,5,5 tetramethyl-1,3,2-dioxaphospholane.
R: Lignin side-chain; R0: lignin unit.
Figure 18.8 Quantitative 31P NMR spectrum of a hardwood lignin derivatized with TMDP using N-hydroxy-5-norbornene-
2,3-dicarboximide as internal standard.
Plant Biomass Characterization: Application of Solution- and Solid-state NMR Spectroscopy 379
solvent mixture (0.50mL). TMDP reagent (c. 0.05–0.10mL) is added and stirred for a short period of time
at room temperature. Since the derivatization reagent is moisture sensitive, all efforts need to be directed at
reducing exposure to water. Quantitative 31P NMR spectra are generally recorded with a long pulse delay
which is at least 5 times greater than the longest spin-lattice relaxation time (i.e., T1) of31P nucleus to allow
phosphorus nuclei to reach thermal equilibrium prior to a subsequent pulse. Chromium (III) acetylacetonate
in a solvent system is generally used as a relaxation agent to shorten the spin-lattice relaxation time of
phosphorus nuclei. Typically, a 25 s pulse delay is considered appropriate for quantitative 31P NMR analysis
of lignin. In addition, an inverse gated decoupling pulse is employed to eliminate nuclear Overhauser effects
for quantification. Using a 90� pulse and the conditions above, 128–256 acquisitions (c. 1–2 h) at room
temperature are sufficient to acquire a spectrum with a satisfactory S/N ratio.
Sannigrahi et al. [31,32] employed 31P NMR to characterize ball-milled lignin isolated from loblolly
pine and reported that ethanol organosolv pretreatment (EOP) of loblolly pine resulted in an ethanol organo-
solv lignin (EOL) with a higher content of guaiacyl phenolic, p-hydroxyl phenolic, and carboxylic hydroxyl
groups. Hallac et al. [28,29] applied 31P NMR to determine the hydroxyl content of Buddleja davidii lignin
during ethanol organosolv pretreatments with various pretreatment severities. Compared to milled wood
lignin from native B. davidii, the amount of phenolic OH, both condensed and guaiacyl, increased signifi-
cantly in EOLs. The aliphatic OH groups in B. davidii EOLs were observed to decrease in content by 41–
59%, and this decrease of aliphatic OH was enhanced as pretreatment severity increased. 31P NMR analysis
by El Hage et al. [47,48] showed that EOP resulted in a decrease of aliphatic hydroxyl content and an
increase in phenolic hydroxyl groups in Miscanthus EOLs. Based on the 31P NMR results, together with13C NMR and FTIR analysis, El Hage et al. proposed that EOP resulted in extensive aryl-ether bond hydrol-
ysis of Miscanthus lignin and that cleavage of a-aryl ether bonds was the primary reaction responsible for
lignin depolymerization [47,48]. Using 31P NMR analysis, Samuel et al. [30] documented that dilute-acid
pretreatment led to a 27% decrease in aliphatic hydroxyl content and a 25% increase in phenolic hydroxyl
content in switchgrass lignin, while the OH content in p-hydroxyphenyl and carboxyl remained relatively
unchanged. These results provide vivid examples of the use of phosphorus derivatization followed by NMR
analysis to characterize the structural nature of lignin in starting and pretreated biomass.
Using 31P NMR methodology, Akim et al. [49] investigated structural features of ball-milled lignins
isolated from a wild-type control, a cinnamyl alcohol dehydrogenase (CAD) down-regulated line, and a
caffeic acid/5-hydroxyferulic acid O-methyl transferase (COMT) down-regulated transgenic poplar.
According to the 31P NMR results, Akim et al. [49] documented that moderate CAD down-regulation (70%
Table 18.4 Typical chemical shifts and integration regions
for lignins in a 31PNMR spectrum [46].
d (ppm) Assignment
145.4–150.0 Aliphatic OH
137.6–144.0 Phenols
a) 140.2–144.5 C5 substituted phenols
c. 143.5 b–5
c. 142.7 Syringyl
c. 142.3 4–O–5
c. 141.2 5–5
b) 139.0–140.2 Guaiacyl
c) c. 138.9 Catechol
d) c. 137.8 p–hydroxyphenyl
133.6–136.0 Carboxylic OH
380 Aqueous Pretreatment of Plant Biomass for Biological and Chemical Conversion to Fuels and Chemicals

deficient) resulted in no drastic changes in structures of poplar lignin. More severe CAD depletion for
6-month old poplar led to a slight increase in the amount of condensed phenolic hydroxyls, which
the authors suggested was indicative of a higher degree of cross-linked lignin. Compared to the wild-type
control, COMT down-regulation (90% deficient) yielded a poplar lignin with a lower content of syringyl
and aliphatic OH group as well as an increased guaiacyl phenolic OH amount, while p-hydroxyphenyl and
carboxylic OH content was observed to remain unchanged after COMT down-regulation [49].
18.4 Solid-state NMR Characterization of Plant Cellulose
18.4.1 CP/MAS 13C NMR Analysis of Cellulose
Since the early 1980s, the solid-state CP/MAS 13C NMR technique has been widely applied for investiga-
tion of structural features of cellulose, providing not only information of crystallinity index but also enabling
a thorough investigation of the ultrastructure of cellulose [50,51]. Cellulose is a linear polymer made up of
b-D glucopyranose units covalently linked by 1! 4 glycosidic bonds, with the degree of polymerization
varying with the biomass source [10,52]. Figure 18.9 illustrates the molecular structure of cellulose [52].
The large number of hydroxyl groups on cellulose chains form intra- and inter-molecular hydrogen
bonds, resulting in the crystalline structure of cellulose. Cellulose also has a less-ordered structure called
amorphous cellulose. Native crystalline cellulose (cellulose I) has been shown to co-exist in the form of
two allomorphs (i.e., Ia and Ib) [50]. The degree of cellulose crystallinity has been studied over the years
for many species, and a term called crystallinity index (CrI) is widely used to represent the relative propor-
tion of crystalline cellulose to the total cellulose present in a material. The two most common techniques
used to measure this value are X-ray diffraction (XRD) and solid-state CP/MAS 13C NMR. XRD is based
on the concept that the X-ray scattering can be divided into two components due to crystalline and amor-
phous structures [53]. Table 18.5 presents the degree of crystallinity of several cellulose samples measured
by XRD [10,11,53].
The cellulose sample for solid-state CP/MAS 13C NMR is usually ground and packed into a MAS rotor
which is then inserted into a MAS probe and spun at a frequency of 5–10 kHz. CP/MAS 13C NMR measure-
ments are generally carried out with a 90� proton pulse, 0.8–2.0ms contact pulse, 4 s recycle delay, and
2024–8192 scans for a good S/N ratio. The spectra are usually recorded on moist samples (c. 30–60% water
content) to increase signal resolution. The solid-state CP/MAS 13C NMR technique to measure the crystal-
linity of cellulose is based on the intensity of the two peaks in the C-4 region (d c. 80–92 ppm): the first peak
corresponds to the crystalline structure (d¼ 86–92 ppm), whereas the amorphous region is located in the
range of d¼ 80–86 ppm. This method is referred to as the C-4 peak separation NMR technique. In order for
this technique to be accurate, hemicelluloses and lignin must be removed from the cellulose samples
because they interfere with the area of the amorphous region [54]. Figure 18.10 shows a typical CP/MAS13C NMR spectrum of a cellulose sample isolated from switchgrass. Cellulose crystallinity values for vari-
ous lignocellulosic materials measured by this method are summarized in Table 18.6 [7,28,31,55,56].
O
OH
OH
HO O
HOOH
O
OH
O
HOOH
HO
O
OHO
O
OH
OH
HO OH
12
3
45
6123
45
6
n
Figure 18.9 Molecular structure of cellulose [52].
Plant Biomass Characterization: Application of Solution- and Solid-state NMR Spectroscopy 381

Table 18.5 Crystallinity index of some cellulosic materials
determined by XRD [10,11,53].
Sample Crystallinity index (%)
Cotton linters 50–63
Wood pulp 50–70
Viscose rayon 27–40
Regenerated cellulose film 40–45
Avicel 50–60
Cotton 81–95
Algal cellulose >80
Bacterial cellulose 65–79
Ramie 44–47
Figure 18.10 CP/MAS 13C -NMR spectra of cellulose isolated from switchgrass.
Table 18.6 Crystallinity index of some cellulosic materials
measured by C-4 peak separation NMR technique [7,28,31,55,56].
Sample Crystallinity index (%)
Hybrid poplar 63
Loblolly pine 63
Switchgrass alamo 44
Buddleja davidii 55
Spruce 48
Birch 36
382 Aqueous Pretreatment of Plant Biomass for Biological and Chemical Conversion to Fuels and Chemicals

In a recent study by Park et al., a new NMR technique to measure cellulose crystallinity was introduced
[57]. This novel method is based on digitally subtracting the spectrum of standard amorphous cellulose
from the original spectrum. The authors believe that this method is straightforward, easier than XRD and
C-4 peak separation methods, and could be applied to cellulose with any level of crystallinity [57].
The current interest in determining the degree of crystallinity of cellulose is to correlate the relationship
between changes in CrI during pretreatment to the efficiency of enzymatic hydrolysis in the biological pro-
cess of converting cellulosic biomass to biofuels. It is believed that cellulose crystallinity is a key property
contributing to biomass recalcitrance [58]. Lowering cellulose crystallinity should therefore make it more
readily digestible by cellulase. However, it has been suggested in various studies that changes in crystallin-
ity after pretreatment and its effect on the enzymatic hydrolysis are related to the nature of the original
material as well as the pretreatment technologies employed. Therefore, crystallinity index itself may not
provide enough information to explain enzymatic hydrolysis behavior. Greater importance needs to be
assigned to the ultrastructure of cellulose and not just to crystallinity in general.
18.4.2 Cellulose Crystallinity
In the realm of the utilization of cellulose as a material and as a feedstock for biofuels production, many
studies have examined the effect of pretreatment on the crystallinity of cellulose. Table 18.7 [56–63] sum-
marizes the CrI of cellulose of various untreated and pretreated biomass after some pretreatment processes
such as ammonia fiber expansion (AFEX), ammonia recycled percolation (ARP), controlled pH, dilute sul-
furic acid, lime, SO2, ozone (O3), carbon dioxide explosion (CE), alkaline explosion (AE), and organosolv.
As to be expected, each pretreatment had a different effect on cellulose crystallinity. Some pretreat-
ment technologies caused a reduction in cellulose crystallinity, some showed no effect on crystallinity,
and others exhibited an increase in crystallinity. Low-pH pretreatments generally enriched biomass crys-
tallinity, while all high-pH pretreatments had less effect and even reduced biomass crystallinity in some
instances. It also appears that the effect of the same pretreatment is biomass-dependent. For instance,
controlled-pH pretreatment (i.e., controlling the pH at near neutral conditions) reduced the crystallinity
index of corn stover, while it caused an increase in crystallinity of poplar. In general, dilute acid, lime,
CO2 explosion, alkaline explosion, and SO2 pretreatments increased cellulose crystallinity due to the fact
that amorphous cellulose degrades more easily than the more stable crystalline cellulose during pretreat-
ment. Pretreatments such as AFEX, ARP, and ethanol organosolv are capable of reducing the crystallinity
of cellulose, suggesting possible decrystallization of cellulose. Furthermore, the resulting crystallinity of
pretreated biomass depends on the pretreatment conditions employed. Table 18.8 shows that lodgepole
pine cellulose crystallinity increased when the pretreatment severity increased from condition set 1 to 3,
causing an enrichment in the crystalline form of cellulose due to selective hydrolysis of amorphous cellu-
lose during pretreatment [64].
Since cellulose crystallinity is thought to be a key property contributing to plant recalcitrance, many
studies have focused on establishing a correlation between crystallinity and enzymatic hydrolysis of cellu-
lose. A study by Jeoh et al. demonstrated the effect of cellulose crystallinity on cellulase accessibility [58].
Amorphous cellulose samples were prepared from Avicel and filter paper as follows. Cellulose was dis-
solved in a dimethylsulfoxide-paraformaldehyde solution, and then regenerated by slow addition of the cel-
lulose solution to a solution of 0.2M sodium alkoxide in methanol/i-propanol (1 : 1). This procedure has
been demonstrated to produce amorphous cellulose without altering the degree of polymerization (DP) and
reducing end-group concentration of the starting cellulose [58,65]. The resulting amorphous forms of cellu-
lose were found to be significantly more digestible by cellulase than the original crystalline forms. For both
Avicel and filter paper, the extent of cellulose hydrolysis increased from 10% to 80% for crystalline and
amorphous forms, respectively [58]. Specifically, the bound cellulase concentrations on the amorphous
Plant Biomass Characterization: Application of Solution- and Solid-state NMR Spectroscopy 383

Table 18.7 Crystallinity index of several untreated and pretreated biomass cellulose using
various pretreatment technologies.
Biomass Pretreatment Crystallinity index (%)
Corn stovera, [59] — 50.3
Ammonia fiber expansion 36.3
Ammonia recycled percolation 25.9
Controlled pH 44.5
Dilute Acid 52.5
Lime 56.2
Poplara, [59] — 49.9
Ammonia fiber expansion 47.9
Ammonia recycled percolation 49.5
Controlled pH 54.0
Dilute acid 50.6
Lime 54.5
SO2 56.5
Bagassea, [60] — 37
O3 38
CO2 explosion 57
Alkaline explosion 62
Wheat strawa, [60] — 35
O3 34
CO2 explosion 56
Alkaline explosion 53
Eucalyptus regnans a, [60] — 37
O3 40
CO2 explosion 53
Pinus radiata a, [60] — 34
O3 36
Switchgrassa, [61] — 46.1
Lime 51.9
Loblolly pineb, [31,62] — 62.5
Dilute acid 69.9
Ethanol organosolv 53
Buddleja davidii b, [63] — 55
Ethanol organosolv 49
aCrI measured by X-ray diffraction.bCrI measured by CP/MAS 13C NMR.
Table 18.8 Crystallinity index of ethanol-organosolv-pretreated substrates prepared from
lodgepole pine under various conditions.
Condition Temperature
(�C)Time
(min)
Sulfuric acid
dosage (%)
Concentration
of ethanol (%)
Crystallinity
index (%)
1 170 60 0.76 65 75
2 170 60 1.10 65 78
3 180 60 1.10 65 85
384 Aqueous Pretreatment of Plant Biomass for Biological and Chemical Conversion to Fuels and Chemicals

forms of both filter paper and Avicel were significantly higher than on the crystalline forms (i.e.,
0.1mmoles/g of remaining cellulose for the crystalline form and 1.5mmoles/g of remaining cellulose for
the amorphous form) [58]. The maximum extents of binding on the amorphous forms increased by a factor
of 15 over that of the original forms. The change in crystallinity of the cellulose samples may therefore have
allowed increased access to cellulase [58]. It could therefore be inferred that the increased access may
have contributed to the increased cellulose hydrolysis rates observed. Another study by Zhu et al. illustrated
the relationship between biomass digestibility and crystallinity. Hybrid poplar was treated with varying
amounts of peracetic acid and KOH to generate samples with different crystallinity [66]. The results clearly
indicated that the enzymatic digestibility of the biomass increased with decreasing biomass crystallinity,
suggesting that amorphous cellulose is more accessible to enzymatic digestibility.
18.4.3 Cellulose Ultrastructure
To further understand the effects of pretreatments on biomass enzymatic digestibility, the changes in the
ultrastructure of cellulose and how it is affected by pretreatment need to be investigated. The ultrastructure
of cellulose has long been studied by CP/MAS 13C NMR. Atalla and VanderHart were among the first to
apply this NMR technique and concluded that native cellulose in plants has two crystalline allomorphs:
cellulose Ia and cellulose Ib [50]. Cellulose Ia, a one-chain triclinic unit cell, is the dominant form in bacte-
rial and algal cellulose; cellulose Ib, a monoclinic two-chain unit cell, is dominant in higher plants such as
cotton, ramie, and wood [67]. By annealing, the meta-stable cellulose Ia can be converted to the thermo-
dynamically more stable cellulose Ib [68]. Nishiyama et al. proposed that slippage of the glucan chains is
the most likely mechanism for conversion of cellulose Ia to cellulose Ib [69]. Solid-state CP/MAS 13C NMR
of cellulose has been shown to be a convenient analytical technique to characterize several other forms of
cellulose such as para-crystalline cellulose, and two non-crystalline forms: amorphous cellulose at accessi-
ble and inaccessible fibril surfaces [54,67,70,71]. para-Crystalline cellulose is the form that is less ordered
than cellulose Ia and cellulose Ib, but more ordered than amorphous cellulose [67]. Accessible fibril sur-
faces are those in contact with water/solvent, while the inaccessible fibril surfaces are fibril-fibril contact
surfaces and surfaces resulting from distortions in the fibril interior [31]. In order to analyze and quantify
these various crystalline allomorphs and amorphous domains, Larsson et al. developed a model and meth-
odology based on non-linear spectral fitting with a combination of Lorentzian and Gaussian functions
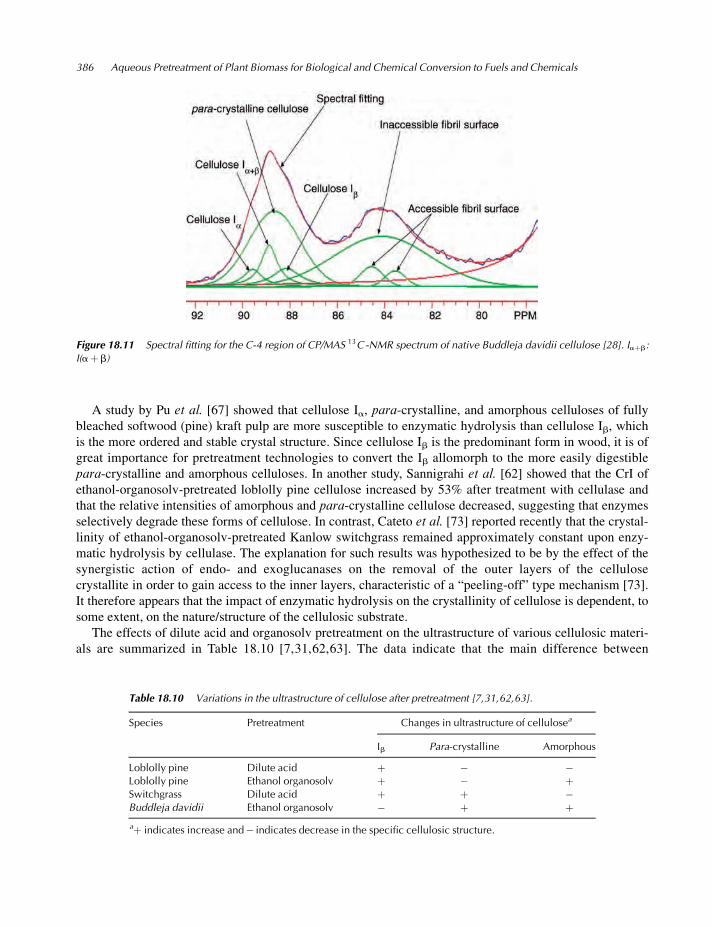
[70,72]. Figure 18.11 shows the spectral fitting of C-4 region of the solid-state CP/MAS 13C NMR spectrum
of cellulose isolated from Buddleja davidii, and the assignments of signals and fitting parameters are pre-
sented in Table 18.9 [28].
Table 18.9 Assignments of signals in the C-4 region of CP/MAS 13C NMR spectrum obtained from Buddleja davidii cellulose.
Assignments Chemical shift (ppm) FWHHa (Hz) Intensity (%) Line type
Cellulose Ia 89.6 96 4.2 Lorentz
Cellulose Iaþb 88.9 85 8.7 Lorentz
Para-crystalline cellulose 88.7 258 32.9 Gauss
Cellulose Ib 88.2 142 6.5 Lorentz
Accessible fibril surface 84.6 116 3.9 Gauss
Inaccessible fibril surface 84.1 482 41.1 Gauss
Accessible fibril surface 83.6 101 2.7 Gauss
a FWHH: Full width at half-height.
Plant Biomass Characterization: Application of Solution- and Solid-state NMR Spectroscopy 385
A study by Pu et al. [67] showed that cellulose Ia, para-crystalline, and amorphous celluloses of fully
bleached softwood (pine) kraft pulp are more susceptible to enzymatic hydrolysis than cellulose Ib, which
is the more ordered and stable crystal structure. Since cellulose Ib is the predominant form in wood, it is of
great importance for pretreatment technologies to convert the Ib allomorph to the more easily digestible
para-crystalline and amorphous celluloses. In another study, Sannigrahi et al. [62] showed that the CrI of
ethanol-organosolv-pretreated loblolly pine cellulose increased by 53% after treatment with cellulase and
that the relative intensities of amorphous and para-crystalline cellulose decreased, suggesting that enzymes
selectively degrade these forms of cellulose. In contrast, Cateto et al. [73] reported recently that the crystal-
linity of ethanol-organosolv-pretreated Kanlow switchgrass remained approximately constant upon enzy-
matic hydrolysis by cellulase. The explanation for such results was hypothesized to be by the effect of the
synergistic action of endo- and exoglucanases on the removal of the outer layers of the cellulose
crystallite in order to gain access to the inner layers, characteristic of a “peeling-off” type mechanism [73].
It therefore appears that the impact of enzymatic hydrolysis on the crystallinity of cellulose is dependent, to
some extent, on the nature/structure of the cellulosic substrate.
The effects of dilute acid and organosolv pretreatment on the ultrastructure of various cellulosic materi-
als are summarized in Table 18.10 [7,31,62,63]. The data indicate that the main difference between
Figure 18.11 Spectral fitting for the C-4 region of CP/MAS 13C -NMR spectrum of native Buddleja davidii cellulose [28]. Iaþb:
I(aþb)
Table 18.10 Variations in the ultrastructure of cellulose after pretreatment [7,31,62,63].
Species Pretreatment Changes in ultrastructure of cellulosea
Ib Para-crystalline Amorphous
Loblolly pine Dilute acid þ � �Loblolly pine Ethanol organosolv þ � þSwitchgrass Dilute acid þ þ �Buddleja davidii Ethanol organosolv � þ þaþ indicates increase and� indicates decrease in the specific cellulosic structure.
386 Aqueous Pretreatment of Plant Biomass for Biological and Chemical Conversion to Fuels and Chemicals
pretreatments is the ability of ethanol organosolv pretreatment to increase the amorphous regions of pine
and Buddleja davidii cellulose, which could possibly improve enzymatic hydrolysis. Dilute-acid pretreat-
ment increased cellulose Ib, an observation that can be explained by the thermal conversion of cellulose Iato the more stable cellulose Ib, or simply an enrichment in the crystalline structure after hydrolysis of the
amorphous structures. The results clearly show that the variations in cellulose ultrastructure are pretreat-
ment dependent and related to the nature of the origin of the cellulosic material.
18.5 Future Perspectives
The solution- and solid-state NMR techniques presented in this chapter offer powerful and effective tools
for analysis of lignin and cellulose for biomass characterization. Given the importance and need for thor-
ough analysis of the fundamental structures of plant biomass as well as its conversion chemistry in aqueous
pretreatments for biological and chemical conversion to fuels and chemicals, these methods can and will
continue to have broad applicability for researchers involved in biomass conversion to second- and third-
generation biofuels in the future.
Acknowledgements
This work was supported and performed as part of the BioEnergy Science Center (BESC). The BioEnergy
Science Center is a US Department of Energy Bioenergy Research Center supported by the Office of
Biological and Environmental Research in the DOE Office of Science.
References
1. Yang, B. and Wyman, C.E. (2008) Pretreatment: the key to unlocking low-cost cellulosic ethanol. Biofuels, Bio-
products, and Biorefining, 2, 26–40.
2. Ralph, J. and Landucci, L.L. (2010) NMR of lignins, in Lignin and Lignans (eds C. Heitner, D.R. Dimmel, and J.A.
Schmidt), CRC Press, Boca Raton, Fla, pp. 137–244.
3. Anterola, A.M. and Lewis, N.G. (2002) Trends in lignin modification: a comprehensive analysis of the effects of
genetic manipulations/mutations on lignification and vascular integrity. Phytochemistry, 61 (3), 221–294.
4. Balakshin, M.Y., Capanema, E.A., and Chang, H.M. (2007) MWL fraction with a high concentration of lignin-
carbohydrate linkages: isolation and 2D NMR spectroscopic analysis. Holzforschung, 61, 1–7.
5. Robert, D. (1992) Carbon-13 nuclear magnetic resonance spectroscopy, in Methods in Lignin Chemistry (eds S.Y.
Lin and C.W. Dence), Springer-Verlag, New York, NY, pp. 250–273.
6. Ludwig, C., Nist, B., and McCarthy, J.L. (1964) The high resolution nuclear magnetic resonance spectroscopy of
protons in acetylated lignins. Journal of the American Chemical Society, 86, 1196–1202.
7. Samuel, R., Pu, Y., Foston, M., and Ragauskas, A.J. (2010) Solid-state NMR characterization of switchgrass cellu-
lose after dilute acid pretreatment. Biofuels, 1, 85–90.
8. Lundquist, K. (1992) Proton (1H) NMR spectroscopy, in Methods in Lignin Chemistry (eds S.Y. Lin and C.W.
Dence) Springer-Verlag, New York, NY, pp. 242–249.
9. Ragauskas, A.J., Williams, C.K., Davison, B.H. et al. (2006) The path forward for biofuels and biomaterials.
Science, 311, 484–489.
10. Klemm, D., Heublein, B., Fink, H.-B., and Bohn, A. (2005) Cellulose: Fascinating biopolymer and sustainable raw
material. Angewandte Chemie-International Edition, 44, 3358–3393.
11. Pu, Y., Zhang, D., Singh, P.M., and Ragauskas, A.J. (2007) The new forestry biofuels sector. Biofuels, Bioproducts,
and Biorefining, 2, 58–73.
12. Harris, P.J. and Stone, B.A. (2008) Chemistry and molecular organization of plant cell walls, in Biomass Recalci-
trance: Deconstructing the Plant Cell Wall for Bioenergy (ed. M.E. Himmel), Blackwell, pp. 61–93.
Plant Biomass Characterization: Application of Solution- and Solid-state NMR Spectroscopy 387

13. Sj€ostr€om, E. (1993)Wood Chemistry: Fundamentals and Applications, 2nd edn, Academic Press, New York, NY.
14. Boerjan, W., Ralph, J., and Baucher, M. (2003) Lignin biosynthesis. Annual Review of Plant Biology, 54, 519–546.
15. Davin, L.B. and Lewis, N.G. (2005) Lignin primary structures and dirigent sites. Current Opinion in Biotechnology,
16, 407–415.
16. Chakar, F.S. and Ragauskas, A.J. (2004) Review of current and future softwood kraft lignin process chemistry.
Industrial Crops and Products, 20, 131–141.
17. Brunow, G., Kilpelainen, I., Sipila, J. et al. (1998) Oxidative coupling of phenols and the biosynthesis of lignin, in
ACS Symposium Series, 697 (Lignin and Lignan Biosynthesis), American Chemical Society.
18. Karhunen, P., Rummakko, P., Sipila, J., and Brunow, G. (1995) Dibenzodioxocins: a novel type of linkage in soft-
wood lignins. Tetrahedron Letters, 36, 169–170.
19. Kukkola, E.M., Koutaniemi, S., Pollanen, E. et al. (2004) The dibenzodioxocin lignin substructure is abundant in
the inner part of the secondary wall in Norway spruce and silver birch xylem. Planta, 218, 497–500.
20. Zhang, L. and Gellerstedt, G. (2001) NMR observation of a new lignin structure, a spiro-dienone. Chemical
Communications, 24, 2744–2745.
21. Zhang, L., Gellerstedt, G., Ralph, J., and Lu, F. (2006) NMR studies on the occurrence of spirodienone structures in
lignins. Journal of Wood Chemistry and Technology, 26, 65–79.
22. Bjorkman, A. (1954) Isolation of lignin from finely divided wood with neutral solvents. Nature, 174, 1057–1058.
23. Chang, H.M., Cowling, E.B., Brown, W. et al. (1975) Comparative studies on cellulolytic enzyme lignin and milled
wood lignin of sweetgum and spruce. Holzforschung, 29, 153–159.
24. Wu, S. and Argyropoulos, D.S. (2003) An improved method for isolating lignin in high yield and purity. Journal of
Pulp and Paper Science, 29, 235–240.
25. Li, S. and Lundquist, K. (1994) A new method for the analysis of phenolic groups in lignins by 1H-NMR spectrom-
etry. Nordic Pulp and Paper Research Journal, 3, 191–195.
26. Drumond, M., Aoyama, M., Chen, C.-L., and Robert, D. (1989) Substituent effects on C-13 chemical shifts
of aromatic carbons in biphenyl type lignin model compounds. Journal of Wood Chemistry and Technology,
9, 421–411.
27. Pan, X., Lachenal, D., Neirinck, V., and Robert, D. (1994) Structure and reactivity of spruce mechanical pulp
lignins IV: 13C-NMR spectral studies of isolated lignins. Journal of Wood Chemistry and Technology, 14,
483–506.
28. Hallac, B.B., Sannigrahi, P., Pu, Y. et al. (2009) Biomass characterization of Buddleja davidii: A potential feedstock
for biofuel production. Journal of Agricultural and Food Chemistry, 57, 1275–1281.
29. Hallac, B.B., Pu, Y., and Ragauskas, A.J. (2010) Chemical transformations of Buddleja davidii lignin during etha-
nol organosolv pretreatment. Energy & Fuels, 24, 2723–2732.
30. Samuel, R., Pu, Y., Raman, B., and Ragauskas, A.J. (2010) Structural characterization and comparison of switch-
grass lignin before and after dilute acid pretreatment. Applied Biochemistry and Biotechnology, 162, 62–74.
31. Sannigrahi, P., Ragauskas, A.J., and Miller, S.J. (2008) Effects of two-stage dilute acid pretreatment on the structure
and composition of lignin and cellulose in loblolly pine. Bioenergy Research, 1, 205–214.
32. Sannigrahi, P., Ragauskas, A.J., and Miller, S.J. (2010) Lignin structural modifications resulting from ethanol orga-
nosolv treatment of loblolly pine. Energy & Fuels, 24, 683–689.
33. Ralph, J., Marita, J.M., Ralph, S.A. et al. (1999) Solution state NMR of lignins, in Advances in Lignocellulosics
Characterization, Tappi Press, Atlanta, GA.
34. Ralph, J., Akiyama, T., Kim, H. et al. (2006) Effects of coumarate 3-hydroxylase down-regulation on lignin struc-
ture. The Journal of Biological Chemistry, 281, 8843–8853.
35. Rencoret, J., Marques, G., Gutierrez, A. et al. (2008) Structural characterization of milled wood lignins from differ-
ent eucalypt species. Holzforschung, 62, 514–526.
36. del R�ıo, J.C., Rencoret, J., Marques, G. et al. (2008) Highly acylated (acetylated and/or p-coumaroylated) native
lignins from diverse herbaceous plants. Journal of Agricultural and Food Chemistry, 56, 9525–9534.
37. Stewart, J.J., Akiyama, T., Chapple, C. et al. (2009) The effects on lignin structure of overexpression of ferulate
5-hydroxylase in hybrid poplar. Plant Physiology, 150, 621–635.
38. Pu, Y., Chen, F., Ziebell, A. et al. (2009) NMR characterization of C3H and HCT down-regulated alfalfa lignin.
Bioenergy Research, 2, 198–208.
388 Aqueous Pretreatment of Plant Biomass for Biological and Chemical Conversion to Fuels and Chemicals

39. Moinuddin, S.G.A., Jourdes, M., Laskar, D.D. et al. (2010) Insights into lignin primary structure and deconstruction
from Arabidopsis thaliana COMT (caffeic acid O-methyl transferase) mutant Atomt1. Organic and Biomolecular
Chemistry, 8, 3928–3946.
40. Zawadzki, M., Runge, T.M., and Ragauskas, A.J. (2000) Facile detection of ortho- and para-quinone structures in
residual kraft lignin by phosphorus-31 NMR spectroscopy. Journal of Pulp and Paper Science, 26, 102–106.
41. Granata, A. and Argyropoulos, D.S. (1995) 2-Chloro-4,4,5,5-tetramethyl-1,3,2-dioxaphospholane, a reagent for the
accurate determination of the uncondensed and condensed phenolic moieties in lignins. Journal of Agricultural and
Food Chemistry, 43, 1538–1544.
42. Argyropoulos, D.S. (2010) Heteronuclear NMR Spectroscopy of Lignins, in Lignin & Lignans; Advances in Chem-
istry (eds C. Heitner, D. Dimmel, and J. Schmidt), CRC Press, pp. 245–265.
43. Lai, Y.-Z. (1992) Determination of phenolic hydroxyl groups, in Methods in Lignin Chemistry (eds S.Y. Lin and C.
W. Dence), Springer-Verlag, New York, NY, pp. 423–434.
44. Faix, O., Andersons, B., Argyropoulos, D.S., and Robert, D. (1995) Quantitative determination of hydroxyl and
carbonyl groups of lignins – an overview. Proceedings of 8th International Symposium on Wood and Pulping
Chemistry, Gummerus Kirjapaino Oy, Jyvaskyla, Finland, Vol. 1, pp. 559–566.
45. Faix, O., Argyropoulos, D.S., Robert, D., and Neirinck, V. (1994) Determination of hydroxyl groups in lignins
evaluation of 1H-, 13C-, 31P-NMR, FTIR and wet chemical methods. Holzforschung, 48, 387–394.
46. Zawadzki, M. (1999) Quantitative determination of quinone chromophore changes during ECF bleaching of kraft
pulp. Ph.D. thesis, Institute of Paper Science and Technology, Atlanta.
47. El Hage, R., Brosse, N., sannigrahi, P., and Ragauskas, A. (2010) Effects of process severity on the chemical struc-
ture of Miscanthus ethanol organosolv lignin. Polymer Degradation and Stability, 95, 997–1003.
48. El Hage, R., Brosse, N., Chrusciel, L. et al. (2009) Characterization of milled wood lignin and ethanol organosolv
lignin from miscanthus. Polymer Degradation and Stability, 94, 1632–1638.
49. Akim, L.G., Argyropoulos, D.S., Jouanin, L. et al. (2001) Quantitative phosphorus-31 NMR spectroscopy of lignins
from transgenic poplars. Holzforschung, 55, 386–390.
50. Atalla, R.H. and VanderHart, D.L. (1984) Native cellulose: A composite of two distinct crystalline forms. Science,
223, 283–285.
51. Atalla, R.H. (1999) Celluloses, in Comprehensive Natural Products Chemistry: Carbohydrates and their Deriva-
tives Including Tannins, Cellulose, and Related Lignins, vol 3 (ed. B.M. Pinto), Elsevier, Amsterdam, pp. 529–598.
52. Hallac, B.B. and Ragauskas, A.J. (2011) Analyzing cellulose degree of polymerization and its relevancy to cellu-
losic ethanol. Biofuels, Bioproducts, and Biorefining, 5, 215–225.
53. Zhang, Y.P. and Lynd, L.R. (2004) Toward an aggregated understanding of enzymatic hydrolysis of cellulose: Non-
complexed cellulase systems. Biotechnology and Bioengineering, 88, 797–824.
54. Wickholm, K., Larsson, P.T., and Iversen, T. (1998) Assignment of non-crystalline forms in cellulose I by CP/MAS
carbon-13 NMR spectroscopy. Carbohydrate Research, 312, 123–129.
55. Sannigrahi, P., Ragauskas, A.J., and Tuskan, G.A. (2010) Poplar as a feedstock for biofuels: A review of composi-
tional characteristics. Biofuels, Bioproducts, and Biorefining, 4, 209–226.
56. Foston, M., Hubbell, C.A., Davis, M., and Ragauskas, A.J. (2009) Variations in cellulosic ultrastructure of poplar.
Bioenergy Research, 2, 193–197.
57. Park, S., Johnson, D.K., Ishizawa, C.I. et al. (2009) Measuring the crystallinity index of cellulose by solid state 13C
nuclear magnetic resonance. Cellulose, 16, 641–647.
58. Jeoh, T., Ishizawa, C.I., Davis, M.F., Himmel, M.E., Adney, W.S. and Johnson, D.K. (2007) Cellulase digestibility
of pretreated biomass is limited by cellulose accessibility. Biotechnology and Bioengineering, 98, 112–122.
59. Kumar, R., Mago, G., Balan, V., and Wymand, C.E. (2009) Physical and chemical characterizations of corn stover
and poplar solids resulting from leading pretreatment technologies. Bioresource Technology, 100, 3948–3962.
60. Puri, V.P. (1984) Effect of crystallinity and degree of polymerization of cellulose on enzymatic saccharification.
Biotechnology and Bioengineering, 26, 1219–1222.
61. Chang, V.S. and Holtzapple, M.T. (2000) Fundamental factors affecting biomass enzymatic reactivity. Applied Bio-
chemistry and Biotechnology, 84–86, 5–37.
62. Sannigrahi, P., Miller, S.J., and Ragauskas, A.J. (2010) Effects of organosolv pretreatment and enzymatic hydroly-
sis on cellulose structure and crystallinity in Loblolly pine. Carbohydrate Research, 345, 965–970.
Plant Biomass Characterization: Application of Solution- and Solid-state NMR Spectroscopy 389

63. Hallac, B.B., Sannigrahi, P., Pu, Y. et al. (2010) Effect of ethanol organosolv pretreatment on enzymatic hydrolysis
of Buddleja davidii stem biomass. Industrial & Engineering Chemistry Research, 49, 1467–1472.
64. Pan, X., Xie, D., Yu, R.W., and Saddler, J.N. (2008) The bioconversion of mountain pine beetle-killed lodgepole
pine to fuel ethanol using the organosolv process. Biotechnology and Bioengineering, 101, 39–48.
65. Schroeder, L.R., Gentile, V.M., and Atalla, R.H. (1986) Nondegradative preparation of amorphous cellulose.
Journal of Wood Chemistry and Technology, 6, 1–14.
66. Zhu, L., O’Dwyer, J.P., Chang, V.S. et al. (2008) Structural features affecting biomass enzymatic digestibility.
Bioresource Technology, 99, 3817–3828.
67. Pu, Y., Ziemer, C., and Ragauskas, A.J. (2006) CP/MAS 13C NMR analysis of cellulase treated bleached softwood
kraft pulp. Carbohydrate Research, 341, 591–97.
68. Yamamoto, H. and Horii, F. (1993) CPMAS carbon-13 NMR analysis of the crystal transformation induced for
Valonia cellulose by annealing at high temperatures.Macromolecules, 26, 1313–1317.
69. Nishiyama, Y., Sugiyama, J., Chanzy, H., and Langan, P. (2003) Crystal structure and hydrogen bonding system in
cellulose Ia from synchrotron x-ray and neutron fiber diffraction. Journal of the American Chemical Society, 125,
14300–14306.
70. Larsson, P.T., Wickholm, K., and Iversen, T. (1997) A CP/MAS 13C NMR investigation of molecular ordering in
celluloses. Carbohydrate Research, 302, 19–25.
71. Larsson, P.T., Hult, E.L., Wickholm, K. et al. (1999) CP/MAS 13C-NMR spectroscopy applied to structure and
interaction studies on cellulose I. Solid State Nuclear Magnetic Resonance, 15, 31–40.
72. Larsson, P.T., Westermark, U., and Iversen, T. (1995) Determination of the cellulose Ia allomorph content in a
tunicate cellulose by CP/MAS 13C-NMR spectroscopy. Carbohydrate Research, 278, 339–343.
73. Cateto, C., Hu, G., and Ragauskas, A.J. (2011) Enzymatic hydrolysis of organosolv Kanlow switchgrass and its
impact on cellulose crystallinity and degree of polymerization. Energy & Environmental Science, 4, 1516–1521.
390 Aqueous Pretreatment of Plant Biomass for Biological and Chemical Conversion to Fuels and Chemicals