planning tiger recovery
TRANSCRIPT

2015 © The Authors, some rights reserved;
R E S EARCH ART I C L E
CONSERVAT ION ECOLOGY
nsee American Association forment of Science. Distributed
ative Commons Attribution
rcial License 4.0 (CC BY-NC).
dv.1400175
Planning tiger recovery: Understanding intraspecificvariation for effective conservationAndreas Wilting,1* Alexandre Courtiol,1 Per Christiansen,2 Jürgen Niedballa,1
Anne K. Scharf,1† Ludovic Orlando,3 Niko Balkenhol,1‡ Heribert Hofer,1
Stephanie Kramer-Schadt,1 Jörns Fickel,1,4 Andrew C. Kitchener5,6*
exclusive lice
the Advance
under a Cre
NonComme
10.1126/scia
http://aD
ownloaded from
Although significantlymoremoney is spent on the conservation of tigers than on any other threatened species, todayonly 3200 to 3600 tigers roam the forests of Asia, occupying only 7% of their historical range. Despite the globalsignificance of and interest in tiger conservation, global approaches to plan tiger recovery are partly impeded bythe lack of a consensus on the number of tiger subspecies or management units, because a comprehensive analysisof tiger variation is lacking. We analyzed variation among all nine putative tiger subspecies, using extensive data setsof several traits [morphological (craniodental and pelage), ecological, molecular]. Our analyses revealed little variationand large overlaps in each trait among putative subspecies, and molecular data showed extremely low diversity be-cause of a severe Late Pleistocene population decline. Our results support recognition of only two subspecies: theSunda tiger, Panthera tigris sondaica, and the continental tiger, Panthera tigris tigris, which consists of two (northernand southern) management units. Conservation management programs, such as captive breeding, reintroductioninitiatives, or trans-boundary projects, rely on a durable, consistent characterization of subspecies as taxonomic units,defined by robust multiple lines of scientific evidence rather than single traits or ad hoc descriptions of one or fewspecimens. Our multiple-trait data set supports a fundamental rethinking of the conventional tiger taxonomyparadigm, which will have profound implications for the management of in situ and ex situ tiger populations andboost conservation efforts by facilitating a pragmatic approach to tiger conservation management worldwide.
dvan
on February 7, 2018ces.sciencem
ag.org/
INTRODUCTION
Fewer than 4000 tigers inhabit the forests of Asia—a historically lownumber (1). These tigers occupy only 7% of their estimated formerdistribution range (2), and 70% of them inhabit 42 source sites, whichoccupy only 0.5% of their historical range (3). Almost US$50 millionis spent annually by range countries, non-governmental organizations,and private donors on the conservation of wild tigers (3). This amounthas massively increased since the launch of the World Bank’s GlobalTiger Initiative (GTI) in 2008. No other threatened species commandssuch resources and attention from the international community.
A precondition for a successful tiger recovery and global tigermanagement (including global captive breeding programs and conser-vation management of free-ranging meta-populations) is a consensuson the number of tiger conservation units [that is, subspecies, evolu-tionarily significant units (ESUs), ecotypes, or management units(MUs)] because active interventions, such as translocations or releasesof captive-bred tigers, will presumably become more important in thefuture for reversing the decline of wild tigers.
Despite repeated previous efforts to unravel tiger diversity and de-fine conservation units in terms of subspecies (4, 5), results were oftencontradictory and no consensus has been reached so far. Up to nine
1Leibniz Institute for Zoo andWildlife Research (IZW), Alfred-Kowalke-Straße 17, 10315 Berlin,Germany. 2Selandia College, Bredahlsgade 1B, 4200 Slagelse, Denmark. 3Center forGeoGenetics, Natural History Museum of Denmark, University of Copenhagen, 1350Copenhagen, Denmark. 4Institute for Biochemistry and Biology, Potsdam University,Karl-Liebknecht-Str. 24-25, 14476 Potsdam, Germany. 5Department of Natural Sciences, Na-tional Museums Scotland, Edinburgh EH1 1JF, UK. 6Institute of Geography, School ofGeosciences, University of Edinburgh, Edinburgh EH8 9XP, UK.*Corresponding author. E-mail: [email protected] (A.W.); [email protected] (A.C.K.)†Present address:MaxPlanck Institute forOrnithology,AmObstberg1, 78315Radolfzell, Germany.‡Present address: Department of Wildlife Sciences, University of Göttingen, 37077 Göttingen,Germany.
Wilting et al. Sci. Adv. 2015;1:e1400175 26 June 2015
subspecies of tigers are currently recognized (6) (Fig. 1A), three ofwhich are already extinct and a fourth probably survives only in cap-tivity (7) (Table 1). All but one subspecies were first described on thebasis of morphological characters measured in only one or a few speci-mens (4) (Table 1). Only the Malayan tiger was identified on the basisof molecular markers, and it has not been diagnosed in terms of mor-phological traits (8). Although a type specimen was designated, theformal scientific description, according to the International Code ofZoological Nomenclature, is still lacking, rendering this taxon a nomennudum (9). Even so, the proposed subspecies name “Panthera tigrisjacksoni” is widely used, for example, by The IUCN/SSC Red List ofThreatened Species (6).
Whereas some molecular analyses supported the distinction ofmultiple subspecies (5, 8, 10), others did not (11, 12) and observed thatdifferences may have been overemphasized simply owing to fragmen-tary sampling along a more or less complex cline of variation (4, 13).This was recently illustrated for Bengal tigers, where seemingly clearmolecular differences among current Bengal tiger populations (14)vanished after museum specimens from extinct Bengal tiger popula-tions were included in analyses (15). There are minimal molecular dif-ferences between the extinct Caspian tiger and the extant Amur tiger,suggesting that they belong to the same subspecies (16). Similarly, arecent molecular study showed that the two other extinct subspecies,the Javan and the Balinese tigers, have a close genetic affinity to Su-matran tigers (17), whereas morphological studies had suggested thatthese two are distinct from all other putative tiger subspecies (18–20).In summary, previous studies often used small sample sizes and usedeither only morphological characters or only molecular markers tocharacterize subspecies. The two approaches have only occasionallybeen combined in a superficial way (4, 5, 8, 18, 19). Consequently,the validity of some or all subspecies remains a matter of debate.
1 of 13

Com Abb No. A
(
(Tem
(Tem
(Hilz
(Sc
P
M
22 Lu
R E S EARCH ART I C L E
on February 7, 2018
http://advances.sciencemag.org/
Dow
nloaded from
Fig. 1. Variation among and phenotypic space across all nine putative subspecies of tigers. (A) Former distribution of the nine putativesubspecies and occurrence records used for the ecological analysis. (B1 to E3) Multivariate analyses of skull traits [(B1 to B3) females; (C1 to C3)
males], pelage (D1 to D3) and ecological preferences (E1 to E3). (B1 to E1) The 1.5 inertia ellipse for all nine putative subspecies displayed on theplane defined by the first two principal components; (B2 to E2) unrooted binary neighbor-joining trees based on the matrices of Euclidean distancebetween individuals in the multivariate space defined by all principal components; (B3 to E3) same as in (B2 to E2) but with distances beingmeasured between the centroids of each putative subspecies with bootstrap values of groupings. (F) Radial tree of the maximum likelihood analysisof 3968 bp of mtDNA (see Fig. 2).Table 1. Current tiger P. tigris subspecies classification based on the IUCN/SSC Red List of Threatened Species (6). Subspecies are chrono-logically ordered by the year of their description. † indicates subspecies recognized as extinct under the current IUCN/SSC Red List of ThreatenedSpecies (6).
Subspecies
Wilting et al. Sci. Adv. 2015;1:e
mon English name
1400175 26 June 2015
reviation
of specimens in type description uthorityP. t. tigris
Bengal tiger TIG 0 (L., 1758)P. t. virgata†
Caspian tiger VIR 1 skin Illiger, 1815)P. t. altaica
Amur tiger ALT 1 skin minck, 1844)P. t. sondaica†
Javan tiger SON 1 skin minck, 1844)P. t. amoyensis
South Chinese tiger AMO 5 skulls heimer, 1905)P. t. balica†
Balinese tiger BAL 1 skin; 1 skull hwarz, 1912)P. t. sumatrae
Sumatran tiger SUM 1 skull; 1 live animal ocock, 1929P. t. corbetti
Indochinese tiger COR 13 skins; 19 skulls azák, 1968P. t. jacksoni
Malayan tiger JAC genetic (mtDNA and microsatellite) o et al., 20042 of 13

R E S EARCH ART I C L E
Dow
nloaded from
The contradictory views on tiger taxonomy highlight a moregeneral issue about the taxonomic implications of newly collectedphylogenetic data and their consequences for conservation manage-ment priorities. In recent years, there has been a considerable “taxo-nomic inflation” among birds and mammals (21, 22) because theliberal application of the phylogenetic species concept (PSC) was com-bined with new molecular methods and statistical tools to facilitate thedistinction of even closely related populations with high statisticalsupport. In tigers, this led to the wide acceptance of several subspeciesand even attempts to raise some of these to species level (18). There-fore, the tiger is an instructive example to illustrate how the tensionbetween an increase in phylogenetic information and the resolution oftaxonomic disputes may affect and impede conservation managementplans and priorities.
Here, we present the most comprehensive analysis to date of mo-lecular, morphological (craniodental and pelage data), and ecological(climate, habitat, and prey data) characteristics of all nine putative ti-ger subspecies. We show that with a comprehensive multi-trait dataset, only two subspecies (one consisting of two management units) re-ceive robust support. We conclude with a discussion of appropriateconservation strategies, and propose a scientifically sound and morepragmatic approach to reverse the tiger’s population decline.
on February 7, 2018
http://advances.sciencemag.org/
RESULTS AND DISCUSSION
Evolutionary history of tigersWhereas saving the tiger as a species is the main and unanimous goal,a key aim of current conservation efforts is the protection of tiger di-versity (2) to maintain the species’ evolutionary potential. For a betterunderstanding of the tiger’s evolutionary history and its current intra-specific diversity, we conducted a molecular analysis of all nine puta-tive tiger subspecies. For this, we completed a previously used data setof 4 kb of mitochondrial DNA (mtDNA) (8, 16) with additional se-quences generated in this study from the extinct Javan and Balinesetigers. We focused on this data set because nuclear autosomal, X-linked,andY-chromosomemarkers showedno variationwithin tigers (10) andeven major histocompatibility complex and autosomal microsatellitevariability were low (8). Consistent with nuclear data, mitochondrialdata indicated that modern tigers contain substantially lower geneticdiversity than other pantherine (table S16) or Southeast Asian cats (10).The demographic reconstruction revealed a population decline around80 thousand years ago (kya), followed by a Late Pleistocene expansion(Fig. 2C). This suggests thatmodern tigers succumbed to rapid environ-mental changes after the Toba super-volcanic eruption (~73.5 kya)in northern Sumatra (23). The impact of this eruption has been linkedto population bottlenecks in other mammals such as humans (24),orangutans (25), and clouded leopards (26). Thus, tigers may have onlysurvived in a single refugium outside the region of ash-cloud fallouts.The ancestral position of haplotype AMO1 (Fig. 2B) suggests the pres-ence of such a refugium in or around southern China (8, 16, 27).
Although hints of such a bottleneck had already been reported(8, 17), two reasons prevented a broader discussion of the Late Pleis-tocene population decline: (i) the widely accepted view that the tiger’shigh morphological variation across its wide geographical distributionwas an ancient adaptation to local habitats, and (ii) the presence oftiger fossils dating back ca. 2.55 million years (28) from throughoutthe current tiger’s range from northern China to Java, Sri Lanka, and
Wilting et al. Sci. Adv. 2015;1:e1400175 26 June 2015
Japan. It was thus assumed that the tiger’s geographical distribution hadessentially remained unchanged for more than 2 million years (4).
However, neither argument contradicts a Late Pleistocene bottle-neck. (i) After the bottleneck, the tiger’s population expansion was ac-companied by a large range expansion, which probably led to rapidlocal adaptations, allowing for survival and reproduction in differenthabitats as varied as cold subarctic taiga and tropical rainforests. (ii) Ifthe wide distribution of tiger fossils were to indicate continuous multi-regional evolution throughout the entire Pleistocene (29), we wouldexpect molecular data to show substantial genotypic differentiationover time (30). Therefore, the low molecular as well as morphological(see below) variation observed strongly favors the scenario that ances-tral Pleistocene tigers became extinct in large parts of their former dis-tributional range and were replaced by modern tigers recolonizinglarge parts of Asia as recently as the Late Pleistocene.
Multi-trait tiger taxonomyOur combined approach of molecular, morphological (skull and pel-age), and ecological data revealed that different traits supported differ-ent intraspecific groupings (Fig. 1). Although some single measuresdistinguished one or a few of the nine putative subspecies by the75% rule (31) (fig. S4), the combination of traits rejected their validity.The multi-trait approach only supported the distinction of two sub-species (Fig. 3, A1 to A5), continental tigers and Sunda tigers. Thesewere consistently supported by bootstrap analyses, could be strictly dif-ferentiated according to the 75% rule (31), and were demonstrably sig-nificantly different (Fig. 4 and tables S18 to S21).
Craniodental morphology. Analysis of 201 tiger skulls (102 malesand 99 females) for 41 characters distinguished Sunda tigers from thoseof continental tigers with a high bootstrap support (BS for females, 83%;BS for males, 48%; see Materials and Methods and table S11 for detailson the interpretation of the BS values; Fig. 1, B3 and C3), and the ma-jority of the 41 characters was significantly different between Sunda andcontinental tigers for both males and females (table S18).
Pelage morphology. Bootstrap analyses of pelage markings of114 tiger skins (males and females considered jointly) supported thedifferentiation (BS = 44%; Fig. 1, D3) of Sunda and continental tigers,which differed significantly in their number of flank stripes and spots(table S19).
Ecology. We used two different approaches to summarize the ecol-ogical preferences of each subspecies—ecological niche similarity anal-ysis, on the basis of an ecological envelope modeling framework (fig. S2and table S12), and factor analysis for mixed data (FAMD; Fig. 1, E1).The results of both analyses were highly consistent with each other. Ec-ologically, Sunda tigers were significantly distinct from continental tigers(BS = 87%; Fig. 1, E3, and tables S20 and S21), except that Malayan tigersgrouped ecologically with Sunda tigers (Fig. 1, E1 and E3). The latter wasexpected because of the highly similar climatic and environmentalconditions in peninsular Malaysia and Sumatra.
Molecular population structure. Sunda tigers formed a supportedgroup [BS = 81% maximum likelihood (ML), 55% Bayesian inference(BI); Fig. 2, A2, red], with several diagnostic sites separating Sundatigers from continental tigers (Fig. 2B and Table 2). Despite the youngevolutionary age of modern tiger populations—most variation foundin today’s wild tigers probably evolved within the last ~80,000 years(Fig. 2C)—molecular data revealed two groups (continental tigers andSunda tigers) starting to diverge around (continental) or soon after(Sunda) the population decline (table S17).
3 of 13

R E S EARCH ART I C L E
on February 7, 2018
http://advances.sciencemag.org/
Dow
nloaded from
Fig. 2. Phylogenetic analyses of all nine putative subspecies using 3968 bp of mtDNA. (A1 and A2) Maximum likelihood tree of intraspecific var-iation among all putative tiger subspecies in relation to three pantherine cat species [snow leopard (Panthera uncia), leopard (Panthera pardus), and
clouded leopard (Neofelis nebulosa)]. Values above or below branches show maximum likelihood and Bayesian inference bootstrap supports. (A1)Maximum likelihood tree including three pantherine cat species as outgroups. (A2) Enlargement of the maximum likelihood tree part showing the tigers.Roman numerals indicate bootstrap supports of nodes for skull {females} / skull {males} / skin / ecological preferences. Abbreviations for putative subspeciesare given in Table 1. * indicates that one additional putative subspecies clusters with this group. (B) Haplotype network. The size of the circles is propor-tional to haplotype frequency. Connecting lines between haplotypes represent one mutational step unless indicated otherwise by numbers. (C) Bayesiandemographic skyline reconstruction of tigers for the last 1 million years.Wilting et al. Sci. Adv. 2015;1:e1400175 26 June 2015 4 of 13

R E S EARCH ART I C L E
on February 7, 2018
http://advances.sciencemag.org/
Dow
nloaded from
Our analysis of this multiple-trait data set supports recognition oftwo distinct evolutionary groups of tigers and thus two subspecies:continental tigers and Sunda tigers (Table 2).
Continental tigers. This group includes six currently recognizedsubspecies: P. tigris tigris (Bengal tiger, TIG), P. tigris virgata† (Caspiantiger, VIR), P. tigris altaica (Amur tiger, ALT), P. tigris amoyensis(South Chinese tiger, AMO), P. tigris corbetti (Indochinese tiger, COR),and P. tigris jacksoni (Malayan tiger, JAC).
Craniodental morphology. Analysis of tiger skulls revealed a highdegree of overlap in phenotypic space between putative continentalsubspecies for both males and females (Fig. 1, B1 and C1), and al-most no separation or distinction between continental subspecies(Fig. 1, B2 and C2). Only the skulls of male tigers from Northernand East Asia (ALT, VIR, and AMO) were grouped together and dis-tinct from those of other continental tigers (BS = 66%; Fig. 1, C3). Thehigh degree of overlap between putative continental subspecies inour results is largely in agreement with those of other studies (18, 19).
Pelage morphology. Analysis of tiger pelages showed a large overlapbetween all putative continental subspecies (Fig. 1, D1), with no apparentsignificant differentiation (Fig. 1, D2). Only Northern tigers (ALT and VIR)were grouped distinctly from other continental tigers, whose pelage char-acteristics were largely overlapping. Our results are in agreement with pre-vious observations of a North-South cline in several pelage characters (4).
Ecology. Owing to the wide geographical distribution of tigers acrossseveral distinct climatic regions, the disjunct Northern tigers (ALT andVIR) were clearly separated from all other tigers (Fig. 1, E3; BS =100%). Compared with other traits, the overlap between Caspian andAmur tigers was lower, reflecting the natural distribution gap in largeparts of Mongolia. Southern continental tigers, except Malayan tigers,clustered together. The high similarity in ecological preferences of Ma-layan and Sumatran tigers (Fig. 1, E3; BS = 100%) contrasts with other
Wilting et al. Sci. Adv. 2015;1:e1400175 26 June 2015
Malayan tiger traits, which showed a high degree of similarity withthose of continental tigers. However, this result emphasizes the high de-gree of ecological adaptability of tigers that originate from two differentphylogenetic clades.
Molecular population structure. On the basis of mtDNA, the pop-ulations of mainland tigers (Fig. 2, A2, gray) were structured, withAmur and Caspian tigers grouping together (Fig. 2, A2, green; BS =94%ML, 87% BI), and Indochinese (BS = 95%ML, 88% BI) and Bengal(BS = 68% ML, 69% BI) tigers forming distinct groups. However, theseare not all reciprocally monophyletic. Malayan tigers, although geneti-cally separated from other continental tigers, were polyphyletic, formingtwo well-supported subclades (Fig. 2, A2; JAC clade 1, BS = 94% ML,96% BI; JAC clade 2, BS = 92%ML, 89% BI). Few, if any, mitochondrialsingle-nucleotide polymorphisms (SNPs) separated continental tigersubspecies (Table 2), and no nuclear SNPs were found in Y- and X-linkedgenes (10). Currently, sampling is still incomplete across the tiger’swide geographical distribution and relies on the inclusion of captive spe-cimens. Therefore, it remains uncertain whether the observed mtDNA-based phylogenetic patterns within continental tigers have resulted fromgenuine evolutionary differences between isolated groups or just fromincomplete sampling along a cline (4).
A robust intraspecific taxonomy should rely on well-established,multiple, independent characters (32, 33), especially if there are uncer-tainties in the available molecular data. None of the six putativecontinental subspecies could be consistently distinguished by mor-phological or ecological characters, because these overlapped great-ly among the putative subspecies Fig. 1, B1 to E1 and B2 to E2. Incontrast to tigers, similar data for the Sunda clouded leopard, Neofelisdiardi, revealed significant differences between populations in Sumatraand Borneo, contributing to their recognition as two subspecies N. diardidiardi and N. diardi borneensis (26). Therefore, our data reject the
Fig. 3. Tiger variation for the two taxonomic units (subspecies) and three management units recognized by the current study. (A1 and B1) Formerdistribution of the (A1) taxonomic units and (B1) management units. (A2 to B5) The 1.5 inertia ellipses of the multivariate analyses displayed on
the plane defined by the first two principal components for (A2 to A5) two taxonomic units and (B2 to B5) management units for the differenttiger traits.5 of 13
R E S EARCH ART I C L E
on February 7, 2018
http://advances.sciencemag.org/
Dow
nloaded from
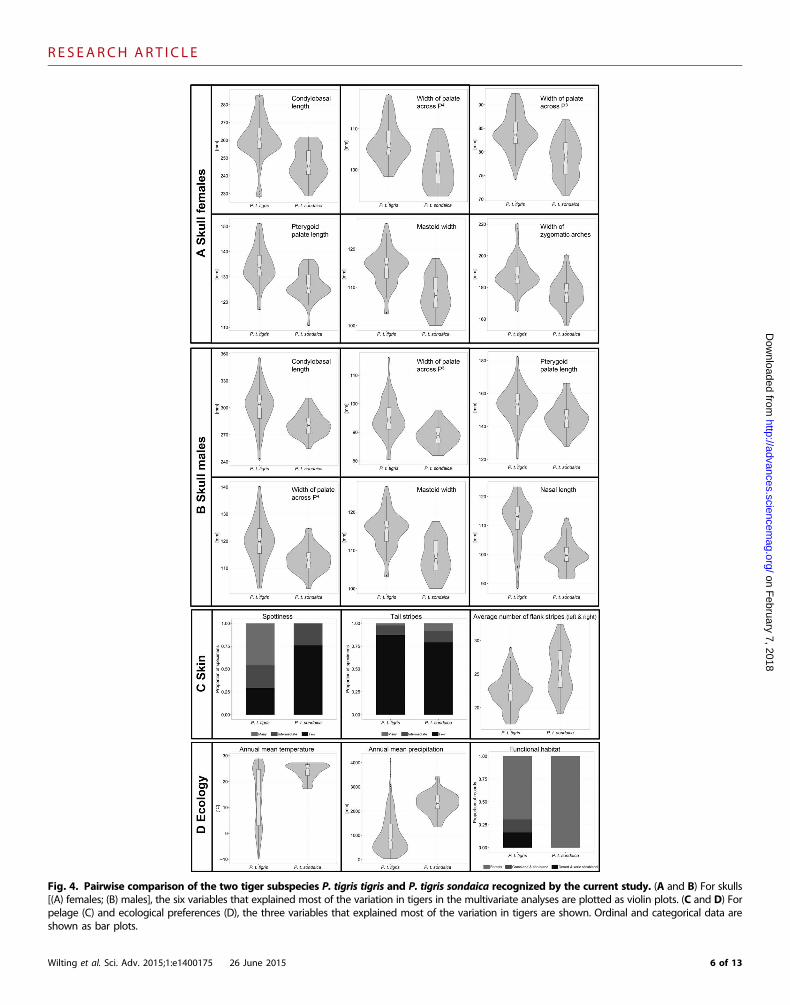
Fig. 4. Pairwise comparison of the two tiger subspecies P. tigris tigris and P. tigris sondaica recognized by the current study. (A and B) For skulls[(A) females; (B) males], the six variables that explained most of the variation in tigers in the multivariate analyses are plotted as violin plots. (C and D) For
pelage (C) and ecological preferences (D), the three variables that explained most of the variation in tigers are shown. Ordinal and categorical data areshown as bar plots.Wilting et al. Sci. Adv. 2015;1:e1400175 26 June 2015 6 of 13

R E S EARCH ART I C L E
on February 7, 2018
http://advances.sciencemag.org/
Dow
nloaded from
taxonomic division of continental tigers into six subspecies. Instead,they should be merged into a single subspecies, which shows only mi-nor local ecological adaptation and differentiation by distance.
Sunda tigers. This group includes three currently recognized sub-species: P. tigris sondaica† (Javan tigers, SON), P. tigris balica† (Balitigers, BAL), and P. tigris sumatrae (Sumatran tigers, SUM).
Craniodental morphology, pelage morphology, ecology, and molecu-lar population structure. The skulls of male and female Sunda tigers(SON, BAL, and SUM; Fig. 1, B1 and B2, C1 and C2), as well as theirpelage markings, overlapped in their traits (Fig. 1, D1 and D2). Al-
Wilting et al. Sci. Adv. 2015;1:e1400175 26 June 2015
though Javan and Balinese tigers were more ecologically distinct fromSumatran tigers than in the other traits, their ecological niches stillsubstantially overlapped (Fig. 1, E1 and E2). Molecular analysisshowed that Javan and Balinese tigers cannot be distinguished fromeach other or from Sumatran tigers. Although a recent study founda single diagnostic SNP (a position not used in our study) betweenJavan/Balinese and Sumatran tigers (17), all three putative sub-species shared haplotypes in our analysis (Fig. 2B). This indicatesrecent gene flow between the tiger populations of these islands,which was facilitated by land bridges around the time of the Last
Table 2. Diagnosis of continental tigers [P. tigris tigris (L., 1758)] and Sunda tigers [P. tigris sondaica (Temminck, 1844)].
P. tigris tigris
P. tigris sondaicaPrincipal synonyms: virgata (Illiger, 1815); altaica(Temminck, 1844); amoyensis (Hilzheimer, 1905);corbetti Mazák, 1968; jacksoni Luo et al., 2004
Principal synonyms: balica (Schwarz, 1912); sumatraePocock, 1929
Skulls (Fig. 4, A and B)
~75% of males distinguishablefrom ~75% of sondaica males
Condylobasal length ≥288 mm; interorbital width≥71 mm; nasal length ≥105 mm; ventral posteriorlength ≥81 mm; width of zygomatic arches≥218 mm; mastoid width ≥126 mm; canine height≥56 mm
Condylobasal length <288 mm; interorbital width<70.5 mm; nasal length <105 mm; ventral posteriorlength <81 mm; width of zygomatic arches <218 mm;mastoid width <126 mm; canine height <56 mm
~75% of females distinguishablefrom ~75% of sondaica
Condylobasal length ≥255 mm; interorbital width≥60 mm; nasal length ≥91.5 mm; ventral posteriorlength ≥72.5 mm; width of zygomatic arches≥182 mm; mastoid width ≥112.5 mm; canineheight ≥47 mm
Condylobasal length <255 mm; interorbital width<60 mm; nasal length <91.5 mm; ventral posteriorlength <72.5 mm; width of zygomatic arches<182 mm; mastoid width <112.5 mm; canine height<47 mm
Pelage (Fig. 4C)
Ground color
Variable but averages lighter than sondaica Darker than tigrisMean number of flank stripes(distinguishes 75% of tigrisfrom 75% of sondaica)
<23
>24Stripes
Thicker and less dense, especially on hindquarters Thin and particularly dense on hindquartersPale ventral coloration
Extends further up flanks (one-third to halfway),tending to be white in colorExtends minimally up flanks, tending to be yellowin color
Brow patches
Whiter and more extensive than in sondaica Smaller than in tigris and tending to be yellow craniallyEcological preferences (Fig. 4D)
Climate (~75% of tigris occurrencerecords are distinguishablefrom sondaica)
More seasonal; cooler and drier climates thansondaica, but occurrence records from partsof its range (for example, Peninsular Malaysia)are indistinguishablefrom sondaica
Less seasonal; warmer and wetter climates than tigris
Molecular markers (mtDNA)
SNPs that distinguish all tigrisfrom sondaica [see alsoLuo et al. (8)]
Position of the cat mtDNA genome (71) 5608 ND2:C in tigris 15743 Cytb: A in tigris
Position of the cat mtDNA genome (71) 5608 ND2: T insondaica 15743 Cytb: G in sondaica
SNPs that distinguish most tigrisfrom sondaica
Position of the cat mtDNA genome (71) 4442 ND1:T in most tigris 5155 ND2: T in most tigris 13029ND5: G in most tigris 14118 ND5: C in most tigris
Position of the cat mtDNA genome (71) 4442 ND1:C in all sondaica 5155 ND2: C in all sondaica13029 ND5: A in most sondaica 14118 ND5: T inall sondaica
7 of 13

R E S EARCH ART I C L E
on February 7, 2018
http://advances.sciencemag.org/
Dow
nloaded from
Glacial Maximum, when lower sea levels exposed the continentalshelf until as recently as 10 kya (34). Our data demonstrate that allSunda tigers constitute a single subspecies.
Conservation management units (ecotypes)of modern tigersIn addition to the taxonomy proposed here, which supports the recog-nition of only two subspecies, our data also support the recognition oftwo management units (ecotypes) within continental tigers: northerntigers (ecotype 1: ALT and VIR) and southern tigers (ecotype 2: AMO,COR, TIG, and JAC). These management units are justified becausenorthern continental tigers show molecular, skull (only males), pelage,and ecological characters distinct from those of southern continentaltigers (Fig. 3, B2 to B5). However, the recognition of a separate north-ern tiger subspecies is inappropriate, because (i) within the phyloge-netic tree, northern tigers are a subclade within the continental group,and thus, a southern continental tiger subspecies would be paraphy-letic, and (ii) the absence of tigers in northernChinawasmost probablycaused by ancient-to-modern human overexploitation and overem-phasizes the distinctiveness of the northern end of what was probablya continuous cline. In other words, this sampling bias, exacerbated by arecent population bottleneck, has led to the inappropriate recognitionof a northern tiger subspecies, which in isolation shows significant localadaptations to a temperate climate and habitats with their particulararrays of prey species. Owing to these adaptations and the current largedistribution gap between northern and southern continental tigers—which exceeds 1000 km and is greater than themaximumdispersal dis-tance of tigers (13)—the treatment of northern and southern continentaltigers as separate management units is justified.
Management implicationsWith only ca. 1000 breeding females in the wild (35), the traits of alltiger individuals will probably be of importance for long-term conser-vation because the remaining variation will be the key to maintainingthe highest possible adaptability to changing environments. Therefore,to achieve the goal of doubling the number of free-ranging tigers by2022 (36), all remaining wild tiger populations are essential, and alltiger range countries share equal responsibility for restoring the geo-graphical spread and ecological diversity of tigers. Basing current con-servation strategies on numerous subspecies, for which there is little orno scientific support, may actually hinder the tiger’s survival by pre-venting large-scale cooperative conservation management programs,such as conservation captive breeding, reintroduction initiatives, ortrans-boundary projects, which will be restricted to the currently rec-ognized putative subspecies. “Subspecific hybrid” tigers or animals ofsupposedly different subspecies, even if bred in reputable conservationbreeding programs and not “tiger farms,” are therefore excluded frommany conservation campaigns. This greatly reduces the number ofavailable animals, unnecessarily restricting gene pools and thus imped-ing the success of conservation measures.
Recent coalescent simulations highlighted that, in the absence ofgene flow between currently recognized subspecies, today’s levels ofgenetic diversity in tigers cannot be maintained (37). Our analysesof and recommendations on the taxonomic status of all currently re-cognized subspecies now provide a solid foundation for a more prag-matic approach to tiger conservation worldwide. It is worth notingthat reducing the number of recognized tiger subspecies to two andthe number of management units to three will not hinder cooperative
Wilting et al. Sci. Adv. 2015;1:e1400175 26 June 2015
conservation efforts, nor will they be impeded by people and govern-ments of range countries labeling their “own” tiger populations withvernacular names such as “Indian,” “Chinese,” or “Malayan” tigers asan expression of pride in their local population, because this will be ofparamount importance for local or regional conservation success. Iflocal conservation activities for wild tiger populations are wellplanned, and law and policy enforcement is effective, tiger populationscan rapidly recover (38). In contrast to overarching, coordinated inter-national initiatives, the success of local conservation activities is largelyindependent of the tiger’s evolutionary history, its subspecies status, ormanagement unit assignment.
With the population of wild tigers dwindling to a worryingly lownumber, the success of future conservation management is likely todepend more on intensive modes of conservation intervention toboost the diversity of genetically depleted populations or reestablishpopulations after local extinctions. Such active interventions may in-clude translocations or the release of captive-bred individuals by inter-nationally recognized conservation breeding programs, which mayalso arise from assisted reproduction techniques such as artificial in-semination or (in future) embryo transfer. Therefore, the successfulconservation management of the tiger requires an integrated conser-vation management approach, which simultaneously considers andcoordinates in situ and ex situ conservation management activities.This is embodied in the IUCN Captive Breeding Specialist Group’sOne Plan Approach to species conservation planning, which aimsto bridge the gap between captive and wild populations for moreintegrated species conservation (39).
Our results demonstrate that only Sumatran tigers should be usedfor interventions in Sumatra, Java, and Bali—even if there is currently alack of sufficient tiger habitats that are devoid of tiger populations onthese islands. For northeastern Asia and the Caspian region, our datasupport previous results that suggested the use of Amur tigers for re-introduction programs to their former Caspian range and elsewhere(40). For conservation management interventions in southern conti-nental Asia, we recommend giving highest priority to the transfer ofeither wild tigers or captive-bred tigers with known origin from repu-table conservation breeding institutions to repopulate areas with cur-rently no tigers. These tigers should originate from less than 1000 kmaway, which is consistent with themaximumdistance recorded for tigerdispersal and hence possible gene flow (13). Only if such individuals arenot available should tigers from other parts of the southern continentalAsian range be used.
Our results mostly support current conservation management ofcaptive tigers. A previous study (41) genotyped a significant propor-tion of captive tigers. Many were of unknown origin and others wereclassified as hybrids of former putative subspecies, with the result that“hybrid” individuals were often removed from their respective breed-ing programs. This highlights the importance of a scientifically soundand more pragmatic approach to the management of captive tigers.Zoos have spent significant amounts of money to have their tigers gen-otyped, and currently focus their breeding efforts on “pure-bred” tigersas defined by the conventional definition of nine subspecies. Our resultsdemonstrate that the current breeding programs accredited by theWorld Association of Zoos and Aquariums (WAZA) could be extendedby inclusion of many of these supposed hybrids because southern con-tinental tigers do not need to be managed according to their hithertoconventional subspecific classification. Such a conservation manage-ment approach would enhance the persistence of alleles that may only
8 of 13

R E S EARCH ART I C L E
D
survive in supposedly “subspecific hybrid” tigers, which substantiallyoutnumber the so-called pure captive tigers (41).
Our recommendations assist in themaintenance of genetic diversityand are consistent with recent findings, according to which every tiger,both wild and captive, is important as a potential reservoir of geneticdiversity for the species (37). The separate breeding of Indochinese,South Chinese, andMalayan tigers is likely to be unsustainable becauseonly few founder individuals were available—for instance, only six in-dividuals for South Chinese tigers (42). In contrast, both the northerncontinental tigermanagement units and the Sunda tiger subspecies havebeen traditionally maintained in separate breeding programs. Theirnumbers of founders were much higher; several hundred individualsare currently part of international breeding programs. For Sumatrantigers, the international zoo community led by WAZA has even suc-cessfully established a Global Species Management Plan. The separateconservation breeding andmanagement of these units is supported byour results and should be continued.
onhttp://advances.sciencem
ag.org/ow
nloaded from
CONCLUSION
The previous traditional tiger intraspecific taxonomy was often basedon small sample sizes and arbitrary morphological characters andlacked a comprehensive approach so that subspecies names were littlemore than labels for local populations. By integrating morphological,molecular, and ecological data with biogeography and geologicalevents, we obtained robust support for two subspecies that have differ-entiated in isolation, with one of them consisting of two conservationmanagement units. Our rationalization provides a solid foundation toboost both in situ and ex situ conservation management of the appro-priate evolutionary, taxonomic, and management units at a global level.This will assist an integrated conservation management approach to re-verse the tiger’s decline and thus to achieve the key challenge—savingthe species, Panthera tigris, as a whole.
February 7, 2018
MATERIALS AND METHODS
Experimental designCraniodental and mandibular morphology. Craniodental and
mandibular diversity within tigers were assessed using a sample of 201tiger adult skulls [102 males (table S1) and 99 females (table S2)]. Foreach specimen, 41 craniomandibular and dental measurements wereanalyzed (table S3).
Pelage morphology. Altogether, we analyzed photographs of 114tigers, which were either photographs of museum skin specimens orphotographs taken in the wild (for example, photographs taken incamera-traps) or in zoos (known-origin animals only) so that the or-igin was known (table S4). For each photograph, we scored six pelagecharacters (tables S5 and S6). The number of stripes on flanks was themean count of the number of stripes on the right and left flanks. Theother five characters were categorized between 1 (none or few) and 3(many) because some specimens or photographs were not alwayscomplete and thus only comparable on a semiquantitative scale.
Ecological preferencesOccurrence records. In total, we collated 482 occurrence records
of tigers (table S7). Most tiger records were extracted from Mazák (43)
Wilting et al. Sci. Adv. 2015;1:e1400175 26 June 2015
and Kitchener and Dugmore (13), which are based on historical records.We allocated each of these historical records a latitude/longitude valuewith an uncertainty of about 50 km because of the low resolution ofthe used maps (13, 43). These historical records are valuable becausethey predate the current distribution, which we judge to be biased as aconsequence of tiger persecution and habitat loss. In addition to thehistorical records, we selected random points from the Tiger Conser-vation Landscapes (3) to include locations of the modern distributionnot covered by historical sampling. For the putative Javan and Bali sub-species, we included localities recorded by Yamaguchi et al. (20) andused localities from where museum specimens were originally collected,which we had used for the skull, pelage, and molecular analyses. Be-cause of the low number of records for these two putative subspecies,we selected additionally three (Java) and nine (Bali) random pointsfrom these islands to reach a minimum number of 15 occurrence re-cords per putative subspecies (table S7).
Digital environmental information. We used a set of 19 global cli-mate data maps with a spatial resolution of about 1 km2 (30 arcsec). They comprise temperature and precipitation parameters (listedin table S10) calculated from long-term time series of monthly values(44) (www.worldclim.org/bioclim). We also used available informa-tion about the world’s terrestrial ecoregions (45) (http://worldwildlife.org/publications/terrestrial-ecoregions-of-the-world). We reclassifiedthe 16 ecoregions within the tiger’s range into four functional habitatclasses (table S8). Because we expected that the availability of prey spe-cies would also influence the occurrence of tigers, we reviewed the ex-isting literature to obtain information about tiger prey species. We onlyincluded those genera as potential tiger prey species, for which we couldfind at least two independent references, and we grouped prey generainto functional prey groups according to their ecological similarity (tableS9). For all prey species, we used the former distributional rangesprovided by the IUCN/SSC Red List of Threatened Species (www.iucnredlist.org/). The distributional ranges of all potential prey specieswithin one prey group were merged to obtain the presence/absencelayer for each prey group.
All maps were clipped and resampled to the same extent and cell size.All spatial analyses used ArcInfo 9.3 and ArcGIS v. 9.3.1 (ArcView,Spatial Analyst, 3D Analyst, Geostatistical Analyst) by ESRI, and R3.0.1 (46).
Genetic samples. We obtained epithelial tissue (from skulls orskins) or maxillo-turbinal bone samples from P. tigris sondaica (n =22) and P. tigris balica (n = 3) voucher specimens from natural historymuseums. Ten Javan archival DNA samples did not provide ampliconsfor all of the fragments (see below) and thus were excluded from furtheranalyses (table S13). DNA extraction of all samples was performed fol-lowing an established protocol (26) in a separate clean pre-PCR (poly-merase chain reaction) laboratory solely used for the extraction of DNAof museum samples. PCR amplification was performed with eightknown sets of mitochondrial primers (16) and four new sets of mito-chondrial primers (table S14), which covered regions shown to be vari-able and informative for the distinction of Sumatran tigers (8). In total,we sequenced 1772 base pairs (bp) of the 4078 bp previously analyzed(8). Our sequenced regions were selected to cover all variable positionswithin Sumatran and between Sumatran and continental tigers. All PCRreactions and sequencing analyses were done following the establishedprotocol (26). Sequences were assembled, aligned, and edited using thesoftware Clustal X2 (47) and analyzed together with published sequences(8, 16) and GenBank accession no. JF357969 (11) (SUM9).
9 of 13

R E S EARCH ART I C L E
on February 7, 2018
http://advances.sciencemag.org/
Dow
nloaded from
Data analysesMultivariate analysis of skulls, skins, and ecological data. For
each trait, the phenotypic space was summarized by performing ap-propriate ordination methods (Figs. 1 and 3 and fig. S1). Such a mul-tivariate approach ensured that the variation within each trait waspresented in an identical manner across traits, efficiently summarizedthe total phenotypic space in a limited number of dimensions or com-ponents, and therefore also permitted a useful geometrical representa-tion of the total phenotypic space. We preferred an ordination approachbecause this does not require a prior assignment of each individual toa specific subspecies and allows the number of true groups/subspeciesto emerge from the analysis rather than being set before analysis,which other multivariate approaches, such as discriminant analysis,would require.
Specifically, for skull data, we performed a scaled principal compo-nents analysis (PCA), that is, a PCA on data that were transformedinto z-scores (mean, 0; SD, 1) to avoid an overemphasis of the largermeasurements. PCA is a well-established technique for efficientlysummarizing phenotypic space in skull measurements for taxonomicpurposes (48). We performed separate PCAs for males and femalesowing to sexual dimorphism in tigers. PCAs were computed in Rusing the function “dudi.pca” from the package ade4 1.5-2 (49). Forskin data, one variable was quantitative and others were ordinal withthree levels. We performed a scaled PCA on these data after codingthe ordinal variables by their corresponding numerical values (1–3)because our ordinal records reflect continuous variation. AlthoughPCA assumes a multivariate normal distribution of variables, PCAhas been shown to be very robust when performed on standardizedsemiquantitative variables (50). For ecological data, we used FAMD(51), a method designed to combine both categorical and continuousvariables within the same analysis by combining a scaled PCA on quan-titative variables and a multiple correspondence analysis (MCA), a non-parametric ordination technique, on qualitative variables. The FAMDwas computed in R using the function “FAMD” from the packageFactoMineR 1.25 (52). Figure 1 (B1 and E1) shows the first two prin-cipal components and the 1.5 inertia ellipses for all traits; the third andfourth components are shown in fig. S3. Tables S3, S6, and S10 pro-vide the relative contribution of each trait to the first four principalcomponents. We illustrate the phenotypic space first with respect tothe nine putative subspecies (Fig. 1 and fig. S3) and then with respectto the two subspecies and three management units recognized by theresults of our study (Fig. 3 and fig. S3).
We then used the results of our multivariate analyses to generateunrooted binary trees to visualize how individuals and the nine puta-tive subspecies were related to each other as a function of each set oftraits. Trees were constructed by applying a neighbor-joining algorithmonto Euclidean distance matrices derived from coordinates of in-dividuals on all components in the phenotypic space. Trees were com-puted and displayed using the package ape 3.0-9 in R (53). To assess thebootstrap support of nodes of interest in trees (putative subspeciesgroupings), we built 1000 bootstrap samples, reran the multivariateanalysis, and built a new neighbor-joining tree for each of these samples.Then, bootstrap values resembled directly the frequency of trees thatpresented the node under consideration. We generated each bootstrapsample by drawing at random a number of individuals (with replace-ment) within each group equal to the sample size of the correspondinggroup. This bootstrap analysis was performed independently for each ofthe four subspecies trees initially obtained, that is, two for skulls (males
Wilting et al. Sci. Adv. 2015;1:e1400175 26 June 2015
and females), one for pelage, and one for ecological traits. We then as-sessed whether the nodes of the mtDNA tree (Fig. 2) were supportedby the other three character sets of skull, pelage, and ecological char-acters. To compare the strength of obtained bootstrap supports toreference values in the absence of any population structure, we per-muted subspecies in the Euclidean distance matrices for each of 1000bootstrap runs and calculated the mean, median, and 95% confidenceintervals (CIs) of nodes pooling two, three, or four putative subspeciesin the neighbor-joining trees. This simulation study showed that allbootstrap values higher than 40% can be regarded as high in our anal-ysis because such a support was much higher than the upper 95% CI(table S11). All computations for multivariate analyses were performedusing R 3.0.1 (46).
Ecological niche modeling. The tiger occurrence records, the en-vironmental data, and the data on the distribution of tiger prey wereused to model the ecological niches for each of the nine putative sub-species and for all subspecies combined, using a maximum entropyalgorithm implemented in MaxEnt v.3.3.3a (54) with the default set-tings (replicated run type, “cross-validate”; regularization multiplier, 1;maximum number of background points, 10,000). We ran 10 repli-cates and used the mean relative probability of occurrence for furtheranalyses.
First, we used all occurrence records to predict the historical (pre-Anthropocene) distribution of tigers (fig. S1). We used a presence/absence map based on the 10-percentile training presence logisticthreshold (10P threshold) of this model, together with publishedmaps of the historical tiger distribution (13, 43, 55), to create a predic-tive presence/absence historical distributional range map of tigers (fig.S1). This map was used, together with information from Kitchenerand Dugmore (13) and Luo et al. (8), to delimit the ranges of the nineputative subspecies (Fig. 1A).
Subsequently, we performed MaxEnt models for all nine putativesubspecies (fig. S2, B to I), followed by a pairwise comparison of all theresulting putative subspecies models with ENMTools (56). Here, weused the niche overlap tool, which assesses the similarity between pre-dictions of habitat suitability. For each possible pair of putative sub-species, the respective MaxEnt habitat suitability maps were restrictedto the combined ranges of the two subspecies, and the niche overlapwascalculated by two measures, I and D, as implemented in ENMTools(table S12).
Subspecies diagnosis. To visualize the subspecies diagnosis,we plotted the main traits (those that contributed most in the mul-tivariate analysis) for the two tiger subspecies as violin plots, that is,a combination of a box plot and a kernel density plot. Nonoverlap-ping quartile boxes (in fig. S3) can be regarded as reliably differen-tiating more than 75% of individuals between the subspecies.Violin plots were plotted in R using the package ggplot2 (57). Fur-thermore, we performed a pairwise comparison between the twotiger subspecies, which we finally recognized using Mann-WhitneyU tests for all continuous and ordinal variables (skull, skin, and cli-mate). Categorical count variables (functional prey group presenceand functional habitats) were compared using Fisher’s exact test.
Molecular analysis. All analyses described below were performedon two data sets, 1772 and 3968 bp in length [primer sequences weretrimmed off the 4078 bp of Luo et al. (8)], from 121 specimens. Be-cause both data sets gave similar results (table S15), we only presentedthe results of the ~4-kb fragment to be compared with previous studies(8, 16, 17). All sequences represented conspecifics of P. tigris, except for
10 of 13

R E S EARCH ART I C L E
on February 7, 2018
http://advances.sciencemag.org/
Dow
nloaded from
sequences from two Panthera uncia [accession nos. NC010638 andEF551004 (58)], one Panthera pardus [accession no. EF551002 (58)],and one N. nebulosa [accession no. DQ257669 (59)], which were in-cluded as outgroups in phylogenetic and Bayesian skyline analyses.The known divergence times from these outgroups to P. tigris wereused for molecular clock calibration [6.37 ± 0.3185 Ma for the mostrecent common ancestor (MRCA) of Neofelis and Panthera (60), 3.94 ±0.197 Ma for the MRCA of the different Panthera species (61), and3.19 ± 0.1595 Ma for the MRCA of P. uncia and P. tigris (61)]. Sum-mary statistics were computed using DnaSP 5.10.01 (62), grouping allP. tigris sequences in a single unit, or splitting sequences into two unitsaccording to their geographical distribution on the continent and inthe Sunda region (table S15). For phylogenetic analyses and Bayesianskylines, we haplotyped each data set using FaBox v.1.41 (63), result-ing in 35 haplotypes. Furthermore, we used jModelTest v.0.1.1 andthe Bayesian Information Criterion (64) to select HKY+G8 as the bestmodel of molecular evolution. We then performed maximum likeli-hood and Bayesian phylogenetic inferences using PhyML v.3.0 (65) andMrBayes v.3.2.2 (66) (Fig. 2, A1 and A2). In maximum likelihood analy-ses, node support was estimated on the basis of 100 bootstrap pseudo-replicates, whereas in Bayesian inference, node support was based onthe posterior distribution of 75,000 trees (100,000,000 generations; sam-pling frequency, 1/1000; burn in, 25,000) sampled from two parallel runswith four chains each. Finally, we used BEAST v.1.7.0 (67) to estimatedivergence times at three subclades of the tree (which were forced tomonophyly in agreement with maximum likelihood and Bayesianphylogenetic analyses): (i) the MRCA of all P. tigris sequences; (ii) theMRCA of all P. tigris, disregarding sequence AMO1, which branchedoutside of all other P. tigris sequences; and (iii) the MRCA of all P. tigrissequences from the Sunda region. This was performed under theHKY+G8 and the Bayesian Skyline models, assuming either a strictconstant molecular clock or a relaxed molecular clock (with an uncor-related lognormal distribution). A total of 2.5 × 10⁸ generations wasperformed in each analysis, sampling 1 generation for every 1000, andthe best-fit model was selected by means of Bayes factor (BF) calcula-tions as provided by Tracer v.1.4 (68) after convergence and using 25%of sampled generations as burn in. For both sequence data sets, the re-laxed clock model received significant support (log10 BF = 0.985 and4.103 for the 1772- and 3968-bp sequence data sets, respectively). There-fore, we based divergence times (table S17) and demographic skylinereconstructions (Fig. 2C) on the posterior distributions from thismodel.We assumed an average biological generation time of 5 years for tigers(69). Todisplay all possiblemaximumparsimonious relationships amonghaplotypes, a haplotype median-joining network (Fig. 2B) was con-structed using Network v.4.6.0.0 (70).
SUPPLEMENTARY MATERIALS
Supplementary material for this article is available at http://advances.sciencemag.org/cgi/content/full/1/5/e1400175/DC1Fig. S1. Summary of the work flow to predict the historical distribution of tigers.Fig. S2. Predicted historical distribution of tigers P. tigris (top left) and MaxEnt analysis for thenine putative subspecies.Fig. S3. Phenotypic space across all nine putative subspecies of tigers.Fig. S4. Comparison of the nine putative tiger subspecies.Table S1. Sources and details of male specimens included in the craniodental analysis.Table S2. Sources and details of female specimens included in the craniodental analysis.Table S3. The 41 craniodental characters and their contribution to the first four principal components.Table S4. Sources and details of the specimens or photographs included in the pelage analysis.Table S5. Means and SDs for the six pelage characters across the nine putative subspecies.
Wilting et al. Sci. Adv. 2015;1:e1400175 26 June 2015
Table S6. The six pelage characters and their contribution to the first four principal components.Table S7. Number of occurrence records including the references for each of the nine putativesubspecies used for the PCA and for the species distribution modeling (see Materials andMethods for details).Table S8. Definitions of the four functional habitats and the eco-regions assigned to them.Table S9. List of the tiger prey species.Table S10. The 29 ecological variables and their contribution to the first four principal components.Table S11. Simulation of bootstrap values of nodes pooling two, three, or four putative sub-species in the neighbor-joining tree.Table S12. Niche overlap between putative subspecies as computed by ENMTools.Table S13. Sources and details of specimens included in the molecular analysis in addition to thesequences from Luo et al. (8), Driscoll et al. (16), and GenBank accession no. JF357969 (11) (SUM9).Table S14. Details of mitochondrial primer sets used in addition to the eight primer sets de-scribed by Driscoll et al. (16).Table S15. Population summary statistics calculated for the short and long mtDNA data sets.Table S16. Nucleotide diversity of pantherine cats.Table S17. Divergence dates in years before present derived from the short and long mtDNAdata sets.Table S18. Pairwise comparison between the two tiger subspecies P. tigris tigris and P. tigris sondaicafor the craniodental characteristics using the Mann-Whitney U test (♂: ntigris = 64, nsondaica = 38; ♀:ntigris = 55, nsondaica = 44).Table S19. Pairwise comparison between the two tiger subspecies P. tigris tigris and P. tigris son-daica for the pelage characteristics using the Mann-Whitney U test (ntigris = 89, nsondaica = 25).Table S20. Pairwise comparison between the two tiger subspecies P. tigris tigris and P. tigris son-daica for the continuous ecological variables (climate) using the Mann-Whitney U test (ntigris = 428,nsondaica = 50).Table S21. Pairwise comparison between the two tiger subspecies P. tigris tigris and P. tigris son-daica for the categorical ecological variables (functional prey groups and functional habitat) usingFisher’s exact test (ntigris = 428, nsondaica = 50).References (72–87)
REFERENCES AND NOTES
1. J. Seidensticker, Saving wild tigers: A case study in biodiversity loss and challenges to bemet for recovery beyond 2010. Integr. Zool. 5, 285–299 (2010).
2. E. W. Sanderson, J. Forrest, C. Loucks, J. Ginsberg, E. Dinerstein, J. Seidensticker, P. Leimgruber,M. Songer, A. Heydlauff, T. O’Brien, G. Bryja, S. Klenzendorf, E. Wikramanayake, in Tigers of theWorld, R. Tilson, P. J. Nyhus, Eds. (Academic Press, London, ed. 2, 2010), pp. 144–161.
3. J. Walston, J. G. Robinson, E. L. Bennett, U. Breitenmoser, G. A. da Fonseca, J. Goodrich,M. Gumal, L. Hunter, A. Johnson, K. U. Karanth, N. Leader-Williams, K. Mackinnon, D. Miquelle,A. Pattanavibool, C. Poole, A. Rabinowitz, J. L. D. Smith, E. J. Stokes, S. N. Stuart, C. Vongkhamheng,H. Wibisono, Bringing the tiger back from the brink-the six percent solution. PLOS Biol. 8, e1000485(2010).
4. A. C. Kitchener, N. Yamaguchi, in Tigers of the World, R. Tilson, P. J. Nyhus, Eds. (AcademicPress, London, ed. 2, 2010), pp. 54–84.
5. S.-J. Luo, W. E. Johnson, J. L. D. Smith, S. J. O’Brien, in Tigers of the World, R. Tilson, P. J. Nyhus,Eds. (Academic Press, London, ed. 2, 2010), pp. 36–51.
6. R. S. Chundawat, B. Habib, U. Karanth, K. Kawanishi, J. Ahmad Khan, T. Lynam, D. Miquelle,P. J. Nyhus, S. Sunarto, R. Tilson, S. Wang, Panthera tigris IUCN 2013. IUCN Red List Threat.Species (2013); www.iucnredlist.org/details/15955/0.
7. J. Seidensticker, B. Gratwicke, M. Shrestha, in Tigers of the World, R. Tilson, P. J. Nyhus, Eds.(Academic Press, London, ed. 2, 2010), pp. 295–299.
8. S. J. Luo, J. H. Kim, W. E. Johnson, J. van der Walt, J. Martenson, N. Yuhki, D. G. Miquelle,O. Uphyrkina, J. M. Goodrich, H. Quigley, R. Tilson, G. Brady, P. Martelli, V. Subramaniam,C. McDougal, S. Hean, S. Q. Huang, W. Pan, U. K. Karanth, M. Sunquist, J. L. D. Smith, S. J. O’Brien,Phylogeography and genetic ancestry of tigers (Panthera tigris). PLOS Biol. 2, e442 (2004).
9. International Commission on Zoological Nomenclature (ICZN), International Code for Zoo-logical Nomenclature (The International Trust for Zoological Nomenclature, London, ed. 4,1999).
10. S.-J. Luo, Y. Zhang, W. E. Johnson, L. Miao, P. Martelli, A. Antunes, J. L. D. Smith, S. J. O’Brien,Sympatric Asian felid phylogeography reveals a major Indochinese–Sundaic divergence.Mol. Ecol. 23, 2072–2092 (2014).
11. T. Kitpipit, S. S. Tobe, A. C. Kitchener, P. Gill, A. Linacre, The development and validation ofa single SNaPshot multiplex for tiger species and subspecies identification—Implicationsfor forensic purposes. Forensic Sci. Int. Genet. 6, 250–257 (2012).
12. J. Wentzel, J. C. Stephens, W. E. Johnson, M. Menotti-Raymond, J. Pecon-Slattery, N. Yuhki,M. Carrington, H. B. Quigley, D. G. Miquelle, R. Tilson, J. Manansang, G. Brady, L. Zhi, U. Karanth,S. J. O’Brien, in Riding the Tiger: Tiger Conservation in Human Dominated Landscapes, J. Seidensticker,S. Christie, P. Jackson, Eds. (Cambridge Univ. Press, Cambridge, UK, 1999), pp. 20–49.
11 of 13

R E S EARCH ART I C L E
on February 7, 2018
http://advances.sciencemag.org/
Dow
nloaded from
13. A. C. Kitchener, A. J. Dugmore, Biogeographical change in the tiger, Panthera tigris. Anim.Conserv. 3, 113–124 (2000).
14. S. Sharma, H. Stuckas, R. Bhaskar, S. Rajput, I. Khan, S. P. Goyal, R. Tiedemann, mtDNA indicatesprofound population structure in Indian tiger (Panthera tigris tigris). Conserv. Genet. 10, 909–914(2009).
15. S. Mondol, M. W. Bruford, U. Ramakrishnan, Demographic loss, genetic structure and theconservation implications for Indian tigers. Proc. Biol. Sci. 280, 20130496 (2013).
16. C. A. Driscoll, N. Yamaguchi, G. Kahila Bar-Gal, A. L. Roca, S.-J. Luo, D. Macdonald, S. J. O’Brien,Mitochondrial phylogeography illuminates the origin of the extinct Caspian tiger and its re-lationship to the Amur tiger. PLOS One 4, e4125 (2009).
17. H.-R. Xue, N. Yamaguchi, C. A. Driscoll, Y. Han, G. K. Bar-Gal, Y. Zhuang, J. H. Mazak,D. W. Macdonald, S. J. O’Brien, S.-J. Luo, Genetic ancestry of the extinct Javan and Balitigers. J. Hered. 106, 247–257 (2015).
18. J. Mazak, C. Groves, A taxonomic revision of the tigers (Panthera tigris) of Southeast Asia.Mamm. Biol. 71, 268–287 (2006).
19. J. H. Mazak, Craniometric variation in the tiger (Panthera tigris): Implications for patterns ofdiversity, taxonomy and conservation. Mamm. Biol. 75, 45–68 (2010).
20. N. Yamaguchi, C. A. Driscoll, L. Werdelin, A. V. Abramov, G. Csorba, J. Cuisin, B. Fernholm,M. Hiermeier, D. Hills, L. Hunter, H. Itakura, U. S. Johansson, V. Kascheev, K. Krohmann, T. Martin,M. Nowak-Kemp, I. Y. Pavlinov, F. Renoud, L. Tomsett, S. Van Der Mije, E. Zholnerovskaya,C. Groves, A. C. Kitchener, V. Nijman, D. W. Macdonald, Locating specimens of extinct tiger(Panthera tigris) subspecies: Javan tiger (P. T. sondaica), Balinese tiger (P. T. balica), and Caspiantiger (P. T. virgata), including previously unpublished specimens. Mammal Study 38, 187–198(2013).
21. N. J. B. Isaac, J. Mallet, G. M. Mace, Taxonomic inflation: Its influence on macroecology andconservation. Trends Ecol. Evol. 19, 464–469 (2004).
22. F. E. Zachos, M. Apollonio, E. V. Bärmann, M. Festa-Bianchet, U. Göhlich, J. C. Habel, E. Haring,L. Kruckenhauser, S. Lovari, A. D. McDevitt, C. Pertoldi, G. E. Rössner, M. R. Sánchez-Villagra,M. Scandura, F. Suchentrunk, Species inflation and taxonomic artefacts—A critical commenton recent trends in mammalian classification. Mamm. Biol. 78, 1–6 (2013).
23. M. R. Rampino, S. Self, Volcanic winter and accelerated glaciation following the Toba super-eruption. Nature 359, 50–52 (1992).
24. S. H. Ambrose, Late Pleistocene human population bottlenecks, volcanic winter, and differ-entiation of modern humans. J. Hum. Evol. 34, 623–651 (1998).
25. A. Nater, P. Nietlisbach, N. Arora, C. P. van Schaik, M. A. van Noordwijk, E. P. Willems, I. Singleton,S. A. Wich, B. Goossens, K. S. Warren, E. J. Verschoor, D. Perwitasari-Farajallah, J. Pamungkas,M. Krützen, Sex-biased dispersal and volcanic activities shaped phylogeographic patterns ofextant orangutans (genus: Pongo). Mol. Biol. Evol. 28, 2275–2288 (2011).
26. A. Wilting, P. Christiansen, A. C. Kitchener, Y. J. M. Kemp, L. Ambu, J. Fickel, Geographicalvariation in and evolutionary history of the Sunda clouded leopard (Neofelis diardi) (Mamma-lia: Carnivora: Felidae) with the description of a new subspecies from Borneo. Mol. Phylogenet.Evol. 58, 317–328 (2011).
27. S. J. Herrington, in Tigers of the World, R. L. Tilson, U. S. Seal, Eds. (Noyes Publishing, ParkRidge, NJ, 1987), pp. 51–61.
28. J. H. Mazák, P. Christiansen, A. C. Kitchener, Oldest known pantherine skull and evolutionof the tiger. PLOS One 6, e25483 (2011).
29. D. Hooijer, Pleistocene remains of Panthera tigris (Linnaeus) subspecies from Wanhsien,Szechuan, China, compared with fossil and recent tigers from other localities. Am. Mus. Novit.1346, 1–17 (1947).
30. M. Turelli, N. H. Barton, J. A. Coyne, Theory and speciation discuss recent examples ofprogress in each of these areas. Trends Ecol. Evol. 16, 330–343 (2001).
31. E. Mayr, P. D. Ashlock, Principles of Systematic Zoology (McGraw-Hill, New York, ed. 2, 1991).32. E. O. Wilson, W. L. J. Brown, The subspecies concept and its taxonomic application. Syst. Zool.
2, 97–111 (1953).33. S. M. Haig, E. A. Beever, S. M. Chambers, H. M. Draheim, B. D. Dugger, S. Dunham, E. Elliott-Smith,
J. B. Fontaine, D. C. Kesler, B. J. Knaus, I. F. Lopes, P. Loschl, T. D. Mullins, L. M. Sheffield, Taxo-nomic considerations in listing subspecies under the U.S. Endangered Species Act. Conserv.Biol. 20, 1584–1594 (2006).
34. H. Voris, Maps of Pleistocene sea levels in Southeast Asia: Shorelines, river systems andtime durations. J. Biogeogr. 27, 1153–1167 (2000).
35. U. Karanth, J. M. Goodrich, S. Vaidyanathan, V. G. Reddy, Landscape Scale, Ecology-BasedManagement of Wild Tiger Populations (Global Tiger Initiative, World Bank, and WildlifeConservation Society, Washington, DC, 2010).
36. E. Wikramanayake, E. Dinerstein, J. Seidensticker, S. Lumpkin, B. Pandav, M. Shrestha, H. Mishra,J. Ballou, A. J. T. Johnsingh, I. Chestin, S. Sunarto, P. Thinley, K. Thapa, G. Jiang, S. Elagupillay,H. Kafley, N. M. B. Pradhan, K. Jigme, S. Teak, P. Cutter, M. A. Aziz, U. Than, A landscape-basedconservation strategy to double the wild tiger population. Conserv. Lett. 4, 219–227 (2011).
37. R. A. Bay, U. Ramakrishnan, E. A. Hadly, A call for tiger management using “reserves” ofgenetic diversity. J. Hered. 105, 295–302 (2013).
38. A. Rabinowitz, L. Hunter, J. Smith, Tiger conservation: Trust tradition. Science 333, 1824(2011).
Wilting et al. Sci. Adv. 2015;1:e1400175 26 June 2015
39. O. Byers, C. Lees, J. Wilcken, C. Schwitzer, The One Plan Approach: The philosophy andimplementation of CBSG’s approach to integrated species conservation planning. WAZAMag. 14, 2–5 (2013).
40. C. A. Driscoll, I. Chestin, H. Jungius, O. Pereladova, Y. Darman, E. Dinerstein, A postulate fortiger recovery: The case of the Caspian Tiger. J. Threat. Taxa 4, 2637–2643 (2012).
41. S.-J. Luo, W. E. Johnson, J. Martenson, A. Antunes, P. Martelli, O. Uphyrkina, K. Traylor-Holzer,J. L. D. Smith, S. J. O’Brien, Subspecies genetic assignments of worldwide captive tigers in-crease conservation value of captive populations. Curr. Biol. 18, 592–596 (2008).
42. K. Traylor-Holzer, X. Zhong, Y. Yuzhong, in Tigers of The World, R. Tilson, P. J. Nyhus, Eds.(Academic Press, London, ed. 2, 2010), pp. 457–461.
43. V. Mazák, Der Tiger (A. Ziemsen Verlag, Wittenberg Lutherstadt, Germany, 1965).44. R. J. Hijmans, S. E. Cameron, J. L. Parra, P. G. Jones, A. Jarvis, Very high resolution inter-
polated climate surfaces for global land areas. Int. J. Climatol. 25, 1965–1978 (2005).45. D. M. Olson, E. Dinerstein, E. D. Wikramanayake, N. D. Burgess, G. V. N. Powell, E. C. Underwood,
J. A. D’amico, I. Itoua, H. E. Strand, J. C. Morrison, C. J. Loucks, T. F. Allnutt, T. H. Ricketts, Y. Kura,J. F. Lamoreux, W. W. Wettengel, P. Hedao, K. R. Kassem, Terrestrial ecoregions of the world:A new map of life on earth. Bioscience 51, 933–938 (2001).
46. R Core Development Team, R: A Language and Environment for Statistical Computing (RFoundation for Statistical Computing, Vienna, Austria, 2013).
47. M. A. Larkin, G. Blackshields, N. P. Brown, R. Chenna, P. A. McGettigan, H. McWilliam, F. Valentin,I. M. Wallace, A. Wilm, R. Lopez, J. D. Thompson, T. J. Gibson, D. G. Higgins, Clustal W andClustal X version 2.0. Bioinformatics 23, 2947–2948 (2007).
48. P. H. A. Sneath, R. R. Sokal, Numerical Taxonomy: The Principles and Practice of NumericalClassification (Freeman, San Francisco, CA, 1973).
49. S. Dray, A. B. Dufour, The ade4 package: Implementing the duality diagram for ecologists.J. Stat. Softw. 22, 1–20 (2007).
50. D. Borcard, F. Gillet, P. Legendre, Numerical Ecology with R (Springer, New York, 2011).51. J. Pages, Analyse factorielle de donnees mixtes. Rev. Stat. Appl. LII, 93–111 (2004).52. S. Lê, J. Josse, F. Husson, FactoMineR: An R package for multivariate analysis. J. Stat. Softw.
25, 1–18 (2008).53. E. Paradis, J. Claude, K. Strimmer, APE: Analyses of phylogenetics and evolution in R
language. Bioinformatics 20, 289–290 (2004).54. S. J. Philips, R. P. Anderson, R. E. Schapire, Maximum entropy modeling of species geographic
distributions. Ecol. Model. 190, 231–259 (2006).55. Panthera, Tiger range map (2009).56. D. L. Warren, R. E. Glor, M. Turelli, ENMTools: A toolbox for comparative studies of environ-
mental niche models. Ecography 33, 607–611 (2010).57. H. Wickham, ggplot2: Elegant Graphics for Data Analysis (Springer, New York, 2009).58. L. Wei, X. Wu, L. Zhu, Z. Jiang, Mitogenomic analysis of the genus Panthera. Sci. China Life
Sci. 54, 917–930 (2011).59. X. Wu, T. Zheng, Z. Jiang, L. Wei, The mitochondrial genome structure of the clouded
leopard (Neofelis nebulosa). Genome 50, 252–257 (2007).60. W. E. Johnson, E. Eizirik, J. Pecon-Slattery, W. J. Murphy, A. Antunes, E. Teeling, S. J. O’Brien, The
late Miocene radiation of modern Felidae: A genetic assessment. Science 311, 73–77 (2006).61. B. W. Davis, G. Li, W. J. Murphy, Supermatrix and species tree methods resolve phylogenetic
relationships within the big cats, Panthera (Carnivora: Felidae). Mol. Phylogenet. Evol. 56, 64–76(2010).
62. P. Librado, J. Rozas, DnaSP v5: A software for comprehensive analysis of DNA polymor-phism data. Bioinformatics 25, 1451–1452 (2009).
63. P. Villesen, FaBox: An online toolbox for FASTA sequences. Mol. Ecol. Notes 7, 965–968(2007).
64. D. Posada, jModelTest: Phylogenetic model averaging. Mol. Biol. Evol. 25, 1253–1256(2008).
65. S. Guindon, J.-F. Dufayard, V. Lefort, M. Anisimova, W. Hordijk, O. Gascuel, New algorithmsand methods to estimate maximum-likelihood phylogenies: Assessing the performance ofPhyML 3.0. Syst. Biol. 59, 307–321 (2010).
66. F. Ronquist, M. Teslenko, P. van der Mark, D. L. Ayres, A. Darling, S. Höhna, B. Larget, L. Liu,M. A. Suchard, J. P. Huelsenbeck, MrBayes 3.2: Efficient Bayesian phylogenetic inferenceand model choice across a large model space. Syst. Biol. 61, 539–542 (2012).
67. A. J. Drummond, M. A. Suchard, D. Xie, A. Rambaut, Bayesian phylogenetics with BEAUtiand the BEAST 1.7. Mol. Biol. Evol. 29, 1969–1973 (2012).
68. A. Rambaut, A. J. Drummond, Tracer v1.4 (2007).69. J. L. D. Smith, C. W. McDougal, The contribution of variance in lifetime reproduction to
effective population size in tigers. Conserv. Biol. 5, 484–490 (1991).70. H. Bandelt, P. Forster, A. Röhl, Median-joining networks for inferring intraspecific phylogenies.
Mol. Biol. Evol. 16, 37–48 (1999).71. J. V Lopez, S. Cevario, S. J. O’Brien, Complete nucleotide sequences of the domestic cat
(Felis catus) mitochondrial genome and a transposed mtDNA tandem repeat (Numt) in thenuclear genome. Genomics 33, 229–246 (1996).
72. V. G. Heptner, A. A. Sludskii, in Mammals of the Soviet Union, R. S. Hoffmann, Ed. (VysshayaShkola Publisher, Moscow, 1992), vol. 2, pp. 95–183.
12 of 13

R E S EARCH ART I C L E
http://advanD
ownloaded from
73. V. Mazak, C. P. Groves, J. H. van Bree, On a skin and skull of the Bali tiger, and a list ofpreserved specimens of Panthera tigris balica (Schwarz, 1912). Z. Saeugetierkunde 43, 108–113(1978).
74. M. E. Sunquist, F. C. Sunquist, in Handbook of the Mammals of the World, D. E. Wilson,R. A. Mittermeier, Eds. (Lynx Edicions, Barcelona, 2009), pp. 54–168.
75. J. Seidensticker, C. W. McDougal, in Symposium of the Zoological Society of London, N. Dunstone,M. L. Gorman, Eds. (The Zoological Society of London, Oxford, UK, 1993), vol. 65, pp. 105–125.
76. S. M. Barber-Meyer, S. R. Jnawali, J. B. Karki, P. Khanal, S. Lohani, B. Long, D. I. MacKenzie,B. Pandav, N. M. B. Pradhan, R. Shrestha, N. Subedi, G. Thapa, K. Thapa, E. Wikramanayake,Influence of prey depletion and human disturbance on tiger occupancy in Nepal. J. Zool.289, 10–18 (2013).
77. A. Johnson, C. Vongkhamheng, M. Hedemark, T. Saithongdam, Effects of human–carnivoreconflict on tiger (Panthera tigris) and prey populations in Lao PDR. Anim. Conserv. 9, 421–430(2006).
78. A. P. Andheria, K. U. Karanth, N. S. Kumar, Diet and prey profiles of three sympatric largecarnivores in Bandipur Tiger Reserve, India. J. Zool. 273, 169–175 (2007).
79. C. M. Francis, A Guide to the Mammals of Southeast Asia (Princeton Univ. Press, Oxford, UK,2008), 392 pp.
80. T. G. O’Brien, M. F. Kinnaird, H. T. Wibisono, Crouching tigers, hidden prey: Sumatran tigerand prey populations in a tropical forest landscape. Anim. Conserv. 6, 131–139 (2003).
81. R. Tilson, H. Defu, J. Muntifering, P. J. Nyhus, Dramatic decline of wild South China tigersPanthera tigris amoyensis: Field survey of priority tiger reserves. Oryx 38, 40–47 (2004).
82. U. Ramakrishnan, R. G. Coss, N. W. Pelkey, Tiger decline caused by the reduction of largeungulate prey: Evidence from a study of leopard diets in southern India. Biol. Conserv. 89,113–120 (1999).
83. H. S. Reddy, C. Srinivasulu, K. T. Rao, Prey selection by the Indian tiger (Panthera tigris tigris)in Nagarjunasagar Srisailam tiger reserve, India. Mamm. Biol. 69, 384–391 (2004).
84. S. Biswas, K. Sankar, Prey abundance and food habit of tigers (Panthera tigris tigris) inPench National Park, Madhya Pradesh, India. J. Zool. 256, 411–420 (2002).
85. E. Eizirik, J.-H. Kim, M. Menotti-Raymond, P. G. Crawshaw, S. J. O’Brien, W. E. Johnson, Phylo-geography, population history and conservation genetics of jaguars (Panthera onca, Mamma-lia, Felidae). Mol. Ecol. 10, 65–79 (2001).
Wilting et al. Sci. Adv. 2015;1:e1400175 26 June 2015
86. O. Uphyrkina, W. E. Johnson, H. B. Quigley, D. G. Miquelle, L. Marker, M. E. Bush, S. J. O’Brien,Phylogenetics, genome diversity and origin of modern leopard, Panthera pardus. Mol. Ecol. 10,2617–2633 (2001).
87. A. Antunes, J. L. Troyer, M. E. Roelke, J. Pecon-Slattery, C. Packer, C. Winterbach, H. Winterbach,G. Hemson, L. Frank, P. Stander, L. Siefert, M. Driciru, P. J. Funston, K. A. Alexander, K. C. Prager,G. Mills, D. Wildt, M. Bush, S. J. O’Brien, W. E. Johnson, The evolutionary dynamics of thelion Panthera leo revealed by host and viral population genomics. PLOS Genet. 4, e1000251(2008).
Acknowledgments: We thank D. Mörike, F. Mayer, G. Lenglet, N. Mascarenhas, T. M. Kaiser,and C. Stefen for supplying samples of Javan and Bali specimens on which the molecular workis based. We also thank R. Redel for his assistance with the laboratory analyses, and D. Hills,P. Jenkins, L. Tomsett, and R. Portela-Miguez (Mammal Section, Natural History Museum, London),C. Smeenk (Naturalis, Leiden), and F. Mayer (Museum für Naturkunde, Berlin) for access to tigerspecimens in their care. Funding: This work was funded by the German Research Foundation(DFG grant Fi-698/5-1) and the Federal Ministry of Education and Research (BMBF FKZ:01LN1301A). Author contributions: A.W., J.F., and A.C.K. conceived the idea and wrote the man-uscript; A.C., P.C., J.N., A.K.S., L.O., N.B., H.H., and S.K.-S. edited the manuscript; A.W., L.O., N.B.,and J.F. performed the molecular analysis; P.C. collected the skull data; A.C.K. collected thepelage data; A.C. analyzed the skull, pelage, and ecological data; A.W., J.N., A.K.S., and S.K.-S.performed the ecological modeling and the GIS analyses. Competing interests: The authorsdeclare that they have no competing interests. Data and materials availability: GenBankaccession no. KR349728-KR349907.
Submitted 4 December 2014Accepted 5 May 2015Published 26 June 201510.1126/sciadv.1400175
Citation: A. Wilting, A. Courtiol, P. Christiansen, J. Niedballa, A. K. Scharf, L. Orlando, N. Balkenhol,H. Hofer, S. Kramer-Schadt, J. Fickel, A. C. Kitchener, Planning tiger recovery: Understandingintraspecific variation for effective conservation. Sci. Adv. 1, e1400175 (2015).
ce
13 of 13
on February 7, 2018
s.sciencemag.org/

Planning tiger recovery: Understanding intraspecific variation for effective conservation
Heribert Hofer, Stephanie Kramer-Schadt, Jörns Fickel and Andrew C. KitchenerAndreas Wilting, Alexandre Courtiol, Per Christiansen, Jürgen Niedballa, Anne K. Scharf, Ludovic Orlando, Niko Balkenhol,
DOI: 10.1126/sciadv.1400175 (5), e1400175.1Sci Adv
ARTICLE TOOLS http://advances.sciencemag.org/content/1/5/e1400175
MATERIALSSUPPLEMENTARY http://advances.sciencemag.org/content/suppl/2015/06/23/1.5.e1400175.DC1
REFERENCES
http://advances.sciencemag.org/content/1/5/e1400175#BIBLThis article cites 65 articles, 3 of which you can access for free
PERMISSIONS http://www.sciencemag.org/help/reprints-and-permissions
Terms of ServiceUse of this article is subject to the
registered trademark of AAAS.is aScience Advances Association for the Advancement of Science. No claim to original U.S. Government Works. The title
York Avenue NW, Washington, DC 20005. 2017 © The Authors, some rights reserved; exclusive licensee American (ISSN 2375-2548) is published by the American Association for the Advancement of Science, 1200 NewScience Advances
on February 7, 2018
http://advances.sciencemag.org/
Dow
nloaded from