planning for passenger rail in small cities and towns
TRANSCRIPT

University of Massachusetts Amherst University of Massachusetts Amherst
ScholarWorks@UMass Amherst ScholarWorks@UMass Amherst
Masters Theses 1911 - February 2014
2010
Planning for Passenger Rail in Small Cities and Towns Planning for Passenger Rail in Small Cities and Towns
Alyssa R. Larose University of Massachusetts Amherst
Follow this and additional works at: https://scholarworks.umass.edu/theses
Part of the Urban, Community and Regional Planning Commons, and the Urban Studies and Planning
Commons
Larose, Alyssa R., "Planning for Passenger Rail in Small Cities and Towns" (2010). Masters Theses 1911 - February 2014. 520. Retrieved from https://scholarworks.umass.edu/theses/520
This thesis is brought to you for free and open access by ScholarWorks@UMass Amherst. It has been accepted for inclusion in Masters Theses 1911 - February 2014 by an authorized administrator of ScholarWorks@UMass Amherst. For more information, please contact [email protected].

PLANNING FOR PASSENGER RAIL IN SMALL CITIES AND TOWNS:
POTENTIAL IMPACTS AND BEST PLANNING PRACTICES TO MAKE THE MOST OF
TRANSIT INVESTMENTS
A Thesis Presented
by
ALYSSA R. LAROSE
Submitted to the Graduate School of the
University of Massachusetts Amherst in partial fulfillment
of the requirements for the degree of
MASTER OF REGIONAL PLANNING
September 2010
Department of Landscape Architecture and Regional Planning

© Copyright by Alyssa R. Larose 2010
All Rights Reserved

PLANNING FOR PASSENGER RAIL IN SMALL CITIES AND TOWNS:
POTENTIAL IMPACTS AND BEST PLANNING PRACTICES TO MAKE THE MOST OF
TRANSIT INVESTMENTS
A Thesis Presented
by
ALYSSA R. LAROSE
Approved as to style and content by:
____________________________________________
Elisabeth Hamin, Chair
____________________________________________
Henry Renski, Member
____________________________________________
Michael DiPasquale, Member
________________________________________
Elizabeth Brabec, Department Head
Landscape Architecture and Regional Planning

iv
ACKNOWLEDGEMENTS
I would like to thank my committee for their guidance throughout this process. I am also
grateful to the city staff members of Saco and Biddeford Maine who took the time to speak
with me for this research. Thanks and good luck to my classmates, past and present, who
have been supportive along the way. Finally I am especially grateful to Daniel and Finny for
supporting and putting up with me these last two years.

v
ABSTRACT
PLANNING FOR PASSENGER RAIL IN SMALL CITIES AND TOWNS:
POTENTIAL IMPACTS AND BEST PLANNING PRACTICES TO MAKE THE MOST
OF TRANSIT INVESTMENTS
SEPTEMBER 2010
ALYSSA R. LAROSE, B.A., JAMES MADISON UNIVERSITY
M.R.P., UNIVERSITY OF MASSACHUSETTS AMHERST
Directed by Professor Elisabeth Hamin
Projects to expand the passenger rail network in the United States will connect major
metropolitan areas over long distances, travelling through smaller communities along the
way. Transit-oriented development (TOD) is a concept for planning around stations to
support transit and allow the development of dense, mixed use, walkable places. TOD
literature focuses largely on developing around transit in metropolitan areas. Guidance for
small towns and cities in rural areas is lacking.
This thesis compares best planning practices from TOD literature to the planning
practices of small cities located in rural areas of New England where new passenger rail
service or a new station has been developed in the last fifteen years. The research focuses on
planning efforts in the area within a half mile of the station. Two indicators, property values
and ridership, were also used to determine if the service has impacted the area surrounding
the station. The goal of the research is to determine how planning for rural stations differs
from planning for TOD in metropolitan areas.
Findings show that many of the best planning practices from the literature were
applied in the small cities, though there were a few important differences. The station was

vi
included as part of broader development plans, rather than acting as a central focus of the
plan. Additionally, it was found that stations should incorporate multiple uses to create
activity throughout the day since train service is less frequent than in an urban setting.

vii
CONTENTS
PAGE
ACKNOWLEDGEMENTS.................................................................................................iv
ABSTRACT ............................................................................................................................ v
LIST OF TABLES ................................................................................................................. ix
LIST OF FIGURES................................................................................................................ x
CHAPTER
1. INTRODUCTION............................................................................................................. 1
1.1. Background of Issues ............................................................................................................. 1
1.2. Need for this Research ........................................................................................................... 2
1.3. Research Questions................................................................................................................. 3
1.4. Assumptions ............................................................................................................................ 4
1.5. Goals of the Research ............................................................................................................. 5
1.6. Methods .................................................................................................................................... 5
2. LITERATURE REVIEW ................................................................................................... 7
2.1. The Connection between Transportation and Land Use in U.S. Development
Patterns............................................................................................................................................. 7
2.2. Impacts of Passenger Rail Stations on the Surrounding Area ..................................... 11
2.3. Transit-Oriented Development and the Transit District............................................... 14
2.4. Conclusion.............................................................................................................................. 35
3. METHODOLOGY .......................................................................................................... 36
3.1. Literature Review.................................................................................................................. 36
3.2. Development of Best Practices for Planning the Transit District ................................ 37
3.3. Case Studies ........................................................................................................................... 39
3.4. Indicators ................................................................................................................................ 45
4. BEST PRACTICES FOR PLANNING THE TRANSIT DISTRICT....................... 49
4.1. The Planning Process ........................................................................................................... 49
4.2. Mix of Uses............................................................................................................................. 53
4.3. Density .................................................................................................................................... 54
4.4. Connectivity and Mobility .................................................................................................. 55
4.5. Place-Making and Urban Design....................................................................................... 56
4.6. Station Location, Design, and Access................................................................................ 59
4.7. Parking .................................................................................................................................... 61
4.8. Market Considerations......................................................................................................... 63
4.9. Regional Planning and Policy Support............................................................................. 64
4.10. Transit Service Quality ...................................................................................................... 65
5. CASE STUDIES............................................................................................................... 66

viii
5.1. Saco and Biddeford, Maine................................................................................................. 67
5.2. Pittsfield, Massachusetts ................................................................................................... 110
5.3. Rutland, Vermont................................................................................................................ 128
6. ANALYSIS AND FINDINGS..................................................................................... 143
6.1. Analysis of the Application of Planning Best Practices .............................................. 143
6.2. Findings ................................................................................................................................ 151
7. CONCLUSION.............................................................................................................. 155
APPENDICES
A. BEST PLANNING PRACTICES SUMMARY MATRIX...................................... 157
B. BEST PLANNING PRACTICES ANALYSIS TABLE ........................................... 167
C. INTERVIEW QUESTIONS FOR PLANNING STAFF ......................................... 169
D. INTERVIEW CONSENT FORM .............................................................................. 172
REFERENCES .................................................................................................................... 175

ix
LIST OF TABLES
TABLE PAGE
3.1. Best Planning Practices for the Transit District.......................................................................38
3.2. Case Study Communities and Passenger Rail Service...........................................................43
5.1. Total Ridership (boardings and alightings) for the Saco/Biddeford Station and the
Downeaster, 2003 – 2009..................................................................................................................101
5.2. Saco Number of Sales by Distance from Train Station........................................................102
5.3. Biddeford Number of Sales by Distance to the Train Station.............................................105
5.4. Amtrak Ridership (total boardings and alightings) at Pittsfield Station, FY 1999 to FY
2009.....................................................................................................................................................126

x
LIST OF FIGURES
FIGURE PAGE
3.1. Case Study Communities...........................................................................................................42
5.1. Saco Transportation Center........................................................................................................71
5.2. Pedestrian crossing from downtown to Saco Island on east side of Main Street...............74
5.3. Lack of sidewalk on the west side of Main Street, opposite the transportation center.....74
5.4. Construction of a riverwalk is underway................................................................................76
5.5. A pedestrian path leading to the station from Main Street...................................................78
5.6. Biddeford’s Mill District, as seen from Saco Island................................................................85
5.7. Open space plan for the Mill District, including a riverwalk and two pedestrian bridges
to Saco Island.......................................................................................................................................92
5.8. Biddeford’s downtown...............................................................................................................93
5.9. Saco Median Sales Price Per Square Foot by Distance from the Station...........................103
5.10. Saco Percentage Increase of Median Sale Price Per Square Foot by Distance from the
Station.................................................................................................................................................104
5.11. Biddeford Median Sales Price Per Square Foot by Distance from Station......................105
5.12. Biddeford Percentage Increase of Median Sales Price Per Square Foot by Distance from
Station.................................................................................................................................................106
5.13. Pittsfield’s Intermodal Transportation Center....................................................................110
5.14. The plaza in front of the station.............................................................................................120
5.15. Pedestrian access from the rear of the station.....................................................................121
5.16. The pedestrian pathway connecting downtown to a nearby neighborhood.................132

xi
5.17. Pedestrian-oriented downtown with new street trees.......................................................136
5.18. The large surface parking lot in front of the shopping plaza............................................136
5.19. The Rutland train station........................................................................................................137
5.20. View from the station looking towards downtown...........................................................137

1
CHAPTER 1
INTRODUCTION
1.1. Background of Issues
Many industrial towns and cities in New England grew in a compact manner, with mills
surrounded closely by housing for workers and a commercial downtown. Often the
introduction of rail helped precipitate this growth, by connecting both the industry and the
residents to the larger region, while concentrating growth within walking distance to the
station. Over the years as the automobile has become the primary mode of transportation,
many of these towns and cities have lost passenger rail service, but retain much of the
mixed use, compact built environment downtown. Unfortunately the decline in
manufacturing and the decentralization of commercial uses from downtown to the suburbs
has caused many of these central areas to decline economically and physically. Many
communities have undertaken efforts in recent years to revitalize there struggling
downtowns, with strategies such as the reuse of old mill buildings, development of housing
on upper floors of commercial buildings, and the promotion of downtowns as cultural and
entertainment centers have begun to enliven what was once the core of these communities.
At the same time a resurgence in support for increased passenger rail service has
emerged in the United States. Increasing interest in intercity passenger rail is due to several
factors, including environmental benefits, the rise of oil prices and decline of fossil fuel
resources, spatial mismatch and equity issues, and both short and long term economic
benefits of implementing infrastructure improvements (Huang 1996). Introducing passenger

2
rail to a community has the potential to draw development and investment to the area
surrounding the station (Dunphy et al. 2004; Huang 1996; TCRP 1998). While much research
has focused on rail transit in large metropolitan areas, less has been focused on the impacts
of rail to smaller cities and towns.
The literature in general is in agreement that the full benefits of rail investment will
not be realized without appropriate planning in and around the station area. Over the last
two decades planners have pushed for development around stations to occur in a way that
both supports transit and capitalizes on the transit investment by creating a desirable place
for businesses and residents to locate. Transit-oriented development (TOD) has become the
popular term for planning dense, mixed use, pedestrian-oriented development around
transit stops. Along some transit corridors, stations are surrounded by large parking lots,
accessible only be car. For other areas, TOD is and has been a reality for decades. In many
small old industrial towns and cities, TOD exists but without the transit. The literature on
TOD however also focuses on implementing this type of development in large metropolitan
areas, and little is mentioned on how to do so in a smaller community far from a major
metropolitan area.
1.2. Need for this Research
Today, with eight billion dollars of federal stimulus money being distributed throughout
the country for “shovel ready” high speed and intercity rail projects (ARRA 2009), the need
to implement planning around future stations is urgent. The proposed and existing intercity

3
routes that connect major metropolitan areas also travel through smaller towns and cities in
between. In New England, several projects receiving federal funding will reinstate
passenger rail to small cities that once were connected by rail (ARRA 2010). Other towns
and cities that already have intercity rail, such as Pittsfield, MA and New London, CT, are
making investments to improve multimodal connections through the development of
stations that incorporate rail, bus and other transportation services at one location (SECCOG
2009, BRTA 2010). Research is needed that focuses on small communities outside of large
metropolitan areas and what these communities can do to plan for and capitalize on transit
investments.
1.3. Research Questions
This research will explore Transit-Oriented Development in the context of small cities in
New England located in rural areas. The questions the research intends to answer are as
follows:
1. How have small cities planned for the area surrounding a station, and how does this
differ from best planning practices presented in the TOD literature that focus on
larger metropolitan areas?
2. What are the impacts of passenger rail service to an existing downtown in small
cities and towns over time in terms of property values and ridership?

4
1.4. Assumptions
In existing small towns and cities, the location of a new rail stop or station will be partially
dictated by where existing tracks are located. A town or city may have some choice as to
where the stop can be located along the tracks, but these choices will likely be limited.
Therefore a central location, which is considered ideal, may not be possible and may be out
of the control of the local government. Many older towns and cities that grew up around rail
in the first place do have tracks that still go through downtown, but this may not be the case
for all communities, and the reuse or redevelopment of area along the tracks may make
finding a location for a stop more difficult in a built up area.
Another hurdle that is outside of the control of local governments is the frequency of
train service. It can be assumed that service in rural areas will be less frequent than in an
urban setting, and a comprehensive transit network is likely to be lacking. This will make
the service less convenient to use for many people, and will likely lessen the impact of the
service to the area around the station. Finally, while this research is comparing best
planning practices from the literature that focuses largely on transit systems in large cities, it
cannot be assumed that these practices always occur in metropolitan areas. Comparing the
best practices to actual practices in metropolitan settings could be the topic of further
research. However for the purpose of this research, the comparison is between practices in
small communities in rural areas and what is recommended as best practices in
metropolitan areas.

5
1.5. Goals of the Research
The goal of the research is to determine what planning practices are most applicable to small
communities when planning for a transit investment, and what lessons can be learned from
cities where these investments have already occurred. The hope is to provide guidance to
similar communities that may be planning for a new passenger rail stop. Through looking at
the experiences of four small New England cities, this research will add to the literature of
land use and transportation planning, with a focus on small, rather than large, cities.
1.6. Methods
A thorough literature review was first completed. The connection between land use and
transportation in the United States was explored, from the walkable city to streetcar suburbs
to post WWII suburbia. Next, research on the potential impact of passenger rail to the area
surrounding the station was reviewed. Finally, a review of literature on transit-oriented
development and strategies for planning the area around a station to both support transit
and create a sense of place was conducted.
From the literature review a set of best practices for planning the transit district, the
area within a half mile of a station, was developed. These best practices were applied to four
case study communities to determine which best practices apply to smaller cities. The case
study communities were chosen based on the criteria that they have either had passenger
rail reinstated in the recent past, or a major transit investment (the development of a

6
multimodal station) has occurred in the recent past. Additionally, the population of the
community had to be less than 50,000, and it had to be located in a rural area, outside of a
metropolitan area. The four communities that were chosen are Saco, Maine, Biddeford,
Maine, Pittsfield, Massachusetts, and Rutland, Vermont.

7
CHAPTER 2
LITERATURE REVIEW
The literature review begins with a history of the relationship between transportation and
land use, starting with the walking city and concluding with post WWII development
trends that have created obstacles for the implementation of transit. Next, research on the
impacts of passenger rail service to the area surrounding the station is explored. This is
followed by an overview of the concept of transit-oriented development (TOD), a strategy
meant to help communities capitalize on transit investments and boost the potential positive
impacts on the area surrounding the station. The goals of TOD, how to accomplish TOD
through planning, and the potential benefits of implementing the strategy are reviewed. The
research in this thesis is intended to add to the literature by exploring the impacts of transit
investments and planning approaches towards transit investments in a small town or city
context.
2.1. The Connection between Transportation and Land Use in U.S. Development Patterns
Transportation has historically been a large influence on development and growth.
Originally cities were walkable, taking into account the main mode of transportation for city
dwellers, and growth did not occur beyond reasonable walking distance from the center
(Huang 1996). Beginning in the mid 1800s, railroads made it possible for wealthier residents
and city businessmen to build country estates outside of the city, paying the expensive fare

8
to commute to cities like Boston when necessary (Warner 1978). However it was not until
more affordable streetcar service and other city services, like sewer and water, were
introduced to outlying areas that significant development occurred (Warner 1978). Sam Bass
Warner, Jr. describes the development of three Boston neighborhoods along streetcar lines
in the last three decades of the 19th century, in his book Streetcar Suburbs: The Process of
Growth in Boston (1870 – 1900). Because of the nature of streetcar transportation, which
stopped frequently, dense residential neighborhoods spread out between lines of service,
with commercial strips typically lining the streetcar routes. This facilitated the
decentralization of the congested central city, but only to a point. Once far enough from the
city, streetcar service no longer offered a reasonable commute time, and development
tapered off (Warner 1978).
The advent of the automobile posed new problems and opportunities to planners.
Congestion in cities was exacerbated by the mixing of fast travelling cars, slower streetcars,
and pedestrians (Brown et al. 2009). The need for improved roadways was apparent, and
seen as an opportunity to both relieve inner city congestion by moving people throughout
the city more efficiently, and by creating an intercity network of freeways to help farmers
move their goods to market more quickly (Brown et al. 2009). However after WWII, a
pressing demand for new housing due to returning veterans who were starting families
added another reason for needing a national highway system (Hayden 2003). Highways
would open up vast amounts of land beyond the city to new development. A powerful
lobbying group, lead by General Motors and including members from the construction, real
estate, and homebuilding industries, were instrumental in pushing for the passage of the

9
1956 Interstate Highway Act, which would represent a new direction in national
transportation policy that favored the automobile over all other transportation modes
(Jackson 1985). The construction of highways, along with additional policies encouraging
single family homeownership in auto-dependent suburban locations over the rehabilitation
of city neighborhoods, contributed to the mass-production of what has become the
dominant residential land use pattern in the United States – low density sprawl (Hayden
2003; Rae 2003).
Development trends since WWII have created obstacles for the effectiveness of
transit and passenger rail (Due 1997). Along with land use patterns favoring low density
residential growth, businesses have also located in suburbs, changing the traditional
commuting and travel patterns from those that largely converge on the central city for work
and shopping, to patterns that are dispersed among many places separated by large
distances (Due 1997). This dispersion reduces the viability of rail transit, which relies on
fixed routes that cannot cater to suburban patterns.
Beginning in the 1970s, new rail transit systems were developed in a few large
metropolitan areas (BART in the San Francisco area, MARTA in the Atlanta area, and
WMATA in the Washington, D.C. area) to relieve some of the congestion that was created
by such auto-dependent land use patterns. However, these systems were built to function
largely as park and ride systems, where people drove to the station, parked, and rode the
train into the city. Large surface parking lots precluded development adjacent to the station,
created physical barriers between the station and the community, and gave dominance to
the automobile over the pedestrian when accessing the station (Dittmar and Ohland, 2004).

10
In recent years, planners have increasingly been interested in using transportation as
a way to redirect growth around transit stations, for reasons that include providing
alternative transportation to those who do not or cannot drive, alleviating traffic congestion,
promoting regional economic growth, lowering energy consumption, and mitigating air
pollution (Huang 1996). The connection between land use and transportation is a key
component in Transit-Oriented Development - dense mixed-use development around
transit stations, a concept that will explored in much detail in this research - and Smart
Growth strategies that aim to focus development in existing built-up areas rather than in
undeveloped outlying areas as a way to promote alternatives to automobile use (Handy
2005). The success of these strategies to significantly decrease automobile use is debatable
(Handy 2005). However what is especially important to this research is the potential to
redirect development to existing built areas, such as downtown Greenfield. Planning for
development and redevelopment in the area surrounding a transit station will be discussed
in detail below, along with potential benefits that planned development around transit may
bring.
It is clear from the literature that transportation is more than just about the
movement of people and goods; it also has the ability to impact development to varying
degrees. The following section reviews research on the specific land use and economic
impacts of passenger rail to areas surrounding stations, and to what degree these impacts
are due to the service itself or to other influencing factors.

11
2.2. Impacts of Passenger Rail Stations on the Surrounding Area
Accessibility is the basic premise underlying the connection between transportation and
land use (Dunphy et al. 2004; Huang 1996; Handy 2005; TCRP 1998). Cheap and relatively
fast accessibility to the central city via streetcar enabled growth of original suburbs around
cities. The highways produced similar effects on a grander scale, opening up once rural land
to development. The more accessible a location, the more growth it will likely attract. As
discussed in the last section, the form of transportation can greatly influence the type of
development that occurs in a location. Given that the introduction of a passenger rail station
theoretically increases accessibility to the area, what are the impacts on that area?
The Transit Cooperative Research Program published a guidebook in 1998 for
measuring economic impacts of transit investments, seeing a need for better analysis
because “[…] transit’s potential to produce economic benefits has become increasingly
important to the decision-making process for transit investments,” (TCRP 1998, 9). The
guidebook describes three different categories of transit-related impacts: generative impacts,
redistributive impacts, and transfer impacts. Generative impacts produce net economic
growth in a region by utilizing underused resources more efficiently, and include travel
time savings, improved environmental quality, and increased job accessibility. Transfer
impacts shift money from one entity to another, and include the local employment created
by constructing, maintaining, and operating the transit system which is financed through
public funds. Redistributive impacts are shifts in the location of economic activity, such as
development occurring around stations rather than dispersed throughout a region. In
economic terms, this type of impact is considered zero-sum, since development would have

12
occurred anyway, just in another location in the region. Nevertheless, redistributive benefits
are important if the goals of a project are to stimulate investment in a specific area, such as a
downtown.
Past research concerning the economic impacts of a commuter rail station to the
surrounding area have been mixed in terms of what can be attributable only to the station,
rather than to other factors, and poses a major challenge to this research. A study attempting
to look at local impacts of commuter rail stations in Atlanta’s MARTA system claimed to
control for non-station influences in the analysis. This was possible due to Atlanta’s decision
not to adopt any policies surrounding new stations, aside from rezoning for the station
itself. The results showed little impacts from the implementation of commuter rail. Some
reasons given were that these areas were already easily accessible by car, Atlanta being a
typical American city – decentralized and auto-oriented - thus making it difficult to justify
rail investment (Bollinger 1997).
Numerous studies have shown that land values surrounding commuter rail stations
in metropolitan areas are higher than values farther from the station. A study of Somerville,
MA, shows higher residential land costs surrounding existing subway stops than in areas
within the same city not served by rail (Reconnecting America 2008). The study assumes
that housing costs will also rise in areas targeted for future rail service in the city, and
advocates for planning that will retain affordable housing in these areas. In Chicago, the
implementation of a commuter rail stop in an existing neighborhood was found to raise
property values within at least a half mile of the station (McDonald 1995). This rise in value
begins to lessen the farther the stops are to the central city. What is important to note about

13
this study is that land values began to rise as soon as the station sites were announced, but
before service actually began. The quick response of the real estate market reinforces the
urgency of initiating planning before a project is official.
A recent study has looked at why some U.S. cities have decided to build rail transit
in the recent past and others haven’t, and which ones were able to successfully implement
rail (Lane 2008). The findings showed that cities were more likely to build rail when a
successful bus system was already in place, which indicated that a demand for transit
already existed. The study also concludes that rail systems that were most successful
incorporated economic development efforts with the proposed transit.
Most research has focused on large metropolitan areas throughout the United States
and Canada. One study found that transportation infrastructure investments in rural areas
can influence the local economy by expanding the use of existing resources, attracting
additional resources to the area, and making rural economies more productive. These
impacts however are likely to be modest, but infrastructure improvements nevertheless
should be part of an economic development program (Fox and Porca 2001).
Though impacts may be less in a small community than in a large metropolitan area,
the potential for a town or small city to benefit from passenger rail certainly exists. The need
to complement the implementation of rail transit with other policies and efforts in order to
achieve intended impacts and goals, however, is a common theme in the literature. The next
section discusses the literature on developing the area surrounding a transit station, a
concept most commonly known as transit-oriented development; how to plan for this

14
development, and why planning is necessary for a community to fully realize the benefits of
passenger rail.
2.3. Transit-Oriented Development and the Transit District
The previous sections have demonstrated some of the challenges that transit faces today.
Land use patterns and lending practices since WWII have consistently favored low density,
single use, auto-dependent development that does not support the use of public transit.
Further, it has been shown how transit investments such as new rail service, upgrades to
existing service, and station improvements, are more likely to significantly impact the area
surrounding a station when local and regional supportive policies are in place. This section
will explore the literature on the concept of transit-oriented development (TOD), a strategy
that is meant to both support transit and build more vibrant communities by capitalizing on
transit investments. The characterisitics of transit-oriented development and a definition of
the transit district that will be used for this research are reviewed, followed by the evolution
of different approaches to the concept of TOD. The largely urban focus of literature on the
subject and the few typologies of transit-oriented places that address smaller towns are the
reviewed. The section will conclude with an overview of how to plan the transit district, the
potential benefits of TOD, and the obstacles to implementation.
15
2.3.1. Defining TOD and the Transit District
The term transit-oriented development, first coined by Peter Calthorpe in his 1993 book The
Next American Metropolis: Ecology, Community, and the American Dream, is the most commonly
used in the literature (Dunphy et al. 2004). However there are a number of other terms used
to describe the development of a transit-supportive place. Transit villages is also used often
and was introduced by Bernick and Cervero in their 1997 book Transit Villages in the 21st
Century. Other terms include transit-focused development, transit-friendly development,
and transit-supportive development (Dunphy et al. 2004). Regardless of the name that is
used, what exactly does this type of development consist of?
The literature generally agrees on what the characteristics of transit-oriented
development, though definitions range from specific to broad. A transit-oriented
development is most commonly characterized as a dense, mixed use, pedestrian-friendly
area surrounding a transit stop (Calthorpe 1993, Bernick and Cervero 1997, Dittmar and
Ohland 2004, Dunphy et al. 2004, TCRP 2004). This type of development allows residents
and workers to easily access goods, services, and transit by foot or by bike. Calthorpe’s
definition is specific about the mix of uses that should be included: residential, retail, office,
open space, and public uses. These uses should be centered in and around a core
commercial area. Public uses are required to serve the needs of residents and workers,
including services and public spaces (Calthorpe 1993). One source warns of too narrowly
defining TOD, and that it will depend on the individual circumstances of each location
(TCRP 2004). Several sources have developed typologies that attempt to address the
differences of some TOD locations, which will be discussed in more detail below.

16
Some of the literature also distinguishes between the type of transit that is necessary
for TOD to occur. In most cases, the assumption is that TOD will occur around fixed-rail
transit, such as heavy rail (subway), commuter rail, and some light rail systems. These
systems have the ability compete with automobiles, since they travel on a separate right of
way and are not impacted by road congestion. The fixed-route nature of rail also brings
more certainty to those looking to invest in the area surrounding a station due to the fact
that it is less likely for the route to be changed in the future. These characteristics can make
living or locating a business near a station more attractive. Buses do not have either of these
attributes. Dittmar and Ohland (2004) note: “Bus systems are subservient to the automobile,
because they use the same streets and contend with the same congestion, but don’t perform
as well,” (p.5). Bus routes can also be changed easily or abandoned. For these reasons, “in
most cases bus service has less influence on land-use patterns than fixed-rail transit,”
(Dittmar and Ohland 2004, p.6). However, several sources do discuss the potential for
developing around bus transit (Calthorpe 1993, Dunphy et al. 2004). The impacts of the
quality and nature of transit service to TOD will be discussed in more detail in Section 4.
Best Practices for Planning the Transit District.
In addition to defining the characteristics of transit-oriented development, most
sources also define the size of area surrounding the station where this type of development
should occur. Dunphy et al. (2004) call this area the transit district, and this is the term that
will be used in this research when talking about the area being planned or developed. The
size of the transit district is based on what is deemed to be a comfortable walking distance
from the center to the edge. Calthorpe (1993) uses an average 2,000-foot walking distance

17
from a transit stop or core commercial area to define the transit district. Dunphy et al. (2004)
define the transit district as extending at least ¼ mile from the station. Bernick and Cervero
(1997) define their transit villages as being within a ¼ mile radius of the station, and the
Center for Transit-Oriented Development defines the district as a ½ mile circle around a
station. For the purpose of this research, the transit district will be defined as the area within
a ½ mile radius of the transit station.
While the literature agrees on the general characteristics of transit-oriented
development, there are some differences in how the literature approaches the concept. The
goals and objectives for implementing TOD range from regional growth management,
place-making and livability, increased transit ridership, and community revitalization. The
next section reviews the origin of the concept and three different approaches to TOD.
2.3.2. The Origins of the Concept of Transit-Oriented Development
Peter Calthorope first coined the term “transit-oriented development” in his 1993 book The
Next American Metropolis: Ecology, Community, and the American Dream. The book outlines a
number of guidelines that attempt to define a new direction for the built environment, one
that moves away from the low density, auto-oriented, single use forms of the recent past.
Calthorpe lists three general principles that should guide future development at the
regional, local, and site specific level: regional growth should be guided by the expansion of
transit and a more compact urban form; single use zoning should be replaced with zoning
for mixed-use, walkable neighborhoods; and urban design policies should create buildings

18
that are oriented toward the public domain and human dimension rather than the private
domain and the scale of the automobile (p.41). Other concepts, Calthorpe notes, share
similar principles, such as New Urbanism and Traditional Neighborhood Design, but that
what makes TOD different is its emphasis on transit. To Calthorpe, transit can act as a tool
for defining an edge to a metropolitan area, therefore reducing sprawl, and for encouraging
infill and redevelopment within the existing built-up area.
Despite the emphasis on transit, Calthorpe believes that it is land use planning that
ultimately should precede transit planning in metropolitan regions. He writes that “Land
use patterns should lead transit service planning, rather than expecting transit to come to an
area that must be retrofitted to provide transit-supportable densities” (p.62). Following this
reasoning, Calthorpe states that TOD can and should occur without transit, and that transit
is dependent on such development in order to survive. Creating mixed use, compact,
walkable areas on a regional scale can help reduce auto dependence without transit, and can
help support transit if and when it is implemented. Calthorpe writes, “TODs can exist
without transit, but our transit systems have little chance of survival in the low-density
environment of sprawling suburbs […],” (p.42).
Calthorpe clearly sees TOD as more than just a form of development that can
support transit, which to him is one end result. The goals of TOD are much broader than
simply supporting transit. He states that the principles of TOD are “simply a return to the
timeless goals of urbanism, in its best sense,” (p.43) and a return to placing the human
dimension as the main focus of development rather than the automobile. Calthorpe writes:

19
Transit-oriented development is regional planning, city revitalization, suburban
renewal, and walkable neighborhoods combined. It is a cross-cutting approach to
development that can do more than help diversify our transportation systems: it can
offer a new range of development patterns for households, businesses, towns, and
cities. (in Dittmar and Ohland 2004, p.xii).
Calthorpe views TOD as new way to plan the metropolitan region, which would result in a
myriad of benefits not possible under an auto-oriented development pattern, and that
would positively impact many stakeholders, not just transit authorities.
Since Calthorpe first laid out his guidelines for transit-oriented development, a large
amount of literature has accumulated on the concept of building for and around transit.
Like Calthorpe, a number of sources see TOD and developing around transit as an
opportunity to create more livable and vibrant places to live, work, and visit.
2.3.3. Place-making Approach to TOD
While the importance of supporting transit is acknowledged by all of the literature on
transit-oriented development, some sources emphasize the place-making goals of TOD as
much or more than the transit goals. Bernick and Cervero (1997) state that planning
development around transit “is partly about creating a built form that encourages people to
ride transit more often. However, equally important, it embraces goals related to
neighborhood cohesion, social diversity, conservation, public safety, and community
revitalization.” (p.5). Dunphy et al. (2004) also emphasize the larger community goals that

20
creating a vibrant, pedestrian-friendly place around transit can provide. While the authors
acknowledge that growth in transit ridership is one of the most common goals of TOD,
along with livable communities and successful development, they express that “Great
places provide civic value as well as a real estate premium. They are in a position to
maintain their standing in a competitive regional market. The creation of great places brings
broad community benefits, of which transit support is only one,” (p.20, emphasis mine).
Dittmar and Ohland (2004) write that while there are certain physical characteristics
to developing around transit that make the area a more inviting place, the main goal “is not
to create a particular physical form but rather to create places that function differently from
conventional development,” (p.22). Transit-oriented places should function as livable
communities for residents and workable communities for businesses. They should also act
as destinations as well as origins and be accessible to travelers from other communities, and
serve as gateways to the regional transportation network and the communities served by
the system (Dittmar and Ohland, 2004). In order for a place to function in a way that
supports walking and pedestrian activity, not only does it need to be mixed use, dense and
walkable, the transit station itself needs to be integrated into the surrounding area in a way
that does not interfere with the place-making qualities. Access to the station by automobiles
and transit vehicles can diminish the pedestrian-friendly atmosphere if not well-planned.
For this reason, Dittmar and Ohland stress that transit agencies need to participate in the
place-making aspect of TOD.
Dunphy et al. (2004) agree that transit agencies need to take a broad view of place-
making around transit stops. However, the authors also state that transit is a key aspect to

21
TOD, and that transit needs to be planned with development in mind in order for TOD to be
successful. The authors explain, “Transit advocates and managers need to work to improve
transit’s image and to plan new transit lines to maximize their development potential,”
(Dunphy et al. 2004, p.21). This is contrary to Calthorpe’s idea that TOD can exist
successfully without transit, and should ideally precede transit development. It is a question
of which comes first, the chicken or the egg: is transit the catalyst for developing in a less
auto-dependent form, or is it the actual development of places that can function without the
automobile that supports the development of transit? As has been shown in the literature
review, transportation infrastructure and technology has certainly impacted patterns of
development in the past. It is also clear that patterns of development can support or not
support different types of transportation. Calthorpe and much subsequent literature on
developing around transit has approached the concept from a land use and place-making
approach, with the ultimate goal of creating a more livable form of development that can
support multiple transportation modes, including transit. An alternative approach has also
emerged from the literature, and focuses on transit goals as the primary reasons for
implementing TOD, with broader livability and regional growth management goals
secondary objectives.
2.3.4. Transit Approach to TOD
There is one important source from the literature that stresses the transit benefits and goals
of TOD over all others. Not surprisingly, this viewpoint comes from the transit industry, in

22
the form of a large report titled Transit-Oriented Development in the United States: Experiences,
Challenges, and Prospects, published in 2004 by the Transit Cooperative Research Program,
managed by the Transportation Research Board of the National Academies. The report
seeks to determine the state of TOD practice in the U.S. through interviews and surveys of
stakeholders involved with TOD, including transit agencies, local governments,
redevelopment authorities, Metropolitan Planning Organizations, state departments of
transportation, and developers and lenders. The report emphasizes a transit agency’s role in
promoting TOD, stating, “Rather than passively sitting back and letting the market
determine what, if anything, happens around stations, more and more transit agencies and
their partners across the United States are today proactively creating new markets for transit
by targeting growth in and around stations,” (p.3). While the study acknowledges the
importance of a variety of stakeholders working together to make TOD happen, it is clearly
implied that transit is an integral and necessary component of TOD.
The largest difference between the TCRP report and the other sources on TOD is the
focus on transit objectives over all other goals of TOD. Discussed above, most sources agree
that the place-making aspect of developing around transit is either equally important, or
more important, than the goal of supporting transit through increased ridership. The
authors of the TCRP report stress that TOD should seek to create a setting where people
drive less and ride transit more. “The primary aim of TOD,” the report states, is, “to boost
ridership and, relatedly, increase revenues. Community economic development and broader
smart growth agendas are secondary objectives,” (p.11). This is a very transit-centric view of

23
the potential benefits of TOD, with less importance placed on creating livable, healthy
places.
One last set of literature takes an historic preservation and revitalization approach to
TOD. This literature shows how TOD is not a new concept, and that there should be a focus
on revitalizing the transit-oriented developments that already exist.
2.3.5. Historic Preservation and Revitalization Approach to TOD
Several sources focus on both the place-making and transit components of TOD, but in a
historic preservation framework. In a 2003 report entitled The Returning City: Historic
Preservation and Transit in the Age of Civic Revival, a joint publication between the Federal
Transit Administration and the National Trust for Historic Preservation, the authors claim
that most literature on TOD up to that point focused on the creation of new places along
transit corridors, making it seem like TOD was a new concept (Costello et al. 2003). The
concept, however, is not new, but instead derived from old practices. The authors state that
the characteristics of TOD: dense, walkable, mixed use areas; are already present in many
older communities that originally were built around rail. Dunphy et al. (2004) also
acknowledge this fact, stating that “in the United State during the first half of the 20th
century, most main streets would have fit this description,” (p.58).
Many of these places, though, are in need of rehabilitation after suffering from years
of disinvestment as development moved outward into the suburbs. “Some are being
revitalized, with or without a strong transit component,” the authors write, while others

24
wait, “great wastes of urban resources whose return could contribute again to planned and
well-managed metropolitan growth,” (Costello et al. 2003, no page number). The
revitalization of older communities through historic preservation and the reinstitution of
transit, if done concurrently, can support one another by strengthening the traditional core
as “the foundation of a successful regional transit system,” (Costello et al. 2003, no page
number).
The Great American Station Foundation (now known as Reconnecting America),
also focuses on historic preservation and transit as strategies for revitalizing existing
downtowns. The emphasis is on the preservation and reuse of historic train stations as a
way to catalyze revitalization in the downtown. A 2001 conference report published by the
foundation states, “Cities that invest in station projects are making a visible commitment to
downtown revitalization,” (Dittmar and Campbell 2001, p.6). The report notes that even in
smaller communities, historic station buildings often were built on a large scale, creating an
opportunity to remake the structure into an activity center with a mix of uses that can help
catalyze redevelopment in the surrounding area while also accommodating transit. As the
title of the report, Rail Stations: At the Heart of America’s Communities, suggests, rail stations
that act as a focal point of activity can become a community gathering place and a source of
civic pride.
Regardless of the approach, it is clear that both transit and land use planning have a role in
transit-oriented development. Transit needs to take into consideration the development or

25
redevelopment potential around future stations or service improvements, and land use
planning needs to take into consideration the impacts on the viability of transit.
2.3.6. Typologies and the Urban Focus of TOD Literature
As explained above, there is a general consensus within the literature that transit-oriented
development consists of a mixing of uses in a relatively dense pattern that is pedestrian
friendly and ideally centered around a transit stop. However, the type and intensity of uses,
the density of an area, and the nature of the transit service can be very different depending
on the location. The location and role of a transit-oriented development within a region
greatly influences the type of development that might occur around a station (Dunphy et al.
2004, CTOD 2008). For example, Calthorpe breaks down the amounts of different uses that
should be accommodated (residential, retail, office, open space, and public uses) into two
different types of TOD: urban and neighborhood. An urban TOD is located along an
existing or future main transit trunk line (express service to the Central Business District of
the metropolitan area), and emphasizes job-generating uses, while a neighborhood TOD is
located along feeder transit routes that connect to the trunk line, and are primarily
residential in nature (Calthorpe 1993, p.63). Dunphy et al. (2004) also divide TODs into two
main categories: downtown locations and suburban locations, which could have more of a
business or residential focus depending on the location within each of these broader
categories.

26
While these broad distinctions between urban and suburban locations, and emphasis
on employment versus residential uses, give a cursory overview of how transit districts may
appear and function differently depending on these factors, some literature has gone further
in defining the large array of different types of TOD that may exist in a region. This section
explores the purpose of these typologies, and what TOD types are presented in the literature
that come closest to describing the case studies for this research. While there are several
sources that discuss TOD in a small town or city context, the section will conclude with an
overview of how most research has focused on TOD in the context of larger metropolitan
areas.
Two literature sources present TOD typologies that represent a more nuanced
distinction between location and function than just urban or suburban. The purpose of a
typology, according to the book The New Transit Town: Best Practices in Transit-Oriented
Development, by Dittmar and Ohland (2004), is to make TOD relevant to many different
places in a region, making it possible to be replicated while remaining sensitive to the
surrounding context. “The types of uses located within TOD,” the authors write, “must be
carefully matched with the function of the place and with the needs and desires of residents,
workers, and visitors,” (p.22). The Center for Transit-Oriented Development (CTOD, 2008)
takes a similar approach, proposing different TOD types as a way for planners and other
stakeholders to make better decisions by being able to visualize the possibilities for the
transit district that might complement and enhance the function and context of the existing
location. CTOD also notes that the typologies presented are not an exhaustive list of TOD
options, but are only suggestions.

27
Both sources include within their typologies a TOD type that might be relevant to a
small town or city. Dittmar and Ohland (2004) describe a Commuter Town as a
“freestanding community outside of the conurbation, served by rail or bus commuter
service to the downtown core. The station area can be developed as a ‘main street’ center,
with neighborhood retail, professional offices, and some multi-family housing within the
core of the TOD zone,” (p.36). This description brings to mind the traditional downtown of a
small town or city, and it is clearly more than just a suburb of a larger city. However the
emphasis is still on the connection to a larger central city, where presumably a good number
of people who reside in the commuter town would work. The authors note that this type of
TOD will usually only support peak hour transit service to the central city, along with local
paratransit service. And although the Commuter Town has some employment uses, these
are primarily considered to be neighborhood or local serving businesses. The Commuter
Town does not seem to be a regional center in itself, but more of a small satellite to a larger,
though more distant, central city.
The Center for Transit-Oriented Development (2008) identifies a TOD type that is
similar to Dittmar and Ohland’s Commuter Town. The Transit Town Center functions as a
center for local economic activity and community activity. Commuting makes up most of
the transit trips, with commuter rail as the main transit mode. However the Transit Town
Center might also be a hub for local or regional bus service, and though attracting fewer
residents from the rest of the region than a larger center, also acts as a destination as well as
an origin, a key difference from the Commuter Town typology. Another key difference is

28
that CTOD characterizes the Town Center as a possible retail destination, though the
emphasis is still predominantly on local-serving retail.
In both cases, these two types of TOD have lower densities than more urban TODs,
though possibly higher densities than a residential, neighborhood TOD. The focus is on
local-serving retail and services, with larger employment uses not emphasized. While the
case studies presented in this research may closely approximate the Commuter Town and
Transit Town Center, they also function as regional destinations for shopping,
entertainment, services, and employment. For instance, the City of Rutland, Vermont, with a
population of 17,292 (2000 U.S. Census) states in its 2002 Master Plan, “The City of Rutland
recognizes its historical role as the economic, cultural and social leader of the region, and as
the region's growth center,” (City of Rutland 2002). In rural areas, a small town or city may
act more like the region’s downtown than otherwise would be expected in a metropolitan
region.
It is clear that the literature that exists today has been focused largely on transit-
oriented development in an urban context. The Transit Cooperative Research Board
reported in 2004 that there are likely well over 100 TODs that exist in the United States at
that time, and that most are in large, rail-served cities. The report noted further that “For
bus-only places with a population under a half million, TOD is more of a concept than a
reality,” (p.445). If this is the case, what chance do small towns and cities with a population
under 50,000 have in creating successful transit districts that capitalize on rail transit
investments to redevelop and revitalize the area closest to the station? Even in urban areas,
the literature points to the necessity of planning the transit district in order to create a

29
vibrant place centered around transit. The next section presents an overview of planning the
transit district. A review of planning principles from the literature was compiled into a more
detailed set of best practices, which is presented in Section 4. Best Practices for Planning the
Transit District.
2.3.7. Planning the Transit District
Planning the transit district, the area within a half mile radius of a station, is essential in
order to take full advantage of the positive impacts that rail investment in a community may
have. Although the introduction of transit to some locations may attract development on its
own, in most cases planning is needed in order to provide certainty and predictability to
developers and the community (Dunphy et al. 2004). Furthermore, in locations with a weak
real estate market, certain proactive measures may be needed by the local government to
facilitate redevelopment, such as infrastructure improvements and property acquisition
(Dittmar and Ohland 2004). Two key areas that are critical to address when planning a new
transit district are the type and intensity of land uses allowed, and the physical design of
both the station area and the district as a whole.
As discussed above, the separation of land uses and physical sprawl of most
development since World War II has made the effectiveness and feasibility of transit a
challenge. In order to support transit, development needs to incorporate a mix of uses in a
concentrated area, improving accessibility to these uses from a single transit stop. Clustering
and mixing uses does not necessarily support transit, however, and is not always beneficial

30
to the community (Dunphy et al. 2004). Transit adds value to a location when it is
compatible with nearby uses, which in turn provide potential transit riders. Housing and
offices, together with retail and services, are uses that support transit, while other uses, like
large scale industry, may actually deter transit use by making the station less accessible
(Dunphy et al. 2004). Additionally, allowing higher densities around stations is often
considered a strategy to help support transit, but if the scale and intensity of development is
not consistent with the existing urban fabric and community character, it may fail to meet
the needs and desires of the community and other users of the area (Dunphy et al. 2004;
Dittmar and Ohland 2004). For this reason, place-making becomes an integral component to
successful transit district planning.
Transit stations are nodes within a larger regional transportation network, but the
areas surrounding the stations are also distinct places. Sometimes the place aspect of station
areas does not enter prominently into planning and development of new transit (Dittmar
and Ohland 2004). However, making great places around and adjacent to transit stations
both supports the transit operation and helps the area remain competitive in a regional
market (Dunphy et al. 2004). The design of the station can encourage transit use by
providing a gateway between the transit service and the surrounding neighborhood
(Dittmar and Ohland 2004), while also promoting the use of adjacent businesses and public
spaces. In turn, the district surrounding the station should be designed to support and
promote transit use.
The physical design of the transit district should be oriented to the walker above all
other modes of travel (Dittmar and Ohland 2004; Dunphy et al. 2004). To appeal to the

31
pedestrian, the street network should provide direct routing, blocks should be small, and
the massing of buildings should be human scale – at least at the street level. Public space
should be well-defined by buildings that are oriented to the street with little to no setbacks
(Dittmar and Ohland 2004; Dunphy et al. 2004; Ewing 1997). Cars should not interfere with
access to the transit station for the pedestrian or bicyclist (Dittmar and Ohland 2004). These
design standards should be practiced within walking distance of the station for pedestrians,
and streets safe for biking should be designed within reasonable biking distance (Dunphy et
al. 2004).
Cities and towns can be proactive in planning for transit, starting the process before
service even begins. In areas with a strong real estate market, planning may be needed as
soon as a new station is announced in order to maintain affordability in existing
neighborhoods or to guide new development. In areas with weaker real estate markets, the
local government can begin investing in the area surrounding the future station in order to
aid in attracting development. Infrastructure improvements to sidewalks and public spaces,
zoning to allow a mix of uses, and expedited permitting are ways local governments can
show commitment to the area (Dunphy et al. 2004). Design guidelines can also be developed
to aid in place-making and to ensure new development and redevelopment add to and
strengthen the character desired by the community. Finally, due to the long time frame for
the full impacts of transit investments to be realized (often up to 30 years), public policy in
favor of transit supportive development around the station needs to be sustained
throughout the time period (Dittmar and Ohland 2004; TCRP 1998).

32
2.3.8. Potential Benefits of TOD
The literature review on passenger rail investments demonstrated that there is potential for
impacts to the area surrounding a station to occur, and that this potential is greater if
planning precedes or coincides with the investment. “Focusing growth around transit
stations capitalizes on expensive public investments in transit by producing local and
regional benefits,” (TCRP 2004). This section explores some of the potential benefits, for
local governments, businesses, transit agencies, and residents, of planning for transit-
oriented development around a station, including economic development and
revitalization, land value premiums, increased ridership, and savings for households, as
well as other regional benefits.
Like transit investments themselves, transit-oriented development around stations is
increasingly seen as an approach to stimulating economic development in an area. The
literature focuses mostly on the potential of revitalizing depressed inner-city neighborhoods
(Calthorpe 1993, Bernick and Cervero 1997, TCRP 2004). New investments and businesses
may be attracted to the area, adding vitality and new jobs. However, as discussed above,
transit access itself is often not enough to bring about change in a depressed or declining
area, with issues such as negative perceptions and fear for safety making the area more
risky to investors (TCRP 2004). On the other hand, gentrification can also be a concern. All
of these concerns point to the need to integrate the planning of the transit district into a
larger community-building effort that addresses the needs and issues of the community
comprehensively (Bernick and Cervero 1997).

33
An increase in property values closest to stations is considered one of the main
potential impacts of transit investments, already discussed above. Being well-connected to
the region creates added value to these locations. Residents are within easy reach of jobs and
shopping, retail is located within reach of potential customers, and employers increase
access to potential employees (Dunphy et al. 2004). Transit-oriented development can
increase the impact on property values by planning development in a way that allows and
encourages these transit-conducive uses to locate near transit, and that integrates the transit
into the surrounding neighborhood, thereby increasing accessibility (Dunphy et al. 2004).
The characteristics of TOD, dense, mixed use, pedestrian-friendly development
within walking distance of a transit station, are all factors that influence travel behavior and
increase the chances that people will choose to take transit (TCRP 2004). Increased ridership
benefits transit agencies by providing more farebox revenues, a redistributive benefit from
the consumer to the agency (TCRP 2004). However increased transit ridership can have
other benefits as well, including decreased traffic congestion, reduced fuel use, improved air
quality, and time savings for those benefitting from the decrease in traffic (Bernick and
Cervero 1997, TCRP 2004). Furthermore, if those who are riding the transit are arriving to
the station by foot, this creates additional benefits to the area surrounding the station by
adding vitality and supporting retail.
According to the literature, residents can benefit from TOD from enjoying greater
housing choices and accruing savings on transportation costs. Bernick and Cervero (1997)
point to the mix of housing choices available in a transit district as being able to
accommodate a range of households at different life stages and with varying incomes.

34
However, as shown throughout much of the literature, land values tend to be higher in
areas closer to stations. This would seem to negate the claims of affordability, unless
affordable units were required as part of new developments. However, although
households might spend more on housing closer to a station, they also have an opportunity
to save on transportation costs by riding transit and driving less (TCRP 2004, CTOD 2008).
Further research on whether TOD generally provides more affordable housing choices or
not is needed, though it seems likely that this will depend on the specifics of each location
and the actions that are taken by local governments to ensure that affordable housing is
preserved.
There are a number of other potential benefits that may arise from focusing
development around transit. These may be secondary benefits that are not directly
attributable to the impacts of TOD, but that accrue over time by developing in a more
compact and sustainable manner. Consequently, many of these benefits can be associated
with any compact, mixed use development, and not just TOD (TCRP 2004). The Transit
Cooperative Research Board (2004) outlines a number of these benefits, which include:
reducing sprawl and conserving open space, improving water quality by reducing runoff,
preserving wildlife habitat and biodiversity, reducing road and infrastructure costs
associated with extension to outlying areas, reducing crime by placing eyes on the street and
creating defensible spaces through good urban design, and increased social capital and
public involvement. According to the TCRP report, most professionals involved in
developing around transit feel that TOD has the most potential in bringing about local
positive impacts, rather than broader regional goals of reducing sprawl (TCRP 2004).

35
2.4. Conclusion
Overall there is a consensus throughout the literature that transportation has an effect on
land use and development patterns and vise versa, however conclusions are mixed about
the economic impacts of passenger rail on the area surrounding the station, as well as on the
region as a whole. The pure economic impacts of rail, controlling for other factors, is
debatable. There is agreement in the literature that supportive planning and policy in the
area surrounding the station is needed to realize the full benefits of a transit investment.
Transit-oriented development (TOD) has emerged as a strategy for local governments to
capitalize on transportation investments and create vibrant, livable communities. Literature
thus far has focused primarily on the implementation of TOD in larger metropolitan areas,
neglecting smaller towns and cities that may also have the potential to benefit from
planning around transit stations. Further research needs to be done to determine how local
planning efforts in small towns and cities have been able to capitalize on major transit
investments to help boost positive benefits and transform a place in the long run. It is this
question that this thesis will explore.

36
CHAPTER 3
METHODOLOGY
This study employed a number of research methods. As explained in the sections below, a
literature review was completed, from which a set of best practices was developed and
relevant indicators were chosen. These best practices were compared to actual planning
practices in four case study communities through a review of plans and site visits. Two
communities were explored more in depth, and included interviews with planning staff to
further compare the best practices from the literature to the practices of local governments
in small towns and cities. Indicators were also applied to the case studies to determine if
positive impacts from the transportation investment and planning had occurred. A final
review of the impacts and planning strategies from each case study were compared to
determine which best practices were followed and which were not, and the lessons that
other communities may learn from when planning for transit investments in small towns
and cities.
3.1. Literature Review
The literature review focused on the history of the relationship between land use and
transportation in the United States, past research on the impacts and benefits of passenger
rail investments, the concept of transit-oriented development, and planning for the transit
district. The literature review demonstrated how transit investments have the potential to

37
create positive impacts on the surrounding area, but that proactive planning by local
governments is often necessary for these results to materialize. TOD is a strategy that has
become increasingly popular for reaching land use, transit, and economic revitalization
goals in areas surrounding a station. General characteristics of TOD and the transit district,
defined as the area within a half mile of the station, were reviewed. A review of how to plan
for such development lead to the development of best planning practices for the transit
district.
3.2. Development of Best Practices for Planning the Transit District
There was a general consensus within the literature that planning for the area around a
station is necessary to realize the full benefits of a transit investment. To generate a
consistent set of best practices, I reviewed six sources that explicitly addressed planning
principles for the transit district. These sources were found through a search for the key
words of “transit-oriented development” and “transit planning,” as well as from following
references within literature sources. The sources were chosen because they presented
principles for planning around transit based on original research. A list of all principles was
developed and then sorted into ten categories (see Table 3.1 on the following page).

38
Table 3.1. Best Planning Practices for the Transit District
The Planning Process: Precede or parallel transit development with land use planning
that involves the community and key stakeholders and gives local government an active
role in implementing needed improvements.
Mix of Uses: Increase pedestrian activity and demand for transit by locating a mix of
residential, commercial, services, and other uses in the transit district.
Density: Maximize location efficiency and support transit ridership by concentrating
development within walking distance of the train station.
Connectivity and Mobility: Ensure that it is easy to move throughout the district, with
priority given to pedestrians and bicyclists, not vehicles.
Place-Making and Urban Design: Urban design standards should be used to reinforce
the pedestrian character of the district, build off of existing strengths through context
sensitive design, and create attractive, engaging public spaces.
Station Location, Design, and Access: The station should be located in the center of
activity, acting as a focal point and gateway to the community, and should be designed
to complement the place-making aspects and pedestrian orientation of the district.
Parking: Parking should not detract from the pedestrian-orientation of the transit
district, and strategies should be in place to reduce the amount of surface parking lots
while still accommodating parking needs.
Market Considerations: Not every transit district will support the same mix of uses, and
a market feasibility study should be included in the planning process.
Regional Planning and Policy Support*: A more compact and mixed use form of
development needs to occur throughout a region to support transit connections, which
in turn reinforces the health of the transit district.
Transit Service Quality*: Transit must be frequent, reliable, and connected to places
where people want to travel in order to attract development around the station.
* These principles were not applied to the case studies.
These principles were used to evaluate the case studies in terms of planning that
occurred in the station area. Two of the principles, Regional Planning and Policy Support
and Transit Service Quality, were not applied to the case studies because they are out of the
direct control of a single community. However these principles are discussed in the analysis
of the case studies. It was noted for each case study whether or not a principle was followed,
and how it was applied. The goal of performing this analysis was to determine whether

39
principles, developed mostly with large metropolitan areas in mind, have been applied in
small towns and cities. If a principle is not applied, this research is not implying that the
principle is not relevant to a smaller community, but rather the communities in this research
are not utilizing the practice. Also this research does not assume that all large cities follow
these principles, but only that the principles were developed from literature that focuses
largely on transit in larger metropolitan areas.
3.3. Case Studies
The goal of the research was to determine if planning practices for transit-oriented
development were being applied in small towns and cities, what planning lessons could be
learned, and what the potential impacts of passenger rail are to these communities. Based on
this, case study selection utilized these factors:
1. Passenger rail has either been reinstated or a significant investment has been made
to improve service, such as a new station.
2. The community has a population under 50,000 and is located in a rural area.
With these criteria, four sites qualified:
1. Saco: Saco is located in York County, Maine, and had a population of 16,822 in 2000
according to the U.S. Census. The Saco River runs along the southern border of the
city, and empties into Saco Bay and the Atlantic Ocean, which borders the city on the
east. Passenger rail service ended in Saco in 1965. In 1992 it was announced that a
40
stop on a new Amtrak train would be located on Saco Island, an island adjacent to
downtown with several large mill buildings that are in various stages of
redevelopment. Service was reinstated in December 2001. The Amtrak Downeaster
makes five round trips a day between Boston’s North Station and Portland, Maine.
The trip from Saco to Boston takes just over two hours (Amtrak Downeaster 2010).
At first there was only a parking lot and platform available for passengers, but in
February 2009, the Saco Transportation Center opened, featuring a waiting area,
ticketing services, and the offices of the Biddeford Saco Chamber of Commerce and
Industry (City of Saco website, 2010). A wind turbine located at the entrance to the
station generates power for the building.
2. Biddeford: Biddeford is also located in York County, Maine, and borders Saco to the
south. The population at the time of the 2000 U.S. Census was 20,942. Passenger rail
service also ended in Biddeford in 1965. Although the Amtrak Downeaster service
does not stop within the city itself, the Saco station is located within walking
distance of Biddeford’s downtown, which includes an expansive mill district
currently undergoing redevelopment.
3. Pittsfield: Pittsfield is the county seat of Berkshire County, Massachusetts, with a
population at the time of the 2000 U.S. Census of 45,793. Pittsfield has retained
passenger rail service over the years, and currently is a stop along Amtrak’s
Lakeshore Limited, which runs one round trip per day from Chicago to Boston.
After years of discussion and planning, the Berkshire Regional Transit Authority
(BRTA) built the Intermodal Transportation Center in downtown Pittsfield, which
41
serves as the hub for BRTA’s local bus system as well as intercity bus service and
Amtrak (BRTA website 2010). The center also houses the offices of the BRTA, and
has several commercial spaces.
4. Rutland: The city of Rutland Vermont is located in Rutland County and had a
population of 17,292 at the time of the 2000 U.S. Census. The city acts as a regional
center for services, shopping, culture, and entertainment, and benefits from tourists
visiting the nearby Killington ski resort area. Passenger rail service to the city was
discontinued in 1953, and by 1964 the downtown station was demolished. Service
was reinstated in 1996, and a new station was built in 1999 with the capacity for
ticketing services and baggage checking (City of Rutland 2009). However there is
currently no ticketing or baggage check available at the station (Amtrak website
2010). The Ethan Allen Express runs one round trip per day between Rutland and
New York City. The service is subsidized by the state of Vermont (Amtrak website
2010).

42
Figure 3.1. Case Study Communities
Table 3.2 below provides an overview of each case study and the passenger rail service and
major transportation investment.

43
Table 3.2. Case Study Communities and Passenger Rail Service
2000
Population
Service
ended
Service
reinstated/interm
odal center
complete
Connection
to Metro Area
Level of
service
Saco, ME 16,822
(11%
increase
since 1990)
1965 Dec. 2001, station
opened Feb. 2009
Portland, ME;
Boston, MA
Amtrak
Downeaster –
5 round trips
per day
Biddeford,
ME
20,942
(1% increase
since 1990)
1965 Dec. 2001, station
opened Feb. 2009
Portland, ME;
Boston, MA
Amtrak
Downeaster –
5 round trips
per day
Pittsfield,
MA
45,793
(6%
decrease
since 1990)
N/A Nov. 2004 Albany, NY;
Springfield,
MA; Boston,
MA
Amtrak
Lakeshore
Limited – 1
round trip per
day
Rutland,
VT
17,292
(5%
decrease
since 1990)
1953 Dec. 1996, station
opened in 1999
Albany, NY Amtrak Ethan
Allen Express
- 1 round trip
per day
Source: U.S. Census, Amtrak website, the websites of the cities of Saco and Rutland, and the
Berkshire Regional Transit Authority website.
For Saco and Biddeford, the in depth case studies, two interviews were conducted
with city staff, one interview for each city. One interview took place in person, and one was
conducted over the phone. Both lasted approximately one hour, and notes were transcribed
from each conversation. The interview questions, included in Appendix C, and the IRB
approval form, included in Appendix D, were sent to the city staff person ahead of time.
Prior to the interview, I reviewed the city’s zoning, subdivision regulations, and past plans
to answer as many of the interview questions ahead of time and to develop more specific
questions based on the information I found. The purpose of the interviews was to discuss

44
the planning process for the station and surrounding area and the impacts of passenger rail,
and to ask what lessons might be taken away from the city’s experience thus far. For
Pittsfield and Rutland, interviews were not conducted, but I attempted to answer the same
questions concerning how the cities had approached planning for the area surrounding the
station through a review of zoning, subdivision regulations, and plans.
Field research was undertaken at each case study site, in which photo
documentation was used to document access to the station for pedestrians, the station
location and design, and the public spaces around the station. Access was evaluated based
on the best practice that pedestrian access to the station is imperative and should not be
compromised by vehicular access. Location was evaluated to determine if the station was
placed in an area surrounded by, or with the potential to be surrounded by, development
and activity, and whether the station appeared to act as a focal point for the area. Public
spaces were first evaluated on whether they existed or not, and next on how safe and
inviting they appeared to be. Factors such as trees and landscaping and benches and other
amenities were considered. This is inherently a subjective measure, and other researchers
may come to different conclusions.
Two indicators, ridership and property values, were applied to the in depth case
study, while only ridership was explored for the other two case studies. These indicators are
discussed in more detail below. In the first round of analysis, each case study was analyzed
independently. Qualitative data gathered from the interviews, review of planning
documents, and field research were compared with the property values (for Saco and
Biddeford only) and ridership data to draw conclusions about whether the case study had

45
followed the best planning practices, what impacts from the passenger rail investment had
occurred, and what the lessons might be for other similar communities.
In the next level of analysis, the findings about each case study were compiled to
generate an overall comparison between the best planning practices from the literature and
the actual planning practices of the case studies. A matrix that summarizes how each city
either applied or did not apply each best practice can be found in Appendix --, along with a
table that tallies the number of case studies that applied each best practice and to what
degree. These results were used for a final analysis of how each best planning practice was
applied, or not applied. A final list of lessons learned was then compiled from both the
combined analysis of the case studies and the individual analyses. It is the hope that these
lessons can help planners from other similar communities when considering how to plan for
a transit investment.
3.4. Indicators
A number of places in the United States that have begun to implement plans for transit
districts are measuring the impacts associated with both the plan and the transit. A survey
of planning and transportation professionals found that some of the most useful indicators
in monitoring success are qualitative ratings of the streetscape (pedestrian
orientation/human scale), the number of transit boardings (ridership), and the estimated
increase in property values (NCHRP 2005). Professionals noted in another survey that
transit-oriented development and transit district planning have the most potential to

46
increase transit ridership and improve the quality of the surrounding neighborhood (TCRP
2004). This research used the quantitative indicators of property values and ridership, and
the qualitative measurement of the streetscape in the area surrounding the station, to
measure both the impacts of the transit investment and the effectiveness of planning in the
area.
3.4.1. Property Values
Accessibility is the basic benefit that transit provides to an area. Being well-connected to the
region creates added value, as residents and businesses seek to locate closer to the point of
access for the convenience it provides in reaching work, shopping, and other destinations.
Property values surrounding a station should presumably be higher than values further
from the station (Dunphy et al. 2004). Property values are one of the most commonly used
indicators in determining the impacts of passenger rail. As one source puts it, “If transit
investments create benefits, real-estate markets tell us,” (TCRP 2004, p.161).
This research compares residential property values surrounding a station during
three timeframes: before the transit investment was announced; after the investment was
publicly announced but before completion of construction; and after the station or service
was operational. Residential sales data was compiled from assessors records for the two in-
depth case study communities. In order to control for differences in house sizes, the price
was divided by square footage to determine the price per square foot for each property that
was sold.

47
Geographic Information Systems (GIS) was used to determine the location within the
community of each property with sales data in relation to the transit station. 2000 U.S.
Census County Subdivision shapefiles, and road and parcel shapefiles from the Maine
Office of GIS were used to create maps of Saco and Biddeford and to match the sales
information with the parcels data. It was then possible to search for properties within a ½
mile, 1 mile, 1 ½ miles, 2 miles, and 2+ miles of the station for each of the three time periods.
The median sale price per square foot was then calculated for each half mile ring. The
growth rate of the median sale price for each ½ mile ring was calculated for the period
before and after the announcement of the transit project, and for the period before and after
the start of service or completion of the multimodal station. The growth rate for the ½ mile
ring closest to the station was compared with the rates of the rings further from the station
to determine if the transit investment appeared to make a difference on property values
over the period of time from before announcement to after completion.
3.4.2. Ridership
To help determine if transit is a large factor, transit data for each case study was developed
from Amtrak, the Massachusetts Department of Transportation, and the Northern New
England Passenger Rail Authority. Ridership numbers are compared from before and after
the transit investment, with the assumption that an increase in ridership is a sign that access
to transit is highly sought. For situations where rail was reinstated and there was no service

48
prior to the construction, ridership was collected from the first year the service was in
operation through the most recent data.
3.4.3. Streetscape and Urban Design
The literature is clear that the quality of the streetscape and urban design are important
aspects of planning a transit district, and can greatly influence whether a person chooses to
walk or spend time in the area. According to a national survey of professionals involved
with transit-oriented development projects, qualitative ratings of streetscapes that measure
the pedestrian-orientation and human scale of the environment was one of the most useful
indicators in monitoring the progress of the development (NCHRP 2005). The report states,
“While much of the literature in TOD focuses on transit ridership, these findings suggest
that equally important is the quality of the built environment and the number of people
walking along the streets,” (NCHRP 2005, p.19).
For this reason a qualitative field study of the streetscape environment in the area
surrounding each station was undertaken. Based on best practices for planning the transit
district derived from the literature review, certain characteristics were observed. These
include: whether there is easy and safe connectivity and mobility for pedestrians to and
from the station and within the district; if the built environment is human-scaled and
pedestrian-oriented; and whether there are inviting public spaces in the district. A general
account is given of each transit district.

49
CHAPTER 4
BEST PRACTICES FOR PLANNING THE TRANSIT DISTRICT
There is a general consensus within the literature that planning for the area around a station
is necessary to realize the full benefits of a transit investment. In this section, the most
common principles found in the literature will be discussed. Six sources that explicitly
address planning principles for the transit district were reviewed. A list of all principles was
developed, and the principles were then grouped into eight categories. The principles are
broken down into the following categories: the planning process; mix of uses; density;
connectivity and mobility; place-making and urban design; transit access and design of the
station; parking; and market considerations. For the purposes of this research, planning
principles within the control of local government are the primary concern, with an
understanding that a transit agency should also be involved in the process. Regional
planning and policy support, and the quality and frequency of transit service will be
discussed as factors that influence the success of developing around transit, but that may be
outside the control of the local government.
4.1. The Planning Process
4.1.1. The importance of planning and developing a long-term vision
As discussed previously, planning is considered necessary in most circumstances if the
potential benefits of transit investments are to be realized in the area surrounding a station.

50
“TODs stand the best chance for success when land-use planning precedes, or at least
parallels, transit development, rather than being an afterthought,” (TCRP 2004, p. 459).
Because transit districts are made up of many landowners, it is necessary to engage in a
planning process for the entire area in order to guide future development in a way that will
reinforce the goals of the district. Additionally, development or redevelopment of a transit
district will occur over a number of years and through a number of separate projects.
Therefore it is important to begin planning early and develop a long-term vision for the area
(TCRP 2004, Dunphy et al. 2004, Dittmar and Ohland 2004, Bernick and Cervero 1997,
Calthorpe 1993).
According to Dunphy et al. (2004), if a broader vision does not exist, developers
might implement their own individual visions parcel by parcel, jeopardizing the overall
impact of the district. Visions should be forward-looking, as opposed to concerned with
short-term financial gains (Dunphy et al. 2004, Bernick and Cervero 1997, TCRP 2004).
Visions should also be based in reality, and should be supported by stakeholders and the
community at large. This leads into the next principle for the planning process: Stakeholder
and community participation.
4.1.2. The need for stakeholder and community participation
Three of the six literature sources explicitly state that stakeholder involvement in the
planning process is necessary for the future success of the district (Dunphy et al. 2004,
CTOD 2008, TCRP 2004). The TCRP report (2004) states that an inclusive process with on-

51
going public input into planning, design, and implementation will help fend off NIMBY-ism
(not in my backyard) and will give those who live and work in the area a vested stake in
seeing the vision implemented. Dunphy et al. (2004) state that not only those with a stake in
the community should be involved, but also “those who have the wherewithal to shape it”
(p.171) should be sought and included. This may include landowners, developers, local
businesses, the transit agency, elected officials, and the local government departments such
as planning, transportation, and public works (Dunphy et al. 2004). Public outreach should
be conducted to inform and educate stakeholders of the potential that planning for the
transit district may have. Tools for gathering stakeholder input include workshops,
charrettes, focus groups, and the use of visual tools (particularly useful in showing higher
densities) (Dunphy et al. 2004, CTOD 2008).
4.1.3. The role of the local government in implementation
In addition to creating a plan with a strong vision, and amending zoning, local governments
need to have an active role in the implementation of the plan. Government involvement is
even more important in a redevelopment area where the real estate market is weak (Dittmar
and Ohland 2004, TCRP 2004, Bernick and Cervero 1997). As Dittmar and Ohland (2004)
state, “When market forces alone are not strong enough to support good TOD, then local
government becomes an even more critical actor, and strong public policy is an important
tool for overcoming a neighborhood’s disadvantages and attracting high-quality
development,” (p.49).

52
A number of actions are recommended that governments can take to jump start
development in the transit district. Investing in infrastructure improvements, assembling
land, expediting permitting, and partnering with developers are the most common (CTOD
2008, Dittmar and Ohland 2004, Dunphy et al. 2004, TCRP 2004, Bernick and Cervero 1997).
Infrastructure might include utility and sewer upgrades to accommodate new development,
as well as sidewalk and streetscape improvements in the district. Redevelopment authorities
have the ability to acquire and assemble parcels, which ensures there is enough land or
buildings available for development to be economically viable. Expediting the permitting
process offers certainty and assures a developer that the community is serious about
implementing the vision for the transit district. Furthermore, in a redevelopment district,
partnerships between the public and private sector are often needed in order to induce
development in an area that otherwise would be too risky of an investment (Dunphy et al.
2004, Bernick and Cervero 1997, TCRP 2004, Dittmar and Ohland 2004). While local
governments can supply land and infrastructure, developers can bring experience of the
market and connections to potential end-users.
Finally, several literature sources express the need for strong political leadership in
implementing a transit district plan (TCRP 2004, Bernick and Cervero 1997). Someone in a
position of prominence and authority who can “champion” the project throughout the
process can assure that the plan will be implemented and not just sit on a shelf collecting
dust.

53
4.2. Mix of Uses
Fundamental to the success of a transit district is that it includes a mix of uses, such as
housing, employment, commercial, services, and public uses (Calthorpe 1993, Dunphy et al.
2004, CTOD 2008, Dittmar and Ohland 2004). Locating an array of choices within walking
distance helps stimulate pedestrian activity by allowing someone to park their car once and
walk to numerous destinations, or to walk from their home or place of employment.
Additionally, concentrating different uses in one area can help create a demand for transit
or increase the ridership of existing service. It is generally agreed that a vertical mixing of
uses, such as retail on the ground floor of a building with office or residential on the upper
floors, is ideal, but that horizontal mixing of uses in separate buildings will also work if the
former is not achievable.
The literature varies in terms of the type and magnitude of uses that should be
included within the transit district. Calthorpe (1993) declares that “All TODs must be
mixed-use and contain a minimum amount of public, core commercial and residential
uses,” and provides minimum percentages for each use that should be included within the
transit-oriented development (p.63). Dunphy et al. (2004) espouse the notion that “retail
follows rooftops”: housing and employment uses have the most potential to generate transit
riders and pedestrian activity, which in turn creates a secondary need for retail, services,
and entertainment. The main role of these secondary uses is to make the area a more
attractive place to live and work, but are not the drivers of development in the transit
district (p.61).

54
Achieving a mix of housing choices, in terms of densities, building types (single
family vs. multi family etc.), ownership, and price is considered an important goal when
planning the transit district (CTOD 2008, Dittmar and Ohland 2004, Dunphy et al. 2004,
Bernick and Cervero 1997, Calthorpe 1993). This allows for households with a range of
incomes, lifestyle preferences, and life stages to live within the district. Good transit access
may make it possible for families to own one less car, making the availability of affordable
housing near transit a priority. Additionally, those who cannot drive, or would rather not
drive, such as teenagers and the elderly, have greater mobility when living near transit.
Finally, providing a range of housing options within close access to both transit and a mix of
uses offers an alternative to traditional suburban living – auto-dependent, segregated uses –
that will appeal to those who want to be closer to entertainment and cultural activities.
4.3. Density
As discussed previously, the main reason why transit investments might impact an area is
because of the access it provides to other areas of the region through location efficiency – the
close proximity (and ease of access) to a station. In order to maximize location efficiency,
and in turn generate enough ridership to support transit, there needs to be a concentration
of uses within walking distance of the station. Minimum densities are required within the
transit district to both support a mix of uses and a vibrant commercial area (Calthorpe 1993),
and to support transit through increased ridership (CTOD 2008, Dittmar and Ohland 2004,
Dunphy et al. 2004).

55
Density is most often discussed in terms of residential density (dwelling units
(du)/net residential acre). Calthorpe (1993) recommends minimum densities between 10 and
25 du/acre, depending on the context of the surrounding neighborhood and the location of
the development within the region (p.64). Dunphy et al. (2004) approach residential density
from the perspective of transit ridership, and suggest minimums of 7 du/acre to support
basic bus service of 30-60 minute headways, 15 du/acre for more frequent bus service with
15 minute headways or less, 9 du/acre for light rail, and 12 du/acre for heavy rail (p.62).
Furthermore, to support heavy rail, Dunphy et al. state that there needs to be one or more
major high-density employment centers within the region, and that higher Floor Area Ratios
(FAR) are needed in these areas to promote higher densities of office use (p. 62).
4.4. Connectivity and Mobility
Not only does there need to be a concentrated mix of uses within close proximity of each
other and transit, the ability to easily move around the area and access different uses is
essential. “The local street system should be recognizable, formalized, and inter-connected,
converging to transit stops, core commercial areas, schools and parks,” (Calthorpe 1993,
p.64). Pedestrians, followed by bicyclists and transit vehicles, should have priority over
automobiles (CTOD 2008, Dittmar and Ohland 2004, Dunphy et al. 2004, TCRP 2004,
Calthorpe 1993). According to Dunphy et al. (2004), “Planning for circulation systems in
transit districts should focus on maximizing connectivity and pedestrian, bicycle, and transit
mobility,” (p.63).

56
Whether people walk or not is based on how well destinations are connected, and
how pedestrian friendly the environment is. Routes need to be direct and provide places for
pedestrians to stop and rest. Streets should be designed for slower automobile speeds by
using traffic calming techniques such as narrower travel lanes. Sidewalks should be
provided throughout the district, as well as bike lanes, pedestrian pathways, and marked
and safe crossings when necessary or possible.
4.5. Place-Making and Urban Design
Although mixing uses, allocating minimum density standards, and providing for
connectivity and mobility for pedestrians within a transit district are all key planning
principles, if they are not coordinated in a way that creates an attractive place to live and
work, they will not result in achieving the full benefits of the transit investment. “A major
new transit station in a community should bring more than the trains. It represents an
opportunity not only for the development of a project at the station, but for the development
of a full-fledged transit-centered place, with all the attendant economic and cultural
benefits,” (Dunphy et al. 2004, p.175). Place-making is an integral component to a successful
transit district, and requires attention to the scale and design of the surrounding
development (Dunphy et al. 2004, Dittmar and Ohland 2004, TCRP 2004). Urban design
standards should be used to reinforce the pedestrian character of the district, build off of
existing strengths through context sensitive design, and create attractive, engaging public
spaces.

57
4.5.1. Active Walkable Streets
Urban design can greatly increase the walkability of an area by creating a human-scaled
environment (as opposed to automobile-scale). Small block sizes aid in pedestrian
connectivity by creating more direct choices in routes to desired locations (CTOD 2008,
Dittmar and Ohland 2004, Dunphy et al. 2004). If existing large blocks cannot be made
smaller, pedestrian circulation should be provided mid-block if possible (Dunphy et al.
2004). Additionally, buildings should be facing the sidewalk, with limited to no setbacks
and parking placed in the rear to avoid large gaps between buildings. This creates a sense of
space for the pedestrian on the street and adds to the feeling of security by providing “eyes
on the street” from the adjacent buildings.
People are more likely to choose to walk if routes are visually interesting, and
building fronts should include architectural details, numerous small entrances as opposed
to a few large ones, and a large percentage of ground floor windows in commercial areas
(Dunphy et al. 2004, Calthorpe 1993). In general, ground floor spaces in commercial areas
should be reserved for retail, with office and residential space on upper floors. However if
the market does not at first support a large amount of retail, other uses should be allowed in
these spaces rather than have empty storefronts, which could stigmatize the area and keep
investment out (Dittmar and Ohland 2004, Dunphy et al. 2004).

58
4.5.2. Context Sensitive Design and Infill
Accommodating higher densities around stations is often considered a strategy to help
support transit, but if the scale and intensity of development is not consistent with the
existing urban fabric and community character, it may fail to meet the needs and desires of
the community and other users of the area (Dunphy et al. 2004; Dittmar and Ohland 2004).
New development should build upon and compliment existing assets of an area. Infill
within residential areas especially needs to fit visually with existing homes.
Infill should also seek to promote the pedestrian-friendly, mixed-use, compact
aspects of transit districts. “Redevelopable and infill sites should develop underutilized
parcels with new uses that allow them to function as walkable, mixed-use districts. Existing
uses which are complementary, economical, and physically viable should be integrated into
the form and function of the neighborhood,” (Calthorpe 1993, p.68). In redevelopment
projects, place-making is more about enhancing the existing sense of place, rather than
creating a whole new one.
4.5.3. Attractive and Engaging Public Spaces
Public space in the transit district includes parks and plazas as well as sidewalks and the
streetscape. Public plazas that accommodate community gathering and events should be
created or enhanced and located centrally (Bernick and Cervero 1997, Calthorpe 1993).
Many of the design standards already discussed help reinforce the street as a public space,
such as limited setbacks and human-scale architecture. Additionally, urban design

59
standards for facades, signage, and fenestration can be applied to buildings fronting the
street (CTOD 2008). Wide sidewalks with street trees, street furniture, and public art help
make spaces more inviting to pedestrians (CTOD 2008, Dunphy et al. 2004, Calthorpe 1993).
Outdoor dining can also be accommodated, creating a more vibrant setting.
While place-making is considered a central aspect to developing around transit, it
can come into conflict with the function of the transit station as a gateway into the regional
transportation network (TCRP 2004, Dittmar and Ohland 2004). For this reason, the location
and design of the station itself and how it connects to, and is accessed from, the surrounding
community is an important aspect of planning the transit district.
4.6. Station Location, Design, and Access
Transit stations are nodes within a larger regional transportation network, but the areas
surrounding the stations are also distinct places. Sometimes the place aspect of station areas
does not enter prominently into planning and development of new transit (Dittmar and
Ohland 2004). However, creating vibrant, healthy places surrounding transit stations helps
to support the transit service itself. As Belzer et al. explain in a chapter on the different
actors involved in TOD:
Transit agencies should see themselves as more than providers of transportation
services. This requires them to be full participants in the process of creating
neighborhoods with long-term value by helping to develop station area plans that
recognize the critical link between the station and adjacent land uses. In the long run,

60
transit agencies can benefit from having stations that are parts of vital and
economically healthy neighborhoods. (Dittmar and Ohland 2004, 46)
The location, design, and access to the station can encourage transit use by providing a
gateway between the transit service and the surrounding neighborhood (Dittmar and
Ohland 2004), while also promoting the use of adjacent businesses and public spaces.
When locating a new station, transit agencies and local governments should consider
where the opportunities exist for real estate development, rather than just look at low-cost
solutions that may place the station on the outskirts of town (Dunphy et al. 2004). According
to Dunphy et al. (2004), the station location should allow for the creation of activity on all
sides, with the station as focal point. Calthorpe (1993) depicts numerous models of TOD,
some of which are a half circle, with a major arterial road along one side. Regardless of the
shape of the district, the important factor is that the station is in the center of the activity,
rather than on the side.
The design of the station should be of high-quality, reflect the character of the
surrounding community, and not interfere with walkability or place-making. Stations
should include amenities for transit users such as traveler information, signage and
wayfinding, easy transit connections, and adequate, attractive waiting spaces (Dunphy et al.
2004, CTOD 2008). Safety should also be addressed through design and lighting, and a
police substation may even be a consideration (Bernick and Cervero 1997).
Access to the station “must balance the needs of transit riders arriving or leaving by
foot, car, bicycle, and other transit connections,” (Dunphy et al. 2004, p.64). Pedestrian paths
to and from the station should provide direct connections to destinations outside of the

61
station area. Pedestrians also need to be protected from automobiles with safe crossings and
wide sidewalks. Bicycle locks or storage should be provided at the station, and if possible a
network of bike lanes and paths should link the station to the surrounding neighborhoods
(CTOD 2008, Dunphy et al. 2004). Driving will still be a primary mode for accessing the
station, and safe drop off/pick up areas need to be designated, as well as parking (parking
will be discussed in greater detail below) (Dunphy et al. 2004).
While transit systems serve as gateways into the regional transportation system, they
also have the potential to serve as a focal point for the community. Bernick and Cervero
(1997) stress that “what is important is that the transit station, functioning as the window to
the rest of the region, is physically tied to and associated with the village’s major gathering
place,” (p.11). A public plaza leading into a transit station can serve as a place for
community gathering and events, enhancing the place-making aspect of the area and
increasing the visibility of transit.
4.7. Parking
Parking is brought up often in the literature as something that can be an obstacle to creating
a successful transit district if not managed effectively. Dunphy et al. (2004) point out that,
although a goal of creating a walkable, compact, mixed-use area around transit is to
encourage walking and transit use, “the dominant mode of access to land uses developed in
transit districts will continue to be the automobile. Automobile storage, both short and long
term, is therefore a primary design concern,” (p.65). Large surface parking lots surrounding

62
a transit station give priority access to automobiles and create an unsafe, unpleasant barrier
for pedestrians to cross. Surface lots also take up space that could otherwise be used for
development of transit-supportive uses close to the station (Dittmar and Ohland 2004,
Dunphy et al. 2004, TCRP 2004).
Parking in a transit district needs to take into account the parking needs for all uses
in the district, not just those of transit riders. If not enough parking is provided, or a
perception of too little parking exists, the ability to lease or sell space may be more difficult
and the economic viability of the development could suffer (Dunphy et al. 2004). However it
is important that parking does not detract from the pedestrian orientation of the district.
Strategies for dealing with parking include: providing on-street parking, which helps buffer
pedestrians from the street and reduces the need for surface lot spaces; placing parking in
the rear of buildings; promoting shared parking among uses that need parking at different
times of the day; and when economically feasible, build a parking garage (Dunphy et al.
2004, TCRP 2004, Bernick and Cervero 1997).
Parking requirements in the district should take into account the proximity to transit
and reduce the amount of spaces needed for new development (CTOD 2008). Additionally,
parking requirements could be waived for in lieu fees, which could go towards creating
shared parking or a parking garage in a central location within the district (Dunphy et al.
2004). To help make parking structures more feasible and fit into the character of the district,
ground floor space can be developed as retail or office use, with parking provided on the
upper floors (Dunphy et al. 2004). Finally, parking does not need to be located immediately

63
adjacent to the station. Surface parking placed within a short walking distance of the station
could help strengthen retail uses along the walking route (CTOD 2008).
4.8. Market Considerations
Development around transit has the potential to attract residents, employers who see the
value in locating close to transit, and retail and services that will support those who live and
work in the area. However, not every transit district will be the same. While some locations
might support large amounts of employment uses and retail, others might be
predominantly residential with a small retail, service, or employment aspect. When
developing around transit, it is important to understand the market conditions for the site
and the region. Market feasibility studies should be conducted as part of the planning
process in order to create a plan with a vision that realistically can be realized (Bernick and
Cervero 1997, CTOD 2008). According to Dunphy et al. (2004), retail development especially
needs to be market-driven: “Transit access can strengthen the retail market, but the market
must be viable without the transit component,” (p.177). As mentioned previously, empty
storefronts can create a stigma throughout the district, scaring off further investment.
Calthorpe (1993), and Dittmar and Ohland (2004), point out that not all transit
stations within a region will be mixed-use, dense, pedestrian friendly places. Some stations
may serve primarily as commuter stations, others as employment destinations, and others
as largely residential areas. Commuter patterns should be considered, and while adding

64
new uses to a location can help balance its role in the region, development must be realistic
and continue to serve existing users of the station (Dittmar and Ohland 2004).
The next two sections discuss factors that are not in the direct control of a local
government, but nevertheless are integral to the development of successful transit districts:
regional planning and policy support, and the quality of transit service.
4.9. Regional Planning and Policy Support
Although development around one transit station must be based in market realities, those
realities can partly be shaped by supportive policy and planning on a regional level. Dittmar
and Ohland (2004) state:
An important determinant in whether the residents of a TOD will commute by
transit is whether their workplace is served by the transit system. Similarly, workers’
residences need to be reasonably accessible to the transit system serving their place
of employment […] This fact supports the need to develop transit-oriented
development at a regional scale. (p.125)
A regional vision of a network of transit oriented developments supported by policy can
influence urban form and growth over the long-term, and provide some certainty that
development will occur around stations (Bernick and Cervero 1997, Dunphy et al. 2004).
Calthorpe (1993) writes that land use planning should begin creating transit-oriented places
before transit, therefore guiding future transit service planning, rather than the other way
around. Whether the transit already exists or not, a more compact and mixed use form of

65
development needs to occur throughout a region to support transit connections, which in
turn reinforces the health of the transit district.
4.10. Transit Service Quality
Location efficiency, the main attraction and advantage to developing around transit, relies
on frequent, reliable transit service (Dittmar and Ohland 2004, TCRP 2004). New transit
service and improvements can trigger development around a station (TCRP 2004). However
if transit service is not frequent enough, reliable, or connected to the places where people
want to travel, the transit oriented aspects of the district will not live up to their potential
(Dittmar and Ohland 2004). Ridership will not be sustained, and the advantage of living
close to the station will dissipate. Although the funding of public transportation is a national
issue, regions and local governments can support future transit investment by beginning to
develop in a way that will support it. If demand seems sufficient, it might be enough to
justify transit improvements in the region. Further justification for transit investment will be
provided if communities are prepared to capitalize on the investment by incorporating the
principles into planning the area surrounding a station.

66
CHAPTER 5
CASE STUDIES
The following section outlines how each of the best planning practices from the literature
applies to the four case study communities. For Saco and Biddeford, the in-depth case
studies, interviews with city staff, a review of plans and zoning ordinances, and a site visit
were used to determine the applicability of each planning practice. For Pittsfield and
Rutland, a review of plans and zoning ordinances, and a site visit provided the basis for the
analysis of applicability. Ridership statistics, and in the case of Saco and Biddeford, property
values, are presented as well to determine if the transportation investment appears to have
made an impact on the community. Each case study section concludes with an overall
discussion of the planning that has occurred around the train station and other factors that
have played a role in the success or challenges a site may face.

67
5.1. Saco and Biddeford, Maine
Saco is located in York County, Maine, and had a population of 16,822 in 2000 according to
the U.S. Census. The Saco River runs along the southern border of the city, and empties into
Saco Bay and the Atlantic Ocean, which borders the city on the east. Passenger rail service
ended in Saco in 1965. In 1992 it was announced that a stop on a new Amtrak train would be
located on Saco Island, an island adjacent to downtown with several large mill buildings
that are in various stages of redevelopment. Service was reinstated in December 2001. The
Amtrak Downeaster makes five round trips a day between Boston’s North Station and
Portland, Maine. The trip from Saco to Boston takes just over two hours (Amtrak
Downeaster 2010). At first there was only a parking lot and platform available for
passengers, but in February 2009, the Saco Transportation Center opened, featuring a
waiting area, ticketing services, and the offices of the Biddeford Saco Chamber of Commerce
and Industry (City of Saco website 2010). A wind turbine located at the entrance to the
station generates power for the building.
Biddeford is also located in York County, Maine, and borders Saco to the south. The
population at the time of the 2000 U.S. Census was 20,942. Passenger rail service also ended
in Biddeford in 1965. Although the Amtrak Downeaster service does not stop within the city
itself, the Saco station is located within walking distance of Biddeford’s downtown, which
includes an expansive mill district currently undergoing redevelopment.

68
5.1.1. Application of Planning Best Practices - Saco
5.1.1.1. The Planning Process. The City of Saco commissioned a plan for Saco Island and
downtown in 1998, entitled A Revitalization Plan for Saco Island and Downtown Saco. The plan
was originally funded to address the redevelopment of the vacant mills on Saco Island, and
this was the primary focus of the plan. However the city expanded the scope of the plan to
include the entire downtown (City of Saco 2007). One of the identified purposes of the study
is to plan for a possible new Amtrak station. The vision for Saco Island further states that “a
major initiative to kick-start the revitalization [of the island] should be undertaken quickly
[…] and parking, streetscape, and access improvements must be initiated as soon as
possible, in concert with the Amtrak station,” (City of Saco 1998, p.11).
While the development of the station is listed as one of the actions that should be
taken in revitalizing the island, the expected Amtrak service was not the main reason for
creating the plan. Instead it was part of a larger plan for revitalizing Saco’s downtown and
older industrial area that would have occurred with or without the impending passenger
train service. In fact, efforts to redevelop the island began in the late 1980s, when much of
what has been redeveloped on the island so far, mostly condos and some retail, was first
completed. At that time passenger rail service was not in the picture. However, ever since
Saco was designated to be one of the communities with a stop along the Downeaster, the
station has always been tied to the redevelopment of the island (City of Saco 2010).
In 2007 the City updated the 1998 plan with the Saco Downtown Plan. This plan also
includes discussion and actions for the Amtrak station and the island. The main impetus for
the completion of the plan was to update and expand upon the 1998 plan, and to be eligible

69
for grants for projects in the downtown area that require an up-to-date plan (City of Saco
2010).
Although the passenger rail service was not the sole reason for implementing
planning efforts on the island and in downtown, it was seen as a positive factor in these
efforts that deserved attention. This is supported by a statement in the city’s 2004 Bike and
Pedestrian Plan, which notes that “the Main Street and Pepperell Square redevelopment
project, the continued success of the Downeaster, and increasing development and
redevelopment opportunities are moving Saco forward as a desirable and livable
community,” (City of Saco 2004, p.3).
Each plan incorporated community or stakeholder involvement. A 17-member
citizen advisory committee guided the development of the 1998 plan. The City
Administrator, Director of Economic Development, and Director of Public Works also
participated. For the Saco Island section of the plan, city officials met with private
landowners to help develop strategies for revitalizing the island (City of Saco 1998). The
downtown portion of the plan included a public workshop, as well as a number of
stakeholder meetings with the business and residential communities (City of Saco 2010). The
2007 plan was based on discussions with city officials, the downtown organization Saco
Spirit, and other stakeholders. Because the plan was an update of the 1998 plan, the public
participation process was less extensive, but at least one public hearing was held (City of
Saco 2010).
The city of Saco has been a key player in implementing redevelopment in downtown
and on Saco Island, and in developing a new train station for the Downeaster service. A
70
separate zoning district was created for Saco Island in 1986 that allows for mixed use
planned developments of 5 acres or more. The particular uses allowed and the dimensions
are flexible and are to be determined during the site plan review process (City of Saco 1985,
Article 4, Section 406-4). The district was created when the prospect of redeveloping the
island was first being considered. It was amended in 1992 to allow a passenger rail station
as-of-right (City of Saco 2010, City of Saco 1985, Article 4, Section 410-8).
The Saco Island redevelopment project required land exchanges between the city
and other landowners, and the use of Tax Increment Financing. Additionally, between the
1998 and 2007 plans, a number of projects have been pursued by the City. Streetscape
improvements were completed on Main Street and in other areas throughout the downtown
that included better signage, new street lights and street trees, and reconstructed sidewalks.
Utility wires were placed underground and a Combined Sewer Overflow was eliminated
along Main Street. A downtown organization, Saco Spirit, was created in 1999 under the
National Trust for Historic Preservation’s Main Street program, and has worked with the
city on design initiatives, promoting the downtown through marketing and community
events, and acted as a critical player in identifying and attracting a developer for the Saco
Island redevelopment project (City of Saco 2007).
The most significant accomplishment since the 1998 plan has been the construction
of the Saco Transportation Center (figure 5.1). When service began in 2001, a platform was
constructed and parking was provided. No other services or amenities were available to
passengers, such as ticketing or a sheltered area to wait for the train. Through a land sale to
the Saco Island developer and TIF funds, the city was able to raise enough money to

71
develop the station, which opened in February 2009. The project cost 2.5 million, and
includes ticketing, a waiting area, restrooms, and houses the offices of the Biddeford Saco
Chamber of Commerce and Industry. A number of green technologies were incorporated
into the building, such as a wind turbine that provides electricity, a geothermal well that
provides heating and cooling, and recycled or locally-made materials and furniture. (City of
Saco 2010, City of Saco website 2010)
5.1.1.2. Mix of Uses. There are both residential and business zoning districts within a half
mile of the station. Three of the four residential districts allow multi-family housing along
with single family homes by right. One district is primarily for single family homes, but
does allow accessory apartments. All residential districts allow limited commercial
establishments as conditional uses (City of Saco 1985, Article 4, Sections 410-1 through 410-
18).
All of the business districts in the half mile from the station allow residential uses.
Saco Island falls within the B-4 district, created specifically for the island, which is intended
Figure 5.1. Saco Transportation Center. Source: www.trainridersne.org

72
to allow a large-scale, comprehensively designed, mixed use development and
redevelopment of the property. Uses allowed include residential, office, retail, recreational,
and light industry. The B-3 district is the downtown business area, which permits
businesses and services that can both support nearby residences and serve as a regional
commercial and service center. The zoning states that “the intent of this district is to
concentrate urban businesses and residences in a core area so that each will complement the
other,” (City of Saco 1985, Article 4 Section 406-3). Additionally, the B-7 Limited
Business/Residential District allows for a mix of residential and “low impact” business uses
in the area adjacent to the downtown business district. (City of Saco 1985, Article 4 Section
406-7).
5.1.1.3. Density. No minimum densities are set for the zoning districts. Instead minimum lot
sizes and setbacks, and maximum lot coverage and height are set for each district. The
minimum lot area for zoning districts within the transit district range from 7,500 square feet
to 10,000 square feet. The exception is the Saco Island district, which does not specify a
minimum lot area or maximum lot coverage and height. These dimensions are left to be
determined during site plan review of any proposed project (City of Saco 1985, Article 4
Table 412-1).
5.1.1.4. Connectivity and Mobility. There are numerous examples within Saco’s zoning,
subdivision regulations, and plans that show there is a focus on pedestrian mobility. The
Zoning Ordinance requires walkways to be provided from sidewalks and parking areas to

73
the entrances of buildings and other focal points of pedestrian activity such as street
crossings. The walkways must be distinguished with surface materials or paint (City of Saco
1985, Article 7 Section 708-1). The city’s Subdivision Regulations require sidewalks on all
new streets, and extensions to other sidewalks or destination may be required in order to
make a continuous system of sidewalks without large gaps in between developments. The
regulations also state that blocks longer than 800 feet may be required to have an easement
through the block to provide for pedestrian access (City of Saco 1998, Article 10 Section
10.5).
Pedestrian and bicycle mobility was obviously a large focus of the 2004 Bike and
Pedestrian Plan. The train station was identified as one location where bike parking facilities
should be located. The plan also recommends improving the connection between the station
and the downtown by installing a crosswalk to access the station, and adding wayfinding
signage to direct visitors to and from the downtown and station (City of Saco 2004). The city
is currently working with Saco Spirit to make some of these suggested improvements.
On Saco Island itself, both the developer and the city have worked to created
pedestrian pathways and sidewalks. The developer was responsible for creating a new
sidewalk along the western side of Main Street, while the city has been utilizing grant
funding to construct pathways to and from the station and parking areas to the sidewalk.
There has been talk of creating a pedestrian bridge connecting the island to downtown
Biddeford, but this is still in the preliminary stages of planning at this time (City of Saco
2010). A site visit to the station identified good pedestrian connections from Main Street on
the western side, the same side as the station. However a crosswalk is still needed from the

74
eastern, opposite side of Main Street to access the station. A sidewalk on the eastern side of
Main Street on the island should be constructed, as a well-worn foot path is evidence that a
large amount of people walk along that side of the road (figures 5.2 and 5.3).
5.1.1.5. Place-Making and Urban Design. Saco’s Zoning Ordinance outlines two different
design standards, those for the Historic District and standards for all projects in other
districts needing a conditional use permit or site plan review. The Historic District is located
in the downtown area, along Main Street and several feeder streets leading into downtown.
It does not include Saco Island (City of Saco Zoning Map 2008). The standards are meant to
ensure that new construction is compatible with the massing, size, scale, and architectural
features of the surrounding environment. Some of the factors leading to compatibility
outlined in the standards include: the relation of solids to voids in front façades (the amount
Figure 5.2. Pedestrian crossing from
downtown to Saco Island on east side of
Main Street. Source: Author.
Figure 5.3. Lack of sidewalk on the west
side of Main Street, opposite the
transportation center. Source: Author.

75
of windows versus solid wall); the rhythm of the spacing of buildings along a street; the
rhythm of entrances and the relationship of entrances to the street; and the scale of
buildings, including the size and shape of windows and door openings. The design of signs
is also discussed, and should be at a scale that is appropriate for pedestrians and slow-
moving traffic (City of Saco 1985, Article 4 Section 413).
The purpose for the Design Standards that apply to all other districts includes
attracting development and redevelopment by creating an attractive and desirable living
and working environment. The intent of the standards is to ensure that “Acceptable
building styles shall continue the City’s human scaled environment through visually
compatible architectural forms, massing, details, relationship to nearby buildings and
neighborhoods, and the use of materials consistent with these standards,” (City of Saco
1985, Article 7 Section 729). The standards identify the Main Street corridor as desirable
examples of a human-scaled street wall, clearly defined entrances, landscaping, lighting,
and parking that is located to the side or rear of buildings. The standards also specify that
walls should not extend for more than 50 feet without an architectural feature, and that the
primary entrance of a building should face the street.
Overall the design standards for both the historic district and the rest of the city
emphasize a human scaled and pedestrian oriented environment, as well as context
sensitive infill. The standards act as guidelines, and alternatives can be suggested and
approved if they meet the overall purpose and intent of the standards.
The original vision for Saco Island, presented in the 1998 Revitalization Plan, called
for “a marina, a regional, coastal park, and other recreational facilities [that will] enhance

76
[the] commercial/residential uses and create an attractive, livable environment,” (City of
Saco 1998, p.11). Unfortunately, the revised development plans for the island do not have an
extensive open space or recreation element. What is planned is for the use of the private
residents of the island more than for the public. There is a planned walkway along the river,
currently under construction on the western side of the island that will be open to the
public, as well as a fishing area (figure 5.4) (City of Saco 2007, 2010).
In the downtown, Main Street itself is used for events throughout the year. In
addition, there is a small park along Main Street that includes a gazebo. The Transportation
Center itself has become a popular indoor space, where people enjoy a bagged lunch or
game of cards at one of the tables. Senior events are held in the lobby, and community
groups can use the conference room for meetings. In the evenings the station is manned by
Figure 5.4. Construction of a riverwalk is underway. Source:
Author

77
volunteers, which shows how much the community has embraced and supported the new
building as their own (City of Saco 2010).
5.1.1.6. Station Location, Design, and Access. In 1992 Saco competed with Biddeford for the
location of the station for the Downeaster service. Biddeford proposed locating the station in
its industrial park, while Saco demonstrated that 20,000 people lived, both in Biddeford and
Saco, within a mile of the proposed location on Saco Island. This location happens to be
where the original train station was located years ago. The chosen site affords a central
location with the potential to unite the downtowns of both cities that flank it on either side.
The site is also in a position where activity can be created within close proximity with the
redevelopment of the massive mill buildings on the island and immediately across the river
in Biddeford. There are plans to develop much of the remaining vacant land on the island as
well (City of Saco 2010, City of Saco 2007).
The station itself is a brick building with approximately 5000 square feet that reflects
the mill buildings that it shares the island with. The architects won an Urbanism Award in
2009 from the Congress of New Urbanism – New England Chapter. The jury that was
responsible for choosing the award recipients stated that they were “particularly impressed
by the recently completed building's sustainable design, which is integrated
environmentally and urbanistically with the surrounding area, including a former mill
complex and the adjoining communities' downtown areas,” (CNU 2009).
The station is served by the local Shuttlebus service, as well as taxis that arrive and
depart via a drop off area in front of the station. The park and ride function of the station is

78
accommodated by several surface parking lots, including one for long term parking, totaling
just over 200 parking spaces (City of Saco 2007). There are several pedestrian pathways
leading from the sidewalk on Main Street to the station (figure 5.5). One is completely
separated from parking areas, while others cross through parking lots to reach the entrance.
Pedestrian-scaled lighting is provided along the paths.
People currently arrive at the station by car and park or get dropped off, and some
also walk from nearby neighborhoods. People from Saco and surrounding towns use the
service. Parking is currently free, and this will not change until it becomes an issue
(addressed in more detail below). With continued redevelopment of the island, the City may
consider constructing a parking structure to free up additional space for development, but
this is at least 10 years into the future (City of Saco 2010).
Figure 5.5. A pedestrian path leading to the station
from Main Street. Source: Author.
79
5.1.1.7. Parking. Saco’s Zoning Ordinance provides for several alternatives to meeting off-
street parking requirements, especially within the downtown business district. In the
downtown business district, parking requirements are initially reduced by 50%, and full and
partial waivers of meeting the remaining requirements may be granted for a change of use
or internal expansion if it can be shown that on-site parking is not available and lack of
designated parking will not create excessive congestion. In addition, public parking lots can
be used to meet requirements if the lots have been provided for that purpose, and the
Planning Board may approve joint use of parking areas, as well as the creation of shared
parking among contiguous properties (City of Saco 1985, Article 7 Section 708).
The 2007 Saco Downtown Plan notes that there appears to be enough parking
downtown, but that there is a perception of too little parking. According to the plan, 433
public parking spaces are available in the downtown area, 206 of those located at the train
station. Improving mapping and signage for parking was one recommendation to help
improve the situation. The plan also suggest that visitors park at the train station, where it is
a short walk to downtown and there are abundant spaces not being utilized. However the
plan notes that “The increased activity on the island and the improving economics of train
travel are likely to increase parking demand on the island. While this should be
inconsequential for the next two to three years, longer term planning, monitoring and
management of parking will be needed,” (City of Saco 2007, p.2-6). As of 2010, parking at
the new Transportation Center is still available for those not using the train service, but the
city is monitoring the situation and has already begun preliminary planning for a possible
parking structure in the future (City of Saco 2010).

80
5.1.1.8. Market Considerations. A market assessment of Saco Island was completed as part
of the 1998 revitalization plan. The assessment identified four potential market areas for the
island: professional, business services, and governmental offices; retail including
restaurants, brew pubs, furniture, antiques, fitness facility, and convenience and specialty
retail; marginal residential uses such as condos, rental units, and retirement housing; and
manufacturing and warehousing (City of Saco 1998). The Island Point development plan is
largely following the 1998 assessment, including 72 new condominiums and 100,000 square
feet of office and professional space. Construction began in the fall of 2007, but most of the
development is currently on hold until market conditions improve. A 8,325 square foot
restaurant and brew pub has been developed since 2007. The new vision does not include
manufacturing or light industry (City of Saco 2007, 2010).
The 1998 plan also included a market analysis for downtown Saco, and presented
these opportunities: market downtown as a specialty retail center; expand downtown’s role
as a convenience and service center; expand opportunity for professional and financial
services; promote downtown as a restaurant center; and retain Saco’s role as a local
government center (City of Saco 1998). The 2007 plan updated the analysis and determined
that since 1998, retail has remained the same in the downtown area, there has been a slight
increase in restaurants (+2), a significant increase in services (+6), and a significant increase
in other businesses (+8) (City of Saco 2007).
In addition to the market opportunities outlined in 1998, the 2007 plan includes
housing, stating that “opportunities for housing in all income levels should be identified

81
and pursued,” (City of Saco 2007, p.3-13). The City is recognizing an affordable housing
issue for the first time (City of Saco 2010), and the plan also addresses the need to enforce
building codes for multi-family housing in order to provide quality housing. This emphasis
provides a balancing effect when combined with the new housing being developed on Saco
Island, none of which is designated as affordable.
5.1.2. Lessons for Other Communities - Saco
The station appears to be making an impact on the surrounding area. The developer of Saco
Island refers to the station and the service often in marketing materials, and “considers the
redevelopment a ‘transit oriented development’ […] and considers the train station an
integral component of the successful operation and marketing of the new neighborhood
being created in the old mills,” (City of Saco 2010, City of Saco Website). Some of the people
who have bought condos on the island have ties to Boston, and the service was likely a large
reason for their choice (City of Saco 2010). Some of the reasons for this success are the
development of the Transportation Center, the quality of the Downeaster service, and a
supportive mayor.
The development of the Transportation Center, approximately seven years after the
start of service, has had an impact on ridership. Extensive local press coverage during the
construction and completion of the station helped increase the public’s awareness of the
service. Additionally, the services and amenities provided by the station are incredibly
important in attracting riders. The station provides easy ticketing, a comfortable and safe

82
waiting area, and information about the community for visitors. One of the things the City
would have liked to have done differently is to build the station sooner, but needed to first
raise enough money to fund it (City of Saco 2010).
The Downeaster can be distinguished from other Amtrak services around the
country in several ways. First, Amtrak is a subcontractor to the Northern New England
Passenger Rail Authority (NNEPRA), created by the State of Maine to run the rail operation.
This has helped the Downeaster retain excellent service, as local people are involved in
monitoring the quality. The on time performance is good, the food concession on board is of
higher quality than other Amtrak trains, and free wifi is provided (City of Saco 2010).
NNEPRA’s director also brings a marketing and tourism perspective to the operation, and
the Downeaster’s website provides a slideshow, attractions, and other visitor information
about each station community along the route (City of Saco 2010, Amtrak Downeaster 2010).
As discussed in the literature, it is helpful, and sometimes pivotal, to have a political
leader acting as a champion for a project. In Saco, Mayor Mark Johnston was an important
figure in developing the station. The former mayor was a strong environmentalist, an
advocate for downtown, and a supporter of public transit. He and others in the local
government pushed for the development of a station in Saco, seeing it as a long term
investment for the city (City of Saco 2010).
Despite some success, challenges remain. At present, the redevelopment of the mills
on the island is at a stand still due to the current national recession. In addition, transit
oriented development is dealing in long term economic and population shifts that take time
to evolve. The City was aware of the long term nature of the investment to build the station,

83
and understands that it may be years before the area surrounding it is fully developed. A
final challenge is the need to provide a quality transportation service that can compete with
other modes. The scheduling and frequency of trains is important, and despite the high level
of quality aboard the Downeaster, the current timetable does not compete with driving for
most trips, and the service is not heavily used for commuting from Saco (City of Saco 2010).
5.1.3. Application of Planning Best Practices - Biddeford
5.1.3.1. The Planning Process. In Biddeford, plans for the area closest to the station have
been divided into two areas of focus: the Mill District, which lies between the Saco River
and downtown Biddeford; and the downtown itself, where Main Street travels from Saco
Island directly into downtown. Planning efforts specific to these areas have been completed
after the start of the Downeaster service on Saco Island. The station and service are not
identified as the main reasons for completing these plans, but are factors that are mentioned
and included in each effort.
The Downtown Traffic Circulation and Parking Management Plan, completed in 2006,
sites the redevelopment potential of the downtown and the Mill District as the main
impetus for the plan, as traffic will likely increase due to these efforts. The plan however
only focuses on the Main Street corridor and not the Mill District. The plan also notes the
role of the Amtrak station in increasing traffic in the study area: “With the on-going interest
in locating in the downtown, and the potential for redevelopment of the mill district, the

84
area is poised for significant new traffic, particularly with its proximity to the Amtrak
station,” (City of Biddeford 2006, p.7).
In 2009 a Mill District Master Plan was developed, focusing on the redevelopment of
the mills and the open spaces within the district (figure 5.6). The plan notes that the
possibility of the relocation of the Maine Energy Recovery Facility, an incinerator located
within the district, provides an opportunity to create a new sense of place within the district.
The plan outlines a set of principles for the redevelopment of the district that are in line with
many of the planning best practices in this research:
• Connections – visual, pedestrian, and vehicular;
• Land use mix and place making;
• Open space – public open space system connected throughout the district;
• Character – sensitivity to context;
• Economic development – uses that build and strengthen economy and
improves vitality; and
• Flexibility – allowing phasing of development to accommodate changes due
to funding and market changes. (City of Saco 2009, p. 27).

85
Elements of the plan that fall within these principles will be discussed in more detail in each
section below.
The Amtrak station itself is mentioned in the Mill District plan. Although it is located
across the river in Saco, the plan states that “There is a strong desire to create improved
pedestrian connections from the Mill District to Saco Island, both to provide pedestrian
access to the train station and […] to provide a synergy that will increase the attractiveness
of both places as a destination,” (City of Saco 2009, p.37). The city has seen the Downeaster
service as a way to help promote and market the Mill District (City of Biddeford 2010), and
therefore connections to and from the station to the District is an element that the plan
focuses on.
Figure 5.6. Biddeford’s Mill District, as seen from Saco Island.
Source: Author.

86
Although the Downeaster service was not the main impetus for the Mill District
plan, the city has utilized transit-oriented ideology to drive planning in the district (City of
Biddeford 2010). In fact, while the plan was still being developed, a charette was conducted
in Biddeford, focusing on transit-oriented development in the area surrounding the station,
with the emphasis on Biddeford’s Mill District. The charette was part of the 2009 Rail-
Volution conference, an annual event that focuses on the interaction between land use and
transit in building more livable communities (Rail-Volution 2010). Participants travelled
from Boston on the Downeaster, and after touring both downtowns, Saco Island and the
Mill District, four different approaches to redeveloping the Mill District were prepared and
presented. Each was unique in its own way, but all four adhered to the core principles of
TOD, particularly mixing uses and providing a pedestrian-friendly environment (Rail-
Volution 2009). The city has been able to use the different scenarios when working with
developers, who may be more partial to one over another. It presents a range of choices for
redevelopment while still holding to the principles outlined in the Master Plan (City of
Biddeford 2010).
Finally, a Master Plan for the downtown is currently underway. Fostering a sense of
place and community participation are large goals of the plan, and the process has already
engaged community members in a number of ways. A Request for Proposals was recently
released for a consultant to write the final plan, which will include a market analysis, land
use analysis, infrastructure analysis, and identification of strategic properties for
redevelopment (City of Biddeford RFP 2010). However, it is too early to tell how the Amtrak
station will play into this effort.

87
The plans mentioned above all involved input from different stakeholders. The
Downtown Traffic Circulation and Parking Management Plan had an advisory committee
made up of city officials, staff, and downtown business and property owners (City of
Biddeford 2006). The Mill District Master Plan also employed a steering committee to help
develop the plan, made up of city officials and staff and property owners, but also had a
more comprehensive public participation process, holding three public meetings and
utilizing a website that allowed for comments to be submitted about the plan (City of
Biddefore 2009). As mentioned above, participants in the Rail-Volution charrette also
provided input, and were likely made up of professionals in numerous fields involved with
land use and transportation planning and development.
The Downtown Master Plan is being lead by a joint partnership between the City of
Biddeford, the Orton Family Foundation, and the Heart of Biddeford, a downtown
organization modeled after the National Trust for Historic Preservation’s Main Street
Program. Currently in its early stages, the project has already engaged in several public
participation efforts. The first were discussions with community members identifying what
they felt the heart and soul of Biddeford is, resulting in a documentary. Currently a series of
meetings are being held throughout the community to develop a vision for the downtown,
which will culminate in a city-wide forum in July. Additionally, “heartspots” have been
marked throughout the downtown, identified by a poster with a heart, and passersby can
leave a story about the place in an envelope provided. The Master Plan will be developed as
a final phase of the project (City of Saco 2010 RFP).

88
The City of Biddeford has taken numerous actions to move forward with the
redevelopment of downtown and the Mill District. The entire downtown area, including the
Mill District, has been divided into three zoning districts called the Main Street
Revitalization Districts (MSRD). MSRD1 is the Commercial Core District, which includes the
traditional Main Street corridor and intends to preserve the character of downtown while
promoting growth of businesses and residences. MSRD2 is a Residential Conservation
District, made up primarily of residential uses, with the focus on infill conforming to
existing characteristics of the area. MSRD3 is the Mill District, and is meant to preserve the
historic character while facilitating the redevelopment of the mills into a mixed use area
(City of Biddeford 1990, Article 5 Section 7). These districts have separate architectural
standards and parking standards than other zoning districts in the city, as well as different
dimensional requirements.
Tax Increment Financing is being used both at a commercial site on the edge of the
city, and within the Mill District itself, to finance improvements to the downtown. Projects
planned for the future include a parking garage, pedestrian river crossings in the Mill
District, utilities, and potentially aesthetic improvements (City of Biddeford 2010). Minor
intersection improvements have already been completed (City of Biddeford 2009), and the
City has been making incremental improvements to downtown, such as sidewalks, street
lights, and updates to road and sewer infrastructure (City of Biddeford 2010).
One area that the City has focused on that directly relates to the Downeaster service
is the local bus system, which is owned jointly by Biddeford, Saco, and Old Orchard Beach.
Soon after Downeaster service began, the cities worked together on coordinating the

89
schedule of the buses that serve the two downtowns and the train station to make sure that
a local bus meets every train when it arrives (City of Biddeford 2010).
Moving forward, the upcoming downtown master planning process will include
recommendations for the development and permitting review process, zoning changes,
infrastructure (transportation, accessibility, streetscape, lighting, parking, water/sewer/fiber
optics/wi-fi, and other utilities such as energy generation), and potential properties to
acquire for redevelopment, if applicable (City of Biddeford RFP 2010).
5.1.3.2. Mix of Uses. A mix of uses are allowed and encouraged in a number of zoning
districts within a half mile of the station. As mentioned above, the Main Street Revitalization
Districts (MSRD) makes up a large part of this area. While MSRD2, Residential
Conservation District, is primarily residential uses, both MSRD1 Commercial Core District,
and MSRD3 High Density/Mixed Use Zoning District encourage a mix of uses. MSRD3,
which encompasses the Mill District, is particularly intended to attract a mix of uses (City of
Biddeford 1990, Article 5 Section 7). The vision for the Mill District Master plan is to create
“A new mixed-use residential, commercial, artisan and light industrial district that
celebrates the unique character, beauty and history of the mills and the river, and attracts
residents and visitors to the active and vibrant Mill District and to Downtown Biddeford,”
(City of Biddeford 2009, p.27). The plan notes that there is an opportunity to develop
affordable housing for low to middle income households, among other types of housing,
and currently a Hope VI project is underway which will provide 66 affordable units within
the District (City of Biddeford 2009).

90
Another large zoning district within close proximity to the train station is the R2
district, which provides for high density multifamily neighborhoods and allows a mixture
of residential uses. The R1-A district is a single family residential area. The B1 district is
characterized as an in-town commercial area, though it is separate from the MSRD districts.
This district allows for a mix of commercial and multifamily residential uses, which are
relegated to the upper stories on select streets. Overall Biddeford’s zoning allows and
encourages a mix of uses as well as a mix of housing types. It also allows for vertical mixing
of uses in the Mill District, Commercial Core District, and B1 district (City of Biddeford
1990, Article 5 Section 2 and 7).
5.1.3.3. Density. There are no minimum density requirements within the Zoning Ordinance,
however the Main Street Revitalization Districts have flexible dimensional requirements.
The MSRD1 Core Commercial District has no requirements for lot size, frontage or setbacks,
but does require a minimum height of 2 stories or 26 feet, and a maximum height of 60 feet.
In the MSRD2 Residential Conservation District, new structures must conform to the
average lot size and setbacks in the district. Within the MSRD3 High Density/Mixed Use
District, there are no requirements for lot size, frontage, or setbacks, except when a non-
residential building borders a residential building or district, in which case a 50 foot buffer
is required. In this district a minimum height of 2 stories is also required, but there is no
maximum height. (City of Biddeford 1990, Article 5 Section 6(A)).

91
5.1.3.4. Connectivity and Mobility. Elements of connectivity and mobility for pedestrians,
bicyclists, and those who ride transit are prevalent in the Zoning and plans for the
downtown area. In the Main Street Revitalization Districts, performance standards require
pedestrian paths to be provided to, from, and across parking lots to the street. When
considering a reduction in off-street parking requirements in these districts, the board
granting approval will consider plans that make the site more appealing for pedestrians and
bicyclists, as well as access to public transit. Furthermore, all new buildings or
redevelopment within the MSRD must include a parking plan that shows how pedestrian
and bicycle circulation will be accommodated safely. Sidewalks are required on all new
streets, and any plan that provides more than ten parking spaces must provide sidewalks on
the portion of frontage that abuts a public road. (City of Biddeford 1990, Article 6 Section
49).
The Downtown Traffic Circulation and Parking Management Plan focuses on
circulation for automobiles, pedestrians, and bicyclists. Recommendations relating to
pedestrians and bicyclists include re-striping all crosswalks, installing new or additional
pedestrian crossing signage at crosswalks, and rehabilitate existing sidewalks and ramps to
meet ADA standards (City of Biddeford 2006). As mentioned above, the City is
incrementally working on making these improvements (City of Biddeford 2010).
One of the principles of the Mill District Master Plan is connections – visual,
pedestrian, and vehicular connections throughout the district and between the district and
the river and downtown. The principle of open space also focuses on connectivity, with the
goal of developing a public open space system with a riverwalk, parks and plazas, and

92
pedestrian and bike paths connected internally and between the district and adjacent
districts. Two pedestrian bridges are proposed to link the district with Saco Island and the
Amtrak station, and wayfinding signage is also recommended (figure 5.7. City of Biddeford
2009).
As mentioned above, the city, in conjunction with Saco and Old Orchard Beach,
evaluated the scheduling for the local bus service that the cities jointly own in order to
provide multimodal connections at the train station (City of Biddeford 2010). The Mill
District Master Plan proposes an additional, free shuttle service that would travel in a circle
between downtown, the Mill District, Saco Island and the station, and downtown Saco. The
bus would run every fifteen minutes, creating a convenient way to travel within the transit
district without using a personal automobile (City of Biddeford 2009).
Figure 5.7. Open space plan for the Mill District, including a riverwalk and two
pedestrian bridges to Saco Island. Source: Biddeford Mill District Master Plan 2009.

93
5.1.3.5. Place-Making and Urban Design. The city’s Zoning Ordinance outlines two different
design standards that apply to the downtown and the Mill District. The Mill District and a
portion of Main Street are included on the National Register of Historic Places. New
buildings, demolition, and alterations and additions to existing buildings within these areas
are subject to review by the Historical Preservation Commission, an advisory board that
considers factors such as height, width, window proportions, roof forms, directional
expression of the building, materials and textures, details, and signs (City of Biddeford 1990,
Article 5 Section 8).
The goal of the Commission is to prevent inappropriate alterations to historic
buildings, and to ensure that new buildings are compatible with the character of the area in
terms of scale and visual effect (City of Biddeford 1990, Article 5 Section 8). Because the
standards are focused on compatibility, it is difficult to say whether they promote a human-
Figure 5.8. Biddeford’s downtown. Source: Author.

94
scaled environment. However, on Main Street, where the existing environment caters to the
pedestrian, it can be assumed that these standards would further the pedestrian-orientation
of this area (figure 5.8).
In addition to the Historic Preservation standards, the zoning provides more
regulatory Architectural Standards for the Main Street Revitalization Districts. These
standards also largely rely on conformance with existing structures, however they also
specifically state that additions along a public right of way cannot be setback, unless at least
60% of the front façade is on the property line. Also parking lots are prohibited from the
side and front yards, unless it already exists (City of Biddeford 1990, Article 6 Section 6).
These standards help to promote a pedestrian rather than automobile orientation. Sidewalks
exist on both sides of Main Street leading from the river, however they are narrow for the
first 1000 feet or so, and one side of the street is made up of a massive wall of a mill building
fronting the street, creating a bleak environment for a pedestrian. Continuing to move away
from the river, the sidewalks begin to widen and are adorned by street trees and benches,
providing a more pleasant pedestrian experience.
The Main Street corridor is already largely a pedestrian-oriented area, and standards
that seek to ensure conformity to the existing structures would help build on the pedestrian-
orientation. Specifically, the standards both address factors such as proportions of windows,
how a building fronts a street, and details, textures, and materials that can help make a
street more inviting to a pedestrian. The standards are focused on individual buildings, and
therefore do not address larger urban design factors such as the size of blocks.

95
There are several existing public spaces for community gathering in downtown, and
a number of planned spaces in the Mill District. Currently a small park with benches sits on
the river next to Main Street, at the entrance to the downtown coming from Saco Island. The
Mill District Master Plan outlines an extensive system of public open spaces connected by
pathways. Components of the system include a riverwalk, plazas and parks, street edges,
gateways into the district, and two pedestrian bridges over the Saco River. The plan states
that the intent is for all open spaces within the district to be open to the public, although
some spaces might be privately owned (City of Biddeford 2009).
5.1.3.6. Station Location, Design, and Access. The station is located in Saco, and therefore the
design is addressed in the Saco discussion section. The issue of access to the station,
however, is addressed in the Downtown Traffic Circulation and Parking Management Plan and
the Mill District Master Plan. The first plan merely mentions that the downtown is well-
served by transit, which includes the Amtrak station which the plan notes is a short walk
from downtown (City of Biddeford 2006). The Mill District plan is more proactive in
proposing two pedestrian bridges to connect the district to Saco Island and the train station,
as well as creating a free shuttle bus service to serve the two downtowns, the Mill District,
and the train station (City of Biddeford 2009).
Access is also provided by the existing local bus service, which has been scheduled
to ensure a bus awaits every train as it arrives. Since the Downeaster service began, the
University of New England has also implemented an express bus service from their campus,
approximately 4 ½ miles from downtown, to the downtown and the station. The University

96
also offers Zip Car service on their campus, and the city is exploring the idea of providing
an additional Zip Car location in the Mill District, within close proximity to the station (City
of Biddeford 2010).
5.1.3.7. Parking. The city’s Zoning Ordinance allows the Planning Board to approve joint use
of parking facilities by two or more buildings or uses. Additionally, the Main Street
Revitalization Districts are subject to different requirements for off-street parking. Within
these districts, parking reuirements can be reduced: if legal on-street parking is located
within 1000 feet of a non-residential use and will meet some or all of the demand; publicly
supplied off-street parking is located within 500 feet of a non-residential use; it can be
demonstrated that demand will be lower than what the requirements suggest; for reuse and
redevelopment projects if a new use will not increase demand; and if demand will be less
because of alternative transportation use. Requirements for residential uses may be waived
for dwelling units of less than 1000 sq.ft, senior housing, single bedroom, efficiency, and
studio apartments. Requirements can also be waived if an applicant can demonstrate all
required parking can be accommodated through mixed use development, shared parking,
or other situations that are acceptable (City of Biddeford 1990, Article 6 Section 49).
The 2006 Downtown Traffic Circulation and Parking Plan noted that 940 public parking
spaces existed downtown (not including the Mill District), 429 of which were off-street
spaces. At that time the average daily capacity of these spaces was 60%, with some areas
filling up more and others less. The plan recommends adding 200-300 additional spaces
over the next 20 years, possibly through structured parking due to the lack of available land

97
for surface lots (City of Biddeford 2006). Parking has become more of an issue downtown in
the last few years as redevelopment has progressed, and the city is hoping to build a
parking structure and is currently looking at acquiring land for that purpose (City of
Biddeford 2010).
Both the traffic and parking plan and the 2009 Mill District Master Plan incorporate
recommendations for wayfinding signage to help direct visitors to available parking, which
has yet to be implemented. The Mill District plan suggests that new parking requirements
be adopted for the district that would result in approximately 2500-3000 spaces for the
district as a whole. Currently parking requirements for mixed use developments are equal
to the total requirements for all individual uses within the development (City of Biddeford
1990).
Additionally, residential uses require two spaces per unit, unless falling within the
categories mentioned above (City of Biddeford 1990). The plan however recommends
reducing the residential requirement to one space per unit, in addition to lower
requirements for light industrial, retail and office. These lower requirements take into
account the mixed use nature of the area, and its proximity to downtown, allowing people
to drive less. The creation of shared parking facilities is recommend, and parking for the
district should occur in incremental phases as development progresses, with vacant lots
used as surface parking in the beginning and moving to structured parking as the amount of
uses intensifies (City of Biddeford 2009).

98
5.1.3.8. Market Considerations. The 2009 Mill District Master Plan performed a market
analysis, looking at demographics, housing, retail spending, and key industries in York
County that development within the district could build upon. The analysis found that there
is an opportunity to develop affordable housing due to the number of low to moderate
income residents in the city, to promote the downtown and Mill District as a tourist
destination, and to allow specialized and high value added manufacturing uses in the
district, including artisans. In order to complement, not compete, with downtown, the plan
recommends that more emphasis should be placed on residential and industrial uses, with
some office and retail (City of Biddeford 2010). The Request for Proposals for the
forthcoming Downtown Master Plan identifies a market analysis of the downtown as one of
the required elements of the plan (City of Biddeford RFP 2010).
5.1.4. Lessons for Other Communities - Biddeford
In Biddeford the Downeaster service has had an impact on the surrounding area. The
service has been a boost in terms of marketing the Mill District. Where without the service
the Mill District is another mill redevelopment project that might not reach a wide
geographic range of interest, the Amtrak service now expands the market to include Boston.
According to a city staff person, the Amtrak service also has played a role in the decision of
the University of New England to expand and almost double its campus. The University is
now able to draw more students from the Boston area who have access to the Downeaster

99
via the MBTA. Furthermore, the Downeaster compliments these efforts by providing
discounted fares to students. (City of Biddeford 2010).
Looking back, there are planning activities the city should have done earlier that
could have further capitalized on the train service. The first is that the city could have
fought harder to have the station placed in downtown Biddeford at the city’s original train
station, rather than on Saco Island. The station then would have part of a plan to rebuild the
existing station and then rebuild the city around it. Additionally, the city could have
explored the creation of a downtown business park, which is only now being talked about.
(City of Biddeford 2010).
Moving forward, the city would like to market and promote public transportation.
The city already has a good local bus system, but would like to plan a system that would cut
headways (the time in between buses on a route) in half, down to 15 minutes. To do this the
city will need to join with its Metropolitan Planning Organization to lobby for more transit
funds, which can be a tough sell when road infrastructure is also in need of repair and
improvements. As the city moves forward with redeveloping its Mill District and Main
Street, it needs to be aware that each new project comes with its own demands, and plans
should be updated to include input from new stakeholders in the area. (City of Biddeford
2010).
Biddeford, like Saco, has integrated the Amtrak station and service into its plans for
downtown and especially the Mill District, and has been able to use the passenger rail
service as a way to attract new residents and businesses to these areas. One lesson offered
from Biddeford for a city or town that is expecting passenger rail to be reinstated or

100
introduced for the first time is to first know what the impacts might be, and then prioritize
which impacts and benefits the city or town most wants to focus on (City of Biddeford
2010). Biddeford could have begun to plan for the impacts and benefits of the Downeaster
earlier, but the city is beginning to make up for it now as it steadily moves forward with
redeveloping its once, and likely future, thriving Mill District and Main Street.
5.1.5. Ridership
Ridership at the Saco station has grown every year since 2003, a year after service began
(table 5.1). Ridership data was not available for 2002. Total boardings and alightings at the
station has more than doubled between 2003 to 2009, from 18,959 to 38,862 passengers, an
increase of 105%. The greatest increase occurred between 2007 and 2008, from 25,417
passengers to 37,418, an increase of 47.2%. This may be attributable to the increase of service
on the Downeaster from four round trips a day to five round trips, and the rescheduling of
trains to better serve commuters. Ridership on the Downeaster as a whole has also grown
by 78.5% from 2003 to 2009. In 2004 and 2009 ridership declined slightly on the Downeaster,
while during the same years it continued to grow at the Saco station. In 2009 the continued
growth at Saco despite a decline in ridership overall may be partially attributable to the new
station that opened at the beginning of the year. And while development on Saco Island has
stalled, the continued redevelopment of the Mill District in Biddeford may also be
contributing to the steady increase in riders at the Saco station. Whatever the reasons, it is

101
clear that the Saco station along the Downeaster is successfully retaining and increasing
ridership over the years.
Table 5.1. Total Ridership (boardings and alightings) for the Saco/Biddeford Station and the
Downeaster, 2003 – 2009
Year
Saco/Biddeford
Ridership
%
Change
Downeaster
Ridership
%
Change
2003 18,959 515,588
2004 19,389 2.3 497,142 -3.6
2005 22,123 14.1 587,306 18.1
2006 22,886 3.4 682,872 16.3
2007 25,417 11.1 763,648 11.8
2008 37,418 47.2 965,880 26.5
2009 38,862 3.9 920,404 -4.7
Change
2003 - 2009 19,903 105.0 404,816 78.5
Source: Northern New England Passenger Rail Authority 2010.
5.1.6. Property Values
Residential sales data was collected from assessors data for both Saco and Biddeford for
three periods of time: three years just before the stop was announced (1989-1991); three
years after the announcement but prior to the start of service (1998-2000); and three years
after the start of service (2006-2008). The sales price for each home was divided by the
square footage to control for the size of the house, assuming that homes within a dense
downtown may be smaller than homes in a more suburban or rural part of the city.
Geographic Information Systems was used to map where sales occurred, and half mile rings

102
were used to determine sales within .5, 1, 1.5, 2, and more than 2 miles from the station.
Table 5.2 displays the number of sales during each period and for each half mile ring.
Table 5.2. Saco Number of Sales by Distance from Train Station
Distance
(miles) 1989-1991 1998-2000 2006-2008
0.5 9 45 34
1 30 107 70
1.5 36 103 98
2 27 73 46
2+ 120 414 235
total 222 742 483
Source: Derived from assessor data collected from the City of Saco’s assessor’s database,
2009.
In Saco, it was found that the median sale price in the ½ mile ring closest to the
station consistently is lower than all other rings (Figure 5.9). For the most part, the median
price rises the farther the distance from the station area. Median prices for all areas rose
from one period to the next.
Looking just at these results, it is difficult to determine if there was any impact
attributable to the station announcement or the start of service on the area closest to the
station. If anything it seems as though there was no impact. Percentage increases for each ½
mile ring tell another story, however.
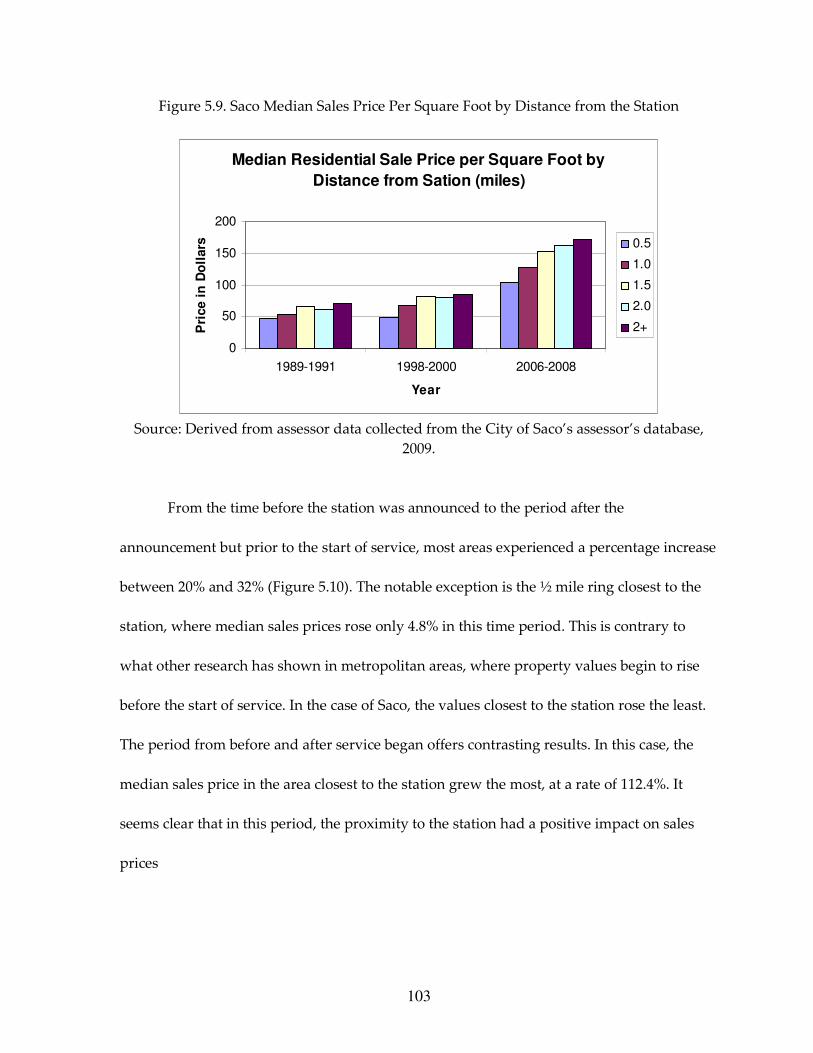
103
Figure 5.9. Saco Median Sales Price Per Square Foot by Distance from the Station
Source: Derived from assessor data collected from the City of Saco’s assessor’s database,
2009.
From the time before the station was announced to the period after the
announcement but prior to the start of service, most areas experienced a percentage increase
between 20% and 32% (Figure 5.10). The notable exception is the ½ mile ring closest to the
station, where median sales prices rose only 4.8% in this time period. This is contrary to
what other research has shown in metropolitan areas, where property values begin to rise
before the start of service. In the case of Saco, the values closest to the station rose the least.
The period from before and after service began offers contrasting results. In this case, the
median sales price in the area closest to the station grew the most, at a rate of 112.4%. It
seems clear that in this period, the proximity to the station had a positive impact on sales
prices
Median Residential Sale Price per Square Foot by
Distance from Sation (miles)
0
50
100
150
200
1989-1991 1998-2000 2006-2008
Year
Pri
ce i
n D
oll
ars 0.5
1.0
1.5
2.0
2+

104
Figure 5.10. Saco Percentage Increase of Median Sale Price Per Square Foot by Distance from
the Station
Source: Derived from assessor data collected from the City of Saco assessor’s database, 2009.
Although prices in the area closest to the station are still lower than those further
out, it seems clear that the train service has had a positive effect on an area that otherwise
could be lagging far behind the rest of the city.
The same process was used for Biddeford, but the results are different. One problem
with Biddeford is that the data for the half mile closest to the station is not reliable for the
first two time periods, due to the small number of sales that occurred in the area during
these times (see table 5.3 below). Therefore it is difficult to come to any solid conclusions
about prices in this half mile area.
Percentage Increase of Median Sale Price per
Square Foot by Distance from Station (miles)
0
20
40
60
80
100
120
1989-1991 to 1998-2000 1998-2000 to 2006-2008
Year
Perc
en
t ch
an
ge 0.5
1.0
1.5
2.0
2+

105
Table 5.3. Biddeford Number of Sales by Distance to the Train Station
Distance
(miles) 1989-1991 1998-2000 2006-2008
0.5 2 9 41
1 15 61 91
1.5 22 77 115
2 14 61 77
2+ 52 231 218
total 105 439 542
Source: Derived from assessor data obtained from the Biddeford Assessor’s Office, 2010.
However, a comparison of the other half mile rings is still possible. Figure 5.11 shows that
the median sales prices are similar to Saco in that they tend to increase the further from the
Figure 5.11. Biddeford Median Sales Price Per Square Foot by Distance from Station (miles)
Source: Derived from assessor data obtained from the Biddeford Assessor’s Office, 2010.
Note: Data for the half mile closest to the station is not accurate for 1989-1991 due to the low
number of sales during these years.
Median Sales Price Per Square Foot by Distance
From Station (miles)
0
50
100
150
200
1989-1990 1998-2000 2006-2008
Year
Me
dia
n P
ric
e P
er
Sq
ua
re F
oo
t 0.5
1
1.5
2
2+

106
station. This is the case for all three time periods. The percentage increase of median sales
prices does not offer quite the same results as Saco, however. Figure 5.12 shows how sales
prices for the one mile ring actually fell by 25% from pre-station announcement to post-
announcement but pre-service. Again the data for the half mile ring cannot be considered
accurate. What is also interesting is that sales prices for the area two miles or greater from
the station also fell slightly during this time period by 1%. The 1.5 and 2 mile areas saw
growth between 17% and 32%.
Figure 5.12. Biddeford Percentage Increase of Median Sales Price Per Square Foot by
Distance from Station (miles)
Source: Derived from assessor data obtained from the Biddeford Assessor’s Office, 2010.
Note: Growth rate for the area within a half mile of the station is not accurate for the 1989-
1991 – 1998-2000 period due to low number of sales in 1989-1991.
Growth in the period from post-announcement, pre-service, to post-service shows
that both the area within one mile of the station, and the area furthest from the station grew
Percentage Increase of Median Sale Price Per
Square Foot by Distance from Station (miles)
-40
-20
0
20
40
60
80
100
120
140
1989-1991 - 1998-2000 1998-2000 - 2006-2008
Year
Gro
wth
Ra
te
0.5
1
1.5
2
2+

107
the most (Figure 5.12). It is difficult to draw much from these conclusions on whether the
train impacted sales prices.
5.1.7. Discussion
Saco and Biddeford’s mills and main streets originally developed around the train service
that connected the cities to the region. Because of this the downtowns of both cities already
have many characteristics of transit-oriented development: density, a mix of uses, and a
pedestrian orientation. Today the redevelopment of the mills is again tied to the train
service, though this time the connection is not as strong. Redevelopment would have
occurred whether the train service was reinstated or not. However it seems as though the
service has had a positive impact on redevelopment efforts. Both cities have begun to
recognize this more and have integrated the station into its plans for both downtowns and
mill areas.
The prominent and accessible location of the station, and its function as a multi-use
space with waiting areas, offices, and a community room, have transformed the station into
a popular community space used throughout the day for much more than just boarding or
alighting a Downeaster train. While the area immediately surrounding the station does not
provide any community gathering space or act as a gateway to the community, the interior
does. Additionally, the wind turbine at the entrance to the station parking lot serves as a
visual reminder of the station, and can be seen from downtown Saco even when the station
itself is obscured from view.

108
As mentioned in the literature review and best planning practices, it is important for
transit-oriented development to be promoted throughout a region in order to support
transit use and each individual TOD. In Maine, two reports have been completed for the
Downeaster service. The first was commissioned by the Maine Department of
Transportation in 2005 and focuses on the economic impacts of the Downeaster service on
the state (EDRG 2005). The report notes benefits due to the train service such as increased
tourism and visitor spending, local investment around station areas, and state and local tax
revenues. Interviews were conducted with realtors and town and city staff to determine the
effect of the service on local real estate sales. Responses were mixed, from some realtors
stating there has been no impact, to city staff reporting that the train service has had a
positive effect on sales. Further, the study determined that because the train is not at a
commuter level of service, effects on land values would be less than in a metropolitan area
(EDRG 2005).
A second study conducted for the Northern New England Passenger Rail Authority
in 2008 focuses on the use of TOD to capitalize on the opportunities of expected enhanced
service on the Downeaster (CNT 2008). This study explains that small town main streets
with a passenger rail stop are “classic TODs,” and that in smaller communities TOD can be
expected to spread up to a mile from the station area, encompassing a large amount of
housing along with commercial uses. Property values in this area are assumed to have a
higher premium than those outside of the area due to the accessibility of goods and
transportation service. By planning for this type of development around stations,

109
communities will be able to attract and retain residents, create new jobs, and help residents
save on transportation costs due to less need and use of a car (CNT 2008).
This research shows that although the train service may have impacted property
values closest to the station, values in this area are still lower than in areas further from the
station. However the idea that a train station may have a wider geographical impact in a
small community than in a metropolitan area may be true in Saco and Biddeford, where
there are no other stations for miles around. This supports the need for adequate parking at
the station, as people may commute from neighboring towns by car to park and ride the
train. Saco and Biddeford have worked to make sure local buses also serve the station,
though service is limited to three communities. The addition of a zip car service at the train
station may help address the issue of access for those who live or want to travel further from
the station than the first half mile.
As discussed earlier, the level of train service provided makes a difference in how
much impact the service will have on the area surrounding the station. From the ridership
data, it appears that increased service, in the form of an added round trip per day and
revised scheduling, helped increase ridership. Amenities provided at the Saco station may
also have helped Saco maintain and increase ridership even when the service as a whole lost
ridership. More trains and shortened travel times would likely increase the impact felt on
Saco and Biddeford.

110
5.2. Pittsfield, Massachusetts
Pittsfield is the county seat of Berkshire County, Massachusetts, with a population at the
time of the 2000 U.S. Census of 45,793. Pittsfield has retained passenger rail service over the
years, and currently is a stop along Amtrak’s Lakeshore Limited, which runs one round trip
per day from Chicago to Boston. After years of discussion and planning, the Berkshire
Regional Transit Authority (BRTA) built the Intermodal Transportation Center (figure 5.13)
in downtown Pittsfield, which serves as the hub for BRTA’s local bus system as well as
intercity bus service and Amtrak (BRTA 2010). The center also houses the offices of the
BRTA, and has several commercial spaces.
Figure 5.13. Pittsfield’s Intermodal Transportation Center.
Source: Author.

111
5.2.1. Application of Planning Best Practices
5.2.1.1. The Planning Process. Pittsfield recently completed a new comprehensive Master
Plan for the city in 2009. The plan includes many recommendations for the downtown area
where the intermodal station is located, and also addresses public transportation needs in
the city. The plan has a large focus on making Pittsfield a more walkable and pedestrian
friendly city, and is closely aligned with a number of the best practices for transit-oriented
development. However the station does not figure prominently in the plan.
The public process for the Master Plan was extensive, and input was received
through a Master Plan committee, city officials, issue identification workshops held at
neighborhoods schools, two visioning sessions (one for the public and one for the business
community), a survey, three topic-specific workshops, stakeholder interviews from the arts,
tourism, economic development, and downtown business community, and a community
update meeting (City of Pittsfield 2009).
The city has been involved in implementing projects in the area surrounding the
station. Several major zoning changes have occurred in downtown. The Downtown Arts
Overlay District, adopted in 2005, was established to enhance vitality in downtown through
increasing housing opportunities and fostering arts-related development and activities,
encouraging greater pedestrian activity as part of a mix of residential, entertainment, retail
and business activities, and to encourage economic revitalization (Pittsfield 1973, Article 23-
3 Section 3.216). The Smart Growth Overlay District was adopted in 2008 and consists of
10.2 acres in the downtown. This district seeks to foster a range of housing opportunities in
the urban center for households of all incomes, ages, and sizes. The district incorporates

112
development standards and design standards to allow context-sensitive design, and also has
its own parking requirements and expedited permitting (Pittsfield 1973, Article 23-3 Section
3.215).
The city has also begun a Streetscape Project which focuses on the North Street
corridor. Improvements include new sidewalk treatments, special planting areas and trees,
new bump outs at crosswalks, new ornamental lighting, increased parking spaces, bike
racks, trash/recycle receptacles, and public art spaces. Phase I of the project was scheduled
to be completed in October 2009, with the second phase not yet scheduled. Designs for the
project include a focus area around the intermodal station showing new landscaping to
public spaces adjacent to the station. The designs also distinguish a ¼ mile radius from the
station, but it is unclear what the significance of the radius is (BSC Group and TerraSphere
2006).
5.2.1.2. Mix of Uses. The intermodal station falls within the Downtown Business District
(DBD), a high density area comprised of office, retail, and service uses that serve the city
and the greater region. High density housing is also allowed in the district. A General
Business District, comprised of businesses located along a major arterial, is also located in
the downtown area adjacent to the DBD. Surrounding these business districts are both high-
density multi-family residential neighborhoods, and high-density, one and two-family
residential areas.
The Downtown Arts Overlay District and the Smart Growth Overlay District cover
the central business area, including the intermodal station, and portions of the surrounding

113
residential areas. Both overlays encourage a mix of housing types and a mix of uses. Both
districts also require non-residential uses on the ground floor in certain areas, such as North
Street, therefore encouraging a vertical mixing of uses. The Arts Overlay specifically
encourages arts-related uses as well as residences, permitting arts and arts-related uses,
creative services, residential development, accessory apartments, and artist and/or creative
services live/work units. Uses permitted in underlying zoning districts are allowed except
for those that conflict with the purpose of the overlay, such as auto-oriented uses.
The Smart Growth Overlay District (SGOD) comprises approximately 11 acres of the
downtown area, and a developer may choose to use the overlay district or the underlying
zoning to develop a project. Uses allowed by right in the overlay are: multi-family (defined
as 4 or more units) developments; townhouses (2-3 units); mixed-use development,
providing that 75% is residential and the remaining uses are office, retail, services, and/or
restaurants. Other permitted uses are artist and/or creative services live/work units,
recreational uses, parking, and accessory uses. If a project falls within both the SGOD and
the Arts Overlay District, any use allowed with the arts district is also allowed. All other
uses are prohibited from the SGOD.
The SGOD is particularly focused on requiring affordable housing and a mix of
housing types that are appropriate to a wide range of incomes and household sizes and
types. A marketing plan showing that proposed housing units are appropriate for a diverse
range of households is required by project applicants. Additionally, any project proposing
more than 12 housing units must set aside at least 20% of units as affordable, subject to

114
monthly payment maximums and income restrictions. There are no waivers allowed to the
affordability requirements (Pittsfield 1973, Article 23-4, Section 4.321).
The 2009 Master Plan includes a recommendation to investigate the use of form
based codes, particularly in downtown. If implemented, form based codes would focus less
on the use of a building, but more on the size, scale, and shape of buildings. This type of
code would emphasize what the community wants downtown to look like, rather than
focusing on what uses are allowed or not allowed (City of Pittsfield 2009).
5.2.1.3. Density. There are no minimum density regulations in any of the districts
surrounding the intermodal station. Instead maximum densities are outlined for several of
the districts. The two residential districts have minimum lot sizes of 6,000 square feet, a
maximum building coverage of 50% of the lot, and a maximum height of 35 feet. The two
business districts are more flexible, with no minimum lot, setback, or lot coverage
requirements. Maximum height for the General Business District is 50 feet, while buildings
in the Downtown Business District cannot be higher than 180 feet.
Density regulations are presented for the Smart Growth Overlay District in terms of
dwelling units per acres, and are broken down into nine subzones within the district.
Maximum densities range from 20 to 50 dwelling units per acre, and maximum heights
range from 50 to 80 feet. There are no minimum height or density requirements. Four of the
nine subzones do not have setback requirements.

115
5.2.1.4. Connectivity and Mobility. One of the stated purposes of the Downtown Arts
Overlay District is to encourage greater pedestrian activity in downtown. The Arts Overlay
seeks to accomplish this goal through increasing residential uses and pedestrian-oriented
uses downtown. The Smart Growth Overlay District goes a step further in encouraging
pedestrians and bicyclists through design of the environment. Surface lots and parking
structures within the SGOD are required to provide pedestrian walkways and connections
to the sidewalk (Pittsfield 1973, Article 23-4 Section 4.321). Furthermore, several design
standards for the SGOD seek to create an internal transportation network within and
connecting each site that separates vehicular, pedestrian, and bike traffic. Following are
standards that specifically promote pedestrian and bicycle connectivity and mobility:
• Provide clear distinction between pedestrian and commercial traffic areas through
pavement markings or the use of different pavers;
• Where a development abuts a street without a sidewalk, it must propose a plan for
pedestrian walkways;
• Where sidewalks are in poor condition, an applicant is strongly encouraged to
propose improvements;
• Pedestrian access should connect to all building entrances and to local pedestrian
arteries;
• All developments should allow for possible future pedestrian and bicycle
connections with adjoining properties when appropriate; and
• Development in mixed use areas should provide continous sidewalks minimally
broken by curb cuts within the block. (City of Pittsfield 2008).

116
Two of the goals of the Downtown Streetscape Project are to improve pedestrian
safety, circulation, and comfort, and to incorporate traffic calming measures. Improvements
to help meet these goals include new sidewalk treatments, new bump outs at crosswalks,
and new pedestrian lighting. Providing more bicycle parking with new bike racks is also
listed as an improvement to be accomplished with the project (BSC Group and TerraSphere
2006).
Promoting pedestrian and bicycle connectivity and mobility comes up often in the
2009 Master Plan, and is supported by a number of recommendations. The plan states that
Pittsfield’s zoning should emphasize pedestrians over cars, placing a higher priority on
walking than currently exists in regulations. A “park once and walk-to-shop” mentality
should be promoted in neighborhood centers. New developments should be required to
connect to the city’s existing street grid and blocks should be kept short. Traffic calming
measures for both residential and activity centers are identified in several sections of the
plan, and include narrowing streets, allowing on-street parking, and installing medians. As
part of a Capital Improvements Program, sidewalks should be monitored for deficiencies
and problems resolved quickly, especially in the downtown. Pedestrian and bike
connections should be made between neighborhoods and activity centers, and the creation
of a city-wide bicycle and pedestrian plan is recommended. Overall that Master Plan
advocates for a walkable and bike friendly city (City of Pittsfield 2009).

117
5.2.1.5. Place-Making and Urban Design. Design standards were adopted in 2008 for the
Smart Growth Overlay District, and provide both regulatory and advisory standards. The
standards promote both a human-scaled and pedestrian-oriented environment and context-
sensitive infill, reflected in the stated purpose of the standards, which are “[…] to ensure
that renovation and new development will preserve and augment the SGOD’s architectural
qualities, historic character and pedestrian scale while promoting infill development,” (City
of Pittsfield 2008, p.1).
The design standards emphasize a reinforcement of the street line, as well as a
visually interesting streetscape for pedestrians. Building massing and setbacks should be
consistent with neighboring buildings in order to create a continual street wall and a sense
of space for the pedestrian on the sidewalk. Parking is not allowed in the front of buildings,
but should be placed on the side or rear. Curb cuts should be minimized within a block to
promote a continuous sidewalk with minimal crossings of vehicles and pedestrians (City of
Pittsfield 2008).
The emphasis on a consistent street wall is complemented by an equal focus on
creating an interesting streetscape for the pedestrian. Diverse materials and colors are
encouraged to allow for creativity in design. Windows covering 50-80 percent of the façade
are encouraged on ground floors to attract pedestrian interest and facilitate an indoor-
outdoor interaction. Uninterrupted street level façades longer than 40 feet, or 40 percent of
the length of the façade, whichever is shorter, is not allowed and must incorporate design
elements to break up the monotony. Additionally, any side of a building that faces a
118
sidewalk must incorporate windows, doors, or other signs of occupancy (City of Pittsfield
2008).
Although the SGOD Design Standards emphasize a human-scaled environment,
they only apply when a developer chooses to do a project under the SGOD zoning
regulations, rather than using underlying zoning. The 2009 Master Plan recommends
additional requirements that should be established for the downtown for all projects.
Design standards or form based code for downtown should be developed that establish
build to lines, rather than giving developers a choice of a setback. The Master Plan also
recommends requiring retail on the first floor, which is already required in certain areas
through zoning, but not throughout the downtown. Finally, in order to further create an
urban sense of place, a minimum height requirement should be adopted for buildings, in
addition to existing maximum height requirements (City of Pittsfield 2009).
As mentioned above, new buildings must conform to the massing and setbacks of
adjacent buildings. The style and design of an infill building must also be sensitive to,
and/or correspond with the style of surrounding “noteworthy” buildings. However
creativity is also encouraged, and the use of certain elements to complement, but not
necessarily copy, nearby buildings are recommended. Elements could include distinctive
entrances, windows, decorative facades, and awnings.
The design standards address open space both within a site and adjacent or nearby a
proposed project. Within a site, the standards emphasize that “Open space should serve as a
central organizing element within the overall site design to encourage public gathering of
groups of people and to promote a pedestrian friendly and visually appealing

119
environment,” (City of Pittsfield 2008, p.13). Open spaces can include both landscaped green
areas as well as plazas, and proposals must provide a maintenance plan for all open space
and common areas within the site. Streetscapes are also considered public space, and
mature street trees must be retained with any new development or redevelopment, and new
trees planted where appropriate. Proposed projects are also required to provide pedestrian-
scaled lighting on sidewalks where necessary, and may be required to provide benches near
retail and bus stops. Entrances to buildings are encouraged to be designed to provide shelter
from the elements for passersby. Finally, if a development is close to an existing public park
of open space, the applicant should propose enhancements for the space and provide
pedestrian connections to the open space (City of Pittsfield 2008).
The Downtown Streetscape Project includes improvements that will help make the
sidewalk a more attractive public space. In addition to improving the sidewalks, a number
of special planting areas have been identified for landscaping and trees, new ornamental
lighting will be installed, and benches, trash and recycling receptacles, and public art spaces
will be provided (BSC Group and TerraSphere 2006).
5.2.1.6. Station Location, Design, and Access. The station is located in downtown on the
corner of the “main street” in Pittsfield, North Street. The station does not appear to act as a
focal point, however. The building is set back from North Street due to the alignment of the
tracks that cross under North Street in front of the station. Instead a paved plaza fronts
North Street in front of the station. This could act as community gathering place and a
pleasant gateway into the city for those arriving from out of town. Currently the plaza is

120
drab, with no trees or plantings, and a bit run down (figure 5.14). Designs from the
Streetscape Project appear to show a re-landscaped plaza in front of the intermodal center
with trees, which would greatly improve the attractiveness of the space. A small plaza
located diagonally across North Street from the station is more inviting, with trees and a
wooden trellis. However this plaza also has some maintenance problems with broken steps
and pavement.
Pedestrians can access the station from North Street, where signalized crosswalks are
located at the intersection, and along the side street (Columbus Avenue) where a sidewalk
covered by a second floor overhang provides an outdoor waiting area protected from the
weather. There is pedestrian access from the rear of the property as well, marked with a sign
(figure 5.15). A sidewalk along the road at this entrance terminates shortly after, but a
crosswalk allows a pedestrian to continue to another sidewalk on the other side of the road.
Figure 5.14. The plaza in front of the station.
Source: Author.

121
It seems extra care was taken to make sure pedestrian access was accommodated from all
sides. Bike racks are also available in two places, one of which is covered.
An underground parking area is available for cars, eliminating the need for surface
parking surrounding the station. Buses enter the station from Columbus Avenue, and bus
bays are located at the rear of the building. The Amtrak platform is located one level below
the parking area, and stairs and an elevator are provided for passengers to access the
station.
There are commercial spaces within the station, but they cannot be seen from the
outside of the building, and the streetscape along the side of the building is not visually
interesting for a pedestrian. There is also a “no loitering” sign posted at the entrance to the
station, discouraging anyone who is not a transit patron or who does not have any specific
reason to be at the station should leave. Although likely a security measure, the sign
Figure 5.15. Pedestrian access from the rear of the
station. Source: Author.

122
discourages the space to be used as a community space. This is contrary to Saco, where local
employees from downtown sometimes spend their lunch hour in the station.
The 2009 Master Plan notes that according to the 2000 U.S. Census, 14% of residents
do not have access to a car, and most likely rely on walking and public transit. The
Berkshire Regional Transit Authority operates 10 bus routes that serve Pittsfield and the
intermodal station, the primary hub in the region for public transportation. In addition to
the local buses, Greyhound and Peter Pan both operate intercity bus lines from the station,
along with Amtrak’s Lakeshore Limited service (City of Pittsfield 2009).
According to the master plan survey, residents feel that transit in Pittsfield is very
limited due to the low level of service. Bus routes and trains run infrequently, and therefore
are not as convenient to use. The plan notes that this is largely dictated by state funding for
transit, which is limited. People expressed a desire for more long distance connections via
train to Boston and New York City. The plan suggests a number of strategies for improving
public transit in Pittsfield, such as lobbying the state for more funding, and establishing
public/private partnerships to provide shuttle service between businesses and activity
centers (City of Pittsfield 2009).
The plan also stresses the need to improve connections between Pittsfield and other
regional centers such as Albany, Springfield, Boston, and New York City, with reliable and
regular service via Amtrak, air, or bus. These connections are necessary to help bring about
economic revitalization in the City. “Economic revitalization requires connections to the
regional, national and global economy. Pittsfield must push for ways to improve
connections to the greater system,” (City of Pittsfield 2009, p.145). The plan also notes that
123
an improved public transit system would help boost downtown revitalization (City of
Pittsfield 2009).
5.2.1.8. Parking. Within the Arts Overlay District, off-street parking can be provided
through on site spaces located to the side or rear of a building, or through off-site spaces by
contract in a public or private parking facility within 800 feet of the site. Retail, service, or
eating establishments under 5000 sq. ft. in existing buildings are not required to provide
parking unless it is a building greater than 10,000 square feet that is undergoing
redevelopment (City of Pittsfield 1973, Article 23-4 Section 4.320).
The Smart Growth Overlay District has its own set of parking requirements that
override the requirements for underlying districts. The zoning ordinance states that “The
purpose of these parking requirements is to encourage the use of public transportation and
to make downtown Pittsfield more pedestrian-friendly,” (City of Pittsfield 1973, Article 23-4
Section 4.321). One off-street parking space per dwelling unit located within 800 feet of the
property is required. The underlying zoning requires one space per dwelling unit for single
and two family homes, and one and a half spaces per unit for multi-family structures.
Presumably many of the structures in the SGOD will be multi-family due to the density and
nature of the area, and so the SGOD requirements do present a reduction in the number of
parking spaces required. However all non-residential uses must continue to comply with
the regular parking requirements.
Within the SGOD there are a number of factors the approving board will consider
for reducing the required number of spaces for a development. Shared parking may be

124
approved and an applicant is encouraged to use public parking facilities in downtown if
they are available. The availability of on-street and off-street parking within the vicinity of
the site, and the proximity of a site to a bus stop or other public transit station is also a
consideration. The characteristics of the residents who are likely to live in the development
will also be considered in reducing the number of required spaces. Finally, if a reduction in
parking spaces is likely to encourage the use of public transportation or allow the proposed
development to be more pedestrian friendly, a reduction may be approved (City of Pittsfield
1973, Article 23-4 Section 4.321).
The 2009 Master Plan recommends that a downtown parking management study be
conducted to determine existing conditions and what changes need to be made to
accommodate existing and future parking demands. At present, there are two parking
garages and four off-street lots downtown intended to serve the commercial district. The
plan makes further recommendations to require shared parking, rather than just
encouraging it, and to reduce or eliminate minimum parking requirements downtown. The
creation of parking districts which would allow the use of any space within the district by
businesses and residents in that district, was one management strategy suggested. Overall
the master plan stressed the need to manage parking in the downtown to both achieve the
community’s vision to become more pedestrian friendly, and to support ongoing
revitalization (City of Pittsfield 2009).
5.1.2.9. Market Considerations. The 2009 Master Plan discusses economic development in
terms of the city, and the region, as a whole. There is no specific focus on downtown.

125
However one recommendation focuses on downtown and the need to strengthen it “[…] as
a pedestrian friendly, vibrant, mixed-use urban place,” (City of Pittsfield 2009, p.107). In
order to accomplish this, the plan suggests unifying the zoning in downtown, which
currently consists of numerous underlying zones and two overlay zones, establishing design
standards, and eliminating auto-oriented uses. Additionally, investigating the creation of a
Business Improvement District (BID), where property owners agree to pay a higher tax that
can then be used towards improvements in the district, is also suggested. Finally, according
to the master plan survey, there is a perception that downtown is unsafe. The plan suggest
creating a public safety and visitor assistance program to create a safe, friendly atmosphere
(City of Pittsfield 2009).
5.2.2. Ridership
Amtrak ridership numbers collected from the Massachusetts Department of Transportation
for fiscal year 1999 through 2009 show that the Pittsfield station has increased its ridership
in recent years (Table 5.4). The total increase in ridership from 1999 to 2009 was 3,288, a
96.4% increase. Ridership actually fell from 2000 to 2003, where it bottomed out at 3,108.
This could have been due to construction of the intermodal station, which opened in
November of 2004. However the length of construction is unknown. Ridership did increase
by 27.4% from 3,722 to 4,743 in 2005, the first full year the station was open and operational.
Ridership has continued to increase since 2003, with a high reached in 2008 of 6,893
boardings and alightings. Ridership decreased slightly in FY 2009 to 6,700.

126
Table 5.4. Amtrak Ridership (total boardings and alightings) at Pittsfield Station, FY 1999 to
FY 2009
Fiscal Year Total Ridership % change
1999 3412
2000 4443 30.2
2001 3214 -27.7
2002 3179 -1.1
2003 3108 -2.2
2004 3722 19.8
2005 4743 27.4
2006 4750 0.1
2007 5311 11.8
2008 6893 29.8
2009 6700 -2.8
Change 1999 -
2009 3288 96.4
Source: Massachusetts Department of Transportation 2010.
5.2.3. Discussion
Recent zoning changes, design guidelines, and the streetscape project downtown, are
measures the city has taken that largely follow the best practices for transit-oriented
development. The recent Master Plan also aligns closely with many of the best practices, and
implementation of the plan will help the city move forward in becoming more pedestrian
and bicycle friendly. These measures are part of an effort to revitalize the downtown and to
provide an array of housing types for all incomes, and are not tied specifically to transit.
According to the Master Plan, transit plays a minimal role in Pittsfield. However the Master
Plan survey shows that there is a demand for more frequent service and better connections
to other regional destinations. The growing ridership of the Lakeshore Limited supports this

127
finding, despite the fact that the service has not changed over the last ten years. If passenger
rail service were to run more frequently, it would likely attract more riders, and would have
a larger impact on the area surrounding the station as more people would be drawn to the
station area.
One thing that has changed is the construction of the intermodal station, which
provides amenities for transit patrons. While the station is an asset, much could be
improved to make the station more of a focal point for the community, and an attractive
gateway to the downtown. Currently the building looks more like an office building (it is
used for offices, so this makes sense and may have been the goal of the project), and the
plaza outside needs updating. Possibly in the future the commercial uses within the
building could occupy the side along Columbus Avenue, allowing entrance from within the
station and the sidewalk. This may liven up the streetscape and help attract tenants as they
would have added visibility to passersby who are not necessarily using the station. The
accommodation of pedestrian access on all sides of the station is commendable, as well as
placing parking underground.
It is difficult to determine what impacts the passenger rail service has had on the
area surrounding the station. Likely the impact is minimal. But the city has been planning
and implementing improvements that will encourage and allow transit oriented
development and redevelopment to occur if and when transit service improves.

128
5.3. Rutland, Vermont
The city of Rutland Vermont is located in Rutland County and had a population of 17,292 at
the time of the 2000 U.S. Census. The city acts as a regional center for services, shopping,
culture, and entertainment, and benefits from tourists visiting the nearby Killington ski
resort area. Passenger rail service to the city was discontinued in 1953, and by 1964 the
downtown station was demolished. Service was reinstated in 1996, and a new station was
built in 1999 with the capacity for ticketing services and baggage checking (City of Rutland
2009). However there is currently no ticketing or baggage check available at the station
(Amtrak website 2010). The Ethan Allen Express runs one round trip per day between
Rutland and New York City. The service is subsidized by the state of Vermont (Amtrak
website 2010).
5.3.1. Application of Planning Best Practices
5.3.1.1. The Planning Process. In 1992 the Rutland Downtown Redevelopment Plan was adopted
as a strategy for revitalizing the downtown commercial area. The plan is an attempt to
reverse the decline of Rutland’s role as a retail center due to suburban flight. The plan was
created before the reinstatement of passenger rail, and does not mention the possibility for
future passenger rail service or the development of a station within the plan (City of
Rutland, 1992).
In 2005 the city completed another redevelopment plan, this time focusing on the
relocation of the Rutland rail yard away from downtown to parcels located on the border of

129
the city. The plan is intended to both revitalize the existing rail yard area by freeing up the
area for new commercial and industrial development, and to create opportunities for new
industrial uses desiring rail connections at the new rail yard (City of Rutland 2005). The
focus is solely on freight rail, and development that may support passenger rail is not
discussed.
The City’s most recent plan is a Master Plan, completed in 2009. The passenger rail
service is mentioned in the beginning of the plan in the historical context section: “Passenger
rail was reinstituted in 1996 and its preservation is considered a top priority,” (City of
Rutland 2009, p.2). It is noted in several other areas of the plan that efforts to retain
passenger rail service and extend it to Burlington and along the western side of Vermont are
supported by the City. However the station itself does not figure prominently in any
discussions of proposed projects and land use changes in downtown, and any opportunities
the station and service might bring to the area are not considered.
The public process for both redevelopment plans is not made clear. The plans were
approved by the Planning Commission, the Rutland Redevelopment Authority, and by
voters (City of Rutland 1992, 2005). The 2009 Master Plan is an update of a 2002 plan. Public
hearings were required by the Planning Commission and the Board of Alderman before
approving the plan. The plan relies on projects already identified as priorities within the
community rather than creating new goals and objectives. According to the plan, all of the
projects included within it have involved public meetings or “intensive municipal review,”
and have the support of appropriate city departments, agencies, and neighborhood
organizations (City of Rutland 2009).

130
The city has taken a role in implementing changes to the downtown. In 1989 it
established the Rutland Redevelopment Authority, which then created a special assessment
district in the downtown to finance streetscape improvements and marketing efforts.
Parking and traffic studies were also completed at this time (City of Rutland 1992). All three
plans mention creating new streets and connecting existing ones in the downtown,
particularly when the rail yard is relocated. Both redevelopment plans anticipate private
redevelopment of most properties, while the city will contribute with improvements to
infrastructure such as utilities, street and sidewalk improvements, public spaces, pedestrian
facilities and parking. The Downtown Redevelopment Plan and the Master Plan both state
the desire to expedite permitting in the downtown, but this has not yet been implemented.
5.3.1.2. Mix of Uses. The Train station falls within the Downtown Business District, which
allows residential and a large number of business uses by right. Surrounding this district is
an array of zones ranging from Industrial, which allows all uses, to Mixed Use Residential,
which despite the is largely meant to be a residential district with limited business uses
allowed with a special permit. In between, the remaining districts allow a mix of residential,
commercial, and public uses with varying dimensional requirements. Multi-family and
single family housing is allowed in each district by right (City of Rutland 1996, Article 3
Sections 31-301 through 31-317).
Increasing the amount of people who live in the downtown does not appear to be a
large goal of the city, based on a review of the three plans mentioned above. In the 1992
Downtown Redevelopment Plan, commercial and office uses are recommended as preferred

131
projects downtown, without any mention of residential uses. Similarly, the Rutland
Railyard Redevelopment Plan of 2005 notes that the parcels included in the study area
within the downtown would be best suited for office and retail uses. The 2009 Master Plan
does state however that the city’s diverse population requires an array of housing options.
According to the plan, the Mixed Residential District and the rehabilitation of upper stories
in buildings downtown is meant to increase the city’s rental stock (City of Rutland 2009).
5.3.1.3. Density. There are no maximum density requirements. Minimum dimensional
requirements in terms of lot sizes range from 5,000 square feet to 10,000 square feet in the
districts within a half mile of the station (City of Rutland 1996, Article 3 Sections 31-301
through 31-317).
5.3.1.4. Connectivity and Mobility. All three plans seek to increase mobility for pedestrians
and bicyclists through various projects to better connect neighborhoods to the downtown
and to make downtown pedestrian friendly. However the plans are also equally and at
times more interested in efficient vehicular flow and access to commercial areas.
The Rutland Downtown Redevelopment Plan (1992) calls for the creation of new
streets to connect the downtown to residential neighborhoods in the south and southwest
that are separated from downtown by railroad tracks. The plan also recommends creating
pedestrian linkages within the downtown and connecting to surrounding neighborhoods.
The creation of a pocket park at the edge of downtown and a neighborhood is suggested
that would provide pedestrian and bike access to a larger park and the downtown. A recent
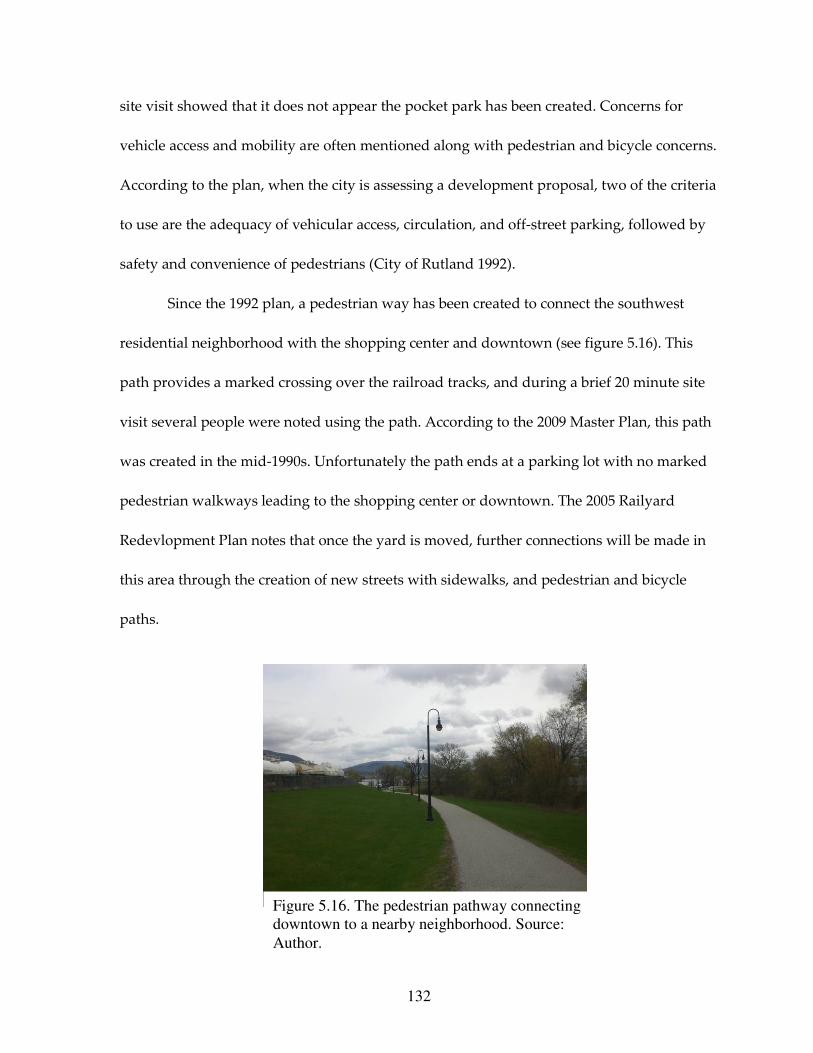
132
site visit showed that it does not appear the pocket park has been created. Concerns for
vehicle access and mobility are often mentioned along with pedestrian and bicycle concerns.
According to the plan, when the city is assessing a development proposal, two of the criteria
to use are the adequacy of vehicular access, circulation, and off-street parking, followed by
safety and convenience of pedestrians (City of Rutland 1992).
Since the 1992 plan, a pedestrian way has been created to connect the southwest
residential neighborhood with the shopping center and downtown (see figure 5.16). This
path provides a marked crossing over the railroad tracks, and during a brief 20 minute site
visit several people were noted using the path. According to the 2009 Master Plan, this path
was created in the mid-1990s. Unfortunately the path ends at a parking lot with no marked
pedestrian walkways leading to the shopping center or downtown. The 2005 Railyard
Redevlopment Plan notes that once the yard is moved, further connections will be made in
this area through the creation of new streets with sidewalks, and pedestrian and bicycle
paths.
Figure 5.16. The pedestrian pathway connecting
downtown to a nearby neighborhood. Source:
Author.

133
Both the rail yard plan and the Master Plan discuss the creation of a new connector
road to be built from the new rail yard on the edge of town to downtown. The road will
include a bike lane and will have limited curb cuts. It is meant to “streamline transportation
access,” to the downtown (City of Rutland 2009, p.5). The Master Plan further recommends
the creation of bike paths throughout the city, stating “The City should have a strategy for
creation of trails and bike paths to circle the city and have multiple spokes into Downtown.
Such facilities are popular for recreation and, if properly routed, can ease congestion by
providing a viable alternate means of transportation,” (p.13). The plan notes that the
Department of Public Works created a bicycle plan in 2000, but it is unclear how much of
that plan has been implemented.
5.3.1.5. Place-Making and Urban Design. Within the city’s Zoning Ordinance, a number of
Design Control Districts are designated, including the Downtown Business District,
Courthouse District, Main Street Park District, and all Gateway Districts. All exterior
development of modifications in these districts are reviewed by a Development Review
Board, except for the downtown, which is controlled by separate regulations and a separate
review board that came out of the 1992 Downtown Redevelopment Plan.
For the other districts, the zoning prescribes general design criteria that apply to all
of the Design Control Districts. The criteria are focused on infill and modification that are
compatible to surrounding structures, as well as creating a more pedestrian friendly
atmosphere. Additions, alterations, and new construction must be compatible with

134
surrounding buildings in footprint, height, setback, roof shapes, fenestration, and exterior
materials. Parking should be located on the side or rear and should be secondary and
unobtrusive. Curb cuts should be limited to one per parcel, and shared driveways are
encouraged (City of Rutland 1996, Article 3 Sections 31-303, 31-304, 31-305, 31-306, 31-307,
31-308, 31-309, 31-310, 31-312, 31-313).
The Downtown Redevelopment Area Architectural and Design Guidelines also place
an emphasis on context sensitive infill, with the intent that “new buildings contribute to a
coherent environment downtown consistent with the best qualities of existing buildings,”
(City of Rutland 1993, p.1). However imitation is not necessarily desired, and contemporary
designs are encouraged. The context of a specific proposed structure will be used to judge
its acceptability. The context could range from the open rail yard area within the district, to
the traditional street grid of the late 19th century building blocks.
The sense of place the guidelines are aiming for is expressly commercial in nature.
The guidelines state “New structures should be designed to […] maintain the tone of a
practical, working city,” (p.2). Further, one of the specific design objectives of the guidelines
emphasizes that “The primary function of a commercial building is to provide a good
environment for commerce,” (p.3). The design of buildings should encourage customer
traffic and public interaction. While the goal is commerce, specific criteria also promote a
pedestrian-oriented public space. Buildings must relate “constructively” to public spaces
such as streets and parks, and pedestrians (as well as motorists) must be able to clearly
distinguish the purpose of the building and how to gain access to the building. Long
windowless walls fronting on a public street or space must incorporate design elements or

135
landscaping that breaks up the visual expanse of the wall, creating a more visually
interesting streetscape. Additionally, mirrored or heavily tinted windows are not allowed
on the ground floor (City of Rutland 1993).
While all other Design Control Districts relegate parking to the side or rear, the
Downtown Redevelopment Area guidelines do not make this requirement. This may be due
to the fact that at the time the downtown shopping plaza with its large parking lot located in
front of the stores already existed. The guidelines merely dictate that large parking lots must
be landscaped, noting “While it is essential that large parking areas be included to ensure
the commercial viability of the area, these parking fields must be visually compatible with
surrounding buildings and public spaces,” (p.4). However the guidelines do not specify
how a parking area could become compatible, just that it must be “reasonably landscaped,”
(p.4). In this instance commerce seems to trump sense of place in the downtown.
The Downtown Redevelopment Plan, which directly preceded the design guidelines,
recommends the creation of a public park in the downtown, to be a combination of green
spaces and paved plazas. The focus continues to be on commerce, as the purpose of the park
is to increase commercial activity and draw visitors to downtown. The plan also
recommends the creation of a pocket park adjacent to downtown, which would be primarily
for the enjoyment of residents (City of Rutland 1992).
The 2009 Master Plan continues to focus on downtown as center for commercial
activity, but begins to also see it as a cultural and community space. The plan also supports
an “open air” space in downtown, claiming that “[…] a basic ‘open air’ infrastructure does
not exist to support a social and economic synergy,” (p.4). The plan states that by creating a

136
system of linked open spaces, “[…] the city hopes to create a center point for downtown
Rutland’s cultural, community, and most importantly, commercial life,” (p.4). The plan does
not go into detail about what improvements would be completed or where, and there is no
mention of the train station.
A recent site visit revealed that Depot Park, located at the edge of the shopping plaza
and directly across the street from numerous commercial blocks in the center of downtown,
is used for a weekly farmers market, and potentially other outdoor events. The older section
of downtown opposite the shopping plaza is very pedestrian-oriented, with wide sidewalks,
well defined street edges, and first floor retail shops. Some sidewalks in downtown could
potentially be used for outdoor cafes, and it appears that new street trees have been planted
in recent years (figure 5.17). Pedestrian scale lighting is placed throughout the downtown,
Figure 5.17. Pedestrian-oriented
downtown, with new street trees.
Source: Author.
Figure 5.18. The large surface parking lot in
front of the shopping plaza. Source: Author.

137
and despite the large parking lot fronting on Merchants Row, landscaping and a pedestrian
walkway helps to define the street edge and retain a human scale. The pedestrian scale
quickly diminishes once beyond the landscaping and into the parking lot (figure 5.18). The
area adjacent to the shopping plaza on the northwest, behind Depot Park and in front of the
train station is a concrete wasteland with little to distinguish vehicle traffic flow, let alone
pedestrian flow. This area will be discussed in more detail below.
5.3.1.6. Station Location, Design, and Access. The train station is located directly in
downtown. However it is not in a prominent location, and is instead located to the side, and
behind, the shopping center (figures 5.19 and 5.20). It does not act as a focal point, partially
hidden by Walmart, and is surrounded by pavement. There is no landscaping in front of the
station, and no pedestrian pathways leading up to it. The ironically named Depot Park is
more connected to the shopping center than to the station, as they are separated by a wide
Figure 5.19. The Rutland train station.
Source: Author.
Figure 5.20. View from the station
looking towards downtown. The
shopping center is to the right. Source:
Author.

138
swath of pavement. The station does not have a sign, although there are two roadway signs
on Merchants Row pointing motorists in the right direction.
The 2009 Master Plan states that “Passenger rail facilities are located where they
have efficient access to highways and the public transportation network, and provide safe
pedestrian and bicycle access,” (P.24) Safe routes for pedestrians is debatable, as there is no
designated pedestrian route leading from downtown or the shopping center to the station.
The pedestrian pathway connecting the southwest neighborhood to downtown terminates
at the station, providing access from that side. The local bus serves the station, and also
provides a shuttle service from the station to the nearby Killington resort and ski area (City
of Rutland 2009). The Master Plan does not consider any improvements to the area
immediately surrounding the station. Although the Master Plan does emphasize improving
the aesthetics of the gateways into the city, the train station is not considered a gateway. The
gateways are the major roads that lead into downtown (City of Rutland 2009).
5.3.1.7. Parking. According to Rutland’s Zoning Ordinance, the downtown is a regulated
parking zone, but the ordinance does not go into detail as to how it is managed (City of
Rutland 1996). According to the design guidelines for downtown, shared parking, satellite
parking and public transit will be considered when setting requirements for a project.
However there is an emphasis on accommodating all users sufficiently on-site or in a
dedicated off-site location, and on-street parking for the use is not allowed to spill over onto
surrounding streets (City of Rutland 1993). The 1992 Downtown Redevelopment Plan
mentions a parking garage, and one is shown on the maps, adjacent to the shopping plaza

139
and in front of where the train station now stands. However the structure is no longer there,
and has been replaced by surface parking.
The 2009 Master Plan states “The City shall provide parking at a level it judges
advantageous for growth of commerce […] At the same time, it is recognized that control of
the parking supply is integral to any effective strategy to encourage a shift to alternative
transportation modes,” (p.41-42). Consistent with state legislation, the city may waive
parking requirements when employers issue transit passes or free public transit is available.
However the city may still require spaces to accommodate tenants and customers,
displaying some reluctance to make a commitment to reducing parking standards (City of
Rutland 2009).
5.3.1.8. Market Considerations. It is not clear whether the recommendations in the1992
Downtown Redevelopment Plan, or the 2009 Master Plan are based on a market analysis.
The Downtown Redevelopment Plan outlines preferred redevelopment projects within the
shopping plaza and downtown commercial blocks. Most are commercial and office uses,
such as a supermarket, multiplex theater complex, and a large office building. The 2005
Rutland Railyard Redevelopment Plan does incorporate a market study, but it is “prepared
from the point of view of an industrial client looking to invest in a new [freight] rail served
facility,” (p.1). The focus is therefore on industrial uses, and the parcels closest to
downtown, designated as unsuitable for industrial uses, are simply recommended for retail
or office use without any further detail.

140
The 2009 Master Plan states that “The ability of a development to enhance job
opportunities should always be given priority consideration,” (p.23). Since the 1992
redevelopment plan, the focus downtown continues to be commercial in nature, but detail
in the most recent Master Plan is lacking on exactly what types of businesses are desired
and feasible.
5.3.2. Ridership
Ridership data (total alightings and boardings) is available from Amtrak for the Rutland
station for 2008 and 2009 only. In 2008 16,732 people boarded or alighted the train in
Rutland, the highest number out of all stations in Vermont, including those on the Amtrak
Vermonter route. Total ridership on the Ethan Allen Express for 2008 was 46,881, an
increase of 2,939 over the 2007 total ridership of 43,942. In 2009, ridership in Rutland
declined to 14,818, a difference of 1,914 passengers from 2008. Total ridership on the Ethan
Allen remained relatively stable, at 46,748 (Amtrak 2008, 2009). From this limited amount of
data it is difficult to draw conclusions. However it seems as though ridership along the
entire route has increased at least since 2007, and that Rutland is a major stop for train
travelers in Vermont.
5.3.3. Discussion
At the end of 2009, the fate of the Ethan Allen Express service was uncertain, as the
Vermont governor proposed replacing the train with a bus service, potentially saving the
141
state $1.4 million (Hirschfeld and Peters 2009). However an outpouring of public support
for the rail service forced state officials to rethink the cut. Supporters of the rail see it as an
“economic boon,” and “vital to the community,” (Hirschfeld and Peters 2009, Hirschfeld
2009). Tourism is specifically mentioned in a Rutland Herald newspaper article as one sector
that benefits from the service (Hirschfeld 2009). The train’s role in helping businesses recruit
employees to the area is also noted as positive impact of the service (Hirschfeld and Peters
2009). A petition signed by 1,300 Vermont residents who support the rail and did not want
to see it cut helped sway state leaders (Hirschfeld 2009). The state is now re-applying for $70
million in federal stimulus funds that it was not awarded in the first round of grants to
improve tracks between Rutland and Burlington in order to extend the Ethan Allen service
to the state’s capital. It is believed that extending service to Burlington will increase
ridership and help make the service more economically viable (Hirschfeld 2009, Hirschfeld
2010).
Residents and businesses in Rutland appear to support the train, and see it as a
benefit to the local economy. Extended and improved service would likely increase
ridership and the convenience of the service. There is much the city of Rutland could do
now to take advantage of the current and future service that would benefit the city and
potentially increase ridership. The station’s location in close proximity to downtown and
dense residential neighborhoods offers much potential. The station itself should be
developed as a gateway area, and improvements to the approach to the station from
downtown for pedestrians, bicyclists, and motorists could help make it stand out from the
shopping center looming to its side. The wide expanse of pavement located in front of the

142
station could be landscaped into an extension of Depot Park, creating the “open air”
infrastructure the city desires. Remaining vacant land nearby could potentially be
developed into mixed use buildings that include residential units, or a parking garage with
ground floor retail. The city should develop a market analysis for the area surrounding the
station to determine exactly what uses would be viable as well as transit-supportive. The
current focus solely on commercial and industrial uses could shift to include residential as
well.
While public support has been vital to the survival of the Ethan Allen, more must be
done if it is to remain viable into the future. A time will come when the state of Vermont
will no longer be able to continue to pay for the service if the subsidy becomes too large.
Cities along the route such as Rutland could begin to support the service by treating the
train station as a focal point that must be supported by surrounding uses. It is not enough to
just build a station. The station must become an integral part of discussions and planning
for the downtown area.

143
CHAPTER 6
ANALYSIS AND FINDINGS
The analysis will first consider what best planning practices derived from the literature have
been applied or not applied in each case study. Then broader findings will be discussed that
compare the differences between TOD in a large metropolitan area, represented by the best
planning practices, and TOD in a small city or town located in a rural area. Based on the
research in this thesis, the best planning practices are modified to be more applicable to a
small town or city.
6.1. Analysis of the Application of Planning Best Practices
This section will present a summary of how the four case study cities applied the transit-
oriented development best planning practices discussed in Section 4. A summary matrix of
each city and how it applied or did not apply each best practice is included in the
appendices, along with a table that provides a count of how many case studies employed
each best practice, and to what extent.
6.1.1. Planning Process
Three out of the four case studies have plans that focus specifically on the area surrounding
the train station. These plans were developed for the downtown, and in the case of
Biddeford, also for the mill district bordering the downtown. The reinstatement of rail or the

144
development of the station, however, was not the reason for creating any of the plans. The
plans were meant to aid in the revitalization and redevelopment of the area. In Saco and
Biddeford, the Downeaster train service and the station figure into plans for the downtown,
Saco Island, and the Mill District, but was not the main focus of the plans. The train is seen
as a way to help market the area and aid in redevelopment, and connections and access to
the station is the most common topic discussed concerning the station. Biddeford’s 2009 Mill
District Master Plan incorporates elements from a charrette that was conducted as part of a
conference on transit-oriented development. Although the theme of the charrette was TOD,
the theme does not translate into the plan, which does not call TOD by its name but does
use many of the principles of TOD for the basis of the plan.
Three out of four case studies incorporated extensive public participation processes
into their plans. Rutland’s public participation process was less clear. All case study
municipalities had taken a role in implementing projects that would help capitalize on the
transit investment, whether that was the intent or not. All case studies have implemented
streetscape improvements, which appear to be ongoing in most cases. Major zoning changes
occurred in three of the four cities, and Tax Increment Financing and special assessment
districts were also used in three of the four case studies. The city of Saco raised all of the
money for the construction of the station without any outside funding. Expedited
permitting was less common, with only Pittsfield utilizing this tool for the downtown.
6.1.2. Mix of Uses

145
A mix of uses is allowed for all of the case studies, and three of four case studies have
zoning in place that specifically encourages a mix of uses. Biddeford and Pittsfield also
specify for certain areas that vertical mixing of uses is desired, especially through provisions
that require non-residential uses on the ground floor. All four case studies have vertical
mixed use buildings in the area surrounding the station, however. It was also found that all
four cities encourage a mix of housing types in zoning districts close to the station.
Pittsfield’s Smart Growth Overlay District (SGOD) is designed to encourage a variety of
housing choices, and requires affordable housing for larger projects. Biddeford’s Mill
District also encourages a mix of housing and a Hope VI affordable housing project is
currently under way.
6.1.3. Density
None of the case studies use minimum density requirements, though Biddeford does have a
minimum height requirement of two stories in the downtown and Mill District. Instead
most had dimensional requirements in place that are meant to control and limit density.
Pittsfield prescribes maximum density requirements, measured by units per acre, for the
SGOD. Minimum lot sizes and maximum height requirements are used in two cases. While
some of the dimensional requirements allow for relatively dense development, there are no
guarantees that dense development will occur. The idea of actually requiring a certain level
of density is not reflected in the zoning of these cities.
6.1.4. Connectivity and Mobility

146
All four case studies demonstrate a desire to increase pedestrian connectivity and mobility,
either through zoning, plans, or projects being undertaken. Sidewalks are a large focus, as
well as ensuring that parking lots include pedestrian paths that lead to building entrances
and sidewalks. Despite the built out nature of many of the transit districts in these cities,
three of the case studies also address block size and street connectivity. Saco may require a
pedestrian easement through any block longer than 800 feet, and Pittsfield’s Master Plan
recommends requiring all new streets to be connected to the street grid, and for blocks to be
short. The relocation of the rail yard in Rutland offers the largest new development potential
out of any case study site, and plans are to connect streets that are currently cut off by the
rail road tracks. Pittsfield and Rutland are both interested in increasing the amount of bike
paths in each city.
6.1.5. Place-Making and Urban Design
All four cities have design guidelines in place for the area surrounding the station. In
Pittsfield, the guidelines are limited to an overlay district in which a developer can choose
whether to follow the underlying zoning or the overlay zoning. However the Pittsfield
Master Plan recommends the use of form based codes in the downtown, which would
dictate what development should look like more than the existing zoning. The design
guidelines all help to promote a pedestrian-oriented, human-scaled environment, through
limiting or eliminating setbacks, requiring a visually interesting streetscape with windows
and architectural features breaking up long walls, and relegating parking to the side or rear
of buildings. The one exception to the parking standard is Rutland, which does not require

147
parking to be located in the side or rear. This is likely due to the large parking lot already
located in front of the shopping plaza in downtown, and although the edges of the parking
lot are well-landscaped, the human-scaled environment breaks down in this section of the
downtown.
The main intent behind the design guidelines is to ensure that new development or
redevelopment is compatible to the existing neighborhood. Two of the design standards
focus on massing and setbacks, and state that style does not need to imitate existing
buildings. Most of the cities also have existing or planned public spaces in the area
surrounding the station. All have tree-lined sidewalks, and small parks and plazas are
common. The exception is Saco, where aside from sidewalks there is little public open space
in the downtown and surrounding the station. However the station itself acts as a
community gathering place, where people come to eat lunch, play cards, or hold meetings
in the conference room. The Rutland and Pittsfield stations do not appear to function in a
similar way.
6.1.6. Station Location, Design, and Access
While the literature talks about stations acting as a focal point for community activity and a
gateway to the city, the three stations looked at in this research did not act in this role. The
location of the Saco train station comes closest to acting as a focal point, and is located in a
place where activity might eventually develop around it. Its location directly in between
two downtowns, and on an island with mill buildings currently under redevelopment,
offers much potential. The wind turbine that towers above the entrance to the station from
148
Main Street can be seen from both downtowns, a constant reminder of the stations presence.
Currently the area immediately adjacent to the station is not developed and not full of
activity, but there is potential for the future.
Both the Pittsfield and Rutland stations are located right in downtown, but neither
seem to act as a focal point. Both are set back from the activity, and do not command a
presence that draws attention. Additionally, both cities talk about improving the gateways
that lead into each city, but neither identify their train stations as a gateway. The gateways
are identified as main arterials leading into the downtown. The fact that the frequency of the
train in Pittsfield and Rutland is only twice a day may make a difference in how the station
is viewed. With only two times during the day when people will be using the station, it is
not surprising that it is not considered more of an activity center. In Pittsfield however the
station is also used for office and commercial space, and for the local bus service.
Improvements are planned that hopefully will create a more inviting space in and around
the station.
Access for pedestrians to stations was generally very good in three out of the four
cities. Separate paths for pedestrians exist, and more are planned, for the Saco station. The
Pittsfield station also provides a separate entrance for pedestrians at the rear of the station
site. Rutland provides a path from one side of the station. Unfortunately the front entrance
to the station, facing the downtown, is a see of pavement that is used both for parking and
as a road leading to and from the adjacent shopping center. The lack of a designated
walkway greatly diminishes the ease of access for a pedestrian. Local buses serve all of the
stations.

149
6.1.7. Parking
All of the case studies allow reductions in parking requirements in the area surrounding the
station. In the cases of Saco and Pittsfield, parking requirements are simply reduced for the
downtown area, and can be further reduced under certain circumstances. Biddeford and
Rutland do not start out with lower requirements for the downtown, but allow for waivers
of requirements. Typically waivers are considered for shared parking, the use of off-street
and on-street public parking, and the availability of transit. Biddeford and Saco are both
looking into developing parking structures in the future to further accommodate an
increased demand for parking as redevelopment progresses. In the meantime surface
parking is accommodating parking needs. Downtown Pittsfield already has several parking
garages. Rutland had a garage adjacent to where the station now stands, but it has been
removed and replaced with surface parking.
6.1.8. Market Considerations
Saco and Biddeford both incorporate market studies into their plans, though a market study
for Saco Island has not been updated since 1998. Neither Pittsfield nor Rutland appear to
have incorporated a market study for the downtown area into their plans.
6.1.9. Discussion
The small cities studied in this research largely followed the transit-oriented development
planning best practices derived from TOD literature. There are several major differences,

150
however. While most of the case studies employ many of the best practices when planning
for the area surrounding a station, they do so for other reasons than trying to capitalize on
the passenger rail service. The context of these planning efforts are the revitalization of
downtowns, where the stations are located, and the redevelopment of industrial areas such
as the mills in Saco and Biddeford, and the rail yard in Rutland. It seems safe to say, based
on the interviews and the review of plans, that these efforts would have occurred whether
the train station and rail service existed or not, and in fact efforts on Saco Island and in
downtown Rutland began before passenger rail was being discussed.
Requiring minimum density around the station was another best practice that was
not followed, and in fact the opposite was usually true. Most of the cities have maximum
density requirements, though it is important to note that in each of the cities the area
surrounding the station was zoned for higher densities than areas further from the station,
reflecting the more urban character of the downtown setting. Market studies specifically for
the area surrounding the station were lacking in two of the case studies, and had not been
updated recently in one case study site. In Saco, where the study had not been updated, this
might be due to the fact that a developer bought the area to be developed and may be
conducting its own market analysis.
A final major difference between the best practices in the literature and the case
studies is the role of the station as a focal point in the center of activity. While all of the
stations are in fact located in or adjacent to downtowns, the stations themselves do not stand
out or act as focal points and community gathering spots. The exception is Saco, where the
interior of the station has become a popular community space, and the wind turbine that

151
powers the station can be seen when approaching the station before the actual building is
visible. However even here, the area immediately surrounding the station comprises of
surface parking and an undeveloped field. The stations, at least at this point, do not act as
dramatic gateways into the city, or as vibrant gathering places.
6.2. Findings
These findings are based off of the analysis of the planning practices of small cities
compared to the best practices presented in the TOD literature focusing on larger
metropolitan areas. They present the differences found between the two, and offer guidance
for small communities that may be planning for a new passenger rail station.
Stations are part of overall development plans, rather than the main focus of plans.
In the context of a small town or city, new passenger train stations are not the focus of
planning efforts in the surrounding area. Often stations are located in or adjacent to
downtowns, which often is already a focus of planning efforts in the community. Plans are
developed to address broader community goals of redevelopment or revitalization of
downtowns, old industrial areas, and neighborhoods. In smaller communities with limited
planning staff, this strategy may make more sense than to devote a plan solely to looking at
a new station and the area surrounding it. Additionally, if passenger rail service is limited to
a few trips per day, the impacts to the area surrounding the station are likely to be minimal.
While planning for access and amenities at the station will help make using the service more

152
attractive, there is only so much that planning can accomplish. If service is not convenient to
use, ridership will remain low regardless of how great the place surrounding the station
may be.
This is not to say that new passenger rail service, or a new station, should not play a
part in planning efforts in the area where the station will be located. As plans are revised or
new plans are developed, how the station will function and interact with surrounding land
uses needs to be considered, and efforts to maximize the potential for both attracting riders
and improving the sense of place immediately surrounding the station should be
considered. Overall the station should be planned to build upon and strengthen the broader
planning efforts and community goals for the area. If a current plan does not exist for the
area around a station, than the development of a new station may act as a good impetus for
the development of a new plan for the entire area. However the station need not act as the
sole focus of the plan, but be integrated into a larger discussion of the area and what goals
the community has for the future of the area.
There is a greater need for stations to serve multiple uses.
Because train service is less frequent in smaller towns and cities in rural areas, the amount of
activity at the station due solely to riders will not be great throughout the day. In order to
make more efficient use of the station and to create more activity in and around the building
throughout the day, other uses should be incorporated into the space. The types of uses and
how they are physically integrated into the function of the station will impact the level of
activity. Office use may create activity from those who work there, but may not stimulate

153
community use of the building. Commercial uses can generate activity, but if the
commercial space is not visible from the sidewalk, people may not be aware that it exists
and therefore not bother to enter the station. Incorporating a community space within the
station may help develop a sense of community ownership and pride for the station. An
array of uses could be considered depending on what the goals of the community are for the
building. Multiple uses of the station that create an on-going activity level also can help
make the station feel more secure for those using the space. A deserted waiting area may
not be a comfortable place for someone to wait for a train or bus.
The design of the station should connect to the street and outdoor spaces.
In order to be more inviting, stations should have clear and welcoming connections to the
street. The literature also emphasizes this point. Stations that front on streets should follow
design guidelines of creating a human-scaled, visually interesting streetscape. If set back
from the street, the station could open onto a landscaped public space. Parking lots and drab
plazas fronting train stations do not feel inviting to pedestrians on the sidewalk.
There is a greater need for attention to the “last mile.”
In urban areas a transit network usually exists, and might consist of buses, light rail, heavy
rail, taxis, and ferries. In rural areas, such a network does not usually exist. In most cases a
local or regional bus service with a limited service area and infrequent service is the best
case scenario. Therefore it is even more important in small towns and cities for planners to
think about how those arriving by train will reach their final destination. Existing bus

154
service should be coordinated with the train schedule, and expanded if possible. Other
methods of alternative transportation should be explored as well. Car sharing services such
as Zip Car could be located at or near the station. Car rental dealerships could also be
located nearby. In addition to thinking about transportation, land use could also play a role
in addressing the “last mile.” Efforts could be made to attract a hotel to locate within
walking distance of the station, along with other services convenient for travelers.
Passenger train service may create a demand for alternative transportation.
Building off of the last point, passenger train service may create a demand for alternative
transportation to and from the station for those whose destination or origin is farther than
walking distance from the station. In rural areas the station is likely to be the only one for
miles, and therefore may attract riders from a wide geographical range. This may help
support an existing local or regional bus service, and create demand for more service in the
area.
155
CHAPTER 7
CONCLUSION
This research is just the beginning of what will likely become a growing body of literature
on the impacts of passenger rail in smaller communities and how these communities can
plan for new rail stations. As the nation’s rail network expands and improves, rural areas
once connected by train to the region will once again have passenger rail service. Much
more research is needed to determine best practices for planning for passenger rail in small
communities. As more and more communities receive new passenger rail stops, it will be
possible to look more in depth at what the impacts are to the area surrounding the station.
Before and after statistics on property values, ridership, building permits, income, and other
indicators should be explored. Qualitative data on changes to the streetscape and the
amount of activity in the area around the station over time could also be explored. By
looking at a larger sample of case study communities, themes and patterns may emerge that
could inform other communities in what to expect from a new rail station.
Research on smaller cities and towns that have intentionally initiated planning
efforts around stations to capitalize on the presence of the station would be another strategy
that could result in more detailed information on what planning practices are most
applicable and useful in smaller communities. While this study looked at how cities have
planned for passenger rail, the case studies were not first screened to determine if planning
specific to the station had occurred. However there may be some smaller communities that
have intentionally used transit-oriented development as a planning strategy around a

156
station. Reviewing and tracking these efforts would help determine what is most effective
and why.
Any best practices that are eventually developed will be a general guideline, as each
community is unique and has its own goals to consider. As more research is conducted on
smaller towns and cities, the TOD typologies that have been developed already by some
researchers will be able to expand to include small towns and cities located in rural areas.
Although no community will fall exactly into a type, at least there will be a more accurate
framework for a small town or city to begin with when thinking about planning for
passenger rail.

157
APPENDIX A
BEST PLANNING PRACTICES SUMMARY MATRIX
Best Practice Saco Biddeford Pittsfield Rutland
Planning
Process:
1. Is there a plan
for the station
area?
2. Was the
transit
investment a
main reason for
creating the
plan?
3. Does the
station figure
prominently in
the plan/s?
4. Did the plan/s
include
numerous
stakeholders?
5. Has the city or
town taken
actions to
implement the
plan/s and/or
capitalize on the
transit
investment?
1. Yes: 1998
Revitalization
Plan for Saco
Island and
Downtown Saco;
2007 Saco
Downtown Plan
2. No.
redevelopment
plans for the
island with or
without station
would have
proceeded.
3. Partially.
The station is
addressed in
both plans but
is not the
central focus.
4. Yes. The
1998 plan had a
more extensive
public
participation
process than
the 2007 plan.
5. Yes. Rezoned
Saco Island,
land
exchanges, Tax
Increment
Financing,
streetscape
improvements,
sewer
infrastructure
1. Yes. 2006
Downtown
Traffic
Circulation and
Parking
Management
Plan; 2009 Mill
District Master
Plan; a
Downtown
Master Plan is
currently being
developed.
2. No. The
redevelopment
potential of
downtown and
Mill District
main reason,
though station
and
Downeaster
service is seen
as beneficial in
marketing both
areas.
3. Partially.
The station is
mentioned in
the 2006 plan,
but plays a
larger role in
the 2009 plan.
A charrette was
conducted for
the Mill District
based on TOD
1. Partially. The
city recently
completed a new
Master Plan in
2009, which
addresses the area
surrounding the
station.
2. No. The station
is not a large
focus of the plan.
3. No.
4. Yes. There was
an extensive
public
participation
process
5. Yes. Zoning
changes,
expedited
permitting,
streetscape
improvements.
1. Yes. 1992
Rutland
Downtown
Redevelopment
Plan; 2005
Rutland Railyard
Redevelopment
Plan; 2009
Master Plan.
2. No. The 1992
plan is an effort
to revitalize the
downtown, and
rail was not yet
in the picture.
The 2005 plan
was written to
help facilitate
the relocation of
the rail yard
from
downtown, and
the 2009 Master
Plan is an
update of a 2002
Master Plan.
3. No.
4. Partially. The
public process
for the
redevelopment
plans is not
stated, though
city voters did
approve both
plans. The
Master Plan is

158
improvements,
marketing,
construction of
station.
principles.
4. Yes. The Mill
District Plan
especially had
a more
comprehensive
public
participation
process.
5. Yes. Zoning
changes, Tax
Increment
Financing,
intersection
improvements,
streetscape
improvements,
road and sewer
infrastructure
improvements,
local bus
rescheduling.
an update of a
2002 plan, and
instead of going
through a new
public process
to determine
new goals, it
uses established
goals already
developed by
the community.
The plan states
that these goals
were developed
with public
meetings or
municipal
review through
past efforts.
5. Yes.
Established
Rutland
Redevelopment
Authority,
established
assessment
district
downtown to
fund streetscape
improvements,
will complete
infrastructure
improvements
with
redevelopment.
Mix of Uses:
1. Is a mix of
uses allowed or
encouraged?
2. Is vertical
mixing
encouraged?
3. Is a mix of
1. Yes. Mix of
uses is
encouraged on
Saco Island and
in the
downtown.
2. Unsure/No.
Vertical mixing
1. Yes. Both
zoning districts
in downtown
and the Mill
District, and
the Mill District
plan,
encourage a
1. Yes. Mix of uses
is encouraged in
Arts Overlay and
SGOD districts.
2. Yes. Along
certain streets
nonresidential
uses are required
1. Yes. Mix of
uses is allowed
in most districts
surrounding the
station.
2. Unsure/No.
Only mention
of vertical

159
housing types
encouraged or
required.
of uses does
exist in
downtown and
on Saco Island.
3. Yes.
Multifamily
housing is
allowed in
three out of
four residential
districts and all
business
districts in the
transit district.
mix of uses.
2. Yes. In Mill
District,
Commercial
Core District,
and B1 district.
3. Yes.
Multifamily as
well as
affordable units
are
encouraged.
on the ground
floor.
3. Yes. SGOD is
specifically meant
to encourage a
range of housing
types, and
requires 20%
affordable
housing in larger
projects.
mixing is in the
2009 plan,
which states
that the use of
upper floors in
the downtown
for housing will
increase the
rental stock.
3. Yes. A Mixed
Use Residential
district is meant
to promote a
variety of
housing types,
and multifamily
and single
family housing
are allowed by
right in all
districts.
Density:
1. Are there
minimum
density
requirements?
2. Maximum
density
requirements?
1. No
minimum
density
requirements.
2. Yes.
Minimum lot
and maximum
height are set
for each zoning
district except
for Saco Island,
which does not
have any
dimensional
requirements.
1. Partially. No
minimum
requirements,
but minimum
height of 2
stories in two
of the three
MSRDs.
2. No
maximum
requirements.
Flexible
dimensional
regulations in
the MSRD.
1. No minimum
densities.
2. Yes. Maximum
densities are
prescribed for the
SGOD. Maximum
height
requirements exist
in all districts. No
minimum height
requirements.
1. No minimum
densities.
2. Yes.
Minimum lot
sizes are
prescribed for
each district.
Connectivity
and Mobility:
1. Is there a
focus on
maximizing
connectivity and
mobility for
1. Yes.
Sidewalks
required on all
new streets;
walkways
required from
parking areas
1. Yes.
Sidewalks
required on all
new streets;
pedestrian
paths must be
provided
1. Yes. Parking
lots in SGOD
must have
pedestrian paths
connecting to
sidewalks,
distinction
1. Yes. Planned
creation of new
streets with
sidewalks and
pedestrian and
bicycle paths to
connect

160
pedestrians, as
well as
bicyclists?
to entrances
and sidewalks;
blocks longer
than 800 feet
may be
required to
have a
pedestrian
easement
through them;
2004 Bike and
Pedestrian Plan
called for
installing bike
racks at station,
a crosswalk at
station
entrance and
adding
wayfinding
signage to
direct visitors
to and from the
station to
downtown;
new sidewalk
and pedestrian
walkways on
Saco Island.
through
parking lots;
2006 plan
recommends
re-striping
crosswalks and
rehabbing
sidewalks;
pedestrian and
bike paths
planned for
Mill District,
along with a
riverwalk and
two pedestrian
bridges leading
to Saco Island.
A transit loop
is also
proposed to
run every 15
minutes
between
downtown, the
Mill District,
Saco Island,
and downtown
Saco.
between
pedestrian and
vehicular traffic,
allow for future
pedestrian and
bicycle
connections
between
properties,
sidewalks should
be continuous and
broken minimally
by curb cuts.
Downtown
Streetscape
Project will
incorporate traffic
calming
measures,
improved
sidewalks,
lighting, bicycle
parking, and
street trees.
Master Plan:
recommends
traffic calming,
connecting new
streets to grid and
requiring short
blocks, sidewalk
maintenance, and
a pedestrian and
bicycle plan for
the city.
downtown to
southwest
neighborhood,
creation of a
pedestrian path
from downtown
to southwest
neighborhood,
creation of bike
paths
throughout the
city with
connections to
downtown.
Place-Making
and Urban
Design:
1. Are design
guidelines or
standards in
place for the
area
1. Yes. Design
standards exist
for the Historic
District in
downtown,
and for projects
in all other
zoning districts
1. Yes. Historic
District
standards and
Architectural
Standards for
the rest of the
MSRD.
2. Yes. Limited
1. Partially.
Design standards
are in place for
the SGOD only,
which only apply
if a developer
chooses to
develop under the
1. Yes.
Designated
Design Control
Districts each
have design
standards. The
Downtown
Business

161
surrounding the
station, or is
there a desire to
require them in
the future?
2. If yes, do they
seek to promote
a human-scaled
environment?
3. Is infill
required or
encouraged to
be sensitive to
the surrounding
context by
fitting in with
existing
buildings?
4. Are there
existing or
planned public
spaces to
accommodate
community
gathering in the
area?
requiring a
conditional use
permit or site
plan review.
2. Yes. A stated
intent of the
standards is to
ensure a
human scaled
environment.
3. Yes.
Compatibility
to surrounding
buildings is
stressed in both
standards.
4. Partially.
Sidewalks on
Main Street are
used for events;
Saco Island
includes a
riverwalk
currently under
construction;
the train station
has become an
indoor
community
gathering
place. Earlier
plans for Saco
Island included
an extensive
open space
element that is
no longer part
of the plans,
and the station
lacks any
outdoor public
gathering
space.
to no setbacks
allowed,
parking must
be placed to
side or rear,
attention to
building
height, width,
window
proportions,
roof forms,
directional
expression of
the building.
3. Yes. Both
design
standards focus
on
compatibility
with
surrounding
buildings.
4. Yes. There is
an existing
small park on
the river, and
the sidewalks
downtown are
wide and lined
with trees. The
Mill District
Plan outlines
an extensive
open space
network of
paths, green
spaces, and
plazas, meant
to be accessible
by the public.
SGOD.
2. Yes. Promotes a
continual, visually
interesting, street
wall creating a
sense of space for
pedestrian;
parking must be
placed to the side
or rear of
buildings; curb
cuts should be
minimized.
Master Plan
recommends
establishing form
based codes with
build-to lines and
minimum height
standards for all
of downtown.
3. Yes. New
buildings should
be compatible to
massing and
setbacks of
surrounding
buildings, but
creativity is
encouraged
regarding style.
4. Yes. SGOD
standards
encourage open
spaces for public
gathering, and
treat sidewalks as
public spaces that
should be
enhanced by new
developments.
Downtown
Streetscape
District is
controlled by
separate
guidelines.
2. Mostly. For
Design Control
Districts, infill
must be
compatible in
height and
setback to
surroundings,
parking should
be placed to the
side or rear,
curb cuts
should be
limited.
Downtown,
goal is to
promote
commerce, but
also promotes
visually
interesting
streetscapes,
and buildings
facing public
spaces in a
“constructive”
manner.
Parking is not
relegated to
side or rear.
3. Yes. Infill
must be
compatible to
footprint,
height, setback,
roof shapes,
fenestration,
and exterior
materials in

162
Project includes
improvements to
sidewalk space
and the creation
of new
landscaped areas.
Design Control
Districts. In
downtown,
projects will be
judged
according to
their context for
acceptability,
and should be
consistent with
surroundings
but not
necessarily
imitate style.
4. Yes. Depot
Park in
downtown is
used for a
farmers market.
Sidewalks in
downtown are
wide and tree-
lined. The 2009
Master Plan
recommends
the creation of a
system of
linked open
spaces in
downtown.
Station
Location,
Design, and
Access:
1. Is the station
located in the
center of
activity, or in a
place where
activity can be
created on all
sides with the
station acting as
1. Yes. It is
located
strategically
between the
downtowns of
Saco and
Biddeford, and
redevelopment
is occurring
and planned
for the area
immediately
adjacent to the
1. N/A
2. N/A
3. Yes.
Currently a
sidewalk is
provided from
downtown to
the station. The
Mill District
Plan proposes
two pedestrian
bridges to
connect to Saco
1. Partially. The
station is located
in downtown
along the main
street. However it
is set back from
the street and
does not act as a
focal point.
2. Partially. The
design is more
modern than
surrounding
1. Partially. The
station is
located in
downtown, but
set back behind
the shopping
center and
surrounded by
pavement.
2. Yes. The
station is a brick
building with a
green colored

163
a focal point?
2. Does the
design of the
station reflect
the character of
the surrounding
community?
3. Does access to
the station
balance the
needs of those
arriving by foot,
bike, transit, and
car?
station.
2. Yes. Brick
reflects the
adjacent mill
buildings.
3. Yes. Paths
are provided
leading up to
the station. A
drop off area
accommodates
the local bus
and taxi
service.
Parking for 200
vehicles
accommodates
park and ride
function.
Island and the
station. Also a
shuttle bus
service is
proposed to
serve
downtown
Biddeford and
Saco, the Mill
District and the
station every 15
minutes.
Currently the
local bus serves
the station, and
every train is
met by a bus.
buildings, and
looks like an
office building. It
could have a more
appealing ground
floor facing the
street.
3. Yes. Pedestrian
access is provided
from all sides of
the station. Bike
racks are available
in two places, and
parking is
available
underground. Bus
bays are located at
the rear of the
building, and the
station serves as a
hub for the local
bus system.
roof, which is
consistent with
the materials
used on the
adjacent
shopping
center, and also
reflects the
brick buildings
of the
traditional
downtown
business blocks.
The station does
not have a sign
to identify it,
and is not
considered a
gateway into
the city.
3. No. While a
pedestrian path
leads to the
station from the
rear, there is no
designated
pedestrian path
leading to the
front of the
station from the
downtown.
Instead a
pedestrian must
walk through a
large paved
area intersected
with vehicular
traffic. There
are also no bike
racks located at
the station.
Parking seems
plentiful, and

164
the local bus
serves the
station.
Parking:
1. Are strategies
in place for
reducing the
amount of
surface parking
in the area?
1. Yes. In the
Downtown
zoning district,
parking
requirements
are reduced by
50%, and can
be reduced
further through
use of public
parking lots
and shared use
of parking
facilities among
different
uses/buildings.
City is
monitoring
parking
situation at
station, and has
done
preliminary
planning for a
future parking
structure.
1. Yes.
Requirements
in the MSRD
can be reduced
or waived for
shared parking,
availability of
on-street
parking, public
off-street
parking, or
alternative
transportation.
The city is
looking to
acquire land to
build a parking
structure. Mill
District Master
Plan
recommends
reducing
parking
requirements
for the Mill
District.
1. Yes. Arts
Overlay District:
establishments
under 5000 square
feet are not
required to
provide parking.
SGOD: requires 1
space per
residential use, a
reduction of .5
from regular
requirements.
Requirements can
be waived for
shared parking,
proximity to
public parking
and transit, and
the characteristics
of the residents
likely to live in
the development
is considered.
Master Plan
recommends a
parking
management
plan, and the
reduction or
elimination of
requirements
downtown.
1. Partially.
Shared parking,
satellite
parking, and
availability of
transit will be
considered
when setting
requirements.
However
emphasis is on
providing
parking that
will
accommodate
growth of
commerce, and
there seems to
be reluctance to
commit to
reducing
parking
requirements
downtown. A
parking garage
once stood near
the train station.
It has since been
replaced by
surface parking.
Market
Considerations:
1. Has a market
feasibility study
been conducted
or updated for
the area and
1. Mostly.
Market studies
were
conducted for
Saco Island and
Downtown for
the 1998
1. Yes. The 2009
Mill District
plan includes a
market
analysis, and
the Downtown
master plan
1. No. The Master
Plan addresses
economic
development for
the city as a
whole, with
several specific
1. No. The 1992
redevelopment
plan and the
2009 Master
Plan
recommend
certain projects

165
incorporated
into plans?
revitalization
plan. The
Downtown
analysis was
updated for the
2007
Downtown
plan, but the
Saco Island
market analysis
has not been
updated since
1998.
will also
include a
market study.
recommendations
for downtown.
downtown, but
there is no
reference to a
market study.
The 2005 rail
yard plan does
incorporate a
market study
for the sites
impacted by the
relocation, but
the emphasis is
on industrial
uses that could
benefit from
freight rail.
Lessons for
Other
Communities:
1. Has the
transportation
investment
made an impact
on the area
surrounding the
station? Why or
why not?
2. Are there
other planning
activities you
would like to
employ that you
think would
help capitalize
on the
transportation
investment and
bring about
positive impacts
to the area
surrounding the
station?
3. Are there
1. Yes.
Development
of station
created
awareness in
the community
of the
Downeaster
and provides
traveler
services. The
quality of the
Downeaster
service is better
than other
Amtrak routes
because it is
operated by
NNEPRA, an
authority
created by
Maine, with
locally based
people
monitoring
service.
NNEPRA
1. Yes. The
Downeaster
service has
helped the city
market the Mill
District to a
larger market
that includes
Boston. Also
the service had
a role in the
University of
New England’s
decision to
expand its
campus, as it
now can draw
more students
from the
Boston area.
2. Improve the
local bus
service and cut
headways in
half to 15
minutes. Will
need to update

166
planning actions
you think
should have
been taken prior
to the
completion of
the
transportation
investment that
would have
been beneficial
in achieving
impacts to the
surrounding
area?
markets the
Downeaster
and the
destinations
along the route.
Former Mayor
was a strong
advocate for a
station in Saco,
seeing it as a
long term
investment for
the city.
2. Need to
provide quality
transportation
service that can
compete with
the automobile.
Scheduling and
frequency is
important, and
currently the
Downeaster
does not run
frequently
enough to
attract a larger
ridership.
3. Would have
liked to build
station sooner.
plans as new
stakeholders
move in.
3. The city
could have
pushed for the
station to be
located in
downtown
Biddeford. The
city could have
determined
what the
impacts of the
service might
be, and then
prioritized
which impacts
and benefits
the city wanted
to focus on. The
city could have
also explored
the creation of
a downtown
business park.

167
APPENDIX B
BEST PLANNING PRACTICES ANALYSIS TABLE
Best Practice Yes Mostly Partially No
Planning Process:
1. Is there a plan for the station area? 3 1
2. Was the transit investment a main reason for
creating the plan?
4
3. Does the station figure prominently in the
plan/s?
2 2
4. Did the plan/s include numerous stakeholders? 3 1
5. Has the city or town taken actions to implement
the plan/s and/or capitalize on the transit
investment?
4
Mix of Uses:
1. Is a mix of uses allowed or encouraged? 4
2. Is vertical mixing encouraged? 2 2
3. Is a mix of housing types encouraged or
required?
4
Density:
1. Are there minimum density requirements for
the area?
1 3
2. Are there maximum density requirements for
the area?
3 1
Connectivity and Mobility:
1. Is there a focus on maximizing connectivity and
mobility for pedestrians, as well as bicyclists?
4
Place-Making and Urban Design:
1. Are design guidelines or standards in place for
the area surrounding the station, or is there a
desire to require them in the future?
3 1
2. If yes, do they seek to promote a human-scaled
environment?
3 1
3. Is infill required or encouraged to be sensitive
to the surrounding context by fitting in with
existing buildings?
4
4. Are there existing or planned public spaces to
accommodate community gathering in the area?
3 1
Station Location, Design, and Access: (Questions
1 and 2 only apply to Saco, Pittsfield, and

168
Rutland)
1. Is the station located in the center of activity, or
in a place where activity can be created on all
sides with the station acting as a focal point?
1 2
2. Does the design of the station reflect the
character of the surrounding community?
2 1
3. Does access to the station balance the needs of
those arriving by foot, bike, transit, and car?
3 1
Parking:
1. Are strategies in place for reducing the amount
of surface parking in the area?
3 1
Market Considerations:
1. Has a market feasibility study been conducted
or updated for the area and incorporated into
plans?
1 1 2

169
APPENDIX C
INTERVIEW QUESTIONS FOR PLANNING STAFF
These questions relate to the area within a ½ mile radius of the train station. The questions
are based from planning principles derived from a number of literature sources on Transit-
Oriented Development. The goal of the interview is to determine if and how these principles
apply to your community. Your input on why or why not a question applies to your
community is of great value to this research.
The Planning Process:
• Is their a plan for the area surrounding the station? Did the planning process precede
or proceed the transportation investment (the reintroduction of rail and/or
completion of a multi-modal station), and was the transit investment the main
reason for creating the plan?
• Who were the stakeholders that were brought into the planning process, and what
types of public outreach and participation was conducted during the process?
• What actions has the local government taken to implement the plan and/or capitalize
on the transportation investment? Examples include zoning changes, infrastructure
improvements, land assembly, expedited permitting, sidewalk and streetscape
improvements, and public/private partnerships.
Mix of Uses:
• Is a mix of uses allowed and encouraged in the area surrounding the transit station?
What are the allowed uses? Is the vertical mixing of uses encouraged? Is there a mix
of housing types (single family, multi-family, affordable) encouraged or required?
Density:
• Are their minimum or maximum density requirements for the area?
Connectivity and Mobility:
• Is there a focus on maximizing connectivity and mobility for pedestrians and
bicyclists? Examples include implementing traffic calming techniques or designing
streets for slower automobile speeds, providing sidewalks and marked pedestrian
crossings throughout the area, and providing bike lanes or pedestrian pathways.
Place-Making and Urban Design:

170
• Are design guidelines or standards in place for the area surrounding the station, or is
there a desire to require them in the future? If yes, do they seek to promote a human-
scaled environment (for example, through limited setbacks, visually interesting
ground floors, limited curb cuts/space between buildings and parking placed in
rear).
• Is infill required or encouraged to be sensitive to the surrounding context by fitting
in with existing buildings?
• Are there existing or planned public spaces to accommodate community gathering
in the area? This can include wide sidewalks with street trees, furniture, and outside
dining, as well as plazas and parks.
Station Location, Design, and Access:
• Is the station located in the center of activity, or in a place where activity can be
created on all sides with the station acting as a focal point?
• Does the design of the station reflect the character of the surrounding community?
• Does access to the station balance the needs of those arriving by foot, bike, transit,
and car? Are there direct pedestrian connections to the surrounding
neighborhoods/area?
Parking:
• How is parking managed in the area surrounding the station? Are strategies in place
for reducing the amount of surface parking in the area? Strategies might include
promoting shared parking, more on-street parking, parking garages, reduced
parking requirements, and fees in lieu of meeting parking requirements for new
development.
Market Considerations:
• Has a market feasibility study been conducted or updated for the area and
incorporated into plans?
Lessons for Other Communities:
• In your opinion has the transportation investment made an impact on the area
surrounding the station? Why or why not?
• Are there other planning activities you would like to employ that you think would
help capitalize on the transportation investment and bring about positive impacts to
the area surrounding the station?

171
• Are there planning actions you think should have been taken prior to the completion
of the transportation investment that would have been beneficial in achieving
impacts to the surrounding area?
Thank you for you time and assistance in this study.

172
APPENDIX D
INTERVIEW CONSENT FORM

173

174

175
REFERENCES
Amtrak Downeaster. 2010. http://www.amtrakdowneaster.com/. Accessed March 16, 2010.
Amtrak. 2008. “Amtrak Fact Sheet, Fiscal Year 2008 State of Vermont.”
http://www.amtrak.com/servlet/ContentServer?c=Page&pagename=am%2FLayout&
cid=1246041980432. Accessed March 13, 2010.
Amtrak. 2009. “Amtrak Fact Sheet, Fiscal Year 2009 State of Vermont.”
http://www.amtrak.com/servlet/ContentServer?c=Page&pagename=am%2FLayout&
cid=1246041980432. Accessed March 13, 2010.
Amtrak website. 2010. http://www.amtrak.com. Accessed April 2010.
Bernick, Michael, and Robert Cervero. 1997. Transit Villages in the 21st Century. New York,
N.Y.: McGraw-Hill.
Berkshire Regional Transit Authority (BRTA). 2010. “Joseph Scelsi Intermodal
Transportation Center.” http://www.berkshirerta.com/transitcenter.php. Accessed
March 10, 2010.
Biddeford, City of. 2010. Interview with a city staff person. March 24, 2010.
Biddeford, City of. 2006. “Downtown Traffic Circulation and Parking Management Plan.”
http://www.biddefordmaine.org/index.asp?Type=B_BASIC&SEC={0D08B715-93DE-
447F-8052-BD286337446D}. Accessed March 18, 2010.
Biddeford, City of. 2009. “Biddeford Mill District Master Plan.”
http://www.biddefordmaine.org/index.asp?Type=B_BASIC&SEC={D7FA47E8-C8F6-
4BD2-9D4C-DB65B90214E6}. Accessed March 18, 2010.
Biddeford, City of. 2010. “Request for Proposals: Biddeford Heart and Soul Planning Project
Downtown Master Plan.”
http://www.biddefordmaine.org/index.asp?Type=B_BASIC&SEC={4F63D584-9DEA-
4FA3-BBB8-CF6CD1001824}. Accessed March 18, 2010.
Biddeford, City of. 1990. “Zoning Ordinance, City of Biddeford, Maine.”
http://www.biddefordmaine.org/index.asp?Type=B_LIST&SEC={963DBFEE-5112-
4D2B-9C3E-FDBB46686F2A}. Accessed March 18, 2010.
Bollinger, Christopher R., and Keith R. Ihlanfeldt. 1997. The Impact of Rapid Rail Transit on
Economic Development: The Case of Atlanta’s MARTA. Journal of Urban Economics,
42, 179-204.

176
Brown, Jeffrey R., Eric A. Morris, and Brian D. Taylor. 2009. Planning for Cars in Cities:
Planners, Engineers, and Freeways in the 20th Century. Journal of the American
Planning Association, 75 (2), 161-177.
BSC Group and TerraSphere. 2006. “Pittsfield Downtown Streetscape Project.”
http://www.pittsfield.com/subpage.asp?ID=554. Accessed April 2, 2010.
Calthorpe, Peter. 1993. The Next American Metropolis: Ecology, Community, and the American
Dream. New York, N.Y.: Princeton Architectural Press.
Cambridge Systematics Inc., with Robert Cervero and David Aschauer. 1998. TCRP Report
35: Economic Impact Analysis of Transit Investments: Guidebook for Practitioners.
Washington D.C.: Transit Cooperative Research Program, National Academy Press.
Center for Neighborhood Technology (CNT). 2008. Amtrak Downeaster: Overview of Projected
Economic Impacts. A report to Northern New England Passenger Rail Authority.
Congress for New Urbanism (CNU). 2009. “2009 CNU New England Urbanism Awards.”
http://www.slideshare.net/cnune/2009-cnu-new-england-urbanism-awards.
Accessed March 16, 2010.
Costello, D., et al. 2003. The Returning City: Historic Preservation and Transit in the Age of Civic
Revival. Washington D.C.: Federal Transit Administration, National Trust for
Historic Preservation.
Dittmar, Hank, and Sarah Campbell. 2001. Rail Stations: At the Heart of America’s
Communities. Las Vegas, New Mexico: Great American Station Foundation.
Dittmar, Hank, and Gloria Ohland, ed. 2004. The New Transit Town: Best Practices in Transit-
Oriented Development. Washington D.C.: Island Press.
Due, John F. 1997. The Evolution of Suburban and Radial Rail Passenger Transportation in
the United States. The Quarterly Review of Economics and Finance, 37 (2), 469-489.
Dunphy, Robert T. et al. 2004. Developing Around Transit: Strategies and Solutions That Work.
Washington, D.C.: Urban Land Institute.
Economic Development Research Group (EDRG). 2005. Economic Benefits of Amtrak
Downeaster Service. Prepared for Maine Department of Transportation, Augusta,
Maine.
Ewing, Reid. 1997. Transportation and Land Use Innovations: When You Can’t Pave Your Way
Out of Congestion. Chicago, Illinois: Planners Press.

177
Fox, William F., and Sanela Porca. 2001. Investing in Rural Infrastructure. International
Regional Science Review, 24(1), 103-133.
Handy, S. 2005. Smart growth and the transportation-land use connection: What does the
research tell us? International Regional Science Review, 28(2), 146-167.
Hayden, Dolores. 2003. Building Suburbia: Green Fields and Urban Growth, 1820-2000. New
York, New York: Vintage Books.
Hirschfeld, Peter, and Stephanie M. Peters. (2009). “Amtrak Rally Draws 200 People.”
Rutland Herald, January 20, 2009. http://www.rutlandherald.com/. Accessed April 22,
2010.
Hirschfeld, Peter. (2009). “Official Softens Stance on Amtrak.” Rutland Herald, February 26,
2009. http://www.rutlandherald.com/. Accessed April 22, 2010.
Hirschfeld, Peter. (2010). “A Record Budget for Roads, Bridges.” Rutland Herald, April 21,
2010. http://www.rutlandherald.com/. Accessed April 22, 2010.
Huang, H. 1996. The land-use impacts of urban rail transit systems. Journal of Planning
Literature, 11(1), 17-30.
Jackson, Kenneth T. 1985. The Crabgrass Frontier: The Suburbanization of the United States.
Oxford, England: Oxford University Press.
Lane, Bradley W. 2008. Significant Characteristics of the Urban Rail Renaissance in the
United States: A Discriminate Analysis. Transportation Research Part A, 42, 279-295.
McDonald, John F., and Clifford I. Osuji. 1995. The Effect of Anticipated Transportation
Improvement on Residential Land Values. Regional Science and Urban Economics, 25,
261-278.
National Cooperative Highway Research Program (NCHRP). 2005. Transit-Oriented
Development: Developing a Strategy to Measure Success. Washington, D.C.:
Transportation Research Board.
Pittsfield, City of. 2009. “Planning to Thrive: City of Pittsfield Master Plan.”
http://www.pittsfield.com/subpage.asp?ID=565. Accessed March 10, 2010.
Pittsfield, City of. 1973. “City of Pittsfield Zoning Ordinance.”
http://www.pittsfield.com/images/downloads/CompleteVersion-Nov08_1.pdf.
Accessed March 24, 2010.

178
Pittsfield, City of. 2008. “Design Standards for the City of Pittsfield’s Chapter 40R Smart
Growth Overlay District (SGOD).”
http://www.pittsfield.com/images/downloads/SGODFinal%20Design%20Standards-
Reduced%20File%20Size%20for%20Website.pdf. Accessed March 24, 2010.
Rae, Douglas W. 2003. City: Urbanism and its End. New Haven, Connecticut: Yale University
Press.
Rail-Volution. 2009. “Saco-Biddeford Charrette.”
http://www.railvolution.com/2009conferencepapers.asp. Accessed February 22, 2010.
Rail-Volution website. 2010. http://www.railvolution.com/default.asp. Accessed March 20,
2010.
Reconnecting America. 2008. Somerville Equitable Transit-Oriented Development Strategy.
http://www.reconnectingamerica.org/public/projects/311 (accessed March 2009).
Reconnecting America and the Center for Transit-Oriented Development (CTOD). 2008.
Station Area Planning: How to Make Great Transit-Oriented Places. Oakland, C.A.:
Reconnecting America.
Rutland, City of. 2009. “City of Rutland, Vermont 2009 Master Plan.”
Rutland, City of. 1992. “Rutland Downtown Redevelopment Plan and Amendment to City
of Rutland Zoning Ordinance.”
Rutland, City of. 2005. “Rutland Railyard Redevelopment Plan.”
http://www.rutlandcity.com/index.asp?Type=B_BASIC&SEC={9D1703F8-0272-4859-
8478-3B0A5B34E586}. Accessed April 7, 2010.
Rutland, City of. 1996. “City of Rutland Zoning Bylaws.”
http://www.rutlandcity.com/index.asp?Type=B_BASIC&SEC={476E331C-F3C8-4C51-
889E-7BDAF28609E6}. Accessed April 7, 2010.
Rutland, City of. 1993. “Rutland Downtown Redevelopment Area Redevelopment Plan
Architectural and Design Guidelines Historical Context and Design Principles.”
http://www.rutlandcity.com/index.asp?Type=B_BASIC&SEC={FC1DEF4E-C0C7-
47B0-B379-18AB5609DA14}. Accessed March 22, 2010.
Saco, City of. 2010. “Saco Transportation Center.”
http://www.sacomaine.org/transportation/index.shtml. Accessed March 16, 2010.

179
Saco, City of. 1998. “A Revitalization Plan for Saco Island and Downtown Saco.” Prepared
by DeLuca-Hoffman Associates, Inc., Planning Decision, Inc., and Kent Associates,
Planning & Design Consultants.
Saco, City of. 2007. “City of Saco Downtown Plan.”
Saco, City of. 2010. Interview with a city staff person. March 15, 2010.
Saco, City of. 2004. “Saco Bicycle and Pedestrian Master Plan.”
http://www.sacomaine.org/archives/bike-ped-plan.pdf. Accessed March 13, 2010.
Saco, City of. 1985. “City of Saco, Maine, Zoning Ordinance.”
http://www.sacomaine.org/departments/cityplanner/zoningregs.shtml. Accessed March 13,
2010.
Saco, City of. 1988. “Subdivision Regulations of the City of Saco, Maine.”
http://www.sacomaine.org/departments/cityplanner/subdivision.shtml. Accessed
March 13, 2010.
Saco, City of. 2008. “Saco, Maine Zoning Map.”
http://www.sacomaine.org/departments/codes/zoning-full.pdf. Accessed March 13,
2010.
Transit Cooperative Research Program (TCRP). 2004. Report 102 Transit-Oriented
Development in the United States: Experiences, Challenges, and Prospects.
Washington, D.C.: Transportation Research Board.
Warner, Sam Bass, Jr. 1978. Streetcar Suburbs: The Process of Growth in Boston (1870-1900).
Cambridge, Massachusetts: Harvard University Press.