planning for longevity the missing link in your retirement plan
Post on 19-Dec-2015
213 views
TRANSCRIPT

Planning For LongevityPlanning For Longevity
The Missing Link in The Missing Link in Your Retirement PlanYour Retirement Plan

“Two-thirds of everyone
who has ever lived past 65
in the history of the world are
alive today. Throughout all of history, most people didn’t age. They died.
Ken Dychtwald
Author, Age Wave

Aging of AmericaAging of America
• Number of Americans over the age of 65 has grown from 1 in 40 to 1 in 10. It may grow to 1 in 3 during the next 30 years.
Roman EraRoman EraRenaissanceRenaissance1600’s1600’s1935193519911991PresentlyPresently
22223535
45-5245-5261.761.770.570.5
7878
Average Life ExpectancyAverage Life ExpectancyQUIZQUIZ

Our Greatest Fears About Getting OldOur Greatest Fears About Getting Old
Source: The Pew Research Center National poll Nov 9-27, USA Today, March 06
Health Problems
Income Problems
Being dependent
Dying
Being alone
32%
19%
8%
4%
3%
3%
Health care, insurance costs

Aging and Health ChangesAging and Health Changes
• Coronary Heart Disease• Cancer• Stroke• Osteoporosis• Multiple Sclerosis• Diabetes• Parkinson’s• Alzheimers

Coronary Heart Disease (CHD)Coronary Heart Disease (CHD)
• Every 29 seconds an American suffers a coronary event.
• Each year, 700,000 have their first attack• CHD is the leading cause of permanent
disability in the U.S. labor force.– 22% of men will be disabled with heart failure– 49% of woman will be disabled with heart
failure
Source: American Heart Association; 2005 Update

CancerCancer
• The American Cancer Society estimated that 1,372,910 men and women (710,040 men and 662,870 women) will be diagnosed with and 570,280 men and women will die of cancer of all sites in 2005.

StrokeStroke
• Each year 500,000 American suffer their first stroke.
• Stroke is the leading cause of serious, long-term disability and institutional care is required by 20% at three months after onset.
• 1/3 of people having strokes are under the age of 65.*Source: American Heart Association; 2005 Fact Book* Schrop, Joannie M., “Stroke Buster: New Treatments in the Fight Against Brain Attacks,” US News World Report, March 15, 1999

OsteoporosisOsteoporosis
• Often called the “Silent Disease”• 10 million already have the disease• 34 million have low bone mass• 80% are women• 50% of woman ages 50+ will have an
osteoporosis-related fracture in their lifetime– 25% of men ages 50+ will suffer the same fate.
• 6 months after a hip fracture, only 15% can walk across a room unaided.
Source: National Osteoporosis Foundation web; Oct. 2005

Multiple Sclerosis (MS)Multiple Sclerosis (MS)
• Affects 400,000 people in the U.S.
• 10,000 cases are diagnosed each year– Most are between ages 20 & 50.
• About 25% become wheelchair bound
• 70% eventually have limited capacity
Source: Multiple Sclerosis Society Research Highlights, 2005

DiabetesDiabetes
• 18.2 million people in the U.S. have diabetes
• Over 1.3 million new cases are diagnosed each year.
• Over 500,000 of new cases are people ages 40-59.
• Risk of stroke is 2x-4x higher for people with diabetes
Source: American Diabetes Association, Oct. 2005

Parkinson’s DiseaseParkinson’s Disease
• 1 million Americans suffer from it.
• 40,000 newly diagnosed cases each year
• Usually develops after the age of 65
• 15% of those diagnosed are under age 50.
Source: Parkinson’s Disease Foundation, Oct. 2005

Alzheimer’s DiseaseAlzheimer’s Disease
• Est. 4.5 million Americans have it.
• Est. 16 million could have it by 2050
• 1 in 10 over age 65 is affected
• A person with Alzheimer’s will live an average of 8 years and up to as many as 20 years from the onset of symptoms.
Source: Alzheimer’s Association Fact Sheet, Oct. 2005

Your Present and PastYour Present and Past
• Family History of Health Conditions Requiring Prolonged Assistance– Parents– Grandparents– Siblings– Children

Cycle of Cycle of DependenceDependence

What is Long-Term Care?What is Long-Term Care?
• Long-Term Care is the personal care you may need on an ongoing basis due to:– A disabling injury– Chronic medical condition– Effects of aging
• Long-Term Care helps people with the essential Activities of Daily Living (ADLs) such as:– Bathing, eating, dressing, continence, toileting,
transferring– Cognitive disorders such as Alzheimers

Where Are Long-Term Care Where Are Long-Term Care Services Received?Services Received?
87% Home Care, Assisted Living and Adult Day
Care
87% Home Care, Assisted Living and Adult Day
Care
Nursing Home Nursing Home CareCare
13%13%
Source: “Facts and Trends: The Nursing Facility Sourcebook”, American Health Care Association, 2001 & “Older and Younger People with Disabilities: Improving Chronic Care Throughout the Life Span”, Mental Health.About.com, January 2, 2002

Could it Happen to You?Could it Happen to You?
• Home care recipients receive an average of 59 hours of care per week – 36 hours of formal home care and 23 hours of family care.1
• People age 65 face at least a 40% risk of entering a Nursing Facility. 2
• The average Nursing Facility stay is 2.4 years 3 and 10% will stay five years or longer.2
1. “A Descriptive Analysis of Patterns of Informal and Formal Caregiving Among Privately Insured and Non-Privately Insured Disabled Elders Living in the Community,” 1999
2. AHIP, “Guide to Long-Term Care Insurance”, 2002
3. National Center for Health Statistics, US Department of Health and Human Services, “The National Nursing Home Survey, 2002

NH/ day HHC/ hr HHC/ hrSemi-Private Aide Homemaker
Phoenix AZ 142$ 69$ 19$ 17$ Tucson AZ 163$ 88$ 18$ 16$
Los Angeles CA 154$ 80$ 18$ 15$ San Diego CA 168$ 77$ 20$ 18$
San Francisco CA 229$ 122$ 21$ 20$ Denver CO 156$ 99$ 22$ 16$
Colorado Springs CO 159$ 94$ 26$ 18$ Honolulu HI 239$ 94$ 19$ 17$
Boise ID 157$ 96$ 16$ 16$ Billings MT 144$ 80$ 17$ 16$ Omaha NE 148$ 100$ 20$ 17$
Albuquerque NM 175$ 85$ 18$ 16$ Las Vegas NV 164$ 83$ 20$ 18$ Portland OR 159$ 88$ 20$ 17$ Eugene OR 163$ 85$ 18$ 17$
Dallas / Ft. Worth TX 113$ 94$ 17$ 16$ Houston TX 113$ 95$ 16$ 15$ Austin TX 115$ 99$ 17$ 16$
Salt Lake City UT 133$ 82$ 23$ 20$ Seattle WA 202$ 90$ 21$ 19$
Spokane WA 190$ 84$ 17$ 17$ Western Average 161$ 90$ 19$ 17$ Source: The MetLife Market Survey of Nursing Home & Home Care Costs; Sept. 2005Source: The MetLife Market Survey of Assisted Living Costs; Oct. 2006
2005 CostsSampling Around the Western Half of USACity St. ALF/ day

Long Term Care Financial RiskLong Term Care Financial Risk
1 Yr of 1 Yr of AssistanceAssistance
3 Yrs of 3 Yrs of AssistanceAssistance
5 Yrs of 5 Yrs of AssistanceAssistance
10 Yrs of 10 Yrs of AssistanceAssistance
TodayToday 54,750 164,250 273,750 547,500
5 Yrs.5 Yrs. 69,876 209,629 349,382 698,764
10 Yrs.10 Yrs. 89,182 267,546 445,910 891,820
20 Yrs.20 Yrs. 145,268 435,804 726,340 1,452,680
30 Yrs.30 Yrs. 236,626 709,879 1,183,132 2,366,263
40 Yrs.40 Yrs. 385,439 1,156,318 1,927,197 3,854,394
50 Yrs.50 Yrs. 627,840 1,883,520 3,139,201 6,278,401
Assume $150 per day 5% Compound annual growth.Source: Actual costs vary by region. Average daily rate for semi-private room in a nursing home is 176/day or $64,240 annually. MetLife Market Survey if Nursing Home & Home Care Costs; Sept 2005

A Glimpse Into the Future A Glimpse Into the Future
• 25 years from now, you develop Multiple Sclerosis and become wheelchair bound.
• Your condition progresses and you eventually require 30 months of paid assistance.
• You’re care costs $457,157– How would this affect your retirement plan?– Impact on spouse and family?

Failure to Prepare for the Cost of Long-Failure to Prepare for the Cost of Long-Term Care is the Primary Cause of Term Care is the Primary Cause of
Impoverishment Among the Elderly.Impoverishment Among the Elderly.
• 70% of those admitted to a Nursing Home are eligible for need based assistance (Medicaid) within the first year.
• ½ of all couples with one spouse in a Nursing Home are bankrupt
Medicaid: Paying for Nursing Home Care”, AARP, October 2002
Baby Boomers to go Broke?!?, PR Newswire, April 7 2000

The Big QuestionThe Big Question
How will you pay for your Long-Term Care?• Family assistance• Personal assets• Government
– Medicare
– Medicaid (welfare)
• Private Insurance

SavingsSavings
InvestmentsInvestments
Health Health InsuranceInsurance
Life Life InsuranceInsuranceLTCIALTCIA
Retirement Retirement AccountAccount
Wills/TrustsWills/Trusts

Planning for the Unknown Planning for the Unknown “Today & Tomorrow”“Today & Tomorrow”
Vital Asset Protection Strategy
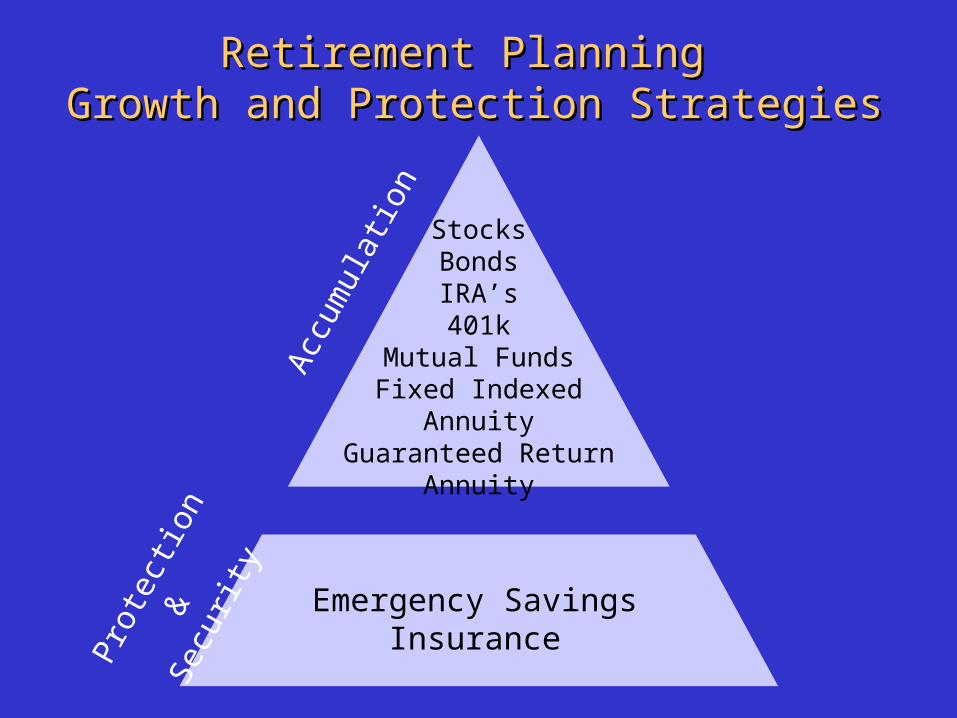
StocksBondsIRA’s401k
Mutual FundsFixed Indexed Annuity
Guaranteed Return Annuity
Acc
umul
atio
n
Prot
ectio
n &
Se
curit
y
Emergency Savings Insurance
Retirement Planning Retirement Planning Growth and Protection StrategiesGrowth and Protection Strategies

TIME MONEY GROWTH
Starting Later =
Less Time
Starting Later =
More Money
Starting Later =
Less Growth
It Takes all ThreeIt Takes all Three

0 10 20 30 40 50
$
Years
Retirement Planning GoalRetirement Planning Goal$
Retirement Savings
Growth
• For most people with retirement in the horizon, they will not have enough money to retire comfortably.
• Protection of Accumulation Assets is critical

0 10 20 30 40 50
$
Years
The Best Laid PlanThe Best Laid Plan
• Catastrophic illness or accident could wipe out a lifetime of savings
• People don’t plan to fail, they just fail to plan

0 10 20 30 40 50
$
Years
Protection with Growth = Retirement Protection with Growth = Retirement SecuritySecurity
• Asset protection is as important as asset accumulation
• Your protection is designed to grow in value to continue to meet your future needs
$ Retirement
Savings
LTC Insurance LTC Insurance Protection GrowsProtection Grows
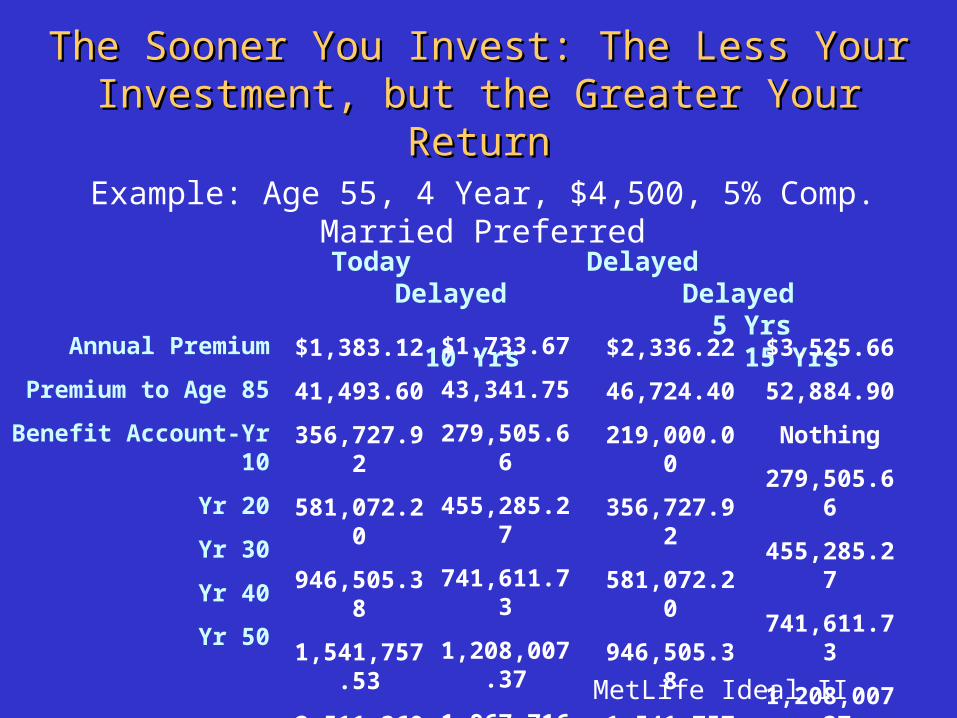
The Sooner You Invest: The Less Your The Sooner You Invest: The Less Your Investment, but the Greater Your ReturnInvestment, but the Greater Your Return
Example: Age 55, 4 Year, $4,500, 5% Comp. Married Preferred
Annual Premium
Premium to Age 85
Benefit Account-Yr 10
Yr 20
Yr 30
Yr 40
Yr 50
Today Delayed Delayed Delayed 5 Yrs 10 Yrs 15 Yrs
$1,383.12
41,493.60
356,727.92
581,072.20
946,505.38
1,541,757.53
2,511,360.55
$1,733.67
43,341.75
279,505.66
455,285.27
741,611.73
1,208,007.37
1,967,716.71
$2,336.22
46,724.40
219,000.00
356,727.92
581,072.20
946,505.38
1,541,757.53
$3,525.66
52,884.90
Nothing
279,505.66
455,285.27
741,611.73
1,208,007.37
MetLife Ideal II

Increasing Annual Increasing Annual Insurance LeverageInsurance Leverage
Today
Yr 10
Yr 20
Yr 30
Yr 40
Yr 50
Annual Premium
LTCIA Benefit Account Value
Premium % of Account Value
(Leverage)
$1,383
1,383
1,383
1,383
1,383
1,383
$216,000
356,727
581,072
946,505
1,541,757
2,511,360
.6%
.4%
.2%
.1%
.09%
.06%
Assumes 5% compound inflation added.

Real Cost of WaitingReal Cost of WaitingTaking into account age & inflationTaking into account age & inflation
Age 50 55 60
Mon. Ben $4500 $5700 $7300
Premium $1,186.95 $1,757.33 $2,810.52
From age 50 +48% +137%
From age 55 +60%
From 50 (prf) to (standard)
+74% +179%
From 55 (prf) to (standard)
+88%

Applicants Who Wanted Protection Applicants Who Wanted Protection But Ineligible Due to Health HistoryBut Ineligible Due to Health History
Average Age Ineligible
70 34%
68 27%
64 22%
57 18%
40 10%
Heart Disease, Cancer, Stroke, Osteoporosis, MS, Diabetes, Parkinsons, Alzheimers, etc.
2005 AIM Experience

100% Risk Retention Versus 100% Risk Retention Versus Pennies on the DollarPennies on the Dollar

Growth and Protection StrategiesGrowth and Protection Strategies Tax AdvantagesTax Advantages
Contribution Accumulation Withdrawal
IRA/401K
LTCIA
Tax Favored
Tax Favored
Tax Favored
Tax Favored
Taxed
Tax Favored
*
* Contributions may or may not be tax deductible based on individual situation. Consult with your tax professional regarding your circumstances.

Benefits of OwnershipBenefits of Ownership
• Peace of mind• Protection of Retirement Assets and Lifestyle• Avoid Dependence on Others• Tax Favored Status• Freedom and Control of the Future
– Type of Care Received– Where Care is Received
• Custom Plan Design– Benefits Right for You– Invest within Your Budget

Fire or tornado?Homeowners insurance
(1 in 1200)
Fire or tornado?Homeowners insurance
(1 in 1200)
Car accident?Auto
insurance(1 in 240)
Car accident?Auto
insurance(1 in 240)
$30K Medical Incident?Medical
insurance(1 in 15)
$30K Medical Incident?Medical
insurance(1 in 15)
Long term care?You pay?
(1 in 2)
Long term care?You pay?
(1 in 2)
House/Autos
Savings/Investments
Income
House/Autos
Savings/Investments
Income
The Walls Around Your EstateThe Walls Around Your EstateThe Walls Around Your EstateThe Walls Around Your Estate
1. “Mastering Long-Term Care”, Journal of Financial Service Professionals, July 19992. “What Attorney Should Know About Long-Term Care Insurance”, Elder Law Journal, Vol. 7 #1, 1999

Why Wait?Why Wait?If it EVER makes sense, it If it EVER makes sense, it
makes the most sense NOWmakes the most sense NOW
• Will You Get Healthier?• Will Rates Decrease?• Will Total LTCIA Values be Higher?• Would a Tragic Illness or or Accident Affect Your
Retirement Plan?• Will Care Costs Go Down in the Future?• Will you be covered now should an unforseen
accident or illness strike tomorrow?

Next StepsNext Steps
• Review plan design options• Select appropriate plan based on budget criteria• Complete required paperwork to open account• Attach initial deposit• Review carrier underwriting requirements,
timeline and procedures• Upon approval - keep as ordered, make
adjustments, return if dissatisfied – 30 day money back satisfaction guarantee