planetary and space science · atmospheric/surface conditions under which periods of non-polar...
TRANSCRIPT

Amazonian mid- to high-latitude glaciation on Mars: Supply-limitedice sources, ice accumulation patterns, and concentric crater fill glacialflow and ice sequestration
James L. Fastook a,n, James W. Head b
a University of Maine, Orono, ME 04469, United Statesb Department of Geological Sciences, Brown University, Providence, RI 02912, United States
a r t i c l e i n f o
Article history:Received 4 July 2013Received in revised form9 November 2013Accepted 2 December 2013Available online 28 December 2013
Keywords:MarsGlaciationClimateGeomorphologyConcentric crater fill
a b s t r a c t
Concentric crater fill (CCF) occurs in the interior of impact craters in mid- to high latitudes on Mars and isinterpreted to have formed by glacial ice flow and debris covering. We use the characteristics andorientation of deposits comprising CCF, the thickness of pedestal deposits in mid- to high-latitudepedestal craters (Pd), the volumes of the current polar caps, and information about regional slopes andice rheology to address questions about (1) the maximum thickness of regional ice deposits during theLate Amazonian, (2) the likelihood that these deposits flowed regionally, (3) the geological regions andfeatures most likely to induce ice-flow, and (4) the locations and environments in which ice is likely tohave been sequestered up to the present. We find that regional ice flow under Late Amazonian climateconditions requires ice thicknesses exceeding many hundreds of meters for slopes typical of the vastmajority of the surface of Mars, a thickness for the mid-latitudes that is well in excess of the total volumeavailable from polar ice reservoirs. This indicates that although conditions for mid- to high-latitudeglaciation may have persisted for tens to hundreds of millions of years, the process is “supply limited”,with a steady state reached when the polar ice cap water ice supply becomes exhausted.
Impact craters are by far the most abundant landform with associated slopes (interior wall andexterior rim) sufficiently high to induce glacial ice flow under Late Amazonian climate conditions, andtopographic slope data show that Amazonian impact craters have been clearly modified, undergoingcrater interior slope reduction and floor shallowing. We show that these trends are the predictableresponse of ice deposition and preferential accumulation and retention in mid- to high-latitude craterinteriors during episodes of enhanced spin–axis obliquity. We demonstrate that flow from a singleepisode of an inter-crater terrain layer comparable to Pedestal Crater deposit thicknesses (�50 m)cannot fill the craters in a time period compatible with the interpreted formation times of the PedestalCrater mantled ice layers. We use a representative obliquity solution to drive an ice flowmodel and showthat a cyclical pattern of multiply recurring layers can both fill the craters with a significant volume of ice,as well as transport debris from the crater walls out into the central regions of the craters. The cyclicalpattern of waxing and waning mantling layers results in a rippled pattern of surface debris extending outinto the crater interiors that would manifest itself as an observable concentric pattern, comparable inappearance to concentric crater fill. In this scenario, the formation of mantling sublimation till layersseals the accumulating ice and sequesters it from significant temperature variations at diurnal, annualand spin–axis/orbital cycle time scales, to produce ancient ice records preserved today below CCF craterfloors.
Lack of meltwater features associated with concentric crater fill provides evidence that the LateAmazonian climate did not exceed the melting temperature in the mid- to high-latitudes for anysignificant period of time. Continued sequestration of ice with time in CCF and related deposits (lobatedebris aprons and lineated valley fill) further reduces the already supply-limited polar ice sources,suggesting that there has been a declining reservoir of available ice with each ensuing glacial period.Together, these deposits represent a candidate library of climate chemistry and global change datingfrom the Late Amazonian, and a non-polar water resource for future exploration.
& 2013 Elsevier Ltd. All rights reserved.
Contents lists available at ScienceDirect
journal homepage: www.elsevier.com/locate/pss
Planetary and Space Science
0032-0633/$ - see front matter & 2013 Elsevier Ltd. All rights reserved.http://dx.doi.org/10.1016/j.pss.2013.12.002
n Corresponding author.E-mail address: [email protected] (J.L. Fastook).
Planetary and Space Science 91 (2014) 60–76

1. Introduction
A wide range of evidence shows that the current distribution ofice on the surface of Mars (concentrated primarily at the polarcaps) is anomalous, and that the Amazonian era was characterizedby a variety of non-polar ice-related deposits (Head and Marchant,2008; Carr and Head, 2010) ranging from the pole to the equator indistribution. These include (Fig. 1):
(1) High- to mid-latitudemantles (Kreslavsky and Head, 1999, 2000;Mustard et al., 2001; Milliken et al., 2003; Head et al., 2003) andpolygonal patterned ground (e.g., Mangold, 2005; Levy et al.,2010b).
(2) Mid-latitude Lobate Debris Aprons (LDA) and Lineated Valley Fill(LVF) (Lucchitta, 1981,1984; Mangold, 2003; Pierce and Crown,2003; Li et al., 2005; Head et al., 2005, 2006a, 2006b, 2010;Levy et al., 2007; Ostrach et al., 2008; Morgan et al., 2009; Bakeret al., 2010; Dickson et al., 2008, 2010), concentric crater fill(CCF) (Kreslavsky and Head, 2006; Levy et al., 2009, 2010a;Dickson et al., 2012; Beach and Head, 2012, 2013), phantom LDA(Hauber et al., 2008) and Pedestal Craters (Pd) (Kadish andHead, 2011a, 2011b; Kadish et al., 2009, 2010a).
(3) Low-latitude Tropical Mountain Glaciers (TMG) (Head andMarchant, 2003; Head et al., 2005; Shean et al., 2005, 2007a;Kadish et al., 2008).
General circulation models (GCM) (e.g., Haberle et al., 2003;Forget et al., 2006; Madeleine et al., 2009) and glacial flow models(e.g., Fastook et al., 2008, 2011) illustrate the orbital parameter andatmospheric/surface conditions under which periods of non-polarglaciation are favored, and the resulting patterns of accumulationof snow and the flow of ice (Milliken et al., 2003; Forget et al.,2006; Madeleine et al., 2009; Fastook et al., 2008, 2011).
Geological observations and impact crater size-frequency dis-tribution data strongly suggest that during the Middle and LateAmazonian (Hartmann and Neukum, 2001), a significant part ofthe mid-to-high latitudes in both hemispheres was covered byregional snow and ice deposits, preserved today beneath PedestalCraters (Kadish et al., 2009, 2010a; Kadish and Head, 2011b) andthat local depressions (primarily impact craters) were the sites ofsignificant ice accumulation, and preservation beneath a residualdebris cover (concentric crater fill) (Kreslavsky and Head, 2006;
Levy et al., 2009, 2010a; Beach and Head, 2012, 2013). Geologicalinterpretations of buried ice in the lobate debris aprons andlineated valley fill (e.g., Head et al., 2006a, 2006b) have beenconfirmed by SHARAD radar data (Holt et al., 2008; Plaut et al.,2009). Indeed, the preservation of this buried ice strongly suggeststhat Amazonian climate temperatures in the mid-latitudes havenot exceeded ice-melting temperatures for any significant periodof time. Pedestal Crater heights show that a significant amount ofsnow and ice accumulated over broad regions in the mid-to-highlatitudes during these periods. Regionally the mean height is�50 m, but values up to 160 m are seen in Utopia Planitia(Kadish et al., 2010a). Accumulations in CCF are typically manyhundreds of meters and can exceed several kilometers (Kreslavskyand Head, 2006; Levy et al., 2009, 2010a; Beach and Head, 2012,2013), often substantially filling the crater (Dickson et al., 2008,2010, 2012). We envision the concentric crater fill to be mostly ice,with a relatively thin debris cover from the crater walls. There arefour pieces of evidence for this: (1) the distribution of “ring-moldcraters” (Kress and Head, 2008) suggest that the thickness of thecurrent debris cover in CCF is about 15–20 m, much thinner thanthe total thickness of the often several km thick CCF; (2) WhereSHARAD data have resolved the Lobate Debris Aprons (LDA) (Holtet al., 2008; Plaut et al., 2009), the hundreds of meters of ice belowthe debris cover is relatively debris-free, and the debris cover is inthe less than 15 m range, (3) Geological relationships in craterinteriors where floors and lower walls are covered with concentriccrater fill-like textured material (Head et al., 2008) stronglysuggest that the ice is being formed on the crater walls, coveredwith debris as the upper rocky walls are exposed, and transportedout onto the floor as debris-covered glaciers, rather than ice-cemented talus/soils (Berman et al., 2005), and (4) Models of LDAemplacement (Fastook et al., 2013) suggest that a debris thicknessof this order is very realistic and plausible. Different phases orperiods of glaciation separated in time may produce differentthickness of overriding debris-covered ice, but each layer isinterpreted to be largely ice rich and debris poor. Unfortunately,the small size of these craters and the scattering of the radar signalfrom the walls make it difficult to obtain measurements of thefloor fill material to detect possible layering. We have undertakena targeted search, but the data are now being collected andreduced and we plan to test this hypothesis in upcoming analyses.However, the preservation of these various deposits and generally
Fig. 1. Distribution of non-polar ice-related deposits on Mars (from Head and Marchant, 2008). (1) Latitude-dependent mantle (Head et al., 2003); (2) Cold-based glacialcrater fill (Garvin et al., 2006); (3) Concentric crater fill (Kreslavsky and Head, 2006; Levy et al., 2009, 2010a); (4) Lobate Debris Aprons (LDA) and (5) Lineated Valley Fill (LVF)(Head et al., 2006a, 2006b, 2008; Baker et al., 2010; Levy et al., 2007; Morgan et al., 2009); (6) Glacial highstands (Dickson et al., 2008, 2010); (7) Phantom LDAs (Hauberet al., 2008); (8) Tropical mountain glaciers (Head and Marchant, 2003; Shean et al., 2005; Kadish et al., 2008); (9) Mangala Valles (Head et al., 2004); (10); Pedestal craters(Kadish et al., 2009; (11) Dorsa Argentea Formation (Head and Pratt, 2001).
J.L. Fastook, J.W. Head / Planetary and Space Science 91 (2014) 60–76 61
pristine landforms provides a basis to address important questionsabout Amazonian climate history.
Historically, diverse processes have been proposed to accountfor these types of landforms. For example, candidate hypothesesproposed to account for the CCF have included eolian processes(Zimbelman et al., 1989), debris from bedrock recession of scarps(Sharp, 1973), ice-assisted talus flow (Squyres, 1978), rock glaciers(Squyres, 1979; Squyres and Carr, 1986; Haeberli, 2006), internallydeforming ice (Lucchitta, 1984), flow of an icy substrate down intoa newly formed crater (Senft and Stewart, 2008), and debris-covered glaciers (Kreslavsky and Head, 2006; Garvin et al., 2006;Levy et al., 2009, 2010a; Beach and Head, 2012, 2013). Kreslavskyand Head (2006) and Levy et al. (2010a) discuss in detail thesedifferent hypotheses in the context of recent high-resolutionimage and altimetry data, and arrive at the conclusion that CCFis composed largely of debris-covered ice that at some pointflowed and then sublimated, to produce the observed flow-likedebris cover (Fig. 2). On the basis of a variety of evidence,numerous workers have concluded that the age of the CCF islikely to be Amazonian, reflecting processes that have taken place
within the last several hundred million years (Kreslavsky andHead, 2006; Levy et al., 2010a; Beach and Head, 2012, 2013).
Several concepts have been proposed to account for the sourcesof ice interpreted to fill the crater interiors (Fig. 3). For example,Levy et al. (2010a) suggest that accumulation in crater wall alcovescould be feeding the ice forming the CCF (Fig. 3a). They also pointout, however, that the surface of the CCF, which appears to havebeen lowered by as much as 300 m, could have overfilled some ofthe craters. They thus raise the question of sources of ice fromoutside the crater (Fig. 3b). For example, they discuss the possi-bility, strongly suggested by the presence of regional ice depositsrevealed by pedestal craters, that the CCF material could have beenpart of, and derived from, a larger inter-crater ice complex thatcovered the entire landscape. In this context, rather than localcrater accumulation and crater interior fill (Fig. 3a), the CCF mightbe the remnant of a larger regional ice sheet complex (Fig. 3b).In this scenario, the regional ice sheet reaches a thicknesssufficient to flow into the crater and create the concentric craterfill deposits; following return to non-glacial conditions at lowerobliquity, the regional ice deposits sublimate and return to the
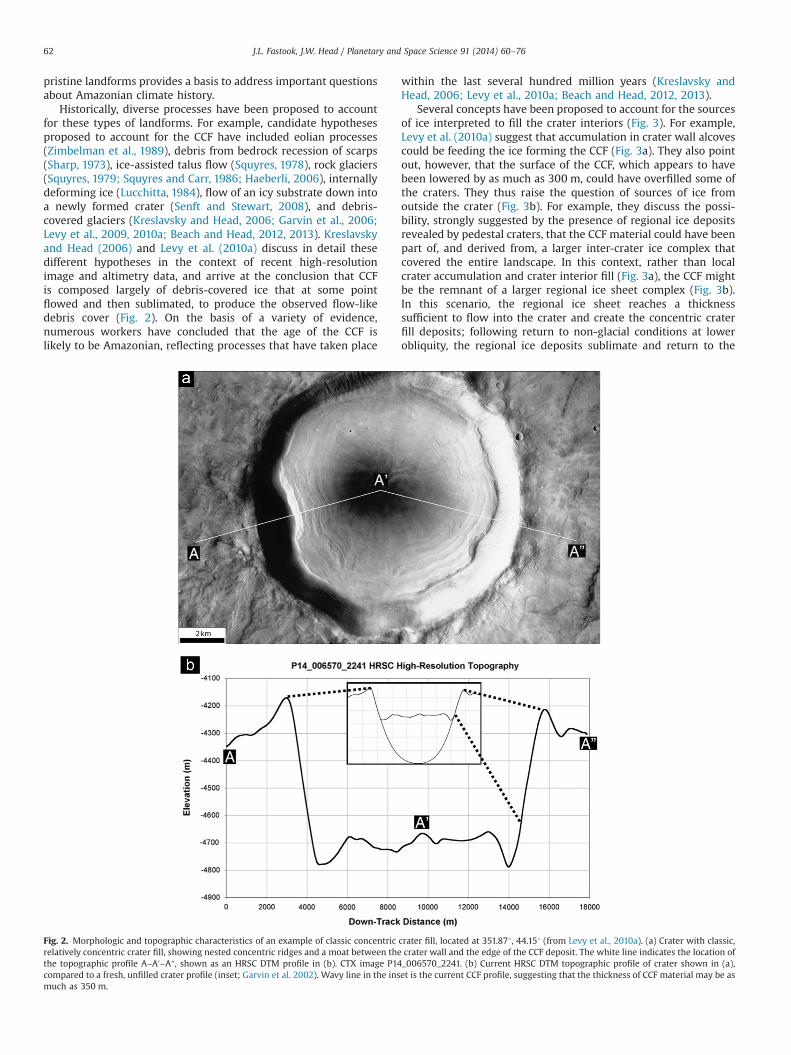
Fig. 2. Morphologic and topographic characteristics of an example of classic concentric crater fill, located at 351.871, 44.151 (from Levy et al., 2010a). (a) Crater with classic,relatively concentric crater fill, showing nested concentric ridges and a moat between the crater wall and the edge of the CCF deposit. The white line indicates the location ofthe topographic profile A–A0–A″, shown as an HRSC DTM profile in (b). CTX image P14_006570_2241. (b) Current HRSC DTM topographic profile of crater shown in (a),compared to a fresh, unfilled crater profile (inset; Garvin et al. 2002). Wavy line in the inset is the current CCF profile, suggesting that the thickness of CCF material may be asmuch as 350 m.
J.L. Fastook, J.W. Head / Planetary and Space Science 91 (2014) 60–7662

polar cap, leaving ice deposits sequestered inside the craters, witha debris-cover sufficient to retard sublimation and loss until thepresent (Fig. 3b).
Central to distinguishing between these two hypotheses is thequestion: At what thickness do ice deposits actually flow inconditions associated with the Amazonian climate of Mars? Onthe one hand, the hardness of ice at typical martian temperaturesis a major part of the argument for eolian emplacement, ratherthan ice flow (Zimbelman et al., 1989). On the other hand, others(Milliken et al., 2003) have suggested that some limited flow ispossible even at recent martian temperatures. Both of thesetreatments dealt qualitatively with the resulting flow deformation.To explore this fundamental question, in our analysis, we employan ice sheet model that includes a temperature-dependent ice
rheology, so that a true quantitative assessment within the contextof an ice sheet model can be made.
Could these mid- to high-latitude deposits and landforms(Fig. 1) signify an ice sheet of sufficient thickness to produce activeglaciers that flowed across the surface of the martian mid-latitudes, covering low-lying terrain and filling existing deeperlows, such as impact craters (Fig. 3b)? Relevant related questionsinclude: What happens when a uniform ice thickness is spreadover a depression such as a crater (Fig. 3a)? Where does flowinitiate; is it on the crater rim crests and walls where thetopographic slopes are high? Does accumulated ice flow in fromthe outside until the crater has filled with ice and the slopes aretoo low for the flow to continue? How does the timing depend onthe temperature-dependent viscosity of the cold ice? Is this typeof flow still an active process if ice remained? Critical corollariesinclude what the landscape might look like during a period ofextensive ice cover, and what happens during the period of iceretreat and loss (the waning stages of the glaciation, during which,as the ice surface lowers and the crater rim crests are exposed,rocky debris can be added to the inner slopes of the craterproviding a source for the debris cover on the surfaces of theCCF, Fig. 3; also see Fastook et al., 2013).
All of this discussion and these questions relate to under-standing the general characteristics and dynamics of extensiveAmazonian glacial periods in the mid- to high-latitudes of Mars(Fig. 1). It is critical to distinguish between the possibilities (Fig. 3)that: (1) there were accumulation-driven regional ice sheetswhose flow was accentuated at steep topographic slopes(Fig. 3b), or (2) there were only thinner regional mantles of snowand ice that only flowed within crater interiors or at other areaswith steep topographic slopes (Fig. 3a).
In order to begin to assess the setting for the formation andevolution of such landforms, in this study we explore the nature ofregional ice accumulation and glaciation during this time periodand address the following specific questions:
(1) What thickness is required to initiate ice flow on a flat, inter-crater area under Late Amazonian conditions?
(2) Could the current pedestal crater (Pd) mean deposit thicknessvalue (�50 m) be the remnant of equilibrium flow (that is, didthicker ice flow until it reached an equilibrium thicknesssimilar to the current observed Pd thickness)?
(3) What slopes are required to initiate ice flow under LateAmazonian conditions and where are these slopes most likelyto occur geologically?
(4) What was the nature of ice cover and glaciation during periodsof maximum ice accumulation in the Late Amazonian?
In the following analysis, we address each of these questionsin order.
2. Analysis of key questions
2.1. What ice thickness is required to initiate ice flow on a flat, inter-crater area under Late Amazonian environmental conditions?
We approach this question by assessing the thickness, slopeand the temperature-dependent flow behavior of ice underAmazonian climate conditions. We assume here that any icedeposition from obliquity-controlled climate variation is relativelyuniform over a broad area, with no localized concentrations ofaccumulation such as might occur in wind- or sun-shelteredalcoves. We dealt with a similar situation in Fastook et al. (2011)in modeling the flow in a valley system, and the resulting flowfeatures were not consistent with alcove-originated flow, but were
Fig. 3. Cross-sectional sketches illustrating thin versus thick regional ice cover.(a) Change in climate in mid-high latitudes produces conditions conducive to theaccumulation of snow and ice and a thin regional snow/ice layer accumulates,preferentially on crater walls (top). Steep wall slopes cause glacial ice to start toflow inward, and debris is shed from the steep wall slope to the ice surface, addingto the development of a sublimation till (bottom). Climate change causes loss ofregional snow and ice, and the thicker flowing glacial ice is preserved under aprotective sublimation till. (b) Alternatively, global climate change causes emplace-ment of a very thick (many hundreds of meters) regional snow and ice layer thatflows into the crater interior, filling it to the brim (top). Climate change then causesloss of the regional snow/ice sheet (bottom), exposing the walls and adding walldebris to the cover of the flowing glacial ice, enhancing its preservation.
J.L. Fastook, J.W. Head / Planetary and Space Science 91 (2014) 60–76 63
more likely the remnants of a collapsing regional ice sheet thatcovered, but left no imprint, on the plateaus between the valleys.In this analysis we also examined the regional variations inaccumulation rates on the surrounding broad plateau predictedby the GCM and found that such lateral variations were regional innature and did not predict intensive local snow and ice buildupssufficient to induce ice flow due to local thickness perturbations.
Ice flow velocity is obtained by integrating strain rates throughthe vertical ice column, with strain rates related to stressesthrough the Flow Law with a temperature-dependent rate factor,A (Paterson, 1994).
_ϵ¼ At3 ð1Þ
With the shallow-ice approximation, we can neglect all but thevertical gradient of the horizontal velocity that results from adriving stress obtained from conservation of momentum. Assum-ing that stress in the vertical varies linearly from zero at the icesurface (z¼H) to the maximum driving stress at the bed (z¼0) wehave the following equation:
12dux
dz¼ A½ρgðH�zÞj∇hj�3 ð2Þ
We distinguish between H, the ice thickness, and h, the icesurface elevation, to accommodate variations in the bed elevation.We can integrate the strain rates from the bed where the velocityis zero to some height z within the ice column, thus obtaining thedependence of the horizontal velocity on depth within the icecolumn.
uxðzÞ ¼12A½ρgj∇hj�3½h4�ðh�zÞ4� ð3Þ
Integrating this one more time from the bed to the surface anddividing by the thickness yields the column-averaged ice velocity
necessary for inclusion in the Continuity equation for ice flow, asfollows.
U ¼ 25A½ρgj∇hj�3H4 ð4Þ
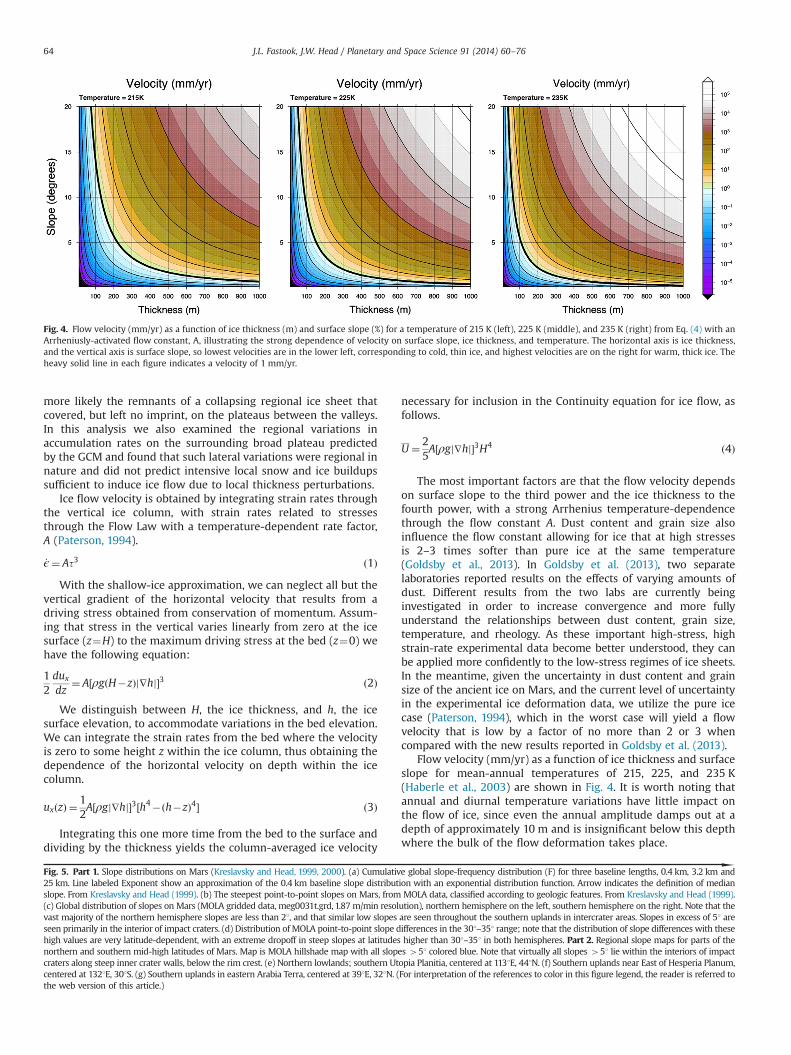
The most important factors are that the flow velocity dependson surface slope to the third power and the ice thickness to thefourth power, with a strong Arrhenius temperature-dependencethrough the flow constant A. Dust content and grain size alsoinfluence the flow constant allowing for ice that at high stressesis 2–3 times softer than pure ice at the same temperature(Goldsby et al., 2013). In Goldsby et al. (2013), two separatelaboratories reported results on the effects of varying amounts ofdust. Different results from the two labs are currently beinginvestigated in order to increase convergence and more fullyunderstand the relationships between dust content, grain size,temperature, and rheology. As these important high-stress, highstrain-rate experimental data become better understood, they canbe applied more confidently to the low-stress regimes of ice sheets.In the meantime, given the uncertainty in dust content and grainsize of the ancient ice on Mars, and the current level of uncertaintyin the experimental ice deformation data, we utilize the pure icecase (Paterson, 1994), which in the worst case will yield a flowvelocity that is low by a factor of no more than 2 or 3 whencompared with the new results reported in Goldsby et al. (2013).
Flow velocity (mm/yr) as a function of ice thickness and surfaceslope for mean-annual temperatures of 215, 225, and 235 K(Haberle et al., 2003) are shown in Fig. 4. It is worth noting thatannual and diurnal temperature variations have little impact onthe flow of ice, since even the annual amplitude damps out at adepth of approximately 10 m and is insignificant below this depthwhere the bulk of the flow deformation takes place.
Fig. 4. Flow velocity (mm/yr) as a function of ice thickness (m) and surface slope (%) for a temperature of 215 K (left), 225 K (middle), and 235 K (right) from Eq. (4) with anArrheniusly-activated flow constant, A, illustrating the strong dependence of velocity on surface slope, ice thickness, and temperature. The horizontal axis is ice thickness,and the vertical axis is surface slope, so lowest velocities are in the lower left, corresponding to cold, thin ice, and highest velocities are on the right for warm, thick ice. Theheavy solid line in each figure indicates a velocity of 1 mm/yr.
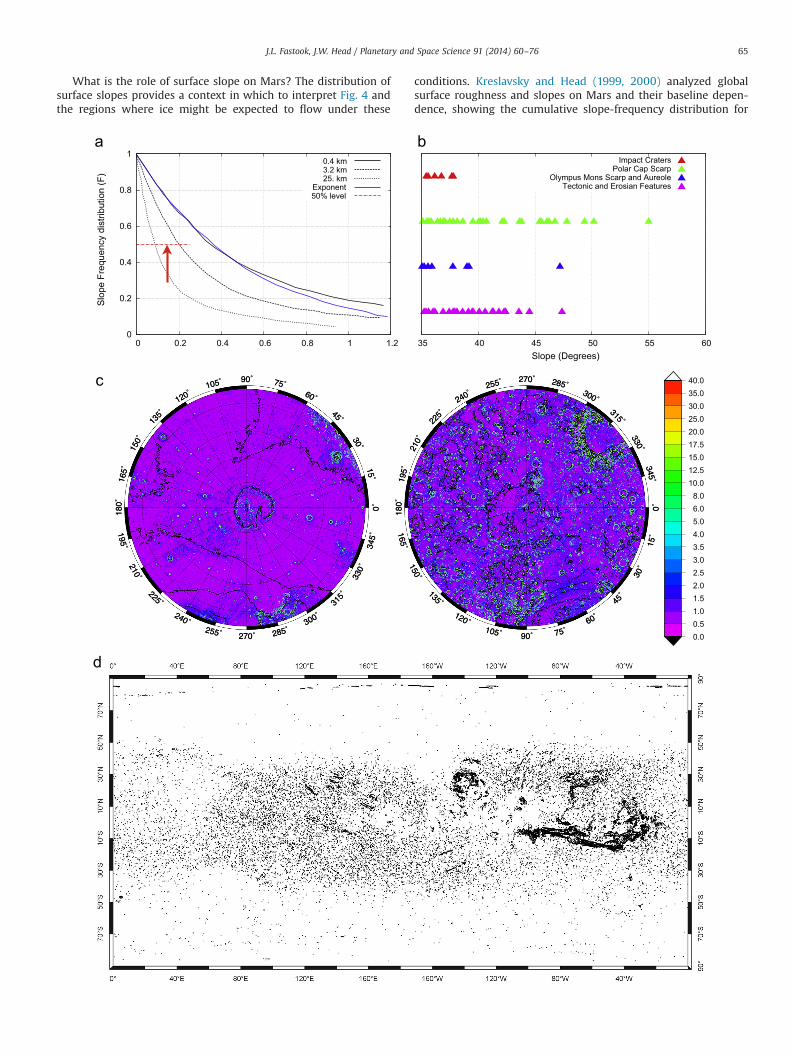
Fig. 5. Part 1. Slope distributions on Mars (Kreslavsky and Head, 1999, 2000). (a) Cumulative global slope-frequency distribution (F) for three baseline lengths, 0.4 km, 3.2 km and25 km. Line labeled Exponent show an approximation of the 0.4 km baseline slope distribution with an exponential distribution function. Arrow indicates the definition of medianslope. From Kreslavsky and Head (1999). (b) The steepest point-to-point slopes on Mars, from MOLA data, classified according to geologic features. From Kreslavsky and Head (1999).(c) Global distribution of slopes on Mars (MOLA gridded data, meg0031t.grd, 1.87m/min resolution), northern hemisphere on the left, southern hemisphere on the right. Note that thevast majority of the northern hemisphere slopes are less than 21, and that similar low slopes are seen throughout the southern uplands in intercrater areas. Slopes in excess of 51 areseen primarily in the interior of impact craters. (d) Distribution of MOLA point-to-point slope differences in the 301–351 range; note that the distribution of slope differences with thesehigh values are very latitude-dependent, with an extreme dropoff in steep slopes at latitudes higher than 301–351 in both hemispheres. Part 2. Regional slope maps for parts of thenorthern and southern mid-high latitudes of Mars. Map is MOLA hillshade map with all slopes 451 colored blue. Note that virtually all slopes 451 lie within the interiors of impactcraters along steep inner crater walls, below the rim crest. (e) Northern lowlands; southern Utopia Planitia, centered at 1131E, 441N. (f) Southern uplands near East of Hesperia Planum,centered at 1321E, 301S. (g) Southern uplands in eastern Arabia Terra, centered at 391E, 321N. (For interpretation of the references to color in this figure legend, the reader is referred tothe web version of this article.)
J.L. Fastook, J.W. Head / Planetary and Space Science 91 (2014) 60–7664
What is the role of surface slope on Mars? The distribution ofsurface slopes provides a context in which to interpret Fig. 4 andthe regions where ice might be expected to flow under these
conditions. Kreslavsky and Head (1999, 2000) analyzed globalsurface roughness and slopes on Mars and their baseline depen-dence, showing the cumulative slope-frequency distribution for
0
0.2
0.4
0.6
0.8
1
0 0.2 0.4 0.6 0.8 1 1.2
Slo
pe F
requ
ency
dis
tribu
tion
(F)
0.4 km3.2 km25. km
Exponent50% level
0.00.51.01.52.02.53.03.54.05.06.08.0
10.012.515.017.520.025.030.035.040.0
35 40 45 50 55 60Slope (Degrees)
Impact Craters Polar Cap Scarp
Olympus Mons Scarp and Aureole Tectonic and Erosian Features
J.L. Fastook, J.W. Head / Planetary and Space Science 91 (2014) 60–76 65
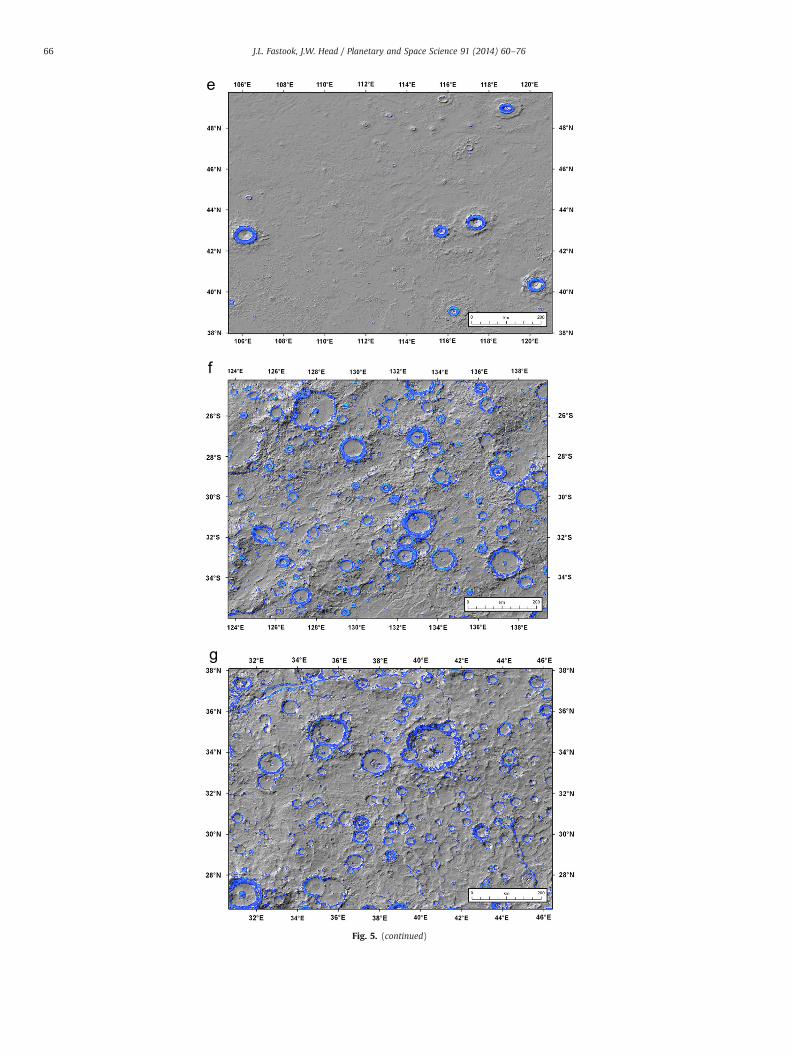
Fig. 5. (continued)
J.L. Fastook, J.W. Head / Planetary and Space Science 91 (2014) 60–7666
baselines at 0.4, 3.2 and 25 km (Fig. 5a). Clearly, the vast majorityof slopes at these baseline lengths are less than 1–21. At the otherend of the spectrum, the steepest point-to point slopes on Mars(Fig. 5b) occur in association with three major types of features;(1) polar cap scarps can range up to 351–551, testimony to theresistance to flow of ice under current Mars polar conditions;(2) tectonic features, typically linear scarps and related erosionalfeatures, such as the walls of Valles Marineris and the dichotomyboundary, can exceed 351; and (3) impact craters also containslopes in excess of 351. The global distribution of these slopes(Fig. 5c and d) illustrates these associations. The vast majority ofthe surface is characterized by slopes of less than 11–21, even inthe much more heavily cratered southern uplands (Fig. 5c), andthe steepest slopes are concentrated in the equatorial regions(Fig. 5d) in contrast to the mid- to high-latitudes, where regionalice-related deposits dominate (Fig. 1). Detailed analysis of slopes inthree specific areas (Fig. 5e–g) shows that steeper slopes in excessof a few degrees are very highly concentrated in crater interiors,specifically on the upper parts of interior crater walls.
Returning to ice-flow velocities (Fig. 4), at 215 K, a mean-annual temperature typical of the current climate on Mars atmid-latitudes (Haberle et al., 2003), low surface slopes (�11)typical of the flat inter-crater terrain (Kreslavsky and Head, 1999,2000) (Fig. 5) require a considerable thickness of ice (800–1000m) toinitiate flow. Only for considerably greater surface slopes (451) isthere any significant flow for ice thicknesses of 200 m, and suchslopes are not common on typical geological feature baselines(�1 km; Fig. 5a). Even at slopes as high as 201 (typical of interiorcrater walls, Fig. 5b–f; Kreslavsky and Head, 2006) a 50 m icethickness only yields ice flow rates of �0.2 mm/yr (Fig. 4). Warmingthe mean annual temperature to 225 K softens the ice and increases
all velocities by a factor of 4, reducing the threshold for 200 m to aslope of 3.51. A further increase to 235 K reduces the necessary slopeto 2.21; nonetheless, a 100 m thick accumulation of ice still requires aslope greater than 51 (Fig. 4) to generate flow, and even under thesecircumstances, the flow velocity is only 1 mm/yr, considerably slowerthan any known glacial ice flow on Earth.
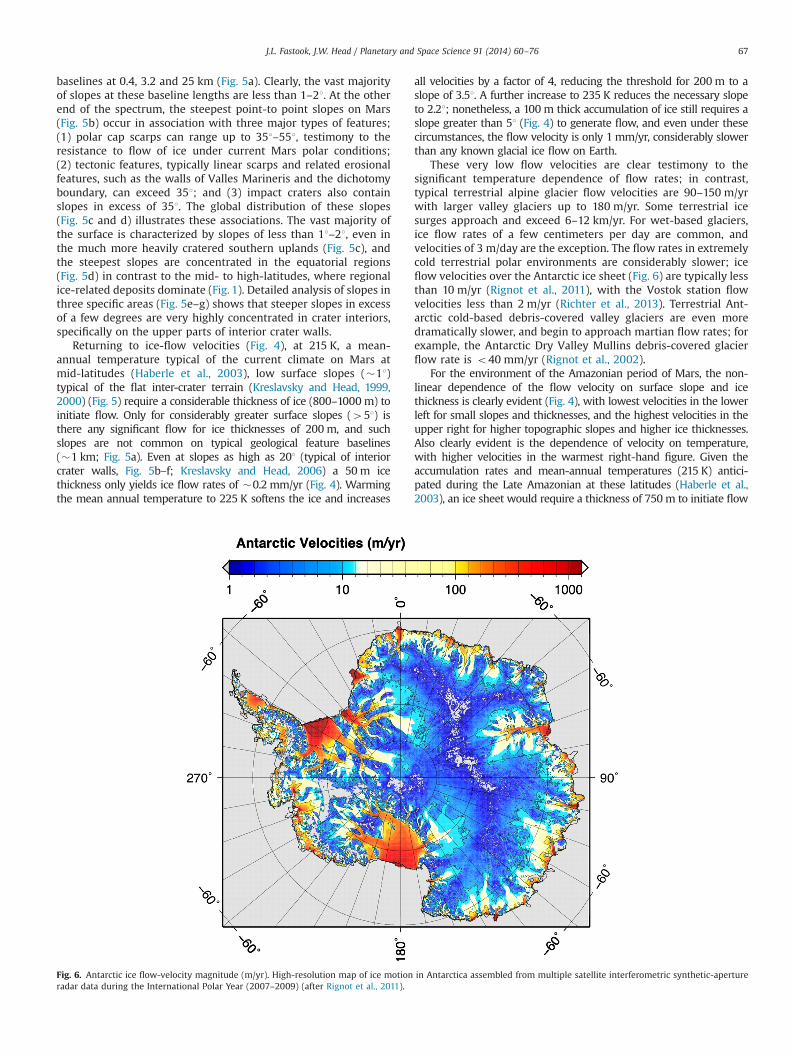
These very low flow velocities are clear testimony to thesignificant temperature dependence of flow rates; in contrast,typical terrestrial alpine glacier flow velocities are 90–150 m/yrwith larger valley glaciers up to 180 m/yr. Some terrestrial icesurges approach and exceed 6–12 km/yr. For wet-based glaciers,ice flow rates of a few centimeters per day are common, andvelocities of 3 m/day are the exception. The flow rates in extremelycold terrestrial polar environments are considerably slower; iceflow velocities over the Antarctic ice sheet (Fig. 6) are typically lessthan 10 m/yr (Rignot et al., 2011), with the Vostok station flowvelocities less than 2 m/yr (Richter et al., 2013). Terrestrial Ant-arctic cold-based debris-covered valley glaciers are even moredramatically slower, and begin to approach martian flow rates; forexample, the Antarctic Dry Valley Mullins debris-covered glacierflow rate is o40 mm/yr (Rignot et al., 2002).
For the environment of the Amazonian period of Mars, the non-linear dependence of the flow velocity on surface slope and icethickness is clearly evident (Fig. 4), with lowest velocities in the lowerleft for small slopes and thicknesses, and the highest velocities in theupper right for higher topographic slopes and higher ice thicknesses.Also clearly evident is the dependence of velocity on temperature,with higher velocities in the warmest right-hand figure. Given theaccumulation rates and mean-annual temperatures (215 K) antici-pated during the Late Amazonian at these latitudes (Haberle et al.,2003), an ice sheet would require a thickness of 750 m to initiate flow
Fig. 6. Antarctic ice flow-velocity magnitude (m/yr). High-resolution map of ice motion in Antarctica assembled from multiple satellite interferometric synthetic-apertureradar data during the International Polar Year (2007–2009) (after Rignot et al., 2011).
J.L. Fastook, J.W. Head / Planetary and Space Science 91 (2014) 60–76 67
(Fig. 4) on these low regional slopes (Fig. 5). Even with softer ice atwarmer temperatures, a thickness of 500 m is required at 225 K, and370m is required at 235 K (Fig. 4).
Returning to the original question as to what thickness isrequired to initiate ice flow on a flat, inter-crater area (Fig. 5)under Late Amazonian environmental conditions (Fig. 4), weconclude that for the vast majority of regional slopes on Mars,no significant flow would occur unless ice thicknesses exceededmany hundreds of meters (�750 m).
2.2. Could the current Pd mean thickness value (�50 m) be theremnant thickness of equilibrium flow?
Could the regional ice layer have reached the requisite �750 mice thickness to initiate flow in the mid- to high-latitude plains,intercrater areas and within craters (equilibrium flow), and thenundergone sublimation to yield the remnant deposits seen today?One estimate of the average thickness of candidate Late Amazo-nian ice sheets is the height of scarps at the margins of pedestalcraters (Pd). Analysis of the distribution of Pd shows that the meanvalue of Pd scarp height is �50 m, interpreted to represent theregional thickness of ice deposits that characterized the mid- tohigh-latitudes during Pd formation (Kadish et al., 2009, 2010a;Kadish and Head, 2011b). During interglacial periods, the icebetween pedestal craters sublimated, leaving the height of thescarp as a proxy for ice thickness. Could this average �50 mthickness of the Pd layer instead be the last phase of a muchthicker persistent ice sheet that reached a configuration thatsupported flow (Fig. 3b)? Alternatively, could the average �50 mthickness of the Pd layer represent a transient, relatively thinice layer that covered the surface and locally deformed andflowed into crater depressions only where slopes are large enough(Fig. 3a)?
Evidence exists for the latter case (thin ice layer) in the form ofPedestal Craters, Perched Craters, and Excess Ejecta Craters describedin detail in Kadish et al. (2009, 2010a), Kadish and Head (2011b). Thesethree types of craters have been interpreted to be related to impactsinto an ice layer that is typically less than �60m thick (Fig. 7). Eachcrater type reflects differing degrees of impact penetration into thesubstrate, followed later by complete sublimation of any un-armoredregions of the ice deposit that were exterior to the crater deposits.Evidence for the repeated deposition and removal of such relativelythin ice layers is suggested by the �80m height difference observedbetween two pedestal craters (Pds) �20 km apart. In addition, 30 Pdcraters have superimposed Pds. For this to occur the first Pd wouldhave to impact into an ice layer and that entire ice layer outside thearmored zone would have to be removed. A second ice layer wouldhave to reform, and the superimposed Pd would impact into this newice layer, armoring it just as the first Pd armored the earlier layer.Subsequently all of this new ice layer outside its newly armored zonewould be removed, leaving the second Pd superimposed upon thefirst Pd. Clearly this requires that there be multiple episodes of ice-richlayer cover. An additional observation that suggests that these icelayers did not experience significant flow is the lack of any observedpedestal crater elongation or deformation (Kadish and Head, 2009,2011a, 2011b; Kadish et al., 2010a).
Additional evidence supporting the presence of regional ice layerscomes from general circulation model (GCM) results (Mischna et al.,2003; Levrard et al., 2004; Mischna and Richardson, 2005; Forgetet al., 2006; Levrard et al., 2007; Madeleine et al., 2009). These GCMspredict ice accumulation rates as high as 10 mm/yr during periods ofhigh obliquity, precisely in the mid-high latitudes where these cratersoccur. An important question is why the regional transient layerthickness apparently never greatly exceeds the �50m regionalsuggested by the current Pd thicknesses (Fig. 7), since GCM resultssuggest that a layer of this thickness could form in as little as 20 kyr, a
time period much shorter than the duration of single obliquityexcursions (�125 kyr).
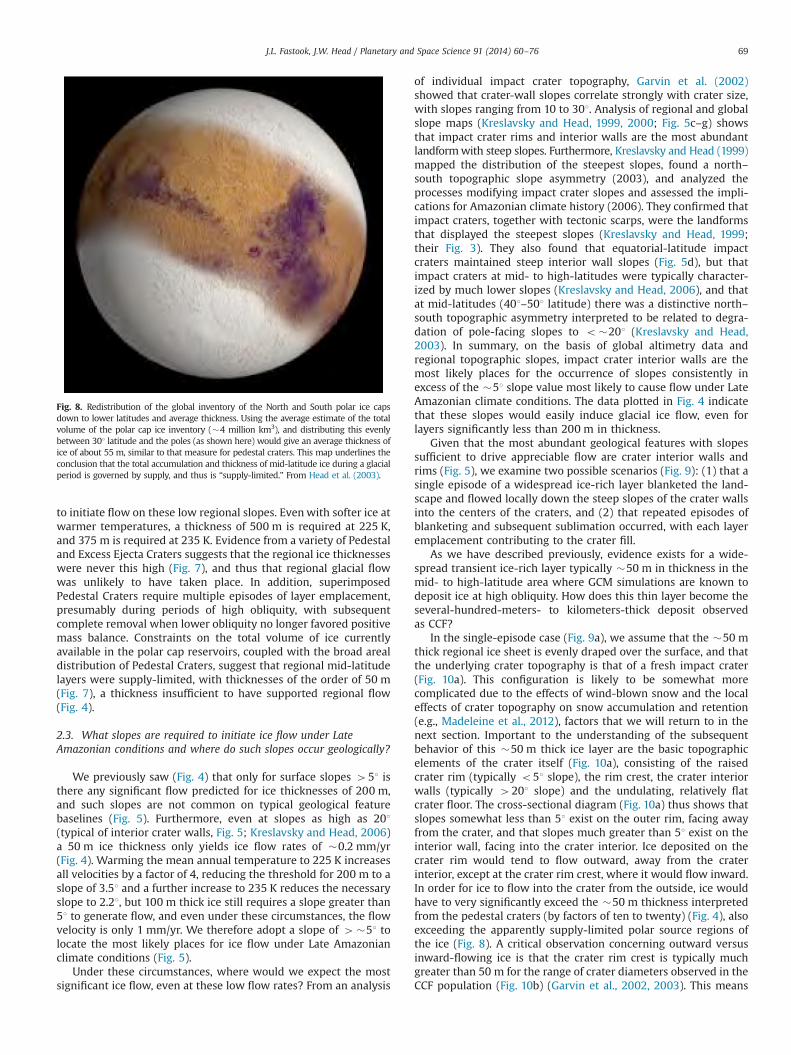
Estimates of the total volume of the global Pd-defined layerduring its regional latitude-dependent presence have been made(Kadish et al., 2009, 2010a; Kadish and Head, 2011b; Fastook andHead, 2013). These estimates are close to the known currentvolumes of the polar caps (Fastook and Head, 2013). Polar icedeposits are thought to be the main source of moisture for thehigher-obliquity mid-high latitude snow precipitation. Estimatesfor the combined current north and south polar cap volumes rangefrom a minimum of �3 million km3 to a maximum of �5 millionkm3 (see discussion in Fastook and Head, 2013). If an average ofthese two values for the entire volume of the current polar caps(�4 million km3) is spread evenly across the area known to becharacterized by pedestal craters and other mid- to high-latitudeice related deposits (from 301 to the poles; Fig. 1), the mean icedeposits thickness would be �55 m (Fig. 8). If the latitude-dependence is more limited, the mean thickness increases, but isstill well below thicknesses that would begin to induce glacial flowon the slopes characteristic of the plains and intercrater areas(Fig. 5). For example, if the total current polar ice supply isredistributed from 401 to the pole, the mean thickness is �77 m,and from 501 to the pole, �118 m (Fig. 8). We therefore suggestthat the transient ice layer is “supply-limited” in that when thesecaps are exhausted, the source is removed, and deposition ceaseseven if the obliquity is still high.
In summary, given the accumulation rates and mean-annualtemperatures (215 K) anticipated during the Late Amazonian atthese latitudes, an ice sheet would require a thickness of �750 m
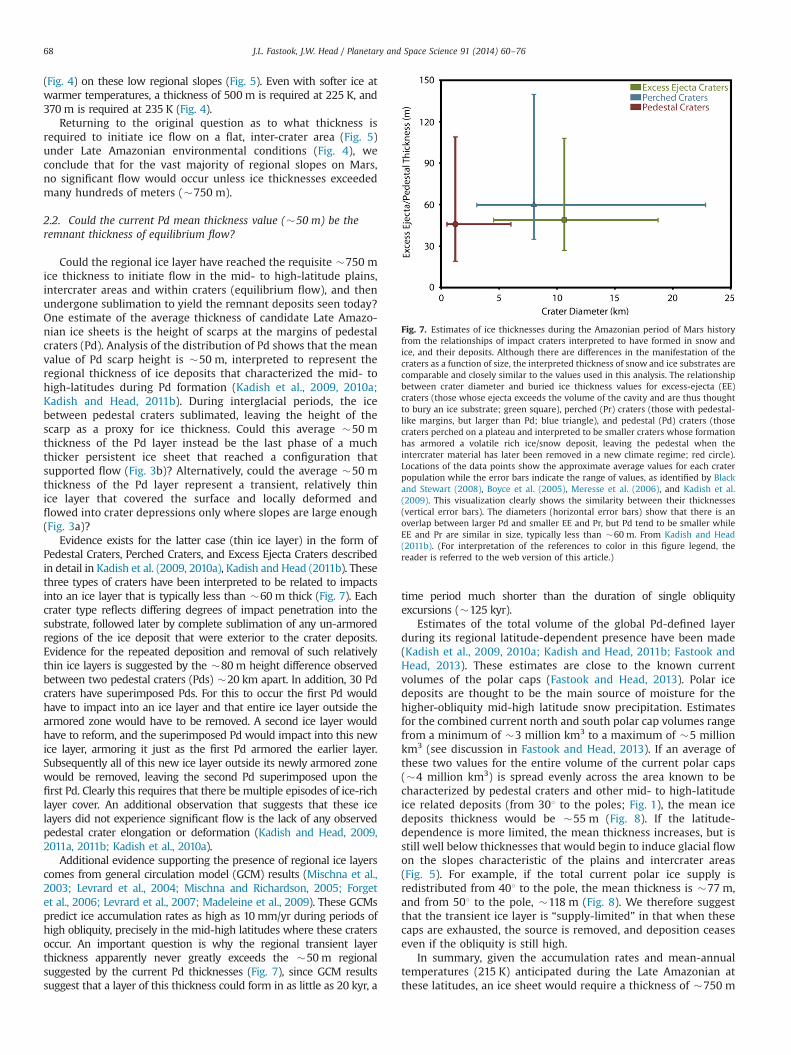
Fig. 7. Estimates of ice thicknesses during the Amazonian period of Mars historyfrom the relationships of impact craters interpreted to have formed in snow andice, and their deposits. Although there are differences in the manifestation of thecraters as a function of size, the interpreted thickness of snow and ice substrates arecomparable and closely similar to the values used in this analysis. The relationshipbetween crater diameter and buried ice thickness values for excess-ejecta (EE)craters (those whose ejecta exceeds the volume of the cavity and are thus thoughtto bury an ice substrate; green square), perched (Pr) craters (those with pedestal-like margins, but larger than Pd; blue triangle), and pedestal (Pd) craters (thosecraters perched on a plateau and interpreted to be smaller craters whose formationhas armored a volatile rich ice/snow deposit, leaving the pedestal when theintercrater material has later been removed in a new climate regime; red circle).Locations of the data points show the approximate average values for each craterpopulation while the error bars indicate the range of values, as identified by Blackand Stewart (2008), Boyce et al. (2005), Meresse et al. (2006), and Kadish et al.(2009). This visualization clearly shows the similarity between their thicknesses(vertical error bars). The diameters (horizontal error bars) show that there is anoverlap between larger Pd and smaller EE and Pr, but Pd tend to be smaller whileEE and Pr are similar in size, typically less than �60 m. From Kadish and Head(2011b). (For interpretation of the references to color in this figure legend, thereader is referred to the web version of this article.)
J.L. Fastook, J.W. Head / Planetary and Space Science 91 (2014) 60–7668
to initiate flow on these low regional slopes. Evenwith softer ice atwarmer temperatures, a thickness of 500 m is required at 225 K,and 375 m is required at 235 K. Evidence from a variety of Pedestaland Excess Ejecta Craters suggests that the regional ice thicknesseswere never this high (Fig. 7), and thus that regional glacial flowwas unlikely to have taken place. In addition, superimposedPedestal Craters require multiple episodes of layer emplacement,presumably during periods of high obliquity, with subsequentcomplete removal when lower obliquity no longer favored positivemass balance. Constraints on the total volume of ice currentlyavailable in the polar cap reservoirs, coupled with the broad arealdistribution of Pedestal Craters, suggest that regional mid-latitudelayers were supply-limited, with thicknesses of the order of 50 m(Fig. 7), a thickness insufficient to have supported regional flow(Fig. 4).
2.3. What slopes are required to initiate ice flow under LateAmazonian conditions and where do such slopes occur geologically?
We previously saw (Fig. 4) that only for surface slopes 451 isthere any significant flow predicted for ice thicknesses of 200 m,and such slopes are not common on typical geological featurebaselines (Fig. 5). Furthermore, even at slopes as high as 201(typical of interior crater walls, Fig. 5; Kreslavsky and Head, 2006)a 50 m ice thickness only yields ice flow rates of �0.2 mm/yr(Fig. 4). Warming the mean annual temperature to 225 K increasesall velocities by a factor of 4, reducing the threshold for 200 m to aslope of 3.51 and a further increase to 235 K reduces the necessaryslope to 2.21, but 100 m thick ice still requires a slope greater than51 to generate flow, and even under these circumstances, the flowvelocity is only 1 mm/yr. We therefore adopt a slope of 4�51 tolocate the most likely places for ice flow under Late Amazonianclimate conditions (Fig. 5).
Under these circumstances, where would we expect the mostsignificant ice flow, even at these low flow rates? From an analysis
of individual impact crater topography, Garvin et al. (2002)showed that crater-wall slopes correlate strongly with crater size,with slopes ranging from 10 to 301. Analysis of regional and globalslope maps (Kreslavsky and Head, 1999, 2000; Fig. 5c–g) showsthat impact crater rims and interior walls are the most abundantlandformwith steep slopes. Furthermore, Kreslavsky and Head (1999)mapped the distribution of the steepest slopes, found a north–south topographic slope asymmetry (2003), and analyzed theprocesses modifying impact crater slopes and assessed the impli-cations for Amazonian climate history (2006). They confirmed thatimpact craters, together with tectonic scarps, were the landformsthat displayed the steepest slopes (Kreslavsky and Head, 1999;their Fig. 3). They also found that equatorial-latitude impactcraters maintained steep interior wall slopes (Fig. 5d), but thatimpact craters at mid- to high-latitudes were typically character-ized by much lower slopes (Kreslavsky and Head, 2006), and thatat mid-latitudes (401–501 latitude) there was a distinctive north–south topographic asymmetry interpreted to be related to degra-dation of pole-facing slopes to o�201 (Kreslavsky and Head,2003). In summary, on the basis of global altimetry data andregional topographic slopes, impact crater interior walls are themost likely places for the occurrence of slopes consistently inexcess of the �51 slope value most likely to cause flow under LateAmazonian climate conditions. The data plotted in Fig. 4 indicatethat these slopes would easily induce glacial ice flow, even forlayers significantly less than 200 m in thickness.
Given that the most abundant geological features with slopessufficient to drive appreciable flow are crater interior walls andrims (Fig. 5), we examine two possible scenarios (Fig. 9): (1) that asingle episode of a widespread ice-rich layer blanketed the land-scape and flowed locally down the steep slopes of the crater wallsinto the centers of the craters, and (2) that repeated episodes ofblanketing and subsequent sublimation occurred, with each layeremplacement contributing to the crater fill.
As we have described previously, evidence exists for a wide-spread transient ice-rich layer typically �50 m in thickness in themid- to high-latitude area where GCM simulations are known todeposit ice at high obliquity. How does this thin layer become theseveral-hundred-meters- to kilometers-thick deposit observedas CCF?
In the single-episode case (Fig. 9a), we assume that the �50 mthick regional ice sheet is evenly draped over the surface, and thatthe underlying crater topography is that of a fresh impact crater(Fig. 10a). This configuration is likely to be somewhat morecomplicated due to the effects of wind-blown snow and the localeffects of crater topography on snow accumulation and retention(e.g., Madeleine et al., 2012), factors that we will return to in thenext section. Important to the understanding of the subsequentbehavior of this �50 m thick ice layer are the basic topographicelements of the crater itself (Fig. 10a), consisting of the raisedcrater rim (typically o51 slope), the rim crest, the crater interiorwalls (typically 4201 slope) and the undulating, relatively flatcrater floor. The cross-sectional diagram (Fig. 10a) thus shows thatslopes somewhat less than 51 exist on the outer rim, facing awayfrom the crater, and that slopes much greater than 51 exist on theinterior wall, facing into the crater interior. Ice deposited on thecrater rim would tend to flow outward, away from the craterinterior, except at the crater rim crest, where it would flow inward.In order for ice to flow into the crater from the outside, ice wouldhave to very significantly exceed the �50 m thickness interpretedfrom the pedestal craters (by factors of ten to twenty) (Fig. 4), alsoexceeding the apparently supply-limited polar source regions ofthe ice (Fig. 8). A critical observation concerning outward versusinward-flowing ice is that the crater rim crest is typically muchgreater than 50 m for the range of crater diameters observed in theCCF population (Fig. 10b) (Garvin et al., 2002, 2003). This means
Fig. 8. Redistribution of the global inventory of the North and South polar ice capsdown to lower latitudes and average thickness. Using the average estimate of the totalvolume of the polar cap ice inventory (�4 million km3), and distributing this evenlybetween 301 latitude and the poles (as shown here) would give an average thickness ofice of about 55 m, similar to that measure for pedestal craters. This map underlines theconclusion that the total accumulation and thickness of mid-latitude ice during a glacialperiod is governed by supply, and thus is “supply-limited.” From Head et al. (2003).
J.L. Fastook, J.W. Head / Planetary and Space Science 91 (2014) 60–76 69

that unless there is an anomalously low depression in the rim crestcontinuity, any flow from a snow/ice mantling deposit will alwaysbe outward from the region of the upraised rim. Since there isunlikely to be any significant exposed bedrock to act as sources ofdebris for these icy rim deposits, a debris cover that mightpreserve the ice deposits subsequent to the glacial period, whenthe regional snow and ice deposit sublimated away, is not likelyto form.
Clearly, the distribution of slopes (Fig. 10a) heavily favors theflow of ice from the rim crest and inner wall into the interior ofthe crater. For the single layer uniform blanket case (Fig. 9a), ice atthe top of the crater wall thins as ice flows down the crater walls(Fig. 9a and b), leading to a local inward-sloping surface that mightdraw some ice inward from the immediate rim crest area for a veryshort period of time, but is unlikely to draw in significant amountsdue to the relatively thin mantle and the outward-sloping rim
topography. Flow of ice from the steep inner wall will beaccompanied by mass wasting of rocks and soil from the exposedcrater wall (Fig. 9b), beginning a process of debris cover (Fastooket al., 2013). Despite the availability of steep slopes to induceinward ice flow, and the very slow predicted flow rates, thesupply-limited nature of this scenario (Figs. 9 and 10) means thatthe crater can only be partially filled (Fig. 9c) by a single layer of�50 m thickness. Model results in the next section will help toquantify this time scale.
In the multiple-episode example (Fig. 9d), we consider thesame type of transient layer that uniformly blankets the terrainand, as with the single-episode case, flows down the steep innerwalls into the crater interior, thickening the deposit there (Fig. 9dand e). When the climate changes and the blanketing layersublimates away, the thicker deposit in the crater interior is lesslikely to be completely removed (Fig. 9e). One reason is that thelayer has been thickened by flow down the steep slopes of thecrater walls. More importantly, however, the deposit in the craterinterior can be armored by debris accumulating on its surfacederived from the crater walls, significantly inhibiting sublimation.
Fig. 10. Guidelines for locations of potential ice flow in typical impact craters.(a) Topographic profile (black line) for the crater from Fig. 2. Exterior rim slopes(blue line) face outward and are less than �51, while inner wall slopes face inwardand are in excess of 101, up to �201 (also see Fig. 5). For exterior ice to flow into thecrater, it must be thicker than �200 m to be able to flow over the raised rim intothe interior. Ice flow is thus favored on the inner crater wall slopes. (b) Crater rimheights relative to the surrounding exterior terrain. The rim heights of impactcraters more than 2–3 km in diameter are in excess of the �50 m snow/icemantling layer mean thickness measured from the heights of pedestal crater scarps(e.g., Kadish et al., 2009, 2010a). This suggests that only under very exceptionalcircumstances (e.g., a rim/rim crest breach) could a regional ice deposit flow intoimpact crater interiors. Data from Craddock et al. (1997) and Garvin et al. (2003).(For interpretation of the references to color in this figure legend, the reader isreferred to the web version of this article.)
Fig. 9. Two models for the duration of formation of interior concentric crater fill.In (a), a uniformly thick 50 m snow and ice layer is deposited over the craterlandform during a single obliquity excursion. The presence of steep inner wallslopes means that flow initiates there (b) even with the relatively thin ice cover,and glacial flow extends down the crater walls toward the crater floor; ice on therim is too cold to flow on the shallow slopes. At the end of this glacial phase,sublimation removes the ice layer, except where is has been thickened by flow andcovered by wall slope debris (c). Mass balance calculations show that the single 125thousand year long 50 m thick depositional event alone is insufficient to form asignificant deposit of CCF inside craters. Deposition of a new layer (d), however, willcause flow of the new ice on the steep upper slopes and rejuvenate downslopemovement of the entire debris-covered glacier toward the crater center (e).Multiple glacial periods of progressive deposition of ice and its preferentialmovement downslope cause the debris-covered glacier to move toward the cratercenter, converge, and fill the crater floor (f).
J.L. Fastook, J.W. Head / Planetary and Space Science 91 (2014) 60–7670

This mechanism of debris accumulation on the ice surface hasbeen used to describe a formation mechanism for lobate debrisaprons (Fastook et al., 2013) and is supported by terrestrialevidence from debris-covered glaciers in the Dry Valleys, Antarctica(Marchant and Head, 2007; Marchant et al., 2002, 2007;Kowalewski et al., 2011). On the basis of this scenario, mantlinglayer formation and removal happens many times (Fig. 9f), with thelayer repeatedly forming, flowing, and then sublimating away inthe crater exterior and the non-mantled part of the crater interior.In this obliquity-driven movement of water ice to and from themid-high latitudes, a small amount of ice is deposited in the craterinterior depressions in each cycle, having accumulated there byflow down the steep slopes of the crater walls, and then beingpreserved by increasing debris cover (Fig. 9f). Model results in thenext section quantify the time scale of this process.
2.4. What was the nature of snow and ice cover and glaciationduring periods of maximum ice accumulation in the Late Amazonian?
On the basis of our analysis thus far, what can we say about thetransient inter-crater glacial ice cover and the distribution ofglaciation in areas of steeper slopes, such as crater interiors? Wehave ruled out the presence of a many hundreds of meters thickpersistent regional ice sheet based on the excessive volume of icethat would be required relative to its assumed source in thecurrent polar caps. We have also seen that the observed pedestalcrater thickness (�50 m) would not result in glacial flow in theintercrater areas, but could produce flow on the steep slopesassociated with crater interior walls (Figs. 9 and 10). Flow shouldbe limited to these crater rim crests and interior walls; theoutward-sloping nature of the raised crater rim suggests thatany ice deposits there would flow outward, if they flowed at all.Thus, the most likely region for preservation of glacial depositsduring mid- to high-latitude glacial periods are crater interiors,due to their steep slopes (Fig. 5), and to the availability of debris onthe crater walls to enhance preservation of the ice in interglacialperiods. Using this background scenario, we ask the followingquestions: What would these deposits look like if they wereproduced by a single, transient episode of relatively thin ice-richlayer deposition that deformed as it flowed into the crater interiorfrom the wall? Is this sufficient to produce the observed features,or were there multiple episodes of ice-layer deposition thatformed and disappeared repeatedly? How often would suchevents be likely to form and with what frequency?
Detailed dating of pedestal craters (Kadish et al., 2010b; Kadish,2011) provides an estimate of their formation time as well as howfrequently and for how long the ice layer represented by thepedestal remnant had to be in place for the observed distributionof Pds to be produced. The best fit formation time for the observeddistribution of Pds is �90 Myr, but this may be a cumulative time,with the actual formation possibly spread out over a much longertime due to the coming and going of the ice-rich layer. Crater size-frequency distribution data on the Pd surface from HiRISE/CTXimage data (Kadish et al., 2010b; Kadish, 2011) yields individualages from 1 Myr to 3.6 Gyr, with a median of 140 Myr, and with70% less than 250 Myr old. Of note is the fact that during theperiod 25 Myr to 175 Myr (a 150 Myr time period) there is at leastone Pd emplaced every 15 Myr. The pattern that emerges is thatthe pedestal craters were likely to have been emplaced into afluctuating ice layer with a period that is no longer than approxi-mately 15 Myr. Assuming (1) this periodicity, (2) the 90 Myrnecessary to form the pedestal craters, and (3) that mass balancevariation is approximately sinusoidal (half accumulation, halfablation), we arrive at �180 Myr (12 cycles).
Given these guidelines, and our goal of understanding thedifference between the single and multiple episode cases (Fig. 9),
we turn to a 1D flowband model based on the University of MaineIce Sheet Model (UMISM) (Fastook, 1993; Fastook et al., 2004,2008). UMISM is a shallow-ice model that we have coupled withan advection-based model of surface debris transport. Wheneverthe ice surface drops below the crater rim crest, we assume thatdebris is deposited locally on the ice surface in the crater interior,and that the debris is then transported forward with the move-ment of the downward and inward-flowing ice. UMISM is fullytime-dependent and can track the evolution of the ice surface as itresponds to changing climate. To characterize these two cases weperform experiments to see how long it takes for the crater to fillto a level that matches an observed CCF crater (Levy et al., 2010a)shown in Fig. 2. The white line in Fig. 2a indicates the track A–A0–A″shown as an HRSC DTM profile in Fig. 2b. The inset in Fig. 2b showsan estimated unfilled crater shape and the potential depth of CCF(Garvin et al., 2002).
For the single-episode case, we model a rimless crater tooptimize filling from the outside and to simulate older craterswith degraded or missing rim crests. As we discussed previously,the ice layer must overtop the rim crest in order for ice to flow infrom the surrounding intercrater terrain to supply ice to fill thecrater. If the only source is the ice on the rim crest, it is impossibleto fill the crater to the observed level. Alternatively, one may thinkof the ice thickness as being the amount by which the layer mustexceed the rim crest height. We begin with a blanketing layer withtwo values: first, a uniform thickness of 200 m, and secondly, withthe typical average Pd crater pedestal heights of �50 m. In bothcases, we hold the thickness to be fixed at the boundary of ourmodel domain. Holding the boundary thickness fixed is equivalentto providing an infinite reservoir of ice that can flow into themodel domain to replenish that which has flowed into the crater.As ice is removed from the top of the crater wall as it flows downinto the crater, the lowered surface provides a sloping surface fromthe fixed domain edge that can draw ice from outside the modeldomain. A comparison between the model results (black) and theobserved CCF crater profile (red) is shown in Fig. 11a. At atemperature of 215 K this process takes �1.1 Gyr for the modelcrater to fill to the level in the CCF crater, approximately 800 mthick. Warmer temperatures would accelerate this filling process;if the temperature were raised to 225 K, rates would increaseby a factor of 4 with a 250 Myr filling time. Warming to 235 Kyields another factor of 4, with a filling time of 65 Myr. On theother hand, in the second case, the use of a lower layer thicknessmore in keeping with that indicated by the Pedestal Craters(�50 m) increases the filling time to the point where the craterwas only 6% full after 3 Gyr (where 50% is the target fill percentagerequired to match the CCF crater from Fig. 2). In summary, giventhe excessively long time required for the crater to fill to anappropriate level, we interpret this candidate scenario as beingunrealistic for CCF formation. More importantly, if we relax theconstraint of having boundary thickness fixed (equivalent toproviding an infinite ice reservoir from the crater rim), it is clearthat although ice flow from upper wall sources will still be veryslow by terrestrial standards, the process is completely supply-limited and the crater will never fill to the observed level in asingle phase. Fig. 11a shows the level of crater floor fill after 1.1 Gyrat 215 K; in the final state, the initial �200 m thick uniformblanketing layer has formed an �800 m thick layer on the craterfloor that is almost exclusively ice that flowed in from thepersistent 200 m on the intercrater terrain. Since the ice layer ispersistent and continuous even as it flows down the crater walls,less debris is deposited on its surface.
For the multiple-episode case (Fig. 9d–f) we subject this icesheet/debris model to a climate driven using an obliquity scenarioshown in Fig. 12 (Laskar et al., 2004), with repeated cycles of ice-layer formation during the Amazonian when the pedestal craters
J.L. Fastook, J.W. Head / Planetary and Space Science 91 (2014) 60–76 71

formed (Kadish et al., 2010b; Kadish, 2011). Obliquity predictionsare only robust for the last 20 Ma, prior to which the solutions arechaotic (i.e., extremely sensitive to initial conditions, but notrandom). The chosen scenario is one in which the mean obliquityis relatively high from 40 Myr until 5 Myr, at which point it dropsto its current value. Fig. 12b shows an enlargement of thetransition period from 7.5 to 2.5 Myr. We chose an obliquitythreshold of 351, above which we consider the ice layer to havea positive mass balance of 1 mm/yr, typical of GCM results for highobliquity (Forget et al., 2006; Madeleine et al., 2009), and belowwhich we ablate the ice, with the rate depending on the amount ofdebris armoring the surface (e.g., Fastook et al., 2013). Prior to5 Myr, the mean obliquity is above this threshold, although thereare regular excursions to lower obliquity during which theunarmored portion of the layer would partially or completelysublimate away. After 5 Myr, the mean obliquity drops below the351 threshold, although there continue to be briefer and lessfrequent excursions above the threshold, during which an icelayer is deposited. Note that after 3 Myr there are no furtherobliquity excursions that exceed the threshold, and that the icelayer is in a continual state of sublimation.
We limit the deposited layer to a specified thickness of 50 m byturning off the accumulation when the layer volume has reachedits “supply-limited” value. Again, we use a rimless topography,since in the case of episodic layer formation, the source of the icethat flows into the crater will be that deposited on the steep craterwalls as the layer is draped over the terrain during each of manyepisodes. Even at a temperature of 215 K, ice is able to flow downthe steep slopes of the crater walls into the crater interior,resulting in thicker ice there and thinner ice on the slopes andinter-crater terrain. During low obliquity periods of negative massbalance (Fig. 9c), ice on the steeper unarmored slopes (and rimand inter-crater terrain) may be entirely removed, but the thickerice in the crater interior, now below the height of the crater wallsand subject to being covered by armoring debris from those walls,may not all be removed and the crater can fill with ice andtransported debris (Kress and Head, 2008). Indeed, as much at 3%of the crater volume can be deposited in each obliquity episodethat exceeds the threshold, rapidly filling the crater to its rim.What is deposited in the crater must, however, survive the periodof continuous sublimation that occurs after 3 Myr (Fig. 12) whenthere are no obliquity episodes that exceed the threshold. Thestart-and-stop nature of the forward motion of the ice dictatesthat the transported debris layer will not be uniform in thickness.
Fig. 11. Glacial ice surface (blue-dashed lines) filling a crater interior (assumedprofile as a black line) for different formation assumptions, compared with thesurface of the CCF-containing crater (surface as a red line, see Fig. 2 and Levy et al.2010a). (a) Comparison between simulated crater filling from a persistent 200 mlayer after 1.1 Gyr. (b) Simulated crater driven by the 301003BIN_A_P001_Nobliquity solution (Laskar et al. 2004) with an additional green line showing thesurface with its accumulated debris cover. The excess time required for formationwith a persistent layer argues against this (a) scenario. The obliquity-drivenscenario (b) fills the crater in just 50 Myr, and in addition, the start-stop natureand accumulated debris from the crater walls generates a non-uniform surfacesimilar to that observed in CCF-containing craters. (For interpretation of thereferences to color in this figure legend, the reader is referred to the web versionof this article.)
Fig. 12. Laskar et al. (2004) obliquity scenario 301003_BIN_A_P001_N. (a) Obliquity for the last 50 Ma predicted in this scenario. (b) Obliquity for the period 7.5 Ma to 2.5 Mapredicted in this scenario, indicated with grey vertical band in (a). During this period the mean obliquity shifts from high to low. The horizontal green line shows the 351obliquity threshold above which an ice layer is deposited. (For interpretation of the references to color in this figure legend, the reader is referred to the web version of thisarticle.)
J.L. Fastook, J.W. Head / Planetary and Space Science 91 (2014) 60–7672

The final state of this 50 Myr simulation, driven by the obliquitysignal of Fig. 12, is shown in Fig. 11b. The �800 m of fill is attainedin less than one-twentieth the time it takes for an infinitepersistent layer to flow into the crater to a comparable depth(Fig. 11a). For comparison, in an analysis of the generation ofdebris cover on lobate debris aprons, Fastook et al. (2013)estimated a time of �400–500 kyr between the point that areceding regional ice sheet first exposed bedrock outcrop at thedichotomy boundary, and complete debris cover of the lobatedebris apron. The cyclic, start-and-stop nature of this process isvery likely to be directly correlated with formation of the con-centric ridges observed in the CCF (Fig. 2a), a correlation alsosuggested for very slow moving debris-covered glaciers in theAntarctic Dry Valleys (e.g., Marchant et al., 2010; Shean et al.,2007b; Shean and Marchant, 2010).
Since sufficient ice is deposited at each episode even at 215 K,and since the episodes are so frequent and short in duration,warmer temperatures have little effect on the formation time. Thewarmer ice simply flows down the crater walls into the interiorthat much faster. Since there is no inflow from outside the craterrim crest, the only contribution to the interior is that portion of thelayer deposited on the steep crater wall. A reasonable fit to the CCFcrater surface can be obtained by starting the simulation as late at10 Myr, but knowing that the obliquity solution is robust at leastback to 20 Myr, and given our understanding of the formationtimes of the Pd (Kadish et al., 2010b; Kadish, 2011), we have takena conservative course, and demonstrate that this mechanism canbe started as far back as 50 Myr and still obtain a good fit to thepresent configuration.
3. Summary of analysis of key questions
In summary, snow and ice cover and glaciation during periodsof maximum ice accumulation in the Late Amazonian appear to becharacterized by episodic regional (mid- to high-latitude) depositsof snow and ice, of the order of 50 m thickness. The small regionalthicknesses, and the temperature-dependent rheology of ice andits extremely slow flow under typical Late Amazonian conditions(Fig. 4), mean that slopes steeper than typical intercrater regions(Fig. 5) are required to induce flow. The global distribution ofslopes shows that the steep slopes conducive to glacial ice flow arefound primarily within crater interiors (the steep crater interiorwalls below the rim crest) (Fig. 5c–g). The typical rim crest heightand the outward facing slopes of the uplifted rim and crater ejectatopography (Fig. 10) mean that any flow induced on these slopes isvery likely to be away from the crater, not into the crater. Thus,glacial flow in the Late Amazonian is likely to be concentrated inmicroenvironments in crater interiors, as snow and ice depositspreferentially flow down the steep interior wall slopes.
This particular crater interior microenvironment is also con-ducive to the preferential preservation of the deposition and flowof glacial ice because of the close proximity of armoring materialin the steepest parts of the crater walls. Mass wasting of fracturedand fragmented uplifted target material and crater rim ejectaprovides a ready source of debris from some of the steepest slopeson Mars. Deposition of talus onto the accumulating and flowing iceprovides a rock and soil debris cover that will become concen-trated into a sublimation till cover through sublimation of ice;thickening of the debris-rich sublimation till will progressivelyretard or halt ice-loss in periods of net regional sublimation,preserving the ice below. This process is likely to vary along theflow direction, as observed in terrestrial debris-covered glaciers(Marchant et al., 2010), with newly deposited ice having the littleto no sublimation till and earlier deposited ice being covered witha progressively thickening sublimation till.
This formation scenario predicts that: (1) ancient glacial ice will bepreserved preferentially at the base of crater interior walls as it flowsfrom the steep walls to the floor, (2) this ice will be characterized by adebris cover shed from the steep interior walls, with more pure icetoward the proximal accumulation zone and debris concentrated inthe distal parts in progressively thicker sublimation tills, (3) thesedebris-covered glaciers should reflect the waxing and waning ofglacial conditions through surface textures and concentric ridgesrepresenting greater and lesser debris cover, sublimation and flowrates, (4) in major interglacial periods, these debris-covered glaciersare likely to be one of the most prominent records of these glacialperiods due to their propensity to flow on steep slopes, and the readysupply of debris that armors the surface against ice-loss during theseinterglacials, (5) during interglacial periods, thinly covered ice in theproximal zones may sublime, creating spatulate depressions (Headet al., 2008) and when glacial conditions return, ice will againaccumulate and additional flow of the debris-covered glacier is likelyto occur, (6) due to the long-term constancy of the major topographicfeatures of Mars, concentric crater fill deposits are likely to be thepreferred sites of both formation and preservation of the record ofglacial epochs on Mars.
We have outlined a simple scenario for the formation andevolution of crater interior glacial deposits (concentric crater fill)derived from deposition of an initial �50m thick ice layer distributeduniformly across the crater interior, rim and intercrater regions (Fig. 9).Although this model has provided insight into the range of likelyglacial flow processes, their time-scales and their manifestation asdeposits, the actual scenario is likely to be more complicated andregionally varied. For example, the topographic configuration of animpact crater structure (raised rim and deep, steep walled interior) isnot likely to produce deposition of a passive draped layer of eventhickness. First, during glacial epochs, global insolation patterns andsurface temperatures (Haberle et al., 2003; Kreslavsky et al., 2008,their Fig. 6), and thus snow and ice emplacement patterns, will belocally influenced and modulated by the presence of this depression.Furthermore, regional weather trends, as well as surface wind velocityand direction, will influence total snow accumulation and locationwithin craters. For example, wind-blown snow will certainly result insignificant local deviations in snow thicknesses, favoring deposition inthe topographic traps of crater interiors. Craters themselves can alsocreate distinctive climate microenvironments (Madeleine et al., 2012)in which atmospheric temperature profiles can vary and locallyenhance or inhibit snow precipitation. Finally, preservation of snowand ice on yearly and longer time scales is clearly influenced by cratertopographic landforms and their relation to insolation geometry(Kreslavsky and Head, 2003; Kreslavsky et al., 2008; their Fig. 6), aswell as crater size, slopes (Kreslavsky and Head, 2006) and depth-diameter relationships (Beach and Head, 2012, 2013). Indeed, Dicksonet al. (2012) have shown that concentric crater fill deposits in the 451–601 latitude bands show concentric flow, while in the 251–451 latitudebands CCF flow directions are oriented asymmetrically, with polewardflow heavily favored, indicating a preference for ice preservation oncolder, pole-facing slopes.
4. Conclusions
We combined a variety of geological evidence (CCF character-istics, Pd thicknesses and distribution, current polar cap volumes,regional slopes) and ice flow-modeling approaches to address fourfundamental questions concerning the nature of Amazonian mid-to high-latitude glaciation on Mars in order to assess ice sources,ice accumulation patterns, and glacial flow and ice sequestrationin impact crater concentric crater fill. These questions included(1) What ice thickness is required to initiate ice flow on a flat, inter-crater area under Late Amazonian environmental conditions?
J.L. Fastook, J.W. Head / Planetary and Space Science 91 (2014) 60–76 73
(2) Could the current Pd mean thickness value (�50 m) be theremnant thickness of equilibrium flow? (3) What slopes arerequired to initiate ice flow under Late Amazonian conditionsand where do such slopes occur geologically? (4) What was thenature of snow and ice cover and glaciation during periods ofmaximum ice accumulation in the Late Amazonian?
Regional ice flow under Late Amazonian climate conditions(Fig. 4) requires ice thicknesses exceeding many hundreds ofmeters in the mid- to high-latitudes for slopes typical of the vastmajority of the surface of Mars (Fig. 5). This thickness, distributedacross the mid-latitudes (Fig. 8), is well in excess of the volumes ofavailable polar ice reservoirs. This indicates that although condi-tions for mid- to high-latitude glaciation may have long persisted,the process is “supply limited”, with a steady state reached (Fig. 8)when the polar ice cap water ice supply becomes exhausted.
Global slope analysis (Fig. 5) shows that impact craters are byfar the most abundant landform with associated slopes (interiorwalls) sufficiently high to induce flow under Late Amazonianclimate conditions. Furthermore, topographic slope data showthat Amazonian impact craters have been clearly modified, under-going crater interior slope reduction and shallowing of craterfloors. These trends are the predictable response of ice depositionand preferential accumulation and retention in mid- to high-latitude crater interiors during episodes of enhanced spin–axisobliquity. Flow from a single episode of an inter-crater terrainlayer compatible with Pedestal Crater deposit thicknesses(�50 m) is insufficient to fill craters in a time period compatiblewith the interpreted formation times of mantled ice layersbeneath pedestal craters. A representative obliquity solution(Fig. 12) driving an ice flow model shows that a cyclical patternof multiply recurring layers can both (1) fill the craters with asignificant volume of ice, and (2) transport debris from the craterwalls out into the central regions of the craters (Fig. 11b). Themodel predicts that the cyclical pattern of waxing and waningresults in a rippled pattern of surface debris extending out into thecrater interiors, comparable in appearance to concentric crater fillsurface textures. In this model, the accumulating ice forms amantling sublimation till layer that seals and sequesters it fromsignificant temperature variations at diurnal, annual and spin–axis/orbital cycle time scales. We have driven the simulation witha representative obliquity solution (Fig. 11b) where the layers areassumed to form when obliquity is above a 351 threshold, provid-ing insight into which of the many predicted solutions (e.g., Laskaret al., 2004) is the most likely to have occurred.
Observations suggest that this process has produced ancient icerecords preserved today below CCF crater floors. The lack of anyassociated meltwater features is evidence that the Late Amazonianclimate did not exceed the melting temperature in the mid- tohigh-latitudes for any significant period of time. This processimplies that continued sequestration of ice with time in CCF andrelated deposits (lobate debris aprons and lineated valley fill)further reduces the already supply-limited polar ice sources. Thissuggests that there has been a declining reservoir of available icewith each ensuing Late Amazonian glacial period. Concentriccrater fill deposits represent a candidate library of climate chem-istry and global change dating from the Late Amazonian, and anon-polar water resource for future exploration.
Acknowledgments
We gratefully acknowledge very helpful discussions with DavidMarchant, Joseph Levy, James Dickson and Caleb Fassett. We thankJames Dickson for assistance in analysis, and David K. Weiss andAnne Cote for help in figure preparation. We gratefully
acknowledge financial support for this research from the NASAMars Data Analysis Program through Grant NNX11A181G to JWH.
References
Baker, D., Head, J., Marchant, D., 2010. Flow patterns of lobate debris aprons andlineated valley fill north of Ismeniae Fosse, Mars: evidence for extensive mid-latitude glaciation in the Late Amazonian. Icarus 207 (1), 186–209, http://dx.doi.org/10.1016/j.icarus.2009.11.017.
Beach, M.J., Head, J.W., 2012. Debris-covered glacier deposits in a trio of impactcraters in the southern mid-latitudes of Mars: evidence for ice accumulationand intercrater flow in connected concentric crater fill. In: Lunar and PlanetaryScience Conference XXXXIII, Abstract #1140.
Beach, M.J., Head, J.W., 2013. Constraints on the timing of obliquity variationsduring the Amazonian from dating of glacial-related concentric crater filldeposits on Mars. In: Lunar and Planetary Science Conference XXXXIV, Abstract#1161.
Berman, D.C., Hartmann, W.K., Crown, D.A., Baker, V.R., 2005. The role of arcuateridges and gullies in the degradation of craters in the Newton Basin region ofMars. Icarus 178, 465–486, http://dx.doi.org/10.1016/j.icarus.2005.05.011.
Black, B.A., Stewart, S.T., 2008. Excess ejecta craters record episodic ice-rich layersat middle latitudes on Mars. J. Geophys. Res. 113, E02015, http://dx.doi.org/10.1029/2007JE002888.
Boyce, J.M., Mouginis‐Mark, P., Garbeil, H., 2005. Ancient oceans in the northernlowlands of Mars: evidence from impact crater depth/diameter relationships.J. Geophys. Res. 110, E03008, http://dx.doi.org/10.1029/2004JE002328.
Carr, M., Head, J., 2010. Geologic history of Mars. Earth Planet. Sci. Lett. 294 (3–4),185–203, http://dx.doi.org/10.1016/j.epsl.2009.06.042.
Craddock, R.A., Maxwell, T.A., Howard, A.D., 1997. Crater morphometry and modificationin the Sinus Sabaeus and Margaritifer Sinus regions of Mars. J. Geophys. Res. Planets102 (E6), 13321–13340, http://dx.doi.org/10.1029/97JE01084.
Dickson, J.L., Head, J.W., Fassett, C.I., 2012. Patterns of accumulation and flow of icein the mid-latitudes of Mars during the Amazonian. Icarus 219 (2), 723–732,http://dx.doi.org/10.1016/j.icarus.2012.03.010.
Dickson, J.L., Head, J.W., Marchant, D.R., 2008. Late Amazonian glaciation at thedichotomy boundary on Mars: evidence for glacial thickness maxima andmultiple glacial phases. Geology 36 (5), 411–414, http://dx.doi.org/10.1130/G24382A.1.
Dickson, J.L., Head, J.W., Marchant, D.R., 2010. Kilometer-thick ice accumulation andglaciation in the northern mid-latitudes of Mars: evidence for crater-fillingevents in the Late Amazonian at the Phlegra Montes. Earth Planet. Sci. Lett. 294(3–4), 332–342, http://dx.doi.org/10.1016/j.epsl.2009.08.031.
Fastook, J.L., 1993. The finite-element method for solving conservation equations inglaciology. Comput. Sci. Eng. 1 (1), 55–67, http://dx.doi.org/10.1109/99.295374.
Fastook, J.L., Head, J.W., 2013. Amazonian non-polar glaciation: supply-limitedglacial history and the role of ice sequestration. In: Lunar and Planetary ScienceXXXXIV, Abstract #1256.
Fastook, J.L., Head, J.W., Forget, F., Madeleine, J.B., Marchant, D.R., 2011. Evidence forAmazonian northern mid-latitude regional glacial landsystems on Mars: glacialflow models using GCM-driven climate results and comparisons to geologicalobservations. Icarus 216, 23–39, http://dx.doi.org/10.1016/j.icarus.2011.07.018.
Fastook, J.L., Head, J.W., Marchant, D., Shean, D., 2004. Ice sheet modeling:terrestrial background and application to Arsia Mons lobate deposit, Mars. In:Lunar and Planetary Science XXXV, Abstract #1352.
Fastook, J.L., Head, J.W., Marchant, D.R., 2013. Formation of Lobate Debris Aprons onMars: assessment of regional ice sheet collapse and debris-cover armoring.Icarus, 54–63, http://dx.doi.org/10.1016/j.icarus.2013.09.025.
Fastook, J.L., Head, J.W., Marchant, D.R., Forget, F., 2008. Tropical mountain glaciers onMars: altitude-dependence of ice accumulation, accumulation conditions, formationtimes, glacier dynamics, and implications for planetary spin–axis/orbital history.Icarus 198, 305–317, http://dx.doi.org/10.1016/j.icarus.2008.08.008.
Forget, F., Haberle, R.M., Montmessin, F., Levrard, B., Head, J.W., 2006. Formation ofglaciers on Mars by atmospheric precipitation at high obliquity. Science 311(5759), 368–371, http://dx.doi.org/10.1126/science.1120335.
Garvin, J.B., Head, J.W., Marchant, D.R., Kreslavsky, M.A., 2006. High-latitude cold-based glacial deposits on Mars: multiple superposed drop moraines in a craterinterior at 70N latitude. Meteorit. Planet. Sci. 41 (10), 1659–1674, http://dx.doi.org/10.1111/j.1945-5100.2006.tb00443.x.
Garvin, J.B., Sakimoto, S.E.H., Frawley, J.J., Schnetzler, C., 2002. Global geometricproperties of martian impact craters. In: Lunar and Planetary Science Con-ference XXXIII, Abstract #1255.
Garvin, J.B., Sakimoto, S.E.H., Frawley, J.J., 2003. Craters on Mars: global geometricproperties from gridded MOLA topography. In: Sixth International Conferenceon Mars. Abstract 1164.
Goldsby, D.L., Durham, W.B., Pathare, A., 2013. Inter-laboratory investigations of theeffects of particulates on flow of fine-grained ice. In: Lunar and PlanetaryScience XXXXIV, Abstract #2739.
Haberle, R.M., Murphy, J.R., Schaeffer, J., 2003. Orbital change experiments with aMars general circulation model. Icarus 161 (1), 66–89, http://dx.doi.org/10.1016/S0019-1035(02)00017-9.
Haeberli, W., 10 colleagues, 2006. Permafrost creep and rock glacier dynamics.Permafrost Periglac. Processes 17, 189–214.
Hartmann, W.K., Neukum, G., 2001. Cratering chronology and the evolution ofMars. Space Sci. Rev. 96 (1/4), 165–194.
J.L. Fastook, J.W. Head / Planetary and Space Science 91 (2014) 60–7674
Hauber, E., van Gasselt, S., Chapman, M.G., Neukum, G., 2008. Geomorphic evidencefor former lobate debris aprons at low latitudes on Mars: indicators of theMartian paleoclimate. J. Geophys. Res. 113, http://dx.doi.org/10.1029/2007JE-002897.
Head, J.W., Marchant, D.R., 2003. Cold-based mountain glaciers on Mars: WesternArsia Mons. Geology 31 (7), 641–644, http://dx.doi:10.1130/0091-7613(2003)031o0641:CMGOMW42.0.CO;2.
Head, J.W., Marchant, D.R., 2008. Evidence for non-polar ice deposits in the pasthistory of Mars. In: Lunar and Planetary Science XXXIX, Abstract #1295.
Head, J.W., Pratt, S.F., 2001. Extensive Hesperian-aged south polar ice sheet onMars: evidence for massive melting and retreat, and lateral flow and ponding ofmeltwater. J. Geophys. Res. 106 (E6). (12,275–12,299, 2001).
Head, J.W., Marchant, D.R., Ghatan, G.J., 2004. Glacial deposits on the rim of aHesperian–Amazonian outflow channel source trough: Mangala Valles, Mars.Geophys. Res. Lett. 31, L10701, http://dx.doi.org/10.1029/2004GL020294.
Head, J.W., Marchant, D.R., Agnew, M.C., Fassett, C.I., Kreslavsky, M.A., 2006a.Extensive valley glacier deposits in the northern mid-latitudes of Mars:evidence for Late Amazonian obliquity-driven climate change. Earth Planet.Sci. Lett. 241 (3–4), 663–671, http://dx.doi.org/10.1016/j.epsl.2005.11.016.
Head, J.W., Marchant, D.R., Dickson, J.L., Kress, A.M., Baker, D.M., 2010. Northern mid-latitude glaciation in the Late Amazonian period of Mars: criteria for the recognitionof debris-covered glacier and valley glacier landsystem deposits. Earth Planet. Sci.Lett. 294 (3–4), 306–320, http://dx.doi.org/10.1016/j.epsl.2009.06.041.
Head, J.W., Marchant, D.R., Kreslavsky, M.A., 2008. Formation of gullies on Mars:link to recent climate history and insolation microenvironments implicatesurface water flow origin. Proc. Nat. Acad. Sci. 105 (36), http://dx.doi.org/10.1073/pnas.0803760105. (13,258-13,263).
Head, J.W., Mustard, J.F., Kreslavsky, M.A., Milliken, R.E., Marchant, D.R., 2003.Recent ice ages on Mars. Nature 426, 797–802, http://dx.doi.org/10.1038/nature02114.
Head, J.W., Nahm, A.L., Marchant, D.R., Neukum, G., 2006b. Modification of thedichotomy boundary on Mars by Amazonian mid-latitude regional glaciation.Geophys. Res. Lett. 33 (8), L08S03, http://dx.doi.org/10.1029/2005GL024360.
Head, J.W., Neukum, G., Jaumann, R., Hiesinger, H., Hauber, E., Carr, M., Masson, P.,Foing, B., Hoffmann, H., Kreslavsky, M., Werner, S., Milkovich, S., van Gasselt, S.,Team, T.H.C.I., 2005. Tropical to mid-latitude snow and ice accumulation, flow andglaciation on Mars. Nature 434, 346–351, http://dx.doi.org/10.1038/nature03359.
Holt, J.W., Safaeinili, A., Plaut, J.J., Head, J.W., Phillips, R.J., Seu, R., Kempf, S.D.,Choudhary, P., Young, D.A., Putzig, N.E., Biccari, D., Gim, Y., 2008. Radarsounding evidence for buried glaciers in the southern mid-latitudes of Mars.Science 21, 1235–1238, http://dx.doi.org/10.1126/science.1164246.
Kadish, S.J., 2011. Climate Change on Mars: The Nature and History of Non-PolarIce-Rich Deposits. Ph.D. Thesis. Brown University, Providence, RI.
Kadish, S.J., Barlow, N.G., Head, J.W., 2009. Latitude dependence of martian pedestalcraters: evidence for a sublimation-driven formation mechanism. J. Geophys.Res. 114, E10001, http://dx.doi.org/10.1029/2008JE003318.
Kadish, S.J., Head, J.W., 2011a. Impacts into non-polar ice-rich paleodeposits onMars: excess ejecta craters, perched craters and pedestal craters as clues toAmazonian climate history. Icarus 215 (1), 34–46, http://dx.doi.org/10.1016/j.icarus.2011.07.014.
Kadish, S.J., Head, J.W., 2011b. Preservation of layered paleodeposits in high-latitudepedestal craters on Mars. Icarus 213 (2), 443–450, http://dx.doi.org/10.1016/j.icarus.2011.03.029.
Kadish, S.J., Head, J.W., Barlow, N.G., 2010a. Pedestal crater heights on Mars: a proxyfor the thicknesses of past, ice-rich, Amazonian deposits. Icarus 210 (1), 92–101,http://dx.doi.org/10.1016/j.icarus.2010.06.021.
Kadish, S.J., Head, J.W., Barlow, N.G., 2010b. The formation timescale and ages ofmid-latitude pedestal craters on Mars. In: Lunar and Planetary Science Con-ference XXXXI, Abstract #1014.
Kadish, S.J., Head, J.W., Parsons, R.L., Marchant, D.R., 2008. The Ascraeus Mons fan-shaped deposit: Volcano ice interactions and the climatic implications of cold-based tropical mountain glaciation. Icarus 197, 84–109, http://dx.doi.org/10.1016/j.icarus.2008.03.019.
Kowalewski, D.E., Marchant, D.R., Swanger, K.M., Head, J.W., 2011. Modeling vapordiffusion within cold and dry supraglacial tills of Antarctica: implications forthe preservation of ancient ice. Geomorphology 126 (1–2), 159–173, http://dx.doi.org/10.1016/j.geomorph.2010.11.001.
Kreslavsky, M.A., Head, J.W., 1999. Kilometer-scale slopes on Mars and theircorrelation with geologic units: initial results fromMars Orbiter Laser Altimeter(MOLA) data. J. Geophys. Res. Planets 104 (E9), 21911–21924, http://dx.doi.org/10.1029/1999JE001051.
Kreslavsky, M.A., Head, J.W., 2000. Kilometer-scale roughness of Mars: results fromMOLA data analysis. J. Geophys. Res. Planets 105 (E11), 26695–26711, http://dx.doi.org/10.1029/2000JE001259.
Kreslavsky, M.A., Head, J.W., 2003. North–south topographic slope asymmetry onMars: evidence for insolation-related erosion at high obliquity. Geophys. Res.Lett. 30 (15), 1815, http://dx.doi.org/10.1029/2003GL017795.
Kreslavsky, M.A., Head, J.W., 2006. Modification of impact craters in the northernplains of Mars: implications for the Amazonian climate history. Meteorit.Planet. Sci. 41, 1633–1646.
Kreslavsky, M.A., Head, J.W., Marchant, D.R., 2008. Periods of active permafrostlayer formation during the geological history of Mars: implications for circum-polar and mid-latitude surface processes. Planet. Space Sci. 56, 289–302, http://dx.doi.org/10.1016/j.pss.2006.02.010.
Kress, A.M., Head, J.W., 2008. Ring-mold craters in lineated valley fill and lobatedebris aprons on Mars: evidence for subsurface glacial ice. Geophys. Res. Lett.35 (23), L23206, http://dx.doi.org/10.1029/2008GL035501.
Laskar, J., Correia, A., Gastineau, M., Joutel, F., Levrard, B., Robutel, P., 2004. Longterm evolution and chaotic diffusion of the insolation quantities of Mars. Icarus170 (2), 343–364, http://dx.doi.org/10.1016/j.icarus.2004.04.005.
Levrard, B., Forget, F., Montmessin, F., Laskar, J., 2004. Recent ice-rich depositsformed at high latitudes on Mars by sublimation of unstable equatorial iceduring low obliquity. Nature 431, 1072–1075, http://dx.doi.org/10.1038/nature03055.
Levrard, B., Forget, F., Montmessin, F., Laskar, J., 2007. Recent formation andevolution of northern martian polar layered deposits as inferred from a GlobalClimate Model. J. Geophys. Res. Planets 112, E06012, http://dx.doi.org/10.1029/2006JE002772.
Levy, J.S., Head, J.W., Marchant, D.R., 2007. Lineated valley fill and lobate debrisapron stratigraphy in Nilosyrtis Mensae, Mars: evidence for phases of glacialmodification of the dichotomy boundary. J. Geophys. Res. Planets 112, E08004,http://dx.doi.org/10.1029/2006JE002852.
Levy, J.S., Head, J.W., Marchant, D.R., 2009. Concentric crater fill in Utopia Planitia:history and interaction between glacial “brainterrain” and periglacial mantleprocesses. Icarus 202 (2), 462–476, http://dx.doi.org/10.1016/j.icarus.2009.02.018.
Levy, J.S., Head, J.W., Marchant, D.R., 2010a. Concentric crater fill in the northernmid-latitudes of Mars: formation processes and relationships to similar land-forms of glacial origin. Icarus 209 (2), 390–404, http://dx.doi.org/10.1016/j.icarus.2010.03.036.
Levy, J.S., Marchant, D.R., Head, J.W., 2010b. Thermal contraction crack polygons onMars: a synthesis from HiRISE, Phoenix, and terrestrial analog studies. Icarus206 (1), 229–252, http://dx.doi.org/10.1016/j.icarus.2009.09.005.
Li, H., Robinson, M.S., Jurdy, D.M., 2005. Origin of martian northern hemispheremid-latitude lobate debris aprons. Icarus 176 (2), 382–394, http://dx.doi.org/10.1016/j.icarus.2005.02.011.
Lucchitta, B., 1981. Mars and Earth: comparison of cold-climate features. Icarus 45(2), 264–303, http://dx.doi.org/10.1016/0019–1035(81)90035–X.
Lucchitta, B., 1984. Ice and debris in the fretted terrain, mars. J. Geophys. Res. 89(s02), B409–B418, http://dx.doi.org/10.1029/JB089iS02p0B409.
Madeleine, J.B., Forget, F., Head, J.W., Levrard, B., Montmessin, F., Millour, E., 2009.Amazonian northern mid-latitude glaciation on Mars: a proposed climate scenario.Icarus 203 (2), 390–405, http://dx.doi.org/10.1016/j.icarus.2009.04.037.
Madeleine, J.B., Head, J.W., Spiga, A., Dickson, J.L., Forget, F., 2012. A study of iceaccumulation and stability in martian craters under past orbital conditionsusing the LMD mesoscale models. In: Lunar and Planetary Science XLIII,Abstract #1664.
Mangold, N., 2003. Geomorphic analysis of lobate debris aprons on Mars at MarsOrbiter Camera scale: evidence for ice sublimation initiated by fractures.J. Geophys. Res. Planets 108 (E4), 8021, http://dx.doi.org/10.1029/2002JE001885.
Mangold, N., 2005. High latitude patterned grounds on Mars: classification,distribution and climatic control. Icarus 174 (2), 336–359, http://dx.doi.org/10.1016/j.icarus.2004.07.030.
Marchant, D., Lewis, A., Phillips, W., Moore, E., Souchez, R., Denton, G., Sugden, D.,Potter, N., Landis, G., 2002. Formation of patterned ground and sublimation tillover Miocene glacier ice in Beacon Valley, southern Victoria Land, Antarctica.GSA Bull. 114 (6), 718–730, htpt://dx.doi:10.1130/0016–7606(2002)114o0718:FOPGAS42.0.CO;2.
Marchant, D.R., Mackay, S.L., Head, J.W., Kowalewski, D.E., 2010. Documnentingmicroclimate variation and the distribution of englacial debris in MullinsGlacier, Antarctica: implications for the origin, flow and modification of LDAand LVF on Mars. In: Lunar and Planetary Science Conference XXXXI, Abstract#2601.
Marchant, D.R., Head, J.W., 2007. Antarctic dry valleys: microclimate zonation,variable geomorphic processes, and implications for assessing climate changeon Mars. Icarus 192 (1), 187–222, http://dx.doi.org/10.1016/j.icarus.2007.06.018.
Marchant, D.R., Phillips, W.M., Schaefer, J.M., Winckler, G., Fastook, J.L., Shean, D.E.,Kowalewski, D.E., Head, J.W., Lewis, A.R., 2007. Establishing a chronology for theworld0s oldest glacier ice. In: 10th International Symposium on Antarctic EarthSciences, USGS OFR-2007, pp. 1–4. U.S. Geological Survey and The NationalAcademies.
Meresse, S., Costard, F., Mangold, N., Baratoux, D., Boyce, J.M., 2006. Martianperched craters and large ejecta volume: evidence for episodes of deflation inthe northern lowlands. Meteorit. Planet. Sci. 41, 1647–1658.
Milliken, R.E., Mustard, J.F., Goldsby, D.L., 2003. Viscous flow features on the surfaceof Mars: observations from high-resolution Mars Orbiter Camera (MOC)images. J. Geophys. Res. Planets 108 (E6), 5057, http://dx.doi.org/10.1029/2002JE002005.
Mischna, M.A., Richardson, M.I., 2005. A reanalysis of water abundances in themartian atmosphere at high obliquity. Geophys. Res. Lett. 32 (3), L03201, http://dx.doi.org/10.1029/2004GL021865.
Mischna, M.A., Richardson, M.I., Wilson, R.J., McCleese, D.J., 2003. On the orbitalforcing of martian water and CO2 cycles: a general circulation model study withsimplified volatile schemes. J. Geophys. Res. Planets 108 (E6), 5062, http://dx.doi.org/10.1029/2003JE002051.
Morgan, G.A., Head, J.W., Marchant, D.R., 2009. Lineated valley fill (LVF) and lobatedebris aprons (LDA) in the Deuteronilus Mensae northern dichotomy boundaryregion, Mars: Constraints on the extent, age and episodicity of Amazonianglacial events. Icarus 202 (1), 22–36, http://dx.doi.org/10.1016/j.icarus.2009.02.017.
J.L. Fastook, J.W. Head / Planetary and Space Science 91 (2014) 60–76 75

Mustard, J.F., Cooper, C.D., Rifkin, M.K., 2001. Evidence for recent climate change onMars from the identification of youthful near-surface ground ice. Nature 412,411–414.
Ostrach, L.R., Head, J.W., Kress, A.M., 2008. Ring-mold craters (RMC) in lobate debrisaprons (LDA) in the Deuteronilus Mensae region of Mars: evidence for shallowsubsurface glacial ice in lobate debris aprons. In: Lunar and Planetary ScienceXXXIX, Abstract #2422.
Paterson, W., 1994. The Physics of Glaciers, third ed. Pergamon, Oxford.Pierce, T.L., Crown, D.A., 2003. Morphologic and topographic analyses of debris
aprons in the eastern Hellas region, Mars. Icarus 163 (1), 46–65, http://dx.doi.org/10.1016/S0019–1035(03)00046–0.
Plaut, J.J., Safaeinili, A., Holt, J.W., Phillips, R.J., Head, J.W., Seu, R., Putzig, N.E., Frigeri, A.,2009. Radar evidence for ice in lobate debris aprons in the mid-northern latitudesof mars. Geophys. Res. Lett. 36 (2), L02203, http://dx.doi.org/10.1029/2008GL-036379.
Richter, A., Fedorov, D.V., Fritsche, M., Popov, S.V., Lipenkov, V.Y., Ekaykin, A.A.,Lukin, V.V., Matveev, A.Y., Grebnev, V.P., Rosenau, R., Dietrich, R., 2013. Ice flowvelocities over Vostok Subglacial Lake, East Antarctica, determined by 10 yearsof GNSS observations. J. Glaciol. 59 (214), 315–326, http://dx.doi.org/10.3189/2013JoG12J056.
Rignot, E., Hallet, B., Fountain, A., 2002. Rock glacier surface motion in BeaconValley, Antarctica, from synthetic-aperature radar interferometry. Geophys. Res.Lett. 29 (12), 1–4, http://dx.doi.org/10.1029/2001GL013494.
Rignot, E., Mouginot, J., Scheuchl, B., 2011. Ice flow of the Antarctic Ice Sheet.Science 333 (6048), 1427–1430, http://dx.doi.org/10.1126/science.1208336.
Senft, L.E., Stewart, S.T., 2008. Impact crater formation in icy layered terrains onMars. Meteorit. Planet. Sci. 43, 1993–2013.
Sharp, R., 1973. Mars: fretted and chaotic terrains. J. Geophys. Res. 78 (20),4073–4083, http://dx.doi.org/10.1029/JB078i020p04073.
Shean, D.E., Head, J.W., Fastook, J.L., Marchant, D.R., 2007a. Recent glaciations athigh elevations on Arsia Mons, Mars: implications for the formation andevolution of large tropical mountain glaciers. J. Geophys. Res. 112, E03004,http://dx.doi.org/10.1029/2006JE002761.
Shean, D.E., Head, J.W., Marchant, D.R., 2005. Origin and evolution of a cold-basedtropical mountain glacier on Mars: the Pavonis Mons fan-shaped deposit.J. Geophys. Res. 110, E05001, http://dx.doi.org/10.1029/2004JE002360.
Shean, D.E., Head, J.W., Marchant, D.R., 2007b. Shallow seismic surveys and icethickness estimates of the Mullins Valley debris-covered glacier, McMurdo DryValleys, Antarctica. Antarct. Sci. 19 (4), 485–496.
Shean, D.E., Marchant, D.R., 2010. Seismic and GPR surveys of Mullins Glacier,McMurdo Dry Valleys, Antarctica: ice thickness, internal structure and implica-tions for surface ridge formation. J. Glaciol. 56 (195), 48–64, http://dx.doi.org/10.3189/002214310791190901.
Squyres, S.W., 1978. Martian fretted terrain: flow of erosional debris. Icarus 34 (3),600–613, http://dx.doi.org/10.1016/0019-1035(78)90048-9.
Squyres, S.W., 1979. The distribution of lobate debris aprons and similar flows onMars. J. Geophys. Res. Solid Earth 84 (B14), 8087–8096, http://dx.doi.org/10.1029/JB084iB14p08087.
Squyres, S.W., Carr, M.H., 1986. Geomorphic evidence for the distribution of groundice on Mars. Science 231 (4735), 249–252, http://dx.doi.org/10.1126/science.231.4735.249.
Zimbelman, J.R., Clifford, S.M., Williams, S.H., 1989. Concentric crater fill on Mars:an aeolian alternative to ice-rich mass wasting. In: Proceeding of the 19th Lunarand Planetary Science Conference, pp. 397–407, Houston, TX. Lunar andPlanetary Institute.
J.L. Fastook, J.W. Head / Planetary and Space Science 91 (2014) 60–7676