planashland housing visioning meeting, 1/12/15
TRANSCRIPT

Ashland Housing Production PlanVisioning Public Forum
Monday, January 12, 2015
Presented by the Metropolitan Area Planning Council
Tonight’s Agenda
1. Purpose of a Housing Production Plan (HPP)
2. Affordable Housing & How It Works
3. Housing Needs & Demand in Ashland
4. Local Housing Goals, Barriers, & Opportunities
5. Next Steps in the HPP Process
Purpose of a Housing Production Plan

Purpose of a Housing Production Plan
M.G.L. Chapter 40B
• Encourages affordable housing development in
cities and towns throughout the Commonwealth
• Goal of at least 10% of a community’s housing is
affordable and recorded on the Massachusetts
Subsidized Housing Inventory

3.59% 3.66% 4.03% 4.43%
6.17%
8.33%
10.15% 10.26% 10.46%
0.00%
2.00%
4.00%
6.00%
8.00%
10.00%
12.00%
Source: DHCD, April 2014
Ashland Has Achieved 3.66% on the Subsidized Housing Inventory
Subsidized Housing Inventory, MetroWest Sub-Region, 2014
Purpose of a Housing Production Plan

Source: DHCD, April 2014
Town Has 241 Affordable Units
Subsidized Housing Inventory, Ashland, 2014
Purpose of a Housing Production Plan
2010 Census Year-Round
Housing UnitsSHI Units
Rental Units
Expiring Units
2017-2054
6,581 241 (3.66%) 226 (90%) 172 (71%)
Purpose of a Housing Production Plan
A Housing Production Plan (HPP) not only helps
communities meet the State’s mandatory 10%
affordable housing target , but also:
• understand local housing needs and demand
• influence the type, amount, and location of housing
• set a numerical goal for annual low- and
moderate-income housing production

HPPs include:
• a comprehensive housing needs assessment;
• analysis of development constraints and opportunities
• affordable housing goals and objectives; and
• implementation strategies
Purpose of a Housing Production Plan
To date, Ashland meets housing needs and
demand through multiple strategies, including:
• Affordable Housing Trust
• Community Preservation Act
• Development incentive for affordable housing
Purpose of a Housing Production Plan
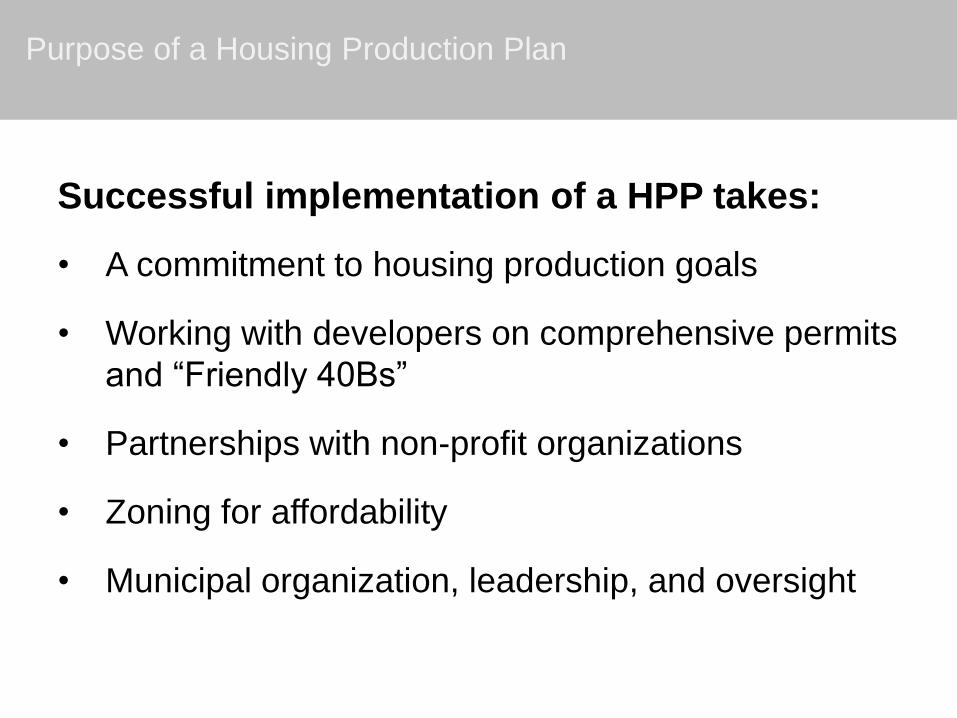
Successful implementation of a HPP takes:
• A commitment to housing production goals
• Working with developers on comprehensive permits
and “Friendly 40Bs”
• Partnerships with non-profit organizations
• Zoning for affordability
• Municipal organization, leadership, and oversight
Purpose of a Housing Production Plan

Affordable Housing & How It Works

Affordable Housing Financing
• There are many ways a community can fund its affordable housing, including the use of state or federal funding programs.
• Most projects require financial support from public sources (federal, state, local), and the funds generally come with restrictions and requirements.
• Financing options vary depending on the type of housing (rental or ownership) and the characteristics of the households a program or project is to assist (e.g., income, household size, disability status).
• Project feasibility depends upon:
– Reduced development costs and debt service (using zoning, grants, equity investments, or low-cost or soft loans)
– Reduced operating costs
– Increased rental or sales income (by renting/selling some units as market-rate)
Affordable Housing & How It Works

Affordable Housing Financing
• Financing for homeownership units depends on barriers to entry for prospective buyers.
• In a community with a supply of moderately priced housing, down-payment requirements may be the primary barrier, and assistance, or "soft-second" financing programs, may suffice.
• Other communities may choose to “buy down” existing units—including tax title and foreclosed properties—and resell them at a lower price, using subsidy funds to pay the difference.
• Others construct new affordable units, usually in small or mixed-income developments.
• There are fewer state and federal funding sources available for ownership programs. Most use conventional financing or a shallow subsidy program that provides an interest rate discount or other modest subsidy.
• Frequently used sources are from the Federal Home Loan Bank of Boston and MassHousing.
Affordable Housing & How It Works
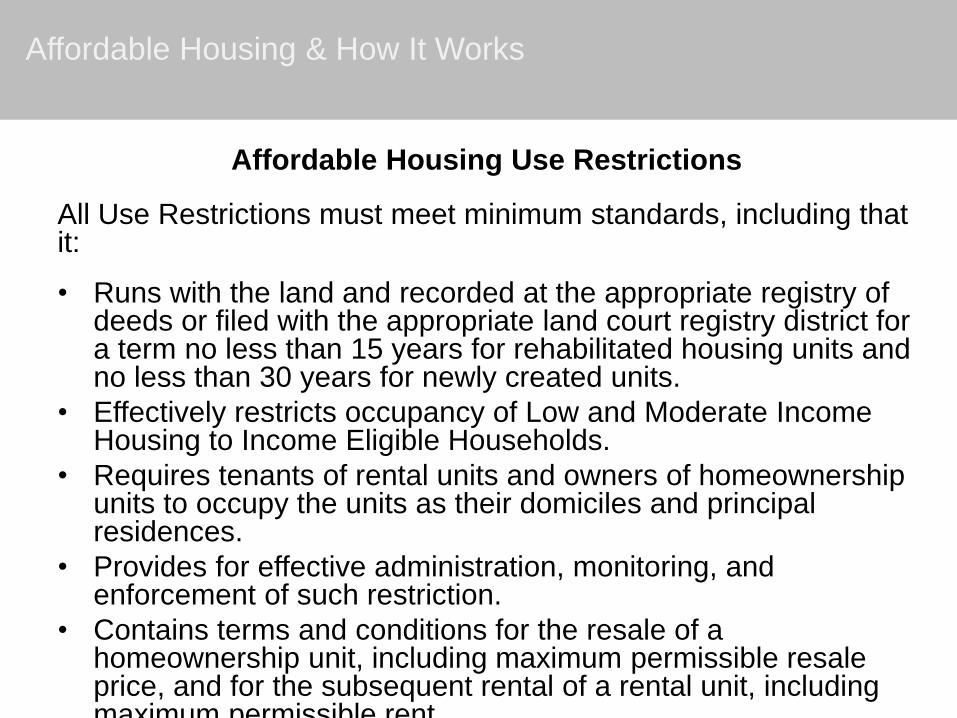
Affordable Housing Use Restrictions
All Use Restrictions must meet minimum standards, including that it:
• Runs with the land and recorded at the appropriate registry of deeds or filed with the appropriate land court registry district for a term no less than 15 years for rehabilitated housing units and no less than 30 years for newly created units.
• Effectively restricts occupancy of Low and Moderate Income Housing to Income Eligible Households.
• Requires tenants of rental units and owners of homeownership units to occupy the units as their domiciles and principal residences.
• Provides for effective administration, monitoring, and enforcement of such restriction.
• Contains terms and conditions for the resale of a homeownership unit, including maximum permissible resale price, and for the subsequent rental of a rental unit, including maximum permissible rent.
Affordable Housing & How It Works

Affordable Housing Use Restrictions
Units are subject to an Affirmative Fair Housing Marketing and
Resident Selection Plan. These plans:
• Create fair and open access to affordable housing and are designed to promote compliance with state and federal civil rights obligation.
• Apply to the full spectrum of activities that culminate with occupancy, including but not limited to means and methods of outreach and marketing through to the qualification and selection of residents.
• Include a resident selection plan, marketing, administering the initial lottery process, and determining the qualification of potential buyers and/or tenants.
• Projects must be in compliance with the Bedroom Mix Policy as set forth in the “Interagency Agreement Regarding Housing Opportunities for Families with Children.”
Affordable Housing & How It Works

Income Eligibility for Affordable Housing – Household
Income
• An eligible household may not earn more than 80% of the area median income in order to rent or purchase a restricted unit.
• Limitations on household assets for income-eligible households:
– For age-restricted homeownership projects, household assets shall not exceed $275,000 in value, including equity in a dwelling (to be sold).
– For non-age restricted homeownership units, household assets shall not exceed $75,000 in value.
– For rental units, the greater of the following will be added to income: the income derived from the assets or an imputation of value calculated in a manner consistent with HUD requirements in place at the time of marketing.
– If a potential purchaser divests him/herself of an asset for less than full and fair cash value of the asset within twoyears prior to application, the full and fair cash value of the
Affordable Housing & How It Works
Affordable Housing & How It Works
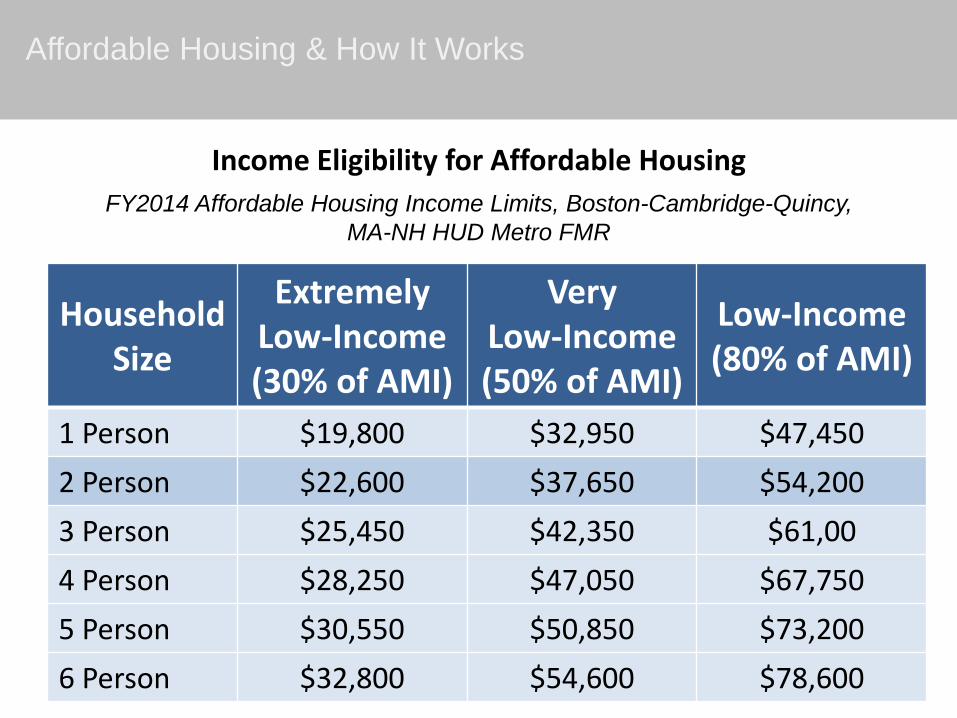
Household Size
Extremely Low-Income (30% of AMI)
Very Low-Income (50% of AMI)
Low-Income (80% of AMI)
1 Person $19,800 $32,950 $47,450
2 Person $22,600 $37,650 $54,200
3 Person $25,450 $42,350 $61,00
4 Person $28,250 $47,050 $67,750
5 Person $30,550 $50,850 $73,200
6 Person $32,800 $54,600 $78,600
Income Eligibility for Affordable Housing
FY2014 Affordable Housing Income Limits, Boston-Cambridge-Quincy,
MA-NH HUD Metro FMR

Income Eligibility for Affordable Housing – Housing Cost
Generally, a housing subsidy program (through its statutory basis, regulations, or guidelines) establishes maximum monthly housing cost. Otherwise, the following provisions apply:
• Rental: Monthly housing costs (inclusive of utilities) may not exceed 30% of monthly income for a household earning 80% of AMI adjusted for household size, including Assisted Living Facilities.
Affordable Housing & How It Works

Income Eligibility for Affordable Housing – Housing Cost
• Homeownership:
– The downpayment must be at least 3% of the purchase price.
– Mortgage must be a 30-year fully amortizing mortgage for no more than 97% of the purchase price with a fixed interest rate no more than 2% above the current MassHousing interest rate (www.masshousing.com).
– Monthly housing costs (inclusive of principal, interest, property taxes, hazard insurance, private mortgage insurance and condominium or homeowner association fees) shall not exceed 38% of monthly income for a household earning 80% of AMI, adjusted for household size.
Affordable Housing & How It Works

Local Preference
A Local Preference Program:
• Demonstrates the need for local preference in the marketing plan.
• Justifies the extent of the local preference (the percentage of units proposed to be set aside for local preference).
• Demonstrates that the proposed local preference will not have a disparate impact on protected classes.
The Subsidizing Agency, DHCD, and the municipality must approve a local preference scheme as part of the marketing plan.
Local preference may not exceed 70% of the affordable units in a project.
Affordable Housing & How It Works

Local Preference
Allowable Preference Categories:
• Current residents: A household in which one or more members is living in the city/town at the time of application. Documentation of residency should be provided (rent receipts, utility bills, street listing or voter registration listing).
• Municipal Employees: Employees of the municipality, such as teachers, janitors, firefighters, police officers, town hall employees.
• Employees of Local Businesses: Employees of businesses located in the municipality.
• Schoolchildren: Households with children attending the locality’s schools, including METCO students.
Affordable Housing & How It Works

Resale of Affordable Housing
All resales of homeownership units must maintain ongoing Affirmative Fair Housing and Marketing Plan Requirements. In addition, units are subject to the following resale process:
• Owner provides notice regarding the sale.
• Deed riders contain strict timelines regarding resale. Once notified of a resale, the municipality must act swiftly to locate an income-eligible buyer.
• Additional requirements include a Resale Plan, working from a Ready-Buyer List, and calculating any Capital Improvements.
• A “ready-buyer” list of eligible buyers may be created through local, regional, and statewide resources. It should continually be analyzed, maintained, and updated (through additional marketing) so that it remains consistent with the objectives of the housing program and is adequately representative of the racial, ethnic, and other characteristics of potential applicants in the housing market.
Affordable Housing & How It Works

Affordable Housing & How It Works
Questions?

Housing Needs & Demand in Ashland

Housing Needs & Demand in Ashland
40s & 50skids move out, travel, save for
retirement?
30smarried,
employed,kids?
20ssingle, career
development?
70+age in place?
60sretire,
downsize?
1. When did you move
to Ashland and into
what kind of home?
2. What kind of home
do you live in
today?
3. What kind of living
situation will you
want in the future?
Key Findings:
1. Demographics
2. Housing Stock
3. Affordability
Housing Needs & Demand in Ashland

Housing Needs & Demand – Demographics
Town Population and the Number of Households Are Increasing
Population and Households, Ashland, 2000-2030
Source: U.S. Census Bureau & MAPC Projections
5,7206,385
7,4048,437
14,674
16,59318,134
19,902
0
5,000
10,000
15,000
20,000
25,000
2000 2010 2020 2030
Households
Population
Housing Needs & Demand – Demographics
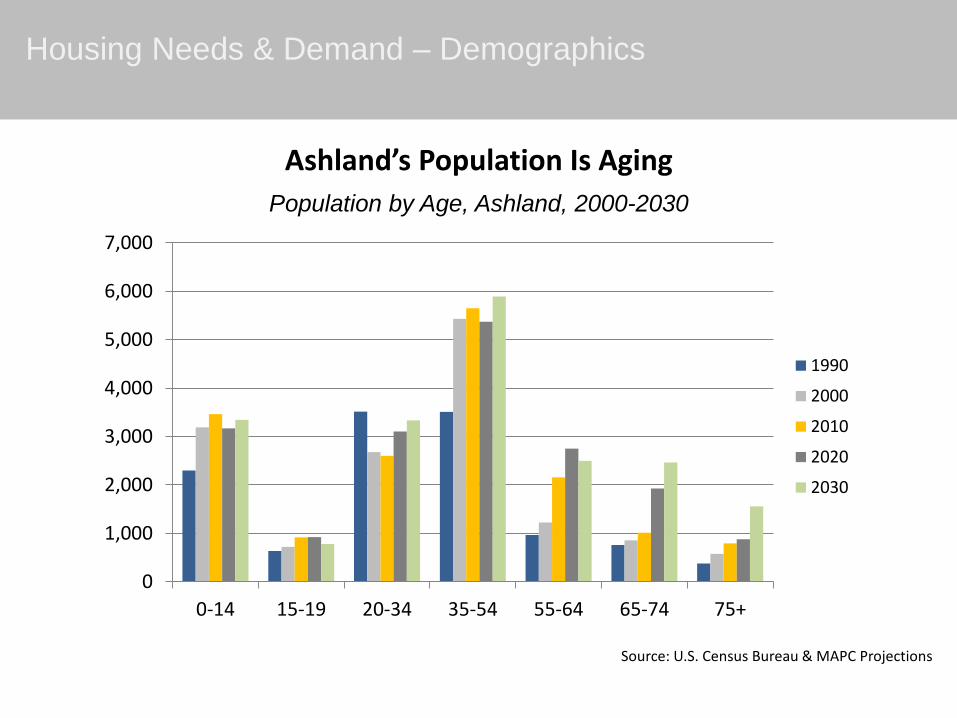
Ashland’s Population Is Aging
Population by Age, Ashland, 2000-2030
Source: U.S. Census Bureau & MAPC Projections
0
1,000
2,000
3,000
4,000
5,000
6,000
7,000
0-14 15-19 20-34 35-54 55-64 65-74 75+
1990
2000
2010
2020
2030

Housing Needs & Demand – Demographics
School Enrollment Has Decreased
School Enrollment, Ashland, 2003-2014
Source: MA Department of Primary and Secondary Education
2,590
2,629
2,654 2,653
2,671
2,630 2,640
2,624
2,584 2,573
2,581
2,520
2,540
2,560
2,580
2,600
2,620
2,640
2,660
2,680

Housing Needs & Demand – Demographics
Source: U.S. Census Bureau, 2009-2013 American Community Survey
The Young and Seniors Tend to Rent, Middle-Aged Tend to Own
Housing Tenure by Age of Householder, Ashland
397
990
1,657
777608 533
300
15786
243
157
326
57123 144
100
390
500
1,000
1,500
2,000
2,500
15-24 25-34 35-44 45-54 55-59 60-64 65-74 75-84 85+
Owner-Occupied Renter-Occupied

Almost Half of Households Earn $100,000 or More Annually
Source: U.S. Census Bureau, 2009-2013 American Community Survey
Housing Needs & Demand – Demographics
Household Income Distribution, Ashland
8.4%
11.3%
10.7%
9.9%
12.1%
47.6%
0.0% 10.0% 20.0% 30.0% 40.0% 50.0% 60.0%
Less than $20,000
$20-39,9999
$40-59,999
$60-74.999
$75-99,999
$100,000+
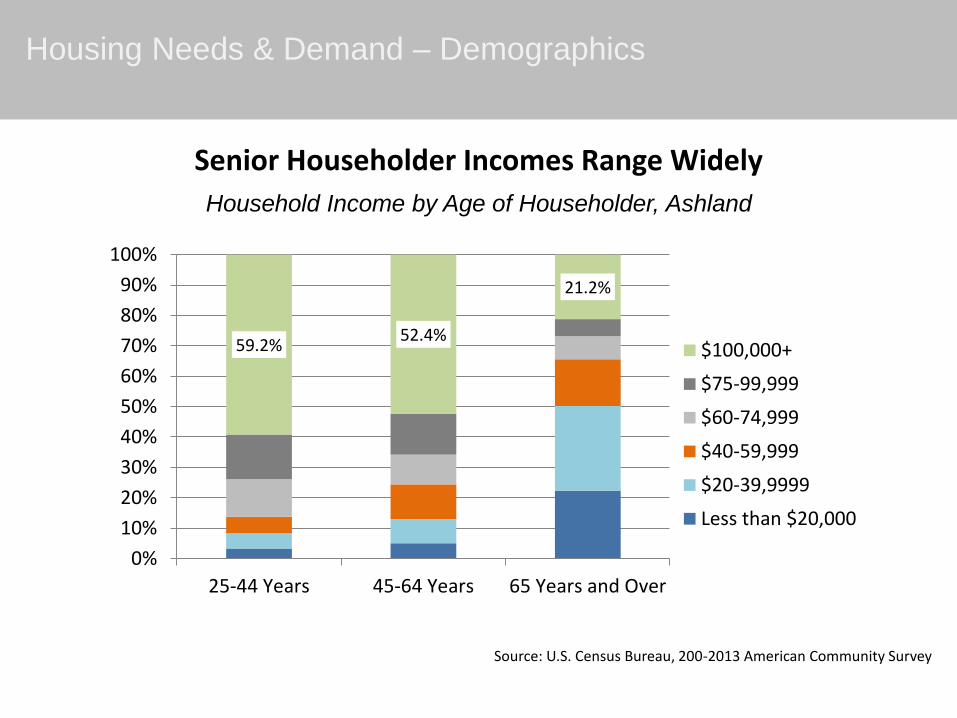
Senior Householder Incomes Range Widely
Source: U.S. Census Bureau, 200-2013 American Community Survey
Housing Needs & Demand – Demographics
Household Income by Age of Householder, Ashland
59.2%52.4%
21.2%
0%
10%
20%
30%
40%
50%
60%
70%
80%
90%
100%
25-44 Years 45-64 Years 65 Years and Over
$100,000+
$75-99,999
$60-74,999
$40-59,999
$20-39,9999
Less than $20,000

Housing Needs & Demand – Housing Stock
Source: U.S. Census Bureau, 2009-2013 American Community Survey
Three-Quarters of the Housing Stock is Single-Family
Housing Units by Type, Ashland
76.0%
4.9%
11.0%
2.9%4.6%
Single-Family
Two-Family
3-4 Units
5-9 Units
10-19 Units
20+ Units

Housing Needs & Demand – Housing Stock
Source: Census Building Permit
According to Permits Issued, Ashland has Increased Its Housing Stock by 15% Since 2000
Housing Units Permitted, MetroWest Sub-Region, 2000-2013
388 405479 486
582
850
1,022
1,2981,393
0
200
400
600
800
1,000
1,200
1,400
1,600
Housing Needs & Demand – Housing Stock
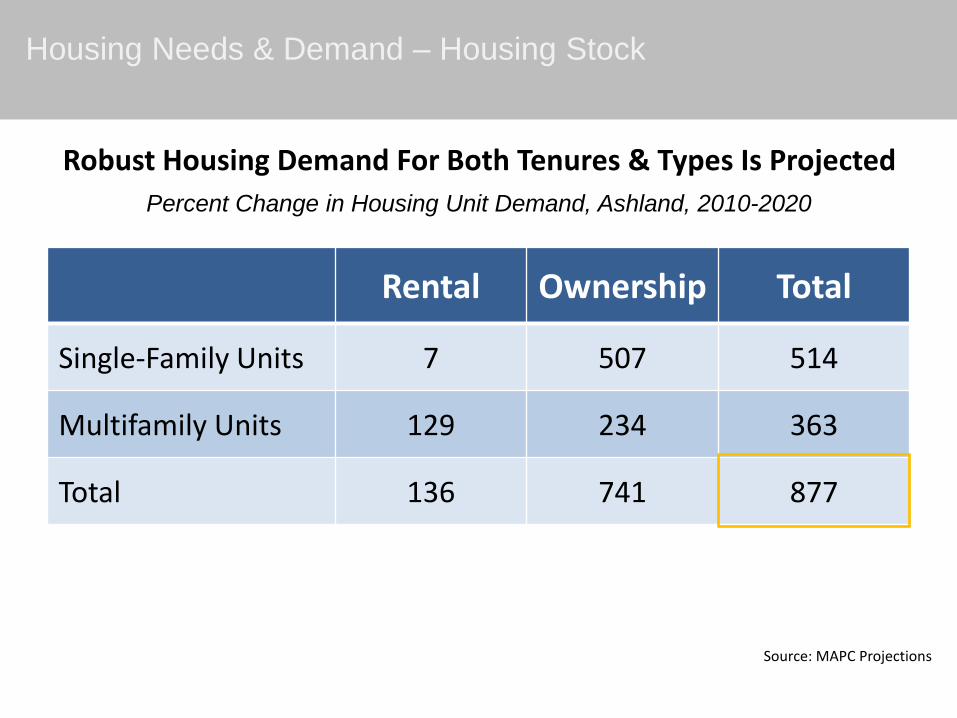
Source: MAPC Projections
Rental Ownership Total
Single-Family Units 7 507 514
Multifamily Units 129 234 363
Total 136 741 877
Robust Housing Demand For Both Tenures & Types Is Projected
Percent Change in Housing Unit Demand, Ashland, 2010-2020
Housing Needs & Demand – Affordability
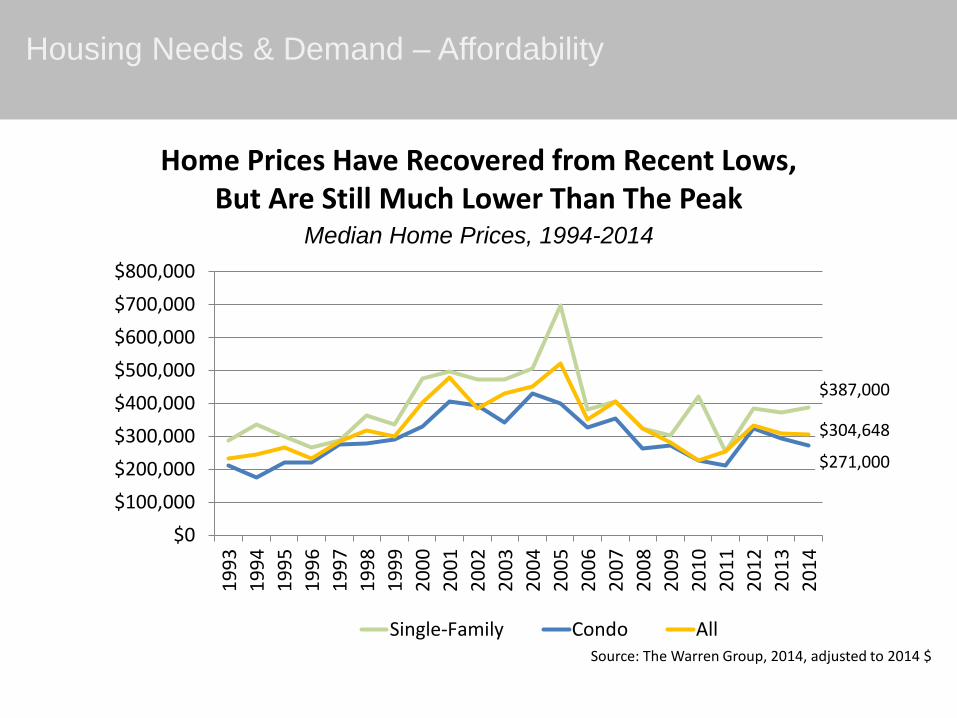
Source: The Warren Group, 2014, adjusted to 2014 $
Home Prices Have Recovered from Recent Lows, But Are Still Much Lower Than The Peak
Median Home Prices, 1994-2014
$387,000
$271,000
$304,648
$0
$100,000
$200,000
$300,000
$400,000
$500,000
$600,000
$700,000
$800,000
19
93
19
94
19
95
19
96
19
97
19
98
19
99
20
00
20
01
20
02
20
03
20
04
20
05
20
06
20
07
20
08
20
09
20
10
20
11
20
12
20
13
20
14
Single-Family Condo All
Housing Needs & Demand – Affordability
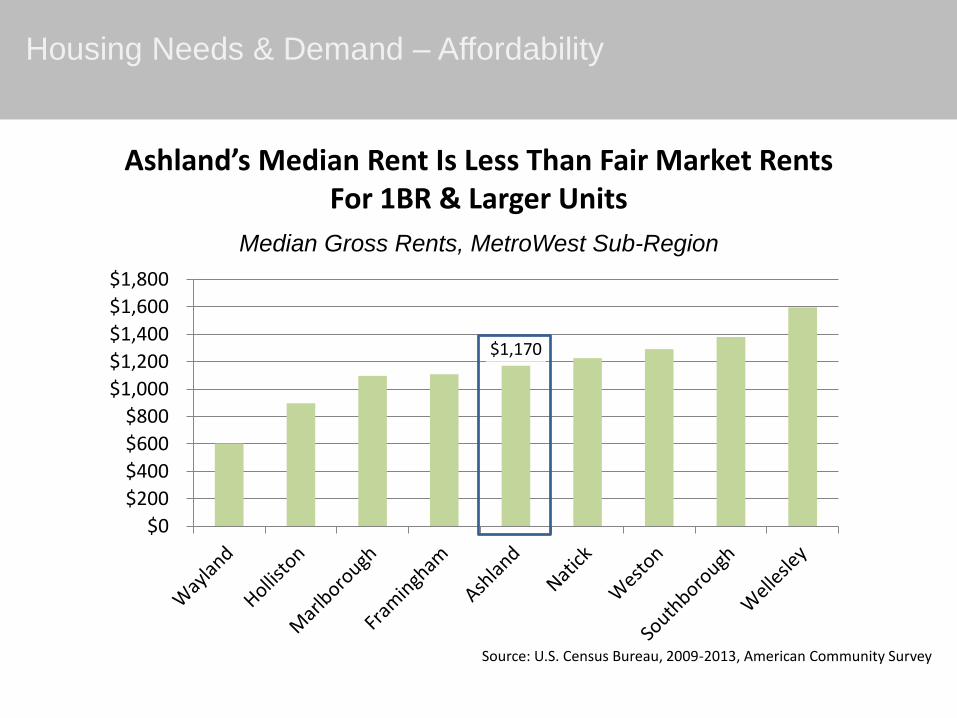
Source: U.S. Census Bureau, 2009-2013, American Community Survey
Ashland’s Median Rent Is Less Than Fair Market Rents For 1BR & Larger Units
Median Gross Rents, MetroWest Sub-Region
$1,170
$0
$200
$400
$600
$800
$1,000
$1,200
$1,400
$1,600
$1,800

Housing Needs & Demand – Affordability
Source: Comprehensive Housing Affordability Strategy (CHAS), 2007-2011
More Than a Quarter of Households are Low Income & Qualify For Housing Assistance
Percent of Low-Income Households by Type/Size, Ashland
35%
69%
11%
17%
36%
0.0%
10.0%
20.0%
30.0%
40.0%
50.0%
60.0%
70.0%
80.0%
Elderly FamilyElderly Non-FamilySmall Related Large Related Other

Housing Needs & Demand – Affordability
Cost-Burdened
% of All Households 33%
% of Low-Income Households 65%
% of Owners 26%
% of Renters 7%
Source: U.S. Census Bureau, 2009-2013 American Community Survey
More Than A Third of Households are Cost Burdened, Paying More Than 30% of Income on Housing
Cost-Burdened Households by Tenure, Ashland

Housing Needs & Demand
Questions?

Discussion:
Local Housing Goals, Barriers, & Opportunities

Based on what you have heard this evening, what do you think Ashland’s housing goals should be?
Local Housing Goals, Barriers, & Opportunities

What are the local barriers to achieving these housing goals?
Local Housing Goals, Barriers, & Opportunities

Are there specific housing opportunities that exist for redevelopment, preservation, or new housing?
What about partnerships, resources, and support?
Local Housing Goals, Barriers, & Opportunities

1. Develop housing production goals
2. Establish plan implementation strategies
3. Public forum to share goals and
strategies
4. Discussion with Town staff
5. Adoption of HPP by Planning Board and
Board of Selectmen
6. Submission of HPP to DHCD and
subsequent approval
Next Steps

Thank You!
Please join us for our next meeting to discuss
implementation strategies! Date to be determined.
For more information, please contact:
Jenny Raitt,
Assistant Director of Land use & Chief Housing Planner617-933-0754 | [email protected]
Karina Milchman,Housing Planner
617-933-0738 | [email protected]
www.mapc.org
@MAPCMetroBoston