planar flow field measurements in atmospheric and ... · changes in refractive index along the...
TRANSCRIPT

4th International Symposium on Particle Image Velocimetry, PIV´01 Paper 1083Göttingen, Germany, September 17-19, 2001
C. WILLERT, M. JARIUSInstitute of Propulsion Technology, German Aerospace Center (DLR), Köln, Germany
Correspondence to:Dr. Chris WILLERT, Institut für Antriebstechnik, Deutsches Zentrum für Luft- und Raumfahrt (DLR),D-51170 Köln, Germany, E-mail: [email protected]
1
Planar Flow Field Measurements in Atmospheric andPressurized Combustion Chambers
Chris Willert, Marc Jarius
Abstract The investigation of velocity fields in complex combustor flows is an important and necessarysubject of propulsion technology. A persisting problem in CFD modeling is that current numerical design toolshave a number of deficiencies in accurately predicting the complex combustor flow. Using planar techniquessuch as planar Doppler velocimetry (PDV) or particle image velocimetry (PIV) it is possible to provide detailedinformation of the flow field inside the combustor. This paper shall report on the status of applicability of PIV incombustor flows at realistic operating conditions.
1IntroductionGiven the current considerable growth of the air transport business, which is expected to last for the next fewdecades, the need arises to reduce both fuel consumption as well as the emissions of future aeroengines. Similarrequirements apply to the power generation sector since the reliance on fossil fuels can not be replaced byregenerative energy sources in the near future. Current combustor design for both aeroengines and stationarypower generators rely on extensive rig test programs, which are both expensive and time consuming, whereasthe current numerical design tools have a number of deficiencies in accurately predicting the complex combustorflow and associated reactive chemistry. On this background the Institute of Propulsion Technology is involved inseveral national and European research programs that are aimed at providing industry with improved modelingtools for combustor design. A common strategy in these projects is to generate high quality CFD validation datafrom combustor configurations that share critical features of realistic combustors such as mixing jets, flameinstabilities and increased operating pressures.
An important work package within these research programs is to provide detailed information of the flowfield inside the combustor using single point measurement techniques such as laser Doppler anemometry (LDA)(Behrendt et al., 1998, 2000; Hassa et al. 1999) and planar techniques such as planar Doppler velocimetry(PDV) (Röhle, 2000) or particle image velocimetry (PIV). PDV, also known in literature as Doppler globalvelocimetry (DGV), has been applied to isothermal test rigs (Röhle et al. 2000) and more recently to anatmospheric combustion chamber (Fischer et al., 2000), and is a very promising technique for obtainingvolumetric, time-averaged or phase-averaged flow fields. One of the primary advantages of PDV is that it isinsensitive to optical distortions which are frequently encountered in fired combustion chambers (e.g. throughchanges in refractive index along the optical path). In principle, PDV should be applicable even in high pressurecombustors where standard point measuring techniques (LDA) or point imaging techniques (PIV) falter due toincreased beam steering effects, that is, the inability to focus the measurement volume, be it a LDA probevolume or discrete particles for PIV which become blurred. To date, many applications of PIV in flamesreported in the literature have been restricted to small scale facilities or nearly laminar flow conditions (Han etal., 2000; Stella et al., 2000).
Disregarding the issues of seeding and illumination source for the moment, three component PDVmeasurements require either three observation directions, that is, three PDV camera systems, or three differentlight sheet propagation directions (or a combination of multiple cameras / multiple light sheets). For practicaland economical reasons it is not always possible to provide the test rig with a sufficient number of accesswindows to meet this requirement. Several alternative approaches are under investigation to nevertheless enablethree-component velocity measurements: (1) Multiple, flexible endoscopes could provide the camera withdifferent viewing directions simultaneously thereby reducing the number of required light sheet directions.Another advantage of endoscopes is that they can view the flow through small access ports thus reducing theneed for large viewing windows. (2) Another approach is to combine different planar velocity measurement

2
techniques to provide three-component velocity data. In this case the combination of PIV with PDV isenvisioned: Standard two-component PIV could be used to recover the in-plane velocity component, while PDVyields the out-of-plane velocity component. Compared to PDV, which was optimized at the institute for themeasurement of time-averaged velocity data, PIV has the added advantage of providing instantaneous velocitymaps. Of course, the calculation of velocity averages from PIV data requires significantly more processing andimage data than PDV. This paper’s intention is to report on the status of applicability of PIV in combustor flowswith regard to a number of technological challenges that are not present in atmospheric/isothermal flows. Resultsof two recent PIV measurement campaigns on an atmospheric combustor and a pressurized combustor will beshown.
2Experimental FacilitiesThe Institute of Propulsion Technology at the German Aerospace Center (DLR) has a wide variety of differentsized combustor rigs for both industrial and research purposes at its disposal. Two experimental facilities werechosen for the PIV applicability study presented herein: (1) an atmospheric ‘laboratory-scale’ combustor with adouble swirl nozzle and either gas or kerosene fueling, (2) a pressurized, single sector combustor (SSC, e.g. onefuel nozzle) with optical access from three sides (Behrendt et al., 1998). The former facility is rather simple inits maintenance/operation and lends itself to the optimization of laser-optical measurement equipment. As shownin Figure 1 one wall is fitted with a glass window for optical access of the CCD camera. To permit light sheetpassage through the center plane the combustion chamber is fitted with a pair of narrow rectangular flangeswhich are sealed off by narrow glass windows. The windows and the flanges are flushed with cold air to protectthem from particles and thermal strain. Although the presence of these flanges is not typical of realisticcombustors they greatly reduce laser light scatter within the field of view and thus improve signal quality of PIVand PDV.
The pressurized single sector combustor (SSC), schematically shown in Figure 2, can be operated at up to20 bar with air pre-heating of up to 850 K at mass flow rates of 1.3 kg/s. The nozzle plenum is supplied withpre-heated primary air downstream of a critical throttle. The primary air is split in a 2:1 ratio and guided into thedouble swirl nozzle and the inner window cooling slits, respectively. To reduce the area of (axial) recirculationabove the nozzle pre-heated secondary air is introduced at the half length of the combustion chamber. Figure 3shows a photograph of the pressurized SSC in operation. Operational costs in terms of manpower and primaryenergy are not insignificant, such that tests must be well prepared in advance.
Both test rigs have similar internal combustor dimensions, that is, a square cross section with a side length ofabout 100 mm and a double swirl blast atomizer nozzle centered in the bottom plate. Kerosene fueling was usedin the measurements presented herein.
For the PIV measurements the laser light sheet was placed through the center of the chamber as shown inFigures 1 and 2 with the recording CCD camera placed normal to this plane. Illumination was provided by astandard, frequency-doubled, double-cavity Nd:YAG laser (NewWave, Gemini PIV) with a pulse energy of upto 120 mJ per pulse at 532 nm. On the recording side, a thermo-electrically cooled, interline transfer CCDcamera (PCO, 1280 x 1024 pixel resolution) with a f = 55 mm, f # 2.8 lens (Nikon) was used. A bandpass filterwith center frequency 532 nm and width 5 nm (FWHM) placed in front of the lens rejected most of theunwanted radiation. The pulse delay between the laser pulses varied between τ = 3 µs and τ = 4 µs.
For the measurements in the atmospheric chamber solid tracer particles (SiO2, 0.8 µm, Merck) wereintroduced into the cold air flow upstream of the air blast nozzle using a simple, fluidized-bed particle dispenser.In the SSC a more complex fluidized bed particle dispenser (Figure 4, left), designed for pressures exceeding40 bar, introduced seeding (SiO2, 2 µm, Merck) into the preheated air stream upstream of the fuel nozzle. At itsexit, this dispenser has a sonic flow orifice with high flow gradients that are intended to break up any largeragglomerations of the seeding material.
3Examples of ResultsIn the following, some exemplary experimental results are presented. With regard to PIV processing standardcorrelation algorithms were used with an interrogation window size of 32 x 32 pixel and a 50 % overlap. Forclarity, only every other row of PIV vectors are shown in the plots.
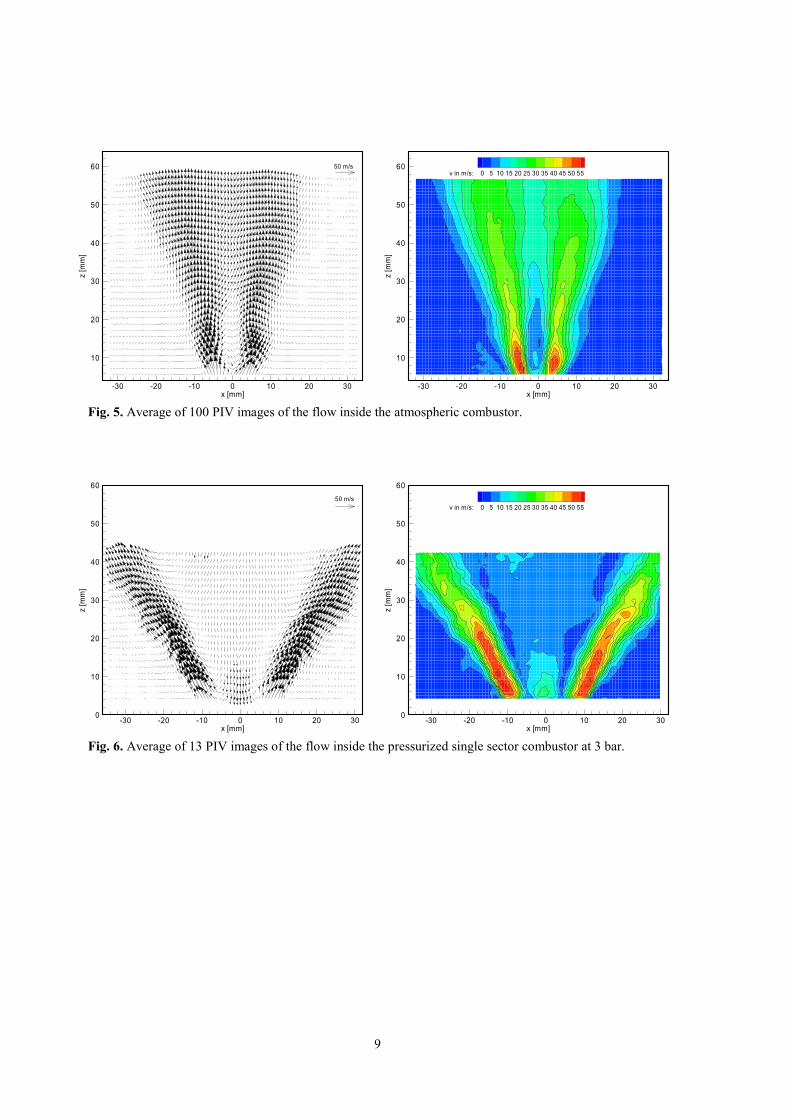
The measured flow field from the atmospheric burner are shown in Figure 5. On the left side the mean valueof the velocity distribution, calculated from 100 PIV images, is presented as a vector plot (right) and, for clarity,also as a contour plot of the velocity magnitude (left). In this context it should be mentioned that in areas of high

3
kerosene droplet content (eg. in the lobes of the spray cone), the velocity measurement is a combination of gas-and fuel droplet velocity. Although the two velocities are difficult to seperate in the PIV data, recent PDVapplications on the same combustor demonstrated that the slip velocity can be estimated (Fischer et al., 2000).The results shown in Figure 5 are quite typical for this rather simple burner with the exception that only a verysmall axial recirculation area is present above the middle of the nozzle (x = 0 mm, y = 10 mm). The flame ismainly stabilized by corner vortices. The remaining recirculation area is not entirely symmetric, which is mainlyan artifact of not having the light sheet accurately centered above the nozzle. The influence of the swirl dominatethe orientation of the recirculation. The opening angle of the flame is about 30°. Higher velocities exist onlydirectly at the exit of the nozzle. Since this atmospheric burner was operated without a pre-heating of the air theflame burns a short distance over the exit of the nozzle. The air fuel ratio is in the range of 13.
Roughly 15 mm above the nozzle the flow field around the spray cone exhibits a small indentation. Aninterpretation of that phenomenon is that the atomization process in the swirl nozzle generates small droplets aswell as large ones. Since the larger droplets do not follow the flow they tend to fly out of the strongly swirlingflow field into almost stationary air. Meanwhile the kerosene droplets continue to evaporate and partially aresucked back into the main combusting flow. Larger droplets tend to fly past the main combustion zone, andevaporate slower. Images of these larger droplets and their high relative velocity are shown in Figure 9. In thisregard it should be recalled that this atmospheric burner was mainly designed for measurement equipment tests;it represent not a modern burner for aeroengines or stationary power generators. A better comparison could beachieved if air pre-heating is utilized.
In Figure 6 the measured flow field from the single sector combustor is presented, with the mean velocityvector map shown on the left and a corresponding velocity magnitude contour plot shown on the right. Thecombustor was operated at 3 bar of pressure with an air pre-heating temperature of 700 K and air-to-fuel ratio of30. During the experiment only 13 well-seeded PIV image pairs could be obtained which was due to theintermittent operation of the seeding generator. Nevertheless, the obtained velocity data are more typical ofrealistic burner configurations. The flow exhibits a relatively large recirculation area centered above the nozzle.Compared to 60 m/s exit nozzle exit velocity, the downward velocity in the recirculation flow exceeds velocitiesup 20 m/s close to the nozzle which results in high, turbulence generating, shear rates in this area. Therecirculation also carries unburned radicals of the hot fuel-air mixture back toward the nozzle which has astabilizing effect on the flame’s position and ensures a continuous and complete combustion. Together with thecorner vortices outside and below the spray cone the combustion in the SSC is very stable. Compared to theatmospheric combustor the opening angle of the shear layer (e.g. high velocity region) at about 60° issignificantly larger, although the spray cone has a similar opening angle. The recorded images also showed thepresence of larger droplets far downstream of the nozzle with convective velocities strongly differing from thesurrounding flow.
A comparison of instantaneous velocity maps of the flow inside the atmospheric and the single sectorcombustor are shown in Figures 7 and 8. Visually the flow inside the atmospheric combustor is less structuredthan in the SSC. Turbulent flow is distributed in across the entire flame area as can be seen in the accompanyingvorticity map (Figure 7, right). On the other hand, the instantaneous velocity and vorticity maps of the SSC showcloser resemblance to the averaged result shown in Figure 6. The described recirculation area is easy to identifyand is characterized by the lack of vortical flow between the lobes of the spray cone. The flow in the spray conearea resembles that of a turbulent shear layer, that is, periodically spaced vortical structures can be identified. Bycontrast the atmospheric combustor shows neither the quiescent recirculation region nor clearly identifiableshear layers. In this case the flow immediately above the nozzle exhibits strong shear and some reverse flow.Further downstream the flow broadens and shows a wide spatial distribution of turbulent structures. Thepresence reduced recirculation is generally an indication of a small swirl (circumferential velocity around thenozzle axis) (Beér et al. 1972).
Although both combustors are equipped with similar nozzles (in terms of observed spray cone angle) thedifferences in the flow can be attributed, to a large extent, to the lack of preheating in the atmosphericcombustor. While the combustion is present immediately above the nozzle in the SSC, the atmosphericcombustor exhibits combustion only on the outside of the spray cone. This can also be seen in OH-LIF data ofthe atmospheric combustor (Fischer et al. 2000).

4
4Observations, Encountered Problems and Solution StrategiesIn the course of the measurements several issues characteristic of applying PIV in liquid fuel fired combustionchambers could identified and are described in the following.
Mie scattering off fuel droplets: The atomizer’s primary function is the dispersion of the liquid fuel intosmall droplets that can rapidly evaporate in the combustion zone downstream. Larger droplets can survive fardownstream as illustrated in Figure 9a which shows a portion about 30 mm downstream of the nozzle. As can beseen in Figure 9d, the PIV analysis of such images locks into the droplet velocity and hides the underlying gasvelocity. The actual seeding particle images are much weaker – in this case about 5-10% compared to that of thefuel droplets. In order to better estimate the gas velocity the images were first preconditioned using a high-passfilter and local intensity equalization (Figure 9c) as suggested by Willert (1997). This matched seeding particleimage intensity to that of the fuel droplets and since the seeding particle number density generally is higher, thePIV analysis locks into the displacement of the seeding and thereby estimates the gas velocity (Figure 9e).However, this approach only works in cases where the number density of droplets is low in comparison to theseeding particles. Immediately downstream of the nozzle the fuel droplets outnumber the particle images andbias the measured velocity to that of the droplets. As a result a combination of gas and droplet velocity ismeasured. In principle the mean velocity of the kerosene droplets could be measured by recording imageswithout particle seeding. This has been demonstrated by Fischer et al. (2000) using PDV.
Flame luminosity: Stoichiometrically balanced or fuel-lean, atmospheric flames generally exhibit little flameluminosity, a fuel-rich flame under increased pressure, on the other hand, is very bright, mainly due to sootglowing (the seeding glows as well!). This flame luminosity can be reduced by placing a narrow-bandwidth laserinterference filter in front of the sensor or collecting lens. However, the time-delayed read-out of the second PIVimage Ó an artifact of the double-shuttered, interline transfer CCDs (Figure 10) Ó in conjunction with the residuallight transmittance of the filter, results in the accumulation of the flame luminosity on the sensor (typically >100 ms). Under certain test facility operating conditions, this additional light exceeded the dynamic range of thesensor, making a successful PIV measurement impossible. One possible solution to this problem is to place afast response liquid crystal polymer (LCP) scattering shutter in front of the sensor. These shutters are based onelectrically controllable light scattering and, opposed to conventional LCDs, require no polarizers making themhighly transparent. In the ‘closed’ state otherwise freely moving liquid crystals group into clusters that scatterincoming light causing the system to turn highly turbid. As a consequence of this operating principle, the shuttercan only destroy image contrast. A DC light intensity level is still transmitted. Placed in front of a lens, themodel shown in Figure 11 (Philips Optics) has a open-closed response time of 1 ms and an extinction better than95% which is sufficient for most of our combustion applications.
Window contamination by seeding: A common problem encountered in seeding flows with solid particles isthe tendency of seed material depositing onto access windows thereby rendering them optically opaque. Thehigh pressure test rig uses forced air cooling on the inner liner windows such that this effect was reduced. Overtime, seeding did accumulate on the four side walls of the chamber. This resulted in scattering of the main laserlight sheet as it passed the inner liner windows of the SSC. As a result of this the entire volume was diffuselyilluminated (up to 25% of the camera’s dynamic range). Seeding residue deposited on the viewing window wasequally illuminated such that a stationary ‘particle’ image pattern was produced. In some circumstances thisresulted in a zero-velocity measurement. Due to lens defocusing at lower f-numbers this effect could be reduced.PIV measurements close to either of the viewing windows would not have been possible. Since the seedingcontamination itself is difficult to tackle another approach is to reduce the possibility of laser light scatter byrecessing the access windows from the chamber side walls. This was realized in the atmospheric combustor andis shown in Figure 1 and is a method of choice in upcoming future applications of PIV and PDV.
Seeding: The most challenging aspect in seeding flows with typically non-spherical, solid particles is tomaintain a controlled and steady production rate. The fluidized-bed, seeding generator (Figure 4) with its de-agglomeration sonic orifice did not perform entirely satisfactory for several reasons. The initially homogeneouspowder in the bed has a tendency to agglomerate into larger clumps such that a steadily decreasing amount ofseeding material is carried to the exit orifice. Due to the relatively small surface size of the sintered metal filternot all particles are mixed in that process. On the other hand, the larger particles passing through the sonicorifice act abrasively on the slit – the seeding particle diameter can not be maintained (clogging of the orificeand even the ducts downstream is also possible). Several improvements of the seeding device are currently underway: 1) A stirring device inside the fluidized bed is intended to prevent the formation of larger clumps. By also

5
forcing air out of the stirrer’s blades it is possible to further agitate the seeding bed. In a next step three curvedmetal wings will be mounted on the end of the stirring device with the intention of grinding the largeragglomerates. 2) The sintered metal filter cone is replaced by a sintered glass filter plate (Borosilicate glass 3.3;ROBU®). The glass filters are divided into seven porosity classes from 1.0 µm Ó 500 µm. The choice of porositydepends on the seeding diameter. In this case the glass filter with a porosity in a range of 100...160 µm is used.
Alternative approaches such as the dispersion of liquid suspensions of solid particles as suggested by Wernetet al. (1995) are also under investigation. However, depending on the amount of liquid particle suspensionsadded to the preheated air stream the method of seeding is likely to have an effect on the flame (cooling byevaporation, changed reactive chemistry).
5ConclusionsThe presented experiments were mainly intended to assess the feasibility of applying PIV in combustors used forapplied combustion research. The results have shown that it is possible to apply PIV in an atmosphericcombustor as well as a pressurized combustor at 3 bar. At 6 bar particle images could still be identified but theintermittent operation of the seeding generator did not permit the acquisition of good quality PIV recordings.Experiences gained in the past application of a variety of other measurement techniques have shown thattechniques relying on imaging single points within the flow (e.g. LDA, CARS) begin the falter at higherpressures (12 bar at 300 mm optical penetration depth, Hassa et al. 1999). PIV is expected to have similarrestrictions. The defocusing of a point within the (hot) flow is a result of refractive index gradients along theoptical path which are caused through the combination of temperature gradients, density variations and varyinggas composition.
Aside from the operational pressure, the optical penetration depth is a critical factor that dictates the degree ofdefocusing. The data given herein were obtained in a plane approximately 50 mm from the front window. Largerfacilities would require penetration depths of up to 300 mm. To some extent the defocusing can be controlled byreducing the recording lens aperture, that is, by reducing the opening angle of the optical cone, because thislimits the amount of index gradients across the optical path. LDA is very susceptible to this effect since it relieson crossing two laser beams from two different directions, typically at about 10° opening angle. For the PIVmeasurements f # 8 was used which corresponds to an opening angle of less than 0.3°. This gives rise to ourspeculation that PIV measurements should be possible in cases were single point measurement techniques likeLDA begin to fail. However, given the successful imaging of discrete particles does not guarantee that thedegree of beam steering varies between the exposures of the PIV recording. It is therefore possible that theapparent (measured) position of a particle image differs from its true position and therefore may influence thedisplacement measurement. The amount of actual beam steering between the two PIV exposures has beeninvestigated by Han et al. (2000) for a laboratory-scale hydrogen flame and was found to be within 0.1 pixel. Forthe data presented here this would correspond to a measurement uncertainty on the order of 1 m/s. However,reliable estimates for larger flames are currently not available. A possible approach to estimate the amount ofbeam steering is to measure the integral displacement using the background oriented schlieren (BOS) methodproposed by Richard et al., 2000.
In cases were PIV even becomes unsuccessful planar Doppler velocimetry may be a viable alternative since itdoes not rely on imaging discrete particles and rather collects the integral light scattered many particles.However current implementations of PDV cannot reliably measure the unsteady flow and therefore are restrictedto the measurement of mean values. Overall the potential of PIV in combustion research could be demonstratedherein and encourage further investigations. Once remaining problems such as seeding can be resolved both PIVand PDV show great promise.
ReferencesBeér, J.M., Chigier N.A., (1972) “Combustion Aerodynamics”, Applied Sciences Publishers, London.Behrendt T., Frodermann M., Hassa C., Heinze J., Lehmann B., Stursberg K. (1998), “Optical
measurements of spray combustion in a single sector combustor from a practical fuel injector at higherpressures”, RTO AVT Symposium on Gas Turbine Engine Combustion, Emissions and Alternative Fuels”,Lisbon, Pt.
Behrendt T., Carl M., Fleing C., Frodermann M., Heinze J., Hassa C., Meier U., Wolff-Gaßmann D.,Hohmann S., Zarzalis N. (2000), “Experimental and numerical investigation of a planar combustor sector atrealistic operating conditions”, ASME TURBO EXPO 2000, Munich, Germany, Paper 2000-GT-0123.

6
Fischer M., Heinze J., Matthias K., Röhle I. (2000), “Doppler Global velocimetry in flames using a newlydeveloped, frequency stabilized, tunable, long pulse Nd:YAG laser”, 10th Symposium of Applications LaserTechniques to Fluid Mechanics, Lisbon, Pt.
Han D., Su L.K., Menon R.K., Mungal M.G. (2000), “Study of a lifted-jet flame using a stereoscopic PIVsystem”, 10th Symposium of Applications Laser Techniques to Fluid Mechanics, Lisbon, Pt.
Hassa C., Carl M., Frodermann M., Behrendt T., Heinze J., Röhle I., Brehm N., Schilling T., Doerr, T.(1999), “Experimental investigation of an axially staged combustor sector with optical diagnostics at realisticoperating conditions”, RTO-MP-14, pp. 18-1 Ó18-11.
Stella A., Guj G., Kompenhans J., Raffel M., Richard H. (2000), “Application of particle image velocimetryto combusting flows: design considerations and uncertainty assessment”, Exp. Fluids, 30, (No. 2), pp. 167-180Experiments in Fluids
Richard H, Raffel M., Rein M., Kompenhans J. (2000), “Demonstration of the applicability of a backgroundoriented schlieren (BOS) method”, 10th Symposium of Applications Laser Techniques to Fluid Mechanics,Lisbon, Pt.
Röhle I. (2000), “Doppler global velocimetry”, in RTO Lecture Series 217, Planar Optical MeasurementMethods for Gas Turbine Components, Neuilly-Sur-Seine Cedex, France.
Röhle I., Schodl R., Voigt P., Willert C. (2000), “Recent developments and applications of quantitative laserlight sheet measuring techniques in turbomachinery components”, Measurement Science and Technology,Vol. 11, pp. 1023-1035.
Wernet M.P., Skoch G.J., Wernet J.H. (1995), “Demonstration of a stabilized alumina/ethanol colloidaldispersion technique for seeding high temperature air flows,” Intl. Congress on Instrumentation in AerospaceSimulation Facilities (ICIASF), Ohio, U.S.A.
Willert C. (1997), “Stereoscopic digital particle image velocimetry for application in wind tunnel flows”,Measurement Science and Technology, Vol. 8, pp. 1465-1479.

7
PIV camera
Laserlight
sheet
Laser lightsheet
Kerosene
Air with seedingAir with seeding
WindowCombustion chamber &measurement area
Purging air
Purging air
Fig. 1. Schematic (front and top view) and photograph of the atmospheric combustion chamber.
Inner liner withcooling slots
Region ofinterest
Spraycone
Double swirlnozzle
Sonic exit
Pressurevessel
Pressurewindows
Laser lightsheet
Laser lightsheet
Inner linerwindows
Cooling airFuel Preheated air
PIV Camera
Fig. 2. Schematic of the single sector (front and top view), high pressure combustion chamber.

8
Fig. 3. Photograph of the pressurized, single sector combustor
Motor
Air
Seeded airoutlet
Seeded airoutlet
Pressurizedair inlet
Pressurizedair inlet
Seeding material(SiO powder)
2 Stirring device(hollow)
Adjustableslit valve
Sinteredmetal filter
Sinteredglass filter
Air + seedingagglomerats
Pressurevessel
Fig. 4. Fluidized bed seeding generator for operation up to 40 bar, simple version (left) and modified withstirring device (right)
9
x [mm]
z[m
m]
-30 -20 -10 0 10 20 30
10
20
30
40
50
60 50 m/s
x [mm]z
[mm
]-30 -20 -10 0 10 20 30
10
20
30
40
50
60v in m/s: 0 5 10 15 20 25 30 35 40 45 50 55
Fig. 5. Average of 100 PIV images of the flow inside the atmospheric combustor.
x [mm]
z[m
m]
-30 -20 -10 0 10 20 300
10
20
30
40
50
6050 m/s
x [mm]
z[m
m]
-30 -20 -10 0 10 20 300
10
20
30
40
50
60
v in m/s: 0 5 10 15 20 25 30 35 40 45 50 55
Fig. 6. Average of 13 PIV images of the flow inside the pressurized single sector combustor at 3 bar.

10
x [mm]
z[m
m]
-30 -20 -10 0 10 20 300
10
20
30
40
50
6050 m/s
x [mm]z
[mm
]-30 -20 -10 0 10 20 300
10
20
30
40
50
60
-40000 -30000 -20000 -10000 0 10000 20000 30000 40000
Fig. 7. Example of instantaneous flow inside the atmospheric combustor: velocity vector map (left), andvorticity map (right). (The vorticity component normal to the plane, ωy , is shown).
x [mm]
z[m
m]
-30 -20 -10 0 10 20 300
10
20
30
40
50
6050 m/s
x [mm]
z[m
m]
-30 -20 -10 0 10 20 300
10
20
30
40
50
60
-40000 -30000 -20000 -10000 0 10000 20000 30000 40000
Fig. 8. Example of instantaneous flow inside the pressurized single sector combustor operating at 3 bar:velocity vector map (left), and vorticity map (right). (The vorticity component normal to the plane, ωy , isshown).

11
a) b) c)
d) e)
Fig. 9. Portion of PIV recordings - inverted for clarity - and processed PIV data: a) fuel droplets, b)brightened version of a) with seeding visible, c) pre-processed image, d) flow field after standard PIVanalysis, e) flow field obtained after enhancement of PIV images. (The shown image portion is about 110pixels wide.)
Interlinetransfer event
CCD SensorExposure
LaserFlashes
RequiredShutter
Frame 1 Frame 2 Time(typ. < 100 µs) (typ. > 100 ms)
Fig. 10. PIV-Camera timing sequence illustrating increased light sensitivity of frame 2.
Fig. 11. Liquid crystal polymer (LCP) scattering shutter