plan for assessment of the occurrence, … studies will explain ... occurrence, status, and...
TRANSCRIPT

PLAN FOR ASSESSMENT OF THE OCCURRENCE, STATUS, AND DISTRIBUTION OF VOLATILE ORGANIC COMPOUNDS IN AQUIFERS OF THE UNITED STATESBy Wayne W. Lapham and Saeid Tadayon
U.S. GEOLOGICAL SURVEY
Open-File Report 96-199
Rapid City, South Dakota 1996

U.S. DEPARTMENT OF THE INTERIOR
BRUCE BABBITT, Secretary
U.S. GEOLOGICAL SURVEY
Gordon P. Eaton, Director
The use of firm, trade, and brand names in this report is for identification purposes only and does not constitute endorsement by the U.S. Geological Survey.
For addtional information write to:
District Chief U.S. Geological Survey 1608 Mt. View Rd. Rapid City, SD 57702
Copies of this report can be purchased from:
U.S. Geological Survey Information Services Box 25286Denver Federal Center Denver, CO 80225-0046

FOREWORDThe mission of the U.S. Geological Survey
(USGS) is to assess the quantity and quality of the earth resources of the Nation and to provide informa tion that will assist resource managers and policy- makers at Federal, State, and local levels in making sound decisions. Assessment of water-quality condi tions and trends is an important part of this overall mission.
One of the greatest challenges faced by water- resources scientists is acquiring reliable information that will guide the use and protection of the Nation's water resources. That challenge is being addressed by Federal, State, interstate, and local water-resource agencies and by many academic institutions. These organizations are collecting water-quality data for a host of purposes that include: compliance with permits and water-supply standards; development of remedia tion plans for specific contamination problems; opera tional decisions on industrial, wastewater, or water- supply facilities; and research on factors that affect water quality. An additional need for water-quality information is to provide a basis on which regional- and national-level policy decisions can be based. Wise decisions must be based on sound information. As a society we need to know whether certain types of water-quality problems are isolated or ubiquitous, whether there are significant differences in conditions among regions, whether the conditions are changing over time, and why these conditions change from place to place and over time. The information can be used to help determine the efficacy of existing water- quality policies and to help analysts determine the need for and likely consequences of new policies.
To address these needs, the U.S. Congress appropriated funds in 1986 for the USGS to begin a pilot program in seven project areas to develop and refine the National Water-Quality Assessment (NAWQA) Program. In 1991, the USGS began full implementation of the program. The NAWQA Program builds upon an existing base of water-quality studies of the USGS, as well as those of other Federal, State, and local agencies. The objectives of the NAWQA Program are to:
Describe current water-quality conditions for a large part of the Nation's freshwater streams, rivers, and aquifers.
Describe how water quality is changing overtime.
Improve understanding of the primary natural and human factors that affect water-quality conditions.
This information will help support the develop ment and evaluation of management, regulatory, and monitoring decisions by other Federal, State, and local agencies to protect, use, and enhance water resources.
The goals of the NAWQA Program are being achieved through ongoing and proposed investigations of 60 of the Nation's most important river basins and aquifer systems, which are referred to as Study Units. These Study Units are distributed throughout the Nation and cover a diversity of hydrogeologic settings. More than two-thirds of the Nation's fresh water use occurs within the 60 Study Units and more than two-thirds of the people served by public water- supply systems live within their boundaries.
National Synthesis of data analysis, based on aggregation of comparable information obtained from the Study Units, is a major component of the program. This effort focuses on selected water-quality topics using nationally consistent information. Comparative studies will explain differences and similarities in observed water-quality conditions among study areas and will identify changes and trends and their causes. The first topics addressed by the National Synthesis are pesticides, nutrients, volatile organic compounds, and aquatic biology. Discussions on these and other water-quality topics will be published in periodic summaries of the quality of the Nation's ground and surface water as the information becomes available.
This report is an element of the comprehensive body of information developed as part of the NAWQA Program. The program depends heavily on the advice, cooperation, and information from many Federal, State, interstate, Tribal, and local agencies and the public. The assistance and suggestions of all are greatly appreciated.
Robert M. Hirsch Chief Hydrologist
Foreword III


CONTENTS
Glossary of assessment components...................................................................................................................................... VIIAbstract....................................................................................................................._^ 1Introduction ............................................................................................................................._^ 2
Purpose and scope ....................................................................................................................................................... 3Acknowledgments....................................................................................................................................................... 3
National Synthesis of volatile organic compounds ............................................................................................................... 3Plan for assessment of occurrence, status, and distribution of volatile organic compounds in ground water ...................... 3
Data selection .............................................................................................................................................................. 7Inventory of local, State, and Federal monitoring programs............................................................................. 7Data needs.......................................................................................................................................................... 7Criteria for selection of wells and volatile organic compound data.................................................................. 13
General selection criteria......................................................................................................................... 13Well-network design................................................................................................................................ 13Well construction..................................................................................................................................... 18Well type.................................................................................................................................................. 18Selection of volatile organic compound data........................................................................................... 19
Selection of a volatile organic compound analysis from several available for a well................... 19Censoring volatile organic compound data using quality-control data......................................... 20Instrument and method detection limits and reporting levels........................................................ 20
Submittal of data to the volatile organic compound occurrence data base.................................................................. 21Analysis of data.......................................................................................................................................................... 21
Summary................................................................................................................................................................................ 26References cited..................................................................................................................................................................... 26Supplemental information..................................................................................................................................................... 29
Instructions for filling out data-inventory Forms A and B .......................................................................................... 31Form A. Record of first screen of possible monitoring programs for volatile organic
compounds (VOCs) in ground water for __ Study Unit............................................................................ 32Form B. Summary of monitoring-program information for volatile organic compounds
(VOCs) in ground water for __ Study Unit............................................................................................... 33
ILLUSTRATIONS
1. Map showing Study Units of the National Water-Quality Assessment Program....................................................... 2
TABLES
1. Volatile organic compound target analytes in the National Water-Quality Assessment Program .......................... 42. Timeline for data collection, compilation, and reporting of results for assessment of
occurrence, status, and distribution of volatile organic compounds in ground water............................................ 73. Data requested for submittal to the national volatile organic compound (VOC) occurrence data
base for use in assessment of occurrence, status, and distribution of VOCs in ground water................................ 84. Details of data requested for submittal to the national volatile organic compound (VOC) occurrence
data base for use in assessment of occurrence, status, and distribution of VOCs in ground water ........................ 105. Criteria for selection of volatile organic compound (VOC) data for assessment of
occurrence, status, and distribution of VOCs in ground water............................................................................... 136. Selected volatile organic compounds (VOCs) measured by indicated U.S. Geological Survey
National Water-Quality Laboratory schedules and U.S. Environmental Protection Agency methods.................. 147. Examples of monitoring-program or well-network characteristics, requested data compilation,
and anticipated analysis of the data ........................................................................................................................ 17
Contents V

TABLES Continued
8. Suggested priority for well selection for assessment of occurrence, status, and distribution of volatile organic compounds (VOCs) to minimize bias attributable to well type...............
9. Example of a relational data-base file (called netsite.rdb) that identifies each well, for which volatile organic compound (VOC) analyte-concentration data are submitted, in relation to the monitoring program/network from the VOC data-inventory tables............
10. Example of a relational data-base file (called netdes.rdb) that describes generalinformation about each monitoring program in the volatile organic compound (VOC) data-inventory tables for which VOC analyte-concentration data are submitted...................
11. Example of a relational data-base file (called aqsite.rdb) that identifies each well, for which volatile organic compound (VOC) analyte-concentration data are submitted, in relation to the aquifer in which the monitoring well is screened......................
12. Example of a relational data-base file (called aqdes.rdb) that describes information about each aquifer/hydrogeologic unit for which volatile organic compound (VOC) analyte-concentration data are submitted...............................................................................
19
22
23
24
25
CONVERSION FACTORS
Multiply By To obtain
Length
foot (ft)
mile (mi)
0.3048
1.609
meter
kilometer
Area
square mile (mi2) 2.590 square kilometer
Hydraulic Conductivity
inch per year (in/yr)
foot per day (ft/d)
25.4
0.3048
millimeter per year
meter per day
Flow
million gallons per day (Mgal/d) 0.04381 cubic meter per second
Transmissivity
foot squared per day (ft2/d) 0.09290 meter squared per day
ABBREVIATIONS AND ACRONYMS
Listed below are abbreviations and acronyms that are used frequently in this report:
CAS Chemical Abstract ServicesCERCLA Comprehensive Environmental Response, Compensation, and Liability ActDD National Water-Quality Assessment Program Data DictionaryGIS Geographic Information SystemGWSI U.S. Geological Survey Ground-Water Site InventoryIUPAC International Union of Pure and Applied ChemistryLSD Land-surface datumNAWQA National Water-Quality Assessment ProgramNWIS U.S. Geological Survey National Water Information SystemQWDATA U.S. Geological Survey Water-Quality Data BaseRCRA Resource Conservation and Recovery ActUSEPA U.S. Environmental Protection AgencyUSGS U.S. Geological SurveyVOC Volatile organic compound
VI Contents

Plan for Assessment of the Occurrence, Status, and Distribution of Volatile Organic Compounds in Aquifers of the United StatesBy Wayne W. Lapham and Saeid Tadayon
ABSTRACT
The occurrence of volatile organic compounds (VOCs) in water is of national concern because of their relatively high aqueous solubility, mobility, and persistence, because many are known or suspected carcinogens, because of their widespread use, and because they have been found in drinking-water supplies. Because of this national concern, VOCs were selected for National investigation (hereafter termed "National Synthesis") by the U.S. Geolog ical Survey's National Water-Quality Assessment (NAWQA) Program in 1994.
The broad goals of this National Synthesis are to: (1) describe current water-quality condi tions with respect to VOCs; (2) define trends, or lack of trends, in VOCs in surface and ground water; and (3) identify, describe, and explain causal relations among the occurrence and distri bution of VOCs in surface water and ground water, and natural and human factors.
The National Synthesis of VOCs in ground water has three objectives: (1) to describe their occurrence, status, and distribution; (2) to deter mine relations among VOCs in shallow ground water and natural and human factors; and (3) to determine, compare, and contrast the occurrence, transformation, transport, and fate of selected VOCs in the hydrologic cycle for several region ally or nationally important aquifer systems.
The description of VOC occurrence, status, and distribution in ground water focuses on major
aquifers of the United States. Occurrence describes the presence or absence of VOCs, their frequency of occurrence, and their ranges of concentrations. Status compares the concentra tions of VOCs detected in relation to water- quality regulations or advisories, such as Maxi mum Contaminant Levels, Proposed Maximum Contaminant Levels, Maximum Contaminant Level Goals, and Health Advisories. Distribution describes the variability of VOCs in ground water, areally and by depth. This report describes the study design for conducting such an assess ment.
The assessment focuses on aquifers, or parts of aquifers, that are currently used or have the potential to be used as sources of water supplies, using data collected as part of local, State, and Federal ground-water monitoring programs since 1985. Assessment by aquifer and comparison of results among aquifers will be completed for those aquifers for which adequate spatial or depth-related data are available. Assessment of VOCs in aquifers also will be completed at regional and national scales.
A set of criteria for well-network design, well construction, sample-collection methods, and methods of laboratory analysis must be met before VOC data are used for assessment. An appropriate well-network design will provide a generally unbiased, random, equal-area distribu tion of sampling sites throughout the aquifer, or part of the aquifer, of interest. Well-construction
Abstract

information must be sufficient to ensure that the hydrogeologic unit (or units) represented by the water level measured and the hydrologic unit (or units) contributing water to the well are known. In addition, the well construction and pumping equipment in the well need to be of a type that are not likely to affect concentrations of VOCs in the water sample. VOC data will be considered suit able for use in the occurrence assessment if nationally accepted methods for collection and analysis were used and if the quantitation level for VOC analytes was less than about 5 micrograms per liter; laboratory analysis was done by a labo ratory certified by the U.S. Environmental Protec tion Agency; and the sample was collected from untreated (raw) water at or near the well head before being held in a pressure tank or holding tank.
INTRODUCTION
In 1991, the U.S. Geological Survey's (USGS) National Water-Quality Assessment (NAWQA) Program began the transition from a pilot program to full-scale implementation. The long-term goals of the NAWQA Program are to describe the status and trends in the quality of a large, representative part of the Nation's surface-water and ground-water resources and to provide an improved understanding of the primary natural and human factors that affect the quality of these resources. The concepts, implementa tion, and design of the NAWQA Program are described in Hirsch and others (1988), Leahy and others (1990); Leahy and Thompson (1994), and Gilliom and others (1995).
The NAWQA Program has two major compo nents: (1) hydrologic investigations of large river basins and aquifer systems, referred to as Study-Unit Investigations (fig. 1), and (2) a National Synthesis that is organized to provide information about water- quality topics of regional and national concern.
__ EXPLANATION m BEGAN IN 1991
| | BEGAN IN 1994
[ | SCHEDULEDTO BEGIN IN 1997
Figure 1. Location of National Water-Quality Assessment Program Study Units and their proposed implementation dates (from Gilliom and others, 1995).
Plan for Assessment of the Occurrence, Status, and Distribution of VOCs in Aquifers of the U.S.

Study-Unit Investigations and their scheduling are described in Leahy and others (1990). As of 1995, four water-quality topics of regional and national concern have been selected for NAWQA's National Synthesis. Studies of pesticides and nutrients began in 1991, and studies of volatile organic compounds (VOCs) and of aquatic ecosystems began in 1994.
Purpose and Scope
The purpose of this report is to describe the plan for national assessment of the occurrence, status, and distribution of VOCs in ground water of the United States, with a focus on major aquifers. The assess ment relies largely on data collected by NAWQA Study Units (fig. 1). Seven pilot NAWQA Study-Unit Investigations began in 1986. Three of these pilot investigations collected ground-water-quality data. Twenty additional Study-Unit Investigations began in 1991 and 15 began in 1994. Additional investigations are scheduled to begin in 1997, some of which might be continuations of the pilot investigations that began in 1986.
During 1995, a major effort of the investigations that began in 1994 is analysis of existing water-quality data. Results of this Retrospective Analysis will help guide the Study-Unit ground-water design by devel oping an understanding of the occurrence, status, and distribution of VOC target analytes and other chemical constituents in ground water in the Study Unit. These Retrospective Analyses also are anticipated to be a primary source of data for the planned national assess ment described in this report. Because of the impor tance of these Retrospective Analyses to this assessment, the plan described herein is presented as guidance to the 1994 Study Units for compilation of VOC data during their Retrospective Analyses. However, the guidance also generally applies for all other VOC-data compilations that will be used by the VOC National Synthesis for the assessment described in this report.
Acknowledgments
The authors would like to thank James Stark of the NAWQA Upper Mississippi River Basin Study Unit and Anthony J. Tesoriero of the NAWQA Puget Sound Study Unit for their technical reviews of this plan. The authors also thank Lanna Combs of the
USGS in Lawrence, Kansas for providing an editorial review of the report and Ella Decker of the USGS in Huron, South Dakota, for preparing it for publication.
NATIONAL SYNTHESIS OF VOLATILE ORGANIC COMPOUNDS
VOCs were selected for National Synthesis because of the occurrence of this constituent group in many of the Nation's water supplies (Tennant and others, 1992; Pankow and Cherry, 1996). The broad goals of the VOC National Synthesis reflect those of the entire NAWQA Program: (1) to describe current water-quality conditions; (2) to define trends, or lack of trends; and (3) to identify, describe, and explain causal relations among the occurrence and distribution of VOCs in surface water and ground water and natural and human factors. Fifty-five VOCs, including of halogenated alkanes, halogenated alkenes, alkyl benzenes, aromatic hydrocarbons, halogenated aromatics, ethers, and others (table 1), have been iden tified for study (John Zogorski, written commun., 1995). The VOCs in table 1 are collectively called the NAWQA "VOC target analytes" in this report.
VOCs are of concern in ground water because of their relatively high aqueous solubility, mobility, and persistence, because many VOCs are known or suspected carcinogens, and because of their wide spread use. The National Synthesis of VOCs in ground water has three objectives: (1) describe their occurrence, status, and distribution (VOC occurrence assessment); (2) determine relations between VOC target analytes in shallow ground water and natural and human factors; and (3) determine, compare, and contrast the occurrence, transformation, transport, and fate of selected VOC target analytes in ground water for several regionally or nationally important aquifer systems.
PLAN FOR ASSESSMENT OF OCCURRENCE, STATUS, AND DISTRIBUTION OF VOLATILE ORGANIC COMPOUNDS IN GROUND WATER
The objective of the assessment of VOCs in ground water discussed in this report is to describe the occurrence, status, and distribution of VOCs in major
Plan for Assessment of Occurrence, Status, and Distribution of VOCs in Ground Water

Table 1. Volatile organic compound target analytes 1 in the National Water-Quality Assessment Program
[CAS, Chemical Abstract Services; U.S. EPA, U.S. Environmental Protection Agency; USGS, U.S. Geological Survey; VOC, volatile organic compound; N/A, there is no parameter code for this compound; IUPAC, International Union of Pure and Applied Chemistry]
VOC compound, by compound class2
Halogenated Alkanes
Tetrachloromethane (Carbon Tetrachloride)
Trichloromethane (Chloroform)
Hexachloroeth ane
1,1,1 -Trichloroethane
Bromomethane
Chloromethane
Chloroethane
Dichloromethane (Methylene Chloride)
Tribromomethane (Bromoform)
Bromodichloromethane
1 , 1 -Dichloroethane (1,1 -DCA)
Trichlorofluoromethane (CFC 11)
Dichlorodifluoromethane (CFC 12)
l,l,2-Trichloro-l,2,2-trifluoroethane(Freon 113, CFC 113)
1 ,2-Dichloropropane
1 , 1 ,2-Trichloroethane (1,1 ,2-TCA)
1 ,2-Dibromo-3-chloropropane (DBCP)
1 ,2,3-Trichloropropane
1 ,2-Dibromoethane (EDB)
1,2-Dichloroethane
Chlorodibromomethane
Halogenated Alkenes
Chloroethene (Vinyl Chloride)
1,1-Dichloroethene
Trichloroethene (TCE)
l,l,2,3,4,4-Hexachloro-l,3-butadiene (Hexachlorobutadiene)
Tetrachloroethene (PCE)
cis-l ,2-Dichloroethene
Irons- 1 ,2-Dichloroethene
Bromoethene
cis-l ,3-Dichloropropene
trans- 1 ,3-Dichloropropene
Aromatic Hydrocarbons
Benzene
Naphthalene
Styrene (Vinyl Benzene)
CAS number
56-23-5
67-66-3
67-72-1
71-55-6
74-83-9
74-87-3
75-00-3
75-09-2
75-25-2
75-27-4
75-34-3
75-69-4
75-71-8
76-13-1
78-87-5
79-00-5
96-12-8
96-18-4
106-93-4
107-06-2
124-48-1
75-01-4
75-35-4
79-01-6
87-68-3
127-18-4
156-59-2
156-60-5
593-60-2
10061-01-5
10061-02-6
71-43-2
91-20-3
100-42-5
U.S. EPA and USGS parameter code
32102
32106
34396
34506
34413
34418
34311
34423
32104
32101
34496
34488
34668
77652
34541
34511
82625
77443
77651
32103
32105
39175
34501
39180
39702
34475
77093
34546
50002
34704
34699
34030
34696
77128
Plan for Assessment of the Occurrence, Status, and Distribution of VOCs in Aquifers of the U.S.
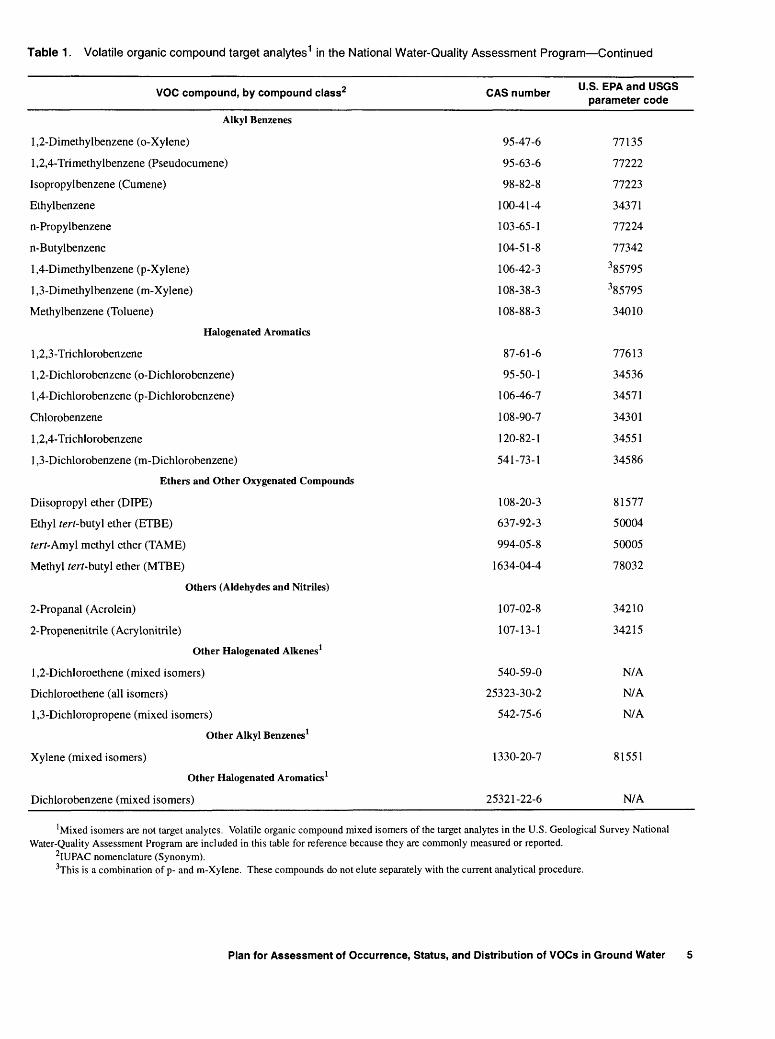
Table 1 . Volatile organic compound target analytes 1 in the National Water-Quality Assessment Program Continued
VOC compound, by compound class2
Alkyl Benzenes
1,2-Dimethylbenzene (o-Xylene)
1 ,2,4-Trimethylbenzene (Pseudocumene)
Isopropylbenzene (Cumene)
Ethylbenzene
n-Propylbenzene
n-Butylbenzene
1 ,4-Dimethylbenzene (p-Xylene)
1,3-Dimethylbenzene (m-Xylene)
Methylbenzene (Toluene)
Halogenated Aromatics
1 ,2,3-Trichlorobenzene
1 ,2-Dichlorobenzene (o-Dichlorobenzene)
1 ,4-Dichlorobenzene (p-Dichlorobenzene)
Chlorobenzene
1 ,2,4-Trichlorobenzene
1 ,3-Dichlorobenzene (m-Dichlorobenzene)
Ethers and Other Oxygenated Compounds
Diisopropyl ether (DIPE)
Ethyl tert-buty\ ether (ETBE)
tert-Amyl methyl ether (TAME)
Methyl tert-butyl ether (MTBE)
Others (Aldehydes and Nitrites)
2-Propanal (Acrolein)
2-Propenenitrile (Acrylonitrile)
Other Halogenated Alkenes1
1,2-Dichloroethene (mixed isomers)
Dichloroethene (all isomers)
1 ,3-Dichloropropene (mixed isomers)
Other Alkyl Benzenes1
Xylene (mixed isomers)
Other Halogenated Aromatics1
Dichlorobenzene (mixed isomers)
CAS number U.S. ERA and USGS parameter code
95-47-6 77135
95-63-6 77222
98-82-8 77223
100-41-4 34371
103-65-1 77224
104-51-8 77342
106-42-3 3 85795
108-38-3 3 85795
108-88-3 34010
87-61-6 77613
95-50-1 34536
106-46-7 34571
108-90-7 34301
120-82-1 34551
541-73-1 34586
108-20-3 81577
637-92-3 50004
994-05-8 50005
1634-04-4 78032
107-02-8 34210
107-13-1 34215
540-59-0 N/A
25323-30-2 N/A
542-75-6 N/A
1330-20-7 81551
25321-22-6 N/A
'Mixed isomers are not target analytes. Volatile organic compound mixed isomers of the target analytes in the U.S. Geological Survey NationalWater-Quality Assessment Program are included in this table for reference because they are commonly measured or reported.
2IUPAC nomenclature (Synonym). 3This is a combination of p- and m-Xylene. These compounds do not elute separately with the current analytical procedure.
Plan for Assessment of Occurrence, Status, and Distribution of VOCs in Ground Water

aquifers of the United States, both for individual aqui fers and collectively. Occurrence describes the pres ence or absence of VOCs, their frequency of occurrence, and their ranges of concentrations. Status compares the concentrations of VOCs detected in rela tion to water-quality regulations or advisories, such as Maximum Contaminant Levels, Proposed Maximum Contaminant Levels, Maximum Contaminant Level Goals, and Health Advisories. Distribution describes the variability of VOCs in ground water, areally and by depth.
Analysis of temporal trends in VOCs is not a primary objective of the assessment described in this report because identifying temporal trends, or lack of trends, and interpreting those trends requires historic VOC and ancillary data that most likely are not widely available. However, VOC data sets suitable for trend assessment might be identified during the conduct of the assessment described herein.
The assessment will be nationwide for aquifers, or those parts of aquifers that are currently used or have the potential to be used as sources of water supplies. Parts of aquifers at or immediately downgra- dient of known sources of contamination generally are unsuitable for use as a water supply, and assessment of these parts of aquifers is beyond the scope of this assessment. Assessment of the quality of these parts of aquifers is being done in other programs, such as the U.S. Environmental Protection Agency (USEPA) RCRA (Resource Conservation and Recovery Act) and CERCLA (Comprehensive Environmental Response, Compensation, and Liability Act) Programs.
Interpretations of the reasons for observed occurrence and distribution of VOCs, such as the rela tion of the occurrence and distribution of VOCs to natural factors and human activities, probably will be minimal. Interpretation will be difficult because of a number of complicating factors, including the lack of consistency in design and conduct of the studies from which the VOC data are derived and because of the lack of detailed, ancillary information associated with the VOC data that would be required for this type of interpretation. Data deficiencies will be identified as part of the assessment. When feasible, enhancements to the data sets, such as subsequent compilation of important ancillary data, will be completed.
This assessment will be done by collective analysis of data from monitoring programs across the Nation. Data from these monitoring programs will be
compiled into a national data base for this analysis. Criteria for monitoring-program design, sample- collection methods, and methods of laboratory analysis will be met before data are entered into this data base. The assessment will be based on data collected since 1985, for as many of the 55 VOCs currently (1996) on the list of NAWQA VOC target analytes (table 1) as possible. Assessment by aquifer and comparisons of results among aquifers also will be completed for those aquifers that have adequate data, spatially or by depth.
The proposed timeline for data collection, compilation and analysis, and reporting of results of this assessment is shown in table 2. A relatively limited assessment of VOC occurrence, status, and distribution will be reported in 1997, using: (1) data compiled by 1994 NAWQA Study Units during their year of Retrospective Analysis in 1995; (2) data from Study-Unit Surveys completed by 1991 NAWQA investigations; (3) data compiled by 1991 NAWQA investigations during Retrospective Analysis in 1992, to the extent that data were compiled; and (4) data compiled by NAWQA VOC National Synthesis from the pilot NAWQA investigations and selected retro spective data from State, multi-State, and Federal programs not covered by items (1) to (3). A subse quent assessment of VOC occurrence, status, and distribution will be reported in 2001. This last assess ment will use all of the data from items (1) through (4) plus data compiled from States not covered in item (4), as well as (5) retrospective data compiled by NAWQA Study Units in States covered by 1997 NAWQA investigations, if not already completed by the VOC National Synthesis, (6) data from Study-Unit Surveys completed by 1994 NAWQA investigations, and (7) data from Study-Unit Surveys by the 1997 NAWQA investigations that have been collected by the year 2000 (table 2).
The plan for the assessment of occurrence, status, and distribution of VOCs in ground water consists of selecting VOC and related data from wells, submitting those data to a national data base, and analyzing and summarizing those data. Data selection consists of an inventory of local, State, and Federal monitoring programs followed by an evaluation of the suitability of data collected in those monitoring programs or well networks for the assessment. VOC and ancillary data subsequently are selected from suit able programs or well networks. Submittal of the data into a national VOC data base is completed in a
Plan for Assessment of the Occurrence, Status, and Distribution of VOCs in Aquifers of the U.S.

Table 2. Timeline for data collection, compilation, and reporting of results for the assessment of occurrence, status, and distribution of volatile organic compounds in ground water[VOCs, volatile organic compounds; NAWQA, National Water-Quality Assessment]
Data source for assessment of occurrence, status, and distribution of VOCs in ground water
(1) Retrospective data compiled by 1994 NAWQA Study Units.
(2) Data from Study-Unit Surveys by 1991 NAWQA Study Units.
(3) Retrospective data compiled by 1991 NAWQA Study Units 1 .
(4) Retrospective data compiled by NAWQA VOC National Synthesis from the pilot NAWQA studies and selected State, multi-State, and
Data collection completed
1995
1995
1992
Ongoing until 2000.
Data compilation into national VOC occurrence data base completed
1996
1996
1995 or later
Some compilation in 1995 and 1996.
Data analysis by VOC National
Synthesis completed
1997
1997
1997 and 2000
1997 and 2000
Federal programs not covered by 1991 or 1994 NAWQA Study Units.
(5) Retrospective data compiled by NAWQA Study Units in States 1998 covered by 1997 NAWQA Study Units, if not already completed by VOC National Synthesis
(6) Data from Study-Unit Surveys by 1994 NAWQA Study Units 1998
(7) Data from Study-Unit Surveys by 1997 NAWQA Study Units2 . 2001
Total compilation in 2000.
1999 2000
1999 2000
2001 22001
'Compilation of retrospective VOC data by the 1991 NAWQA Study Units into a national occurrence data base was not part of their plans for Retro spective Analysis. However, compilations that were completed and that meet criteria described in this report will be used in the assessment of occurrence, status, and distribution of VOCs in ground water. Also, some additional compilation might be completed by the 1991 Study Units as part of their low-level assessment activities from 1997 to 2000.
2The intensive data-collection period for the 1997 NAWQA Study Units is from 1999 through 2001. Therefore, data collection for some Study-Unit Surveys will be completed during 1999 and 2000. These data will be available for analysis in the year 2001.
prescribed format. Once all data are in the national VOC data base, the occurrence, status, and distribu tion of VOCs will be summarized and presented at aquifer, regional, and national scales.
Data Selection
Inventory of local, State, and Federal Monitoring Programs
The purpose of the inventory of local, State, and Federal monitoring programs (see "Supplemental Information" section) is to identify programs in which VOC and associated ancillary data, such as well loca tion, well construction, and hydrogeologic informa tion, are being collected that are suitable for describing the occurrence, status, and distribution of VOCs in major aquifers. The inventory also might identify programs in which VOC and associated ancil lary data are being collected for (1) analyses of rela tions among VOCs in shallow ground water and
natural and human factors and (2) analysis of temporal trends of VOCs in ground water.
Data Needs
Concentration data for all VOC analytes avail able from those on the target list (table 1) need to be compiled. In addition, ancillary data are needed for the National Synthesis to describe and interpret the occurrence, status, and distribution of VOCs in major aquifers across the Nation. Compilation of well loca tion, well construction, hydrogeologic, and other data (table 3) is needed for this analysis to the extent that these ancillary data are available. Data in table 3 were requested in 1995 for compilations being done by the 1994 Study Units during their year of Retrospective Analysis. These data will be entered into a national VOC occurrence data base. Additional information about the data elements listed in table 3 and probable formats for data submittal are given in table 4.
Data Selection

Table 3. Data requested for submittal to the national volatile organic compound (VOC) occurrence data base for use in assessment of occurrence, status, and distribution of VOCs in ground water[VOC, volatile organic compounds; NWIS, U.S. Geological Survey National Water Information System; rdb, relational data base; GIS, geographic information system; LSD, land-surface datum; NGVD, National Geodetic Vertical Datum; C, component in U.S. Geological Ground-Water Site Inventory; P, U.S. Environmental Protection Agency parameter code; N/A, No parameter code for this compound]
Description of component, parameter, or other data NWIS component (C) or parameter (P) code, or other description
Cross reference of well to monitoring program
Monitoring program description from VOC inventory table
Cross reference of well to aquifer in which the monitoring well is screened
Description and ancillary information about the aquifer/hydrogeologic unit for which VOC data are compiled and submitted to the National data base
Boundary of each aquifer/hydrogeologic unit for which VOC data are compiled and submit ted to the national data base
Source agency code
Site ID (station number)
Latitude
Longitude
Local well number
District code
State code
County code
Type of site
Record classification
Altitude of land surface
Primary use of site
Primary use of water
Depth of well
Agency use of site code
Locator sequence number
Casing material
Depth to top of this open interval
Depth to bottom of this open interval
Type of openings in this interval
Depth to top of interval
Depth to bottom of interval
Aquifer code
Lithology code
Description of material
Contributing unit
Aquifer-type code
Aquifer code
Site ID (only needed if the water-quality data are from a different data base than the well-construction data)
As an rdb table
As an rdb table
As an rdb table
As an rdb table
GIS coverage
C004
C001
C009
C010
C012
C006
C007
COOS
C002
C003
C016(sameasP72000)
C023
C024
C028 (same as P72008)
C803
C815
C080
C083 (same as P72015)
C084 (same as P72016)
C085
C091(sameasP72002)
C092 (same as P72003)
C093
C096
C097
C304
C713
C714
STAID (same as C001)
8 Plan for Assessment of the Occurrence, Status, and Distribution of VOCs in Aquifers of the U.S.

Table 3. Data requested for submittal to the national volatile organic compound (VOC) occurrence data base for use in assessment of occurrence, status, and distribution of VOCs in ground water Continued
Description of component, parameter, or other dataNWIS component (C) or parameter (P)
code, or other description
Date
Time
Agency collecting sample (code number)
Agency analyzing sample (code number)
Well selection criteria, code
Project component, code
Sampler type, code
Sample purpose code
Elevation of land surface datum (LSD, in feet NGVD)
Depth of hole, total (in feet)
Depth to top of water-bearing zone sampled (in feet)
Depth to bottom of water-bearing zone sampled (in feet)
Pump or flow period prior to sampling (in minutes)
Sample source (codes)
Sampling condition (code)
Depth of well, total (in feet)
Depth to top of sample interval (in feet below LSD)
Depth to bottom of sample interval (in feet below LSD)
Depth below land surface to water level (in feet)
VOC-concentration data for all analytes on the target list, as available (see table 1 for list of target analytes)
DATES
TIMES
P00027
P00028
P84144
P84145
P84164
P71999
P72000(sameasC016)
P72001
P72002(sameasC091)
P72003 (same as C092)
P72004
P72005
P72006
P72008 (same as C092)
P72015(sameasC083)
P72016(sameasC084)
P72019
See table 1 for P codes
Data Selection

Table 4. Details of data requested for submittal to the national volatile organic compound (VOC) occurrence data base for use in assessment of occurrence, status, and distribution of VOCs in ground water
[See footnote 1 for additional data elements required for creation of a site file in the U.S. Geological Survey Ground-Water Site Inventory (GWSI) data base; QWDATA, U.S. Geological Survey Water-Quality Data Base; CIS, geographic information system; LSD, land-surface datum; DD, National Water-Quality Assessment Program (NAWQA) data dictionary; NWIS, U.S. Geological Survey National Water Information System]
Data element or other information Source for definition of data element2 Example of data element
Suggested storage location of data
element3
Monitoring Program/Network and Aquifer Information
Cross reference of well to monitoring program
Monitoring program description from VOC inventory (form B)
Cross reference of well to aquifer in
See "Supplemental Information"
do.
do.
See "Supplemental Information"
do.
do.
netsite.rdb file
netdes.rdb file
aqsite.rdb filewhich the monitoring well is screened
Description and ancillary information about the aquifer/hydrogeologic unit for which VOC data are compiled and submitted to the national data base
Boundary of each aquifer/hydrogeo logic unit for which VOC data are compiled and submitted to the national data base
do.
Table 17 in DD. GIS coverages: Hydro- geologic unit boundaries polygons 1:100,000, UNITNAME 40, 40, C: Name of aquifer or hydrogeologic unit
do. aqdes.rdb file
Upper glacial aquifer GIS coverage
Well Site and Construction, and Hydrogeologic Data Associated with the Analyte-Concentration Data
Site (Station) identification number
Station name
Latitude
Longitude
State
Monitoring program well-selection criteria
C001 431209100501701
CO 12 (C900 also is automatically populated 120N69W14ACCD or when CO 12 is populated) Cuny well near
Rapid City, SD.
C009 431209
C010 1005017
C007 SD
P84144 in DD 200
GWSI
GWSI
GWSI
GWSI
GWSI
QWDATA
Altitude of land surface (if readily available)
Use of site C023
Use of water (primary use) C024
Aquifer type (for the aquifer that was C713 sampled)
Primary aquifer (for the aquifer that C714 was sampled)
Well depth (in feet below land surface) C028
100 for site selected because near/withinlocal problem area
200 for site selected without regard tolocal problem area
C016 1000 GWSI
O (for observation) GWSI
P (for public supply) GWSI
C (for confined single GWSI aquifer)
lOOCNZC(forCenozoic) GWSI
140.5 GWSI
10 Plan for Assessment of the Occurrence, Status, and Distribution of VOCs in Aquifers of the U.S.

Table 4. Details of data requested for submittal to the national volatile organic compound (VOC) occurrence data base for use in assessment of occurrence, status, and distribution of VOCs in ground water Continued
Data element or other information Source for definition of data element2 Example of data element
Suggested storagelocation of data
element3
Well Site and Construction, and Hydrogeologic Data Associated with the Analyte-Concentration Data Continued
Water level (in depth below land surface) and date of measurement
Collecting agency
Analyzing agency
Casing material
Depth to top of open interval (perforated or screened, in feet below LSD)
P72019 (In the event that no water level was measured at the time of sampling, use GWSI water-level components - C237 with date C235. If there are no data in C237 and C235, use data in C30 and C31.)
P00027
P00028
C080
C083
75.3 QWDATA
Depth to bottom of open interval (per- C084 forated or screened, in feet below LSD)
Type of opening C085
1028
1028
S (for steel)
132
137
R (for wire-wound screen)
Hydrogeologic Data for the Aquifer that was Sampled
Contributing unit (for the aquifer C304 that was sampled)
Depth to top of unit (that was sam- C091 pled, in feet below LSD)
Depth to bottom of unit (that was sam- C092 pled, in feet below LSD)
P (for primary)
80
155
QWDATA
QWDATA
GWSI
GWSI
GWSI
GWSI
GWSI
GWSI
GWSI
Unit identifier
Lithology
Lithologic modifier
C093
C096
About 90 possible terms are listed under this C code to describe the principal lithology of the aquifer that was sampled. To the extent possible, without incor rectly identifying the lithology, catego rize lithology by broad categories, such as igneous, metamorphic, sedimentary, basalt, granite, sandstone, shale, lime stone, dolomite, sand and gravel, silt and clay, till.
C097
lOOCNZC(forCenozoic) GWSI
SDGL (for sand and GWSI gravel)
Brownish red GWSI
Hydrogeologic Data Repeated for Major Hydrogeologic Units Overlying the Sampled Aquifer to Record Hydrogeologic Information About Those Units That Might Affect or Provide Explanation for Concentrations of VOCs in the Sampled Aquifer
Contributing unit C304
Depth to top of unit (in feet below C091 LSD)
Depth to bottom of unit (in feet C092 below LSD)
N (for contributes no water)
15
80
GWSI
GWSI
GWSI
Data Selection 11

Table 4. Details of data requested for submittal to the national volatile organic compound (VOC) occurrence data base for use in assessment of occurrence, status, and distribution of VOCs in ground water Continued
Data element or other information Source for definition of data element2 Example of data element
Suggested storagelocation of data
element3
Hydrogeologic Data Repeated for Major Hydrogeologic Units Overlying the Sampled Aquifer to Record Hydrogeologic Information About Those Units That Might Affect or Provide Explanation for Concentrations of VOCs in the Sampled Aquifer Continued
Aquifer code (geologic age and unit identifier)
Lithology
Lithologic modifier
Analyte concentration
Date sample was collected (YearMonthDay)
C093
C096
About 90 possible terms are listed under this C code to describe the principal lithology of the major hydrogeologic units overlying the sampled aquifer. To the extent possible, without incorrectly identifying the lithology, categorize lithology by broad categories, such as igneous, metamorphic, sedimentary, basalt, granite, sandstone, shale, lime stone, dolomite, sand and gravel, silt and clay, till.
lOOCNZC(forCenozoic) GWSI
CLSD (for clay, some sand)
GWSI
C097
For Each VOC Analyte
P codes (including Remarks code) and value for each analyte.
If the analyte was not measured, but cannot be easily removed from the list of ana- lytes, indicate this missing value as .
Grey, soft
P34235 = 0.1(<:::)or P34235=<0.1 for benzene dissolved that was measured and was below the quantitation level of
GWSI
QWDATA
Do not enter nonmeasured values as =0. 0.1 Jig/L.
Concentrations reported as non-detections (ND) will be of limited value for this assessment of occurrence, status, and dis tribution of VOCs in ground water because of the wide possible range of quantitation levels that could be associ ated with an ND. For this reason, it is requested that an extra effort be made to determine the quantitation level. If the analyte was measured but not detected (ND) or if a nondetection is indi cated as a zero value, then the value (0 or ND) should be modified to indicate the value is less than the quantitation level for that analyte. If the quantitation level absolutely cannot be obtained, indicate as ND.
At a minimum, the year that the sample was 930723 (for collected should be listed. Include month YYMMDD) and day, when that information is avail able.
QWDATA
'The following additional GWSI data elements - C codes are required for establishing a site file for entry of data into GWSI; Station locator sequence number - C815; Agency code - C004; District - C006; County - COOS; Agency use - C803; Station type - C802; Data reliability - C003; Site type - C002.
2Source : C, component number in GWSI; P, parameter code in QWDATA; DD, see NAWQA data dictionary.Suggested storage location: rdb file, relational data base file for submittal to IDE (NAWQA Interim Data Base), QWDATA, or GWSI in the U.S.
Geological Survey's National Water Information System (NWIS). Do not include analyses of quality-control samples.
12 Plan for Assessment of the Occurrence, Status, and Distribution of VOCs in Aquifers of the U.S.

Criteria for Selection of Wells and Volatile Organic Compound Data
General Selection Criteria
After the VOC inventory described in "Supple mental Information" (at back of this report) is completed, the suitability of existing VOC data for use in the assessment of occurrence, status and distribu tion of VOCs in ground water is evaluated by each Study Unit in consultation with the VOC National Synthesis staff. In general, the criteria for selection of wells for NAWQA Study-Unit Surveys (Lapham and others, 1995) should be followed when selecting wells for the assessment described in this report. VOC data are selected for the assessment on the basis of well- network design, well construction, and sample- collection and laboratory-analysis criteria that need to be met for each well (table 5). Selected VOCs that are measured by several different laboratory schedules or methods are listed in table 6. Not all schedules and methods that include measurements of the indicated compounds are included in table 6. Some or all of the VOC data that meet these criteria will be compiled by the 1994 Study-Unit Staff. The same approach will be used by the VOC National Synthesis to compile data from selected local, State, multi-State, and Federal programs not compiled by Study Units.
Well-Network Design
A well network is best suited for this national assessment of occurrence, status, and distribution of VOCs in ground water if its design results in a gener ally unbiased, areally distributed, random selection of sampling sites throughout the aquifer or part of the aquifer of interest (table 5). This network design is based on random selection with equal-area distribution (Alley, 1993). Computerized methods for random site selection are presented in Scott (1990).
It is unlikely that many existing monitoring programs follow the ideal design because of the inability to install wells exactly at randomly located sites. Thus, a common compromise is to install wells as close as possible to the randomly located sites. In many monitoring programs, the cost of drilling precludes well installation. In this case, rather than installing wells, existing wells that are located as near as possible to the randomly located site and that meet certain construction criteria are selected for sampling. This approach is used for NAWQA Study- Unit Surveys (Gilliom and others, 1995; Lapham and
Table 5. Criteria for selection of volatile organic compound (VOC) data for assessment of occurrence, status, and distribution of VOCs in ground water
Well-Network Design
Wells are suitably located in relation to the desired spatial and depth design.
All wells or a subset of wells from one or more well networks collectively result in a generally unbiased, random, equal-area distribution of sampling sites throughout the aquifer or part of the aquifer of interest.
Well Construction1
The hydrogeologic unit (or units) represented by the water level measured and the hydrologic unit (or units) contributing water to the well are known.
The well construction and pumping equipment in the well are known to be of a type that are not likely to affect concentrations of VOCs in the water sample.
Criteria for Selection of VOC Data
VOC data are considered suitable for use in the assessment if:
National methods for collection and analysis of VOCs were used (information on analytes measured by different methods is presented later in this report). The method detection limits or the reporting levels for VOC analytes should be less than about 5 micrograms per liter.
Laboratory analysis was done by a laboratory certified by the U.S. Environmental Protection Agency.
The location of the well from which the sample was collected is known by latitude and longitude.
The sample was collected from untreated (raw) water. The water sample was collected at or near the well head before
being held in a pressure tank or holding tank. The analyte name is identified by P code (see table 1) and the
analyte concentration is known. The date (at a minimum, the year) of sample collection is
known. (In general, the latest measured concentration of the analyte from a well after January 1, 1985, is requested. How ever, in some cases this criteria may not apply. See "Selection of a Volatile Organic Compound Analysis From Several Avail able for a Well" for further guidance.)
Quality-control data have been used to evaluate and, if neces sary, to censor the environmental data prior to its compilation at a national level to the extent that quality-control data are available.
'See Lapham and others (1995) for discussion of possible effects of well construction on the chemistry of a water-quality sample.
others, 1995). For the assessment described in this report, deviation from the ideal network design is complicated further by the fact that VOC data must have been collected. Thus existing wells need to be found that collectively result in a network of wells that closely fits the ideal network design, that have been sampled for VOCs, and that meet the other suitability criteria in table 5.
Data Selection 13

Tabl
e 6.
S
elec
ted
vola
tile
orga
nic
com
poun
ds (
VO
Cs)
mea
sure
d by
indi
cate
d U
.S.
Geo
logi
cal
Sur
vey
Nat
iona
l Wat
er-Q
ualit
y La
bora
tory
sch
edul
es a
nd U
.S.
Env
ironm
enta
l Pro
tect
ion
Age
ncy
met
hods
1T3 Q
)3 6* (0 sessm <D o -h <D O O o c <D O JO </
> sc" y Q) 3
Q. g CT C 5' 3 O o 0) 5' .Q 3* w o -h <D C
CO
[NW
QL
, U
.S.
Geo
logi
cal
Surv
ey N
atio
nal
Wat
er-Q
ualit
y L
abor
ator
y; U
.S. E
PA,
U.S
. Env
iron
men
tal
Prot
ectio
n A
genc
y; C
AS,
Che
mic
al A
bstr
acts
Ser
vice
s; R
CR
A,
Res
ourc
e C
onse
rvat
ion
and
Rec
over
y A
ct;
x, a
naly
te m
easu
red
by th
at s
ched
ule
or m
etho
d; V
OC
, V
olat
ile O
rgan
ic C
ompo
und;
GC
/MS
Gas
Chr
omat
ogra
phy/
Mas
s Sp
ectr
omet
ry]
NW
QL
CA
S nu
mbe
r
56-2
3-5
67-6
6-3
67-7
2-1
71-5
5-6
74-8
3-9
74-8
7-3
75-0
0-3
75-0
9-2
75-2
5-2
75-2
7-4
75-3
4-3
75-6
9-4
75-7
1-8
76-1
3-1
78-8
7-5
79-0
0-5
96-1
2-8
96-1
8-4
106-
93-4
107-
06-2
124-
48-1
75-0
1-4
75-3
5-4
Com
poun
d na
me
Tet
rach
loro
met
hane
(ca
rbon
tetr
achl
orid
e)
Tri
chlo
rom
etha
ne (
chlo
rofo
rm)
Hex
achl
oroe
than
e
1,1,
1 -T
rich
loro
etha
ne
Bro
mom
etha
ne
Chl
orom
etha
ne
Chl
oroe
than
e
Dic
hlor
omet
hane
(m
ethy
lene
chlo
ride
)
Tri
brom
omet
hane
(br
omof
orm
)
Bro
mod
ichl
orom
etha
ne
1 , 1
-Dic
hlor
oeth
ane
Tri
chlo
rofl
uoro
met
hane
(C
FC 1
1)
Dic
hlor
odif
luor
omet
hane
(C
FC 1
2)
1, 1
,2-T
rich
loro
- 1,2
,2-
trif
luor
oeth
ane
(CFC
113
)
1 ,2-
Dic
hlor
opro
pane
1 , 1
,2-T
rich
loro
etha
ne
1 ,2-
Dib
rom
o-3-
Chl
orop
ropa
ne(D
BC
P)
1 ,2,
3-T
rich
loro
prop
ane
1 ,2-
Dib
rom
oeth
ane
(ED
B)
1 ,2-
Dic
hlor
oeth
ane
Dib
rom
ochl
orom
etha
ne
Chl
oroe
then
e (v
inyl
chl
orid
e)
1,1-
Dic
hlor
oeth
ene
sche
dule
nu
mbe
rs
§ CM X X X X X X X X X X X X X X X X X X X X X X
§ CO T- X X X X X X X X X X X X X X X X X X X X X X
§O
O
CM
CO
<S
" O
O) X X X X X X X X X X X X X X X X X X X X X X
*~
*~
X X X X X X X X X X X X X X X
in X X X X X X X X X X X X X X X X X X X X
U.S
. EP
A m
etho
d nu
mbe
rs
Drin
king
wat
er
RCRA
CM
r-m
T-_
CM"
co"
*r
in
*rO
O
O
O
CM
^
T.
f
in
o
oC
MC
MoJ-T
-C
MtO
tO
C
MC
Min
in
min
in
in
in
u
X X X X X X X X X X X X X X X
X
X X
X
X X X X
X X X X X X X X X X X X X X X X X X X X X
X X X X X X X X X X X X X X X X X X X X X
5 tO
tO
tO
i-
T
- 0
00
0
X X
XX
X
X
X X X X X X X X X X X X X X X X X X X
Gro
und
wat
er, s
oil,
and
so f
orth
o
m
o
o
o
oT
- T
- CM
CO
O
CM
O
O
O
O
T
- i-
00
00
00
00
00
00
X X
X
X X X X X X X X X X X X X X X

Tab
le 6
. S
elec
ted
vola
tile
orga
nic
com
poun
ds (
VO
Cs)
mea
sure
d by
indi
cate
d U
.S.
Geo
logi
cal S
urve
y N
atio
nal W
ater
-Qua
lity
Labo
rato
ry s
ched
ules
and
U.S
. E
nviro
nmen
tal
Pro
tect
ion
Age
ncy
met
hods
1 C
ontin
ued NW
QL
0 0) sr (D
(D O 5'
3
CA
S nu
mbe
r
79-0
1-6
87-6
8-3
127-
18-4
156-
59-2
156-
60-5
593-
60-2
1006
1-01
-5
1006
1-02
-671
-43-
2
91-2
0-3
100-
42-5
95-4
7-6
95-6
3-6
98-8
2-8
100-
41-4
103-
65-1
104-
51-8
106-
42-3
108-
38-3
108-
88-3
87-6
1-6
95-5
0-1
106-
46-7
108-
90-7
120-
82-1
541-
73-1
108-
20-3
Com
poun
d na
me
Tri
chlo
roet
hene
(T
CE
)
l,l,2
,3,4
,4-H
exac
hlor
o-l,3
-B
utad
iene
Tet
rach
loro
ethe
ne
cis-
1 ,2
-Dic
hlor
oeth
ene
tran
s- 1
,2-D
ichl
oro-
ethe
ne
Bro
moe
then
e
cis-
1 ,3
-Dic
hlor
o- 1
-pro
pene
tran
s- 1
,3-D
ichl
oro-
1 -p
rope
ne
Ben
zene
Nap
htha
lene
Styr
ene
(vin
yl b
enze
ne)
1,2-
Dim
ethy
Iben
zene
(o-
xyle
ne)
1 ,2,
4-T
rim
etyl
benz
ene
Cum
ene
(iso
prop
yl be
nzen
e)
Eth
ylbe
nzen
e
n-Pr
opyl
benz
ene
n-B
utyl
benz
ene
1 ,4-
Dim
ethy
lben
zene
(p-
xyle
ne)
1,3-
Dim
ethy
lben
zene
(m
-xyl
ene)
Met
hylb
enze
ne (
tolu
ene)
1 ,2,
3-T
rich
loro
benz
ene
1 ,2-
Dic
hlor
oben
zene
1 ,4-
Dic
hlor
oben
zene
Chl
orob
enze
ne
1 ,2,
4-T
rich
loro
benz
ene
1 ,3-
Dic
hlor
oben
zene
Diis
opro
pyl
ethe
r (D
IPE
)
sche
dule
nu
mbe
rs
o
en
o CM X X X X X X X X X X X X X X X X X X X X X X X X X
8 CO X X X X X X X X X X X X X X X X X X X X X X
§r--
T-
*7
*M
O
O
CM
CM
S
CO
«e
f O
O
T-
!-
X
X
X X
X
X
X
X
X
X X X X
X
X X
X
X
X
X X X
X
X X X
X
X
X
X
X
X X
X
X
X
X
X
X X
X
X
in
in
X
X X
X
X
X
X
X
X
X
X
X
X X X X X X X X X X X X X X
X
X
X
X
X
X X
X
X
co
rr
0
0in
in
X X X X X X X X X X X X X X X X X X X X X
U.S
. EPA
met
hod
num
bers
Dri
nkin
g w
ater
in
rr"O
CM
in
in X X X X X X X X X X X X X X X X X X X X X
_._
G
roun
d w
ater
, soi
l,rl
CH
A
. -
..an
d so
for
th
^
*":
rrm
oo
om
oo
oo
rrin
coi-
CM
incM
CM
rr
r*-
*-I-C
MC
OO
CM
CM
CM
O*-*-C
MtO
tO
C
MC
M
OO
OO
i-i-
in
in
<o<
o<
o<
oi-i-
co
co
co
co
co
co
co
co
X X X X X X X X X X X X X X X X X X X X
X
X
X
X
X
X
X
X
X
X
X
X
X
X
X
X
X X
X
X
X
X
X
X
X
X
X
XX
X
X
XX
X
X
XX
X
X
X
XX
X
X

Tabl
e 6.
S
elec
ted
vola
tile
orga
nic
com
poun
ds (
VO
Cs)
mea
sure
d by
indi
cate
d U
.S.
Geo
logi
cal S
urve
y N
atio
nal W
ater
-Qua
lity
Labo
rato
ry s
ched
ules
and
U.S
. E
nviro
nmen
tal P
rote
ctio
n A
genc
y m
etho
ds1
Co
ntin
ue
d
CO O
o O c i o D 5?
CA
S nu
mbe
r
111-
44-4
123-
91-1
637-
92-3
762-
75-4
994-
05-8
1634
-04-
410
7-02
-8
107-
13-1
Com
poun
d na
me
Bis
(2-
chlo
roet
hyl)
eth
er
1 ,4-
Dio
xane
Ethy
l te
rt-b
utyl
eth
er (
ET
BE
)
terf
-But
yl f
orm
ate
(TB
F)
tert
-Am
yl m
ethy
l et
her
(tam
e),
(2-M
etho
xy-2
-met
hyl-
buta
ne)
Met
hyl
terf
-but
yl e
ther
(M
TB
E)
2-Pr
open
al (
acro
lein
)
2-Pr
open
enitr
ile (
acry
loni
trile
)
NW
QL
sche
dule
nu
mbe
rs
o
o
o
r^
T-
<n
oo
o>
o
oO
CO
O
CO
^
CM
i-
0>
i-
i-
X X
XX
X
XX
X
XX
X
U.S
. EPA
met
hod
num
bers
_.
..
. r.
^r.«
G
roun
d w
ater
, soi
l, D
rink
ing
wat
er
RC
RA
.
. '
9 an
d so
for
th'T
01!1^
T
^
T
^rinooom
oooo
OO
OO
OC
MC
MC
MO
^T
-C
MU
>U
>
CM
CM
O
O
O
O
i-
i-
ininininininininioio
io
iO
T-T
-
oo
oo
oo
oo
oo
oo
oo
oo
X
X
X
X
X
X
X
XX
X
X
XX
X
'Not
all
sche
dule
s an
d m
etho
ds th
at i
nclu
de m
easu
rem
ents
of t
he i
ndic
ated
com
poun
ds a
re i
nclu
ded
in t
his
tabl
e.
O
o (A CO c
NO
TES:
The
xyle
ne c
once
ntra
tions
are
rep
orte
d as
tota
ls u
sing
U.S
. EPA
met
hods
.
Met
hod
502.
1:
Title
: H
alog
enat
ed V
OC
s in
Wat
er.
Mat
rix:
Dri
nkin
g w
ater
(fin
ishe
d or
any
trea
tmen
t st
age)
and
raw
sou
rce
wat
er.
Met
hod
502.
2:
Title
: H
alog
enat
ed V
OC
s in
Wat
er.
Mat
rix:
D
rink
ing
wat
er (
finis
hed
or a
ny tr
eatm
ent
stag
e) a
nd r
aw s
ourc
e w
ater
.M
etho
d 50
3.1:
Ti
tle:
Aro
mat
ic a
nd U
nsat
urat
ed V
OC
s in
Wat
er.
Mat
rix:
Dri
nkin
g w
ater
(fin
ishe
d or
any
trea
tmen
t sta
ge)
and
raw
sou
rce
wat
er.
Met
hod
504:
Ti
tle:
1 ,2-
Dib
rom
oeth
ane
and
Dib
rom
ochl
orop
ropa
ne in
Wat
er b
y M
icro
extr
actio
n. M
atri
x:
Fini
shed
drin
king
wat
er a
nd u
nfin
ishe
d gr
ound
wat
er.
Met
hod
505:
Ti
tle:
Org
anoh
alid
e Pe
stic
ides
and
PC
Bs.
Met
hod
524.
1:
Title
: V
OC
s in
Wat
er b
y Pu
rge
and
Trap
GC
/MS.
Mat
rix:
D
rink
ing
wat
er (
finis
hed
or a
ny tr
eatm
ent s
tage
) an
d ra
w s
ourc
e w
ater
.M
etho
d 52
4.2:
Ti
tle:
VO
Cs
in W
ater
by
Purg
e an
d Tr
ap G
C/M
S. M
atri
x:
Dri
nkin
g w
ater
(fin
ishe
d or
any
trea
tmen
t sta
ge)
and
raw
sou
rce
wat
er.
Met
hod
525.
1 :
Title
: G
ener
al P
urpo
se O
rgan
ics.
Met
hod
603:
Ti
tle:
Acr
olei
n/A
cryl
onitr
ile.
Met
hod
611:
Ti
tle:
Hal
oeth
ers.
Met
hod
612:
Ti
tle:
Chl
orin
ated
Hyd
roca
rbon
s.M
etho
d 62
5:
Title
: A
cids
(Ph
enol
s), B
ase/
Neu
tral
Org
anoc
hlor
ide
Pest
icid
es a
nd P
CB
s.M
etho
d 16
24:
Title
: V
OC
s by
Iso
tope
Dilu
tion
GC
/MS.
Met
hod
1625
: Ti
tle:
Sem
i-Vol
atile
Org
anic
Com
poun
ds b
y Is
otop
e D
ilutio
n G
C/M
S.M
etho
d 80
10:
Title
: H
alog
enat
ed V
olat
ile O
rgan
ics.
Mat
rix:
Gro
und
wat
er, s
oils
, slu
dges
(w
ater
mis
cibl
e liq
uid
was
tes
and
nonw
ater
mis
cibl
e w
aste
s).
Met
hod
8015
: Ti
tle:
Non
halo
gena
ted
Vol
atile
Org
anic
s.
Mat
rix:
Gro
und
wat
er, s
oils
, slu
dges
(w
ater
mis
cibl
e liq
uid
was
tes
and
nonw
ater
mis
cibl
e w
aste
s).
Met
hod
8020
: Ti
tle:
Aro
mat
ic V
olat
ile O
rgan
ics.
Mat
rix:
Gro
und
wat
er, s
oils
, slu
dges
(w
ater
mis
cibl
e liq
uid
was
tes
and
nonw
ater
mis
cibl
e w
aste
s).
Met
hod
8030
: Ti
tle:
Oth
er N
onha
loge
nate
d V
OC
s. M
atrix
: G
roun
d w
ater
, soi
ls, s
ludg
es (
wat
er m
isci
ble
liqui
d w
aste
s an
d no
nwat
er m
isci
ble
was
tes)
. "
Met
hod
8100
: Ti
tle:
Poly
nucl
ear
Aro
mat
ic H
ydro
carb
ons.
Mat
rix:
Gro
und
wat
er, s
oils
, slu
dges
(w
ater
mis
cibl
e liq
uid
was
tes
and
nonw
ater
mis
cibl
e w
aste
s).
Met
hod
8120
: Ti
tle:
Chl
orin
ated
Hyd
roca
rbon
s.
Mat
rix:
Gro
und
wat
er, s
oils
, slu
dges
(w
ater
mis
cibl
e liq
uid
was
tes
and
nonw
ater
mis
cibl
e w
aste
s).
Met
hod
8310
: Ti
tle:
Poly
nucl
ear A
rom
atic
Hyd
roca
rbon
s.
Mat
rix:
Gro
und
wat
er, s
oils
, slu
dges
(w
ater
mis
cibl
e liq
uid
was
tes
and
nonw
ater
mis
cibl
e w
aste
s).
Met
hod
8240
: A
ppen
dix
IX V
olat
iles
(RC
RA
).M
etho
d 82
70:
App
endi
x IX
Sem
ivol
atile
(R
CR
A).

Well networks used in monitoring programs for which objectives are different from the objectives for this assessment might be based on a design other than unbiased, areally distributed, random selection of sampling sites. Nevertheless, monitoring programs designed either for similar assessments of VOCs or for other objectives still might be considered if, by selecting all or a subset of wells from one or more of these programs, the resulting network collectively produces a network design based on random selection with equal-area distribution.
Different approaches for design of a well network from one or more monitoring programs might be necessary to fit local situations. For purposes of illustration, six hypothetical situations (table 7) are described in the following paragraphs with suggested approaches for selection of wells and data compilation for this assessment. The approaches are intended to result in networks of wells that are based on random selection with equal-area distribution (table 5). The monitoring-program/well-network characteristics described as example monitoring programs 1 and 6 of table 7 cover anticipated end members of types of
Table 7. Examples of monitoring-program or well-network characteristics, requested data compilation, and anticipated analysis of the data[VOCs, volatile organic compounds]
Example monitoring
program
1
2a
or
2b
Total number of wells
in the network(s)
Much greaterthan 100.
do.
do.
Distribution ofwells across the hydro-
geologic unit/ aquifer/part of
the aquifer
Approximateequal-areadistribution.
do.
do.
Amount ofdata1 that are readily available
in an electronic data base
All.
Very little.
do.
Requested number of wells for
which data are compiled
All wells inthe network.
All wells inthe network.
About 100wells randomlyselectedwith equal-area distribution.
Requested amount of
data1 compiled
All.
Data in theelectronicdata base.
As much aspossible.
Anticipated analysis of data
Aquifer- and national-scale analyses ofoccurrence, status, and distribution ofVOCs.
Aquifer- and national-scale analyses ofoccurrence, status, and distribution ofVOCs.
Aquifer- and national-scale analyses ofoccurrence, status, and distribution ofVOCs to the extent supported by theavailable ancillary data.
do.
do.
Much less than 100.
do.
Highly variable.
do.
Approximate equal-area distribution.
All
Very little.
All.
Highly variable. Very little.
do.
do.
As many wells as possible.
do.
All. Aquifer- and national-scale analyses of occurrence, status, and distribution of VOCs.
As much as Aquifer- and national-scale analyses of possible. occurrence, status, and distribution of
VOCs to the extent supported by the available ancillary data.
All. National-scale analyses of occurrence, status, and distribution of VOCs.
As much as National-scale analyses of occurrence, possible. status, and distribution of VOCs to
the extent supported by the available ancillary data.
'Data for assessment of occurrence, status, and distribution of VOCs in ground water described in tables 3 and 4.
Data Selection 17

monitoring programs/well networks for which data might be compiled. It is assumed that the criteria for selection of VOC data in table 5 are met in all exam ples.
Example 1 in table 7 describes a ground-water- quality monitoring program designed to describe the occurrence and distribution of VOCs. The well network consists of a large number of wells that are distributed uniformly throughout the aquifer of interest. Sampling sites were selected randomly by equal-area distribution with respect to both location and depth in the aquifer, and wells were installed at those sites. A broad suite of VOCs were analyzed in water from all wells. Nondetections are reported as values less than the quantitation level. Extensive ancillary data about each well are in an electronic data base. All wells in the network are selected for compi lation of all available VOC and ancillary data requested by the VOC National Synthesis (table 3).
Example 6 in table 7 describes a situation in which one or more well networks are used. Each network consists of small numbers of wells, distrib uted vertically and horizontally throughout the aquifer of interest. Some networks might be biased toward a specific well type, for example, public-supply, domestic-supply, or wells installed at or near known sources of contamination. The total number of wells available is small, and the distribution of wells across the aquifer is highly variable. Few VOC analyses and (or) little ancillary data are available. The approach is to select as many wells as possible from the combined monitoring programs such that there is a reasonably equally distributed number of randomly selected wells across the aquifer.
Well networks that have the characteristics described in example 6 will be the least useful of the six listed in table 7 for this assessment because of the small number of wells and the small amount of ancil lary information available for each well. Data from these programs will be useful in aggregate, but little or no interpretation of the occurrence, status, and distri bution of VOCs for an individual aquifer will be possible. Nevertheless, compilation of data from these programs is preferred to no compilation at all.
Well Construction
Well construction, including construction mate rials, the design of the well, and (or) installation methods can result in a well being unsuitable for sampling of targeted water-quality constituents, such
as VOCs (Lapham and others, 1995). For example, glued PVC monitoring wells, to the extent possible, should not be selected as part of a well network for this assessment because organic compounds, such as tetrahydrofuran, methylethylketone, methylisobu- tylketone, and cyclohexanone, can leach from the glue used to bond unthreaded polyvinylchloride casing. Wells that are screened in several units, that contain multiple screens in different units, or that have long well screens make determination of the source of water to the well difficult. Therefore, wells with these types of design should not be selected, if possible. Oil, grease, and other foreign materials on drilling and associated equipment can be introduced to water bearing units during drilling, well completion, and well development if not removed from the equipment prior to its use. This potential for contamination needs to be considered when gathering and interpreting information about candidate wells. Low-capacity wells should be selected in preference to high-capacity wells because high-capacity wells can draw water from units other than the unit of interest.
It is important to document information regarding construction of a well when submitting the VOC data to the national VOC occurrence data base (table 3), particularly for those wells where construc tion likely might affect concentrations of VOCs in the water sample.
Well Type
An additional complication to the assessment described in this report, which can result from using a network of existing wells, is that well type can bias the results (Alley, 1993; Gilliom and others, 1995; Lapham and others, 1995). For example, although pre-screening of water quality prior to well installation of small public-supply wells probably is not done, pre- screening of water quality from test wells might be performed prior to installing large municipal water- supply wells. A result of pre-screening would be the absence of large municipal supply wells in areas of ground-water contamination. In addition, public- supply wells in areas of contaminated ground water might be removed from service once a contaminant is detected. Consequently, well networks that consist only of large municipal water-supply wells could result in a bias in the assessment toward areas of aqui fers that are not contaminated with VOCs. Conversely, well networks for this assessment that consist only of wells installed immediately downgra- dient of sources of known contamination could result
18 Plan for Assessment of the Occurrence, Status, and Distribution of VOCs in Aquifers of the U.S.

in a biased interpretation that the aquifer is largely contaminated with VOCs.
One of the most common types of wells sampled for VOCs are monitoring wells installed at and near sites of known contamination. Therefore, this well type probably will be one of the most common types from which VOC data are available. Because the focus of this assessment is on aquifers, or those parts of aquifers, that are currently used or have the potential to be used as sources of water supplies, selection of monitoring wells that were installed at or immediately downgradient of sources of known contamination would not be appropriate. However, wells installed upgradient of these sources to deter mine "background" water quality in the aquifer might be selected.
Wells should be selected to minimize bias attributable to well type. Often one of several alterna tive wells of different types that have been sampled for VOCs could be selected at or near a randomly located site. If several wells are available near a randomly located site, the established priority for selecting a well (table 8) is applied. In these situations, the well selected should be the one that is most likely to have been installed with the least regard to the presence or absence of VOCs. Thus, monitoring wells installed to meet the objective of the assessment described in this report, or wells installed to meet other objectives, but without regard to the presence or absence of VOCs, have a higher priority for selection than wells installed in areas where it is assumed that VOCs are absent or than wells installed in areas where data indicate that VOCs are present (table 8). For example, in a situa tion where the alternative is to select either a domestic well or a large municipal-supply well, the domestic well probably is the one most likely to have been installed with the least regard to the presence or absence of VOCs and would be the well selected for this assessment.
Selection of Volatile Organic Compound Data
Selection of a Volatile Organic Compound Analysis from Several Available for a Well
In some cases, a well might have been sampled multiple times. In these cases, a single VOC analysis is selected to represent the well. The decision of which VOC analysis to select is based on the objec tives and sampling design of the monitoring program in which the well is located. Following are examples
Table 8. Suggested priority for well selection for assessment of occurrence, status, and distribution of volatile organic compounds (VOCs) to minimize bias attributable to well type
Well selection based on type, from highest (1) to lowest (4) priority
(1) Wells that were installed without regard to the presence or absence of VOCs, such as monitoring wells installed based on random selection of sites with equal-area distribution throughout an aquifer.
(2) Wells that were installed for objectives other than assessment of the occurrence and distribution of VOCs, but were installed without regard to the presence or absence of VOCs, such as observation wells installed for water-level measure ments, public-supply wells installed without pre-screening for VOCs, and some domestic- and industrial-supply wells.
(3) Wells that were installed at locations where it is assumed that VOCs are absent, such as test wells for locating future water supplies.
(4) Wells that were installed in areas where data indicate that VOCs might be present, such as monitoring wells installed upgradient of sources of known contamination to measure "background" conditions.
of monitoring programs in which wells are sampled multiple times, and the suggested approaches for selecting an analysis to represent each well in that program. The intent of the suggested approaches is to minimize bias in the analyses selected with respect to describing the occurrence and distribution of VOCs in aquifers. Other approaches might need to be devel oped by Study Units for specific monitoring programs. In these cases, an approach should be developed that minimizes bias in the data with respect to the occur rence-and-distribution objective. The Study Unit needs to document that approach for future reference.
In some monitoring programs, all wells are sampled at about the same time (synoptically) and at the same frequency. For example, every well in the network is sampled every year in October. In this case, the most recent analysis is selected. However, in all cases, analyses collected prior to January 1985 are not selected. The reason for this is to obtain the most recent data within the last decade describing the occur rence and distribution of VOCs for all aquifers studied. In some monitoring programs, the frequency of sampling might depend on the detection of VOCs in the well. For example, the frequency of sampling might be increased (for example, to quarterly
Data Selection 19

sampling) if a VOC is detected, whereas other wells in the monitoring program would continue to be sampled at a lower, routine frequency (for example, once every year). In this case, it is suggested that the latest measurement after January 1, 1985, at the low, routine frequency be selected. In some monitoring programs, a "stopping rule" is used to determine if sampling of a well can be discontinued. In this example, sampling is continued only as long as VOCs are detected. If the latest analysis is selected, results will be biased toward nondetections. In this case, it is recommended that one analysis from the well be selected randomly from all analyses made after January 1, 1985.
Censoring Volatile Organic Compound Data Using Quality-Control Data
Quality-control (QC) samples might be included as part of some monitoring programs used for National Synthesis of VOCs. QC samples for VOCs include equipment blanks, field blanks, trip blanks, and field- spiked, replicate samples. Bias and precision measurements from these QC samples reflect combined on-site and laboratory errors that occur during data collection. Other QC samples might be collected to estimate errors associated with a specific on-site or laboratory procedure. To the extent that data from QC samples are available, these data need to be used to evaluate and document the quality of the envi ronmental data.
Data from QC samples are used to make general inferences about bias and measurement precision for selected VOC analytes (Koterba and others, 1995). QC data can be used to demonstrate the effectiveness of equipment-decontamination procedures, to measure changes that occur in analyte concentrations from time of collection to time of analysis, and to support the decision to censor environmental data. For example, use of QC data to isolate and eliminate sources of sample contamination or bias that occur as a result of sample collection and processing are described in Koterba and others (1991) and Christenson and Rea (1993). Use of the magnitude of error estimates from QC data to provide an indication of the quality of ground-water data collected is described in Koterba and others (1991; 1993).
Instrument and Method Detection Limits and Reporting Levels
The magnitudes of the method detection limits or reporting levels for VOC analytes are criteria for selection of an analysis. The method detection limit or the reporting level for a VOC analyte should not be
greater than about 5 M-g/L (micrograms per liter) for that data to be selected for use by the National Synthesis (table 5).
Confusion about differences between instru ment detection limits, method detection limits, and reporting levels warrants brief repetition here of a discussion in U.S. Geological Survey (1994). An instrument detection limit is an analyte's mass equiva lent that would correspond to a signal equal to three times the standard deviation of a series of 10 replicate measurements of a reagent blank signal (Currie, 1988; U.S. Geological Survey, 1994). This detection limit is for a pure analyte and refers only to the sensitivity of the instrument. This is the lowest detection limit that can be achieved and is usually the one reported by instrument manufacturers.
The method detection limit (MDL) is the minimum concentration of a substance that can be measured and reported with 99-percent confidence that the analyte concentration is greater than zero and is determined from analysis of a sample in a matrix containing the analyte (U.S. Environmental Protection Agency, 1992). The 99-percent confidence is defined as three times the standard deviation calculated from seven replicate analyses of a matrix spiked at a concentration of 2.5 to 5 times the instrument signal- to-noise ratio, or 1 to 5 times the estimated detection limit. In this definition of MDL, the analyte has been through all steps of the method (extraction, isolation, analysis). In addition, the MDL is matrix specific. Given these matrix effects and the unavoidable analyte losses throughout the analytical procedure, the MDL can be 2 to 100 times higher than the instrument detec tion limit.
The reporting level cited by the U.S. Geological Survey's National Water-Quality Laboratory (NWQL) is the concentration that the laboratory feels it can reli ably report, regardless of varying sample matrices in a given medium. In some cases, the NWQL reporting levels are lower than their corresponding U.S. EPA MDL's for regulated analytes. The choice of a reporting level reflects many variables, not all of them quantifiable. For some schedules, the NWQL might report reporting levels equal to MDL's. Also, for some new methods, for those analytes for which iden tity is assured, the NWQL will report all concentra tions determined that are greater than the instrument detection limit (uncensored) whether or not they are less than, equal to, or greater than the MDL.
20 Plan for Assessment of the Occurrence, Status, and Distribution of VOCs in Aquifers of the U.S.

Submittal of Data to the Volatile Organic Compound Occurrence Data Base
Submittal of the VOC and ancillary data to the national VOC occurrence data base is accomplished through a formal request. This request was made in the summer of 1995 for data compiled by the 1994 Study Units from their Retrospective Analysis. The request was similar to the environmental and quality- control data requests made to the 1991 Study Units by National Synthesis in 1994. Detailed instructions describing the submittal procedure and format were provided at the time of the data request.
VOC concentration and ancillary data at each well that are requested are listed in table 3. Additional information about the VOC concentration and ancil lary data requested is provided in table 4. In addition, general information about the monitoring programs/ networks from which data were compiled and about the aquifers/hydrogeologic units investigated are requested. This general information is requested as rdb files similar to those in tables 9-12. Table 9 is a cross reference between wells for which VOC data are submitted and monitoring program(s) from which these wells were sampled; the information in table 10 describes each inventoried monitoring program in table 9; table 11 is a cross reference between wells for which VOC data are submitted and the aquifer in which each well is screened; and table 12 describes information about each aquifer in table 11. The infor mation in table 12 will be used for reporting on general characteristics of the aquifers studied and for grouping of aquifers with common characteristics during analysis.
Analysis of Data
The amount of VOC and ancillary data available will determine the extent of the description and inter pretation of the occurrence, status, and distribution of VOCs in major aquifers across the Nation (table 7). Example programs that have the characteristics described in example 1 of table 7 will be the most useful types of programs for analysis by the VOC National Synthesis because of the large number of wells sampled and the large amount of ancillary data known about each well. A large number of analyses of VOCs from an aquifer is desirable because the percentage of an aquifer contaminated by VOCs is likely to be small. The large amount of ancillary data is desirable because more data will enable more exten sive analysis at the aquifer scale for example, anal ysis of occurrence, status, and distribution of VOCs in relation to factors such as depth to the water table, well depth, and well type. The situation described in example 6 of table 7 is probably a common situation that might be encountered. However, programs that have the characteristics described in example 6 will be the least useful for the assessment of those listed in table 7 because of the small number of VOC analyses and the small amount of ancillary information avail able about each well. Data from these programs will be useful in a national aggregation, but little or no interpretation of occurrence of VOCs for an individual aquifer will be possible. Nevertheless, compilation of data from these programs is preferred to no compila tion at all.
Analysis of Data 21

Table 9. Example of a relational data-base file (called netsite.rdb) that identifies each well, for which volatile organic compound (VOC) analyte-concentration data are submitted, in relation to the monitoring program/network from the VOC data-inventory tables (see "Supplemental Information" section)
[Information in this table is for illustrations purposes only; GWSI, U.S. Geological Survey Ground-Water Site Inventory]
# netsite.rdb# Tab-delimited RDB table for each well submitted to the VOC occurrence data base.# Gives STAID for each well for which VOC data are submitted and NETCODE value# identifying monitoring program(s) in which the well was sampled from Study Unit# VOC data-inventory table (See "Supplemental Information" section).## STAID = Station identification number of well in the network (GWSI C001)# NETCODE = Network code value or prefix that identifies the monitoring-program number# recorded in the Study Unit VOC Inventory Table (see "Supplemental Information" section).
This number is the four-letter Study-Unit identification followed by an arbitrary sequence number assigned by the Study Unit; for example, LINJ03.
####STAID15s450715074230101450715074230101450715074230101452043074445601450715072301102450715072301102450715072301102451134074012301441220074221102450715074230101451043074445701450725072301202451434074013301451434074013301441220074221102450715074230101461043074446701460725072301202451734074012901
NETCODE8s
LINJ01 LINJ03 LINJ05 LINJ02 LINJ02 LINJ03 LINJ05 LINJ02 LINJ02 LINJ03 LINJ03 LINJ03 LINJ03 LINJ05 LINJ05 LINJ05 LINJ05 LINJ05 LINJ05
22 Plan for Assessment of the Occurrence, Status, and Distribution of VOCs in Aquifers of the U.S.

Table 10. Example of a relational data-base file (called netdes.rdb) that describes general information about each monitoring program in the volatile organic compound (VOC) data-inventory tables for which VOC analyte-concentration data are submitted[Information in this table is for illustrations purposes only; RCRA, Resource Conservation and Recovery Act; GWSI, U.S. Geological Survey Ground-Water Site Inventory]
# netdes.rdb# Tab-delimited rdb table of descriptions of MONITORING PROGRAMS/WELL NETWORKS# from which VOC and associated ancillary data were compiled for the national Retrospective# Analysis of occurrence, status, and distribution of VOCs in ground water. This information is from# the VOC data-inventory tables (see "Supplemental Information" section). Additional# information is compiled about these programs/networks in the VOC data-inventory tables.### NETCODE = Network code value or prefix that identifies the monitoring-program number# recorded in the Study Unit VOC data-inventory tables. This number is the four-letter Study-Unit# identification followed by an arbitrary sequence number assigned by the Study Unit; for# example, LINJ03.# NETDESC = Descriptive text describing monitoring program.# STATE = State(s) covered by the monitoring program (use two-letter postal State# abbreviations, in caps; if program covers more than one State, separate States by# commas, for example, NY,NJ).# DEFT = Department conducting the program.# EXTENT = Areal extent of program (if statewide, give State name; if county-wide,# give county name; if aquifer-wide, give aquifer name; RCRA-site name; and so forth).# SQMILES = Area covered by the program, in square miles.# BEGINYR = Year monitoring program began.# ENDYR = Year monitoring program ended or'-year'(for example'-1995') if pro gram is ongoing# (use four digits for year; do not enter future dates).# USE = Primary use(s) of water from the wells in the network (use GWSI C24 codes)# as entered in the VOC data-inventory tables, in order of largest to smallest use (separate# uses by commas, for example, H, I, N, P).# NUMSITE = Number of sites (wells) sampled in the network (VOC data are submitted# for all or for a subset of these total number of sites).#NETCODE NETDESC STATE DEPT EXTENT SQMILES BEGINYR ENDYR USE NUMSITE8s 132s 8s 12s 12s 8n 15s 10s 12s 8nLINJ02 Aquifer monitoring program since early 1980's in Nassau Cty using monitoring wells NY.NJ Nassau Cty Nassau Cty
200 1981 -1995 P 450 LINJ04 Monitoring of domestic supply wells since 1986 NJ Ocean Cty Health Dept 500 1986 1986 H 10000
Analysis of Data 23

Table 11. Example of a relational data-base file (called aqsite.rdb) that identifies each well, for which volatile organic compound (VOC) analyte-concentration data are submitted, in relation to the aquifer in which the monitoring well is screened[Information in this table is for illustrations purposes only; GWSI, U.S. Geological Survey Ground-Water Site Inventory]
# aqsite.rdb# Tab-delimited rdb table for each well submitted to the VOC occurrence data base.# Gives HYDROGEO-UNIT NAME identifying aquifer associated with each well for# which VOC data are submitted to the national data base.## STAID = Station identification number of the well (GWSI C001)# HYDROGEO-UNIT NAME = Short name assigned by the Study Unit that identifies the
# aquifer (or hydrogeologic unit or subunit) in which each well is screened and for which# VOC data are submitted.
## To the extent possible, the National Synthesis objective is to describe the occurrence, status,
# and distribution of VOCs by aquifer and to summarize these data nationally. In some cases,# the amount of existing VOC data might not be sufficient to warrant description at the aquifer# scale (for example, analyses from a minimum of about 20 to 30 wells distributed throughout the# aquifer), but data might be sufficient to describe VOC occurrence at a more regional scale; for# example, by a hydrogeologic unit that consists of a group of aquifers, or by a subunit defined# by the Study Unit on the basis of stratification by physiographic division and geology.
##STAID HYDROGEO-UNIT NAME15s 20s450715074230101450715074230102450715074230103452043074445601450715072301102450715072301103450715072301104451134074012301441220074221102450715074230101451043074445701450725072301202451434074013301451434074013302441220074221102450715074230101461043074446701460725072301202451734074012901
24 Plan for Assessment of the Occurrence, Status, and Distribution of VOCs in Aquifers of the U.S.

Table 12. Example of a relational data-base file (called aqdes.rdb) that describes information about each aquifer/ hydrogeologic unit for which volatile organic compound (VOC) analyte-concentration data are submitted[Information in this table is for illustrations purposes only; GWSI, U.S. Geological Survey Ground-Water Site Inventory]
# aqdes.rdb# Tab-delimited rdb table of descriptions of aquifers (hydrogeologic units or subunits) for# which VOC and associated ancillary data were compiled.# This table describes properties of each aquifer (or hydrogeologic unit or subunit)# as a whole, not at individual wells. This information in this table is repeated for each aquifer.# For example, if data are submitted for three aquifers, this table would have three rows of
# information, one row for each aquifer.## Following is a list of information for each aquifer/hydrogeologic unit to be included in an# rdb table. The format is the: VARIABLE NAME (field length and type) = Description of# requested information [example of how information is coded].## HYDROGEO-UNIT NAME (20s) = Short name assigned by the Study Unit that identifies# the aquifer (or hydrogeologic unit or subunit) in which each well is screened, and for# which VOC data are submitted [Canoe River aquifer].# AQDES (132s) = Descriptive text describing the aquifer (or hydrogeologic unit or subunit)# [Unconfined, stratified-drift aquifer composed of sand and gravel up to 150 feet thick].# LITH (4s) = Lithologic description of the aquifer/hydrogeologic unit as a whole (use definitions# in GWSI C096) [SDGL].# CONSOL (2s) = Degree of consolidation of the aquifer/hydrogeologic unit (UC,# unconsolidated; SC, semiconsolidated; CN, consolidated) [UC].# ATC (Is) = Aquifer type code for aquifer/hydrogeologic unit as a whole using the definitions# in GWSI (Ground-Water Site Inventory - C713: U, Unconfined single aquifer; N,# unconfined multiple aquifers; C, confined single aquifer; M, confined multiple# aquifers; X, Mixed (confined and unconfined) multiple aquifers) [U].# DPTHTOP (10s) = Approximate range in depth to top of (saturated part of) aquifer, in feet# below land surface [0-20].# SATTHK (10s) = Approximate range in saturated thickness, in feet [0-120].# K (10s) = Approximate range in hydraulic conductivity, in feet per day [50-350].# T (10s) = Approximate range in transmissivity, in thousands of feet squared per day [0-300].# RECH (5n) = Approximate average (annual) recharge to the aquifer, in inches per year [22].# AQAREA (6n) = Area of aquifer/hydrogeologic unit, in thousands of square miles [2000].# PUMPT (5n) = Total pumping from the aquifer in 1990, in millions of gallons per day [12].# PPWS (5n) = Percentage of PUMPT used for public drinking-water supply [75].# PDWS (5n) = Percentage of PUMPT used for domestic drinking-water supply [20].# PIC (5n) = Percentage of PUMPT used for industrial and commercial water supply [5].# PIR (5n) = Percentage of PUMPT used for irrigation [0].# POPT (5n) = Total population served by pumping from the aquifer in 1990, in thousands [3200].# PPOPP (5n) = Percentage of POPT served by public water supply [50].# PPOPD (5n) = Percentage of POPT served by domestic water supply [50].# AQSTATE (12s) = State(s) that the aquifer covers, use two-letter postal abbreviations,# in caps) [NY,NJ].# PRECIP (6n)= Average annual precipitation over the aquifer, in inches per year [45].# LANDUSES (25s) = Predominate land uses overlying the aquifer (use Level II-classifications in# Anderson and others, 1976, table 2). For example, for cropland and pasture, use code# 221) [111-117, 221, 223].# POPUL (6n) = Population overlying the aquifer, in thousands [5000].
Analysis of Data 25

SUMMARY
Volatile organic compounds (VOCs) were selected for National Synthesis by NAWQA because of the widespread occurrence of this constituent group in many of the Nation's water supplies. The broad goals of the VOC National Synthesis are (1) to describe current water-quality conditions; (2) to define trends, or lack of trends; and (3) to identify, describe, and explain causal relations among the occurrence and distribution of VOCs in surface water and ground water and natural and human factors. Fifty-five VOCs, including of halogenated alkanes, halogenated alkenes, aromatic hydrocarbons, alkyl benzenes, halo genated aromatics, ethers, and others, have been iden tified for study.
VOCs are of concern in ground water because of their relatively high aqueous solubility, mobility, and persistence, because many VOCs are known or suspected carcinogens, and because of their wide spread use. The National Synthesis of VOCs in ground water has three objectives: (1) describe their occurrence, status, and distribution; (2) determine relations between VOC target analytes in shallow ground water and natural and human factors; and (3) determine and compare the occurrence, transforma tion, transport, and fate of selected VOC target analytes in ground water for several regionally or nationally important aquifer systems.
The objective of the assessment of VOCs in ground water discussed in this report is to describe the occurrence, status, and distribution of VOCs in major aquifers of the United States, both for individual aqui fers and collectively. The assessment will be nation wide for aquifers, or those parts of aquifers, that are currently used or have the potential to be used as sources of water supplies. Occurrence describes the presence or absence of VOCs, their frequency of occurrence, and their ranges of concentrations. Status compares the concentrations of VOCs detected in rela tion to water-quality regulations or advisories, such as Maximum Contaminant Levels, Proposed Maximum Contaminant Levels, Maximum Contaminant Level Goals, and Health Advisories. Distribution describes the variability of VOCs in ground water, areally and by depth.
A set of criteria for well-network design, well construction, sample-collection methods, and methods of laboratory analysis need to be met for data to be used in this assessment. A well network suitable for this assessment is one in which all wells or a subset of
wells from one or more well networks collectively results in a generally unbiased, random, equal-area distribution of sampling sites throughout the aquifer, or part of the aquifer, of interest. Well-construction information must be sufficient to ensure that the hydrogeologic unit (or units) represented by the water level measured and the hydrologic unit (or units) contributing water to the well are known. In addition, the well construction and pumping equipment in the well need to be of a type that are not likely to affect concentrations of VOCs in the water sample. VOC data are considered suitable for use in this assessment if: (1) national methods for collection and analysis of VOCs were used and the method detection limits or the reporting levels for VOC analytes are less than about 5 |Lig/L; (2) laboratory analysis was done by a laboratory certified by the U.S. EPA; (3) the location of the well from which the sample was collected is known by latitude/longitude; (4) the sample was collected from untreated (raw) water; (5) the water sample was collected at or near the well head before being held in a pressure tank or holding tank; (6) the analyte name is identified by parameter code, and the analyte concentrations are known; (7) the date (at a minimum, the year) of sample collection is known; and (8) quality-control data have been used to evaluate and, if necessary, to censor the environmental data prior to its compilation at a national level to the extent that quality-control data are available
This assessment will be done by collective analysis of data from monitoring programs across the Nation. Data from these monitoring programs will be compiled into a national data base for this analysis. Criteria for monitoring-program design, sample- collection methods, and methods of laboratory analysis will be met for data to be entered into this data base. The assessment will be based on data collected since 1985, for as many of the 55 VOCs currently (1996) on the list of NAWQA VOC target analytes as possible. Assessment by aquifer and comparisons of results among aquifers also will be completed for those aquifers that have adequate data, spatially or by depth.
REFERENCES CITED
Alley, W.M., ed., 1993, Regional ground-water quality: New York, Van Nostrand Reinhold, 634 p.
Anderson, J.R., Hardy, E.E., Roach, J.T., and Witmer, R.E., 1976, A land use and land cover classification system
26 Plan for Assessment of the Occurrence, Status, and Distribution of VOCs in Aquifers of the U.S.

for use with remote sensor data: U.S. Geological Survey Professional Paper 964, 28 p.
Christenson, Scott, and Rea, Alan, 1993, Ground-water quality in the Oklahoma City urban area, in Alley, W.M., ed., Regional ground-water quality: New York, Van Nostrand Reinhold, chap. 24, p. 589-611.
Currie, L.A., 1988, Detection - Overview of historical, societal, and technical issues, in Currie, L.A., ed., Detection in analytical chemistry Importance, theory, and practice: New York, American Chemical Society Symposium Series 361, 191st meeting, April 13-18, 1986, p. 1-62.
Gilliom, R.J., Alley, W.M., and Gurtz, ME., 1995, Design of the National Water-Quality Assessment Program Occurrence and distribution of water-quality condi tions: U.S. Geological Survey Circular 1112, 33 p.
Hirsch, R.M., Alley, W.M., and Wilber, W.G., 1988, Con cepts for a National Water-Quality Assessment Program: U.S. Geological Survey Circular 1021, 42 p.
Koterba, M.T., Banks, W.S.L., and Shedlock, R.R., 1993, Pesticides in shallow ground-water in the Delmarva Peninsula: Journal of Environmental Quality, v. 22, no. 3, p. 500-518.
Koterba, M.T., Shedlock, R.J., Bachman, L.J., and Phillips, P.J., 1991, Regional and targeted ground-water-quality networks in the Delmarva Peninsula, chapter 6, in Nash, R.G., and Leslie, A.R., eds., Ground-water resi due sampling design: Washington, D.C., American Chemical Society Symposium Series 465, p. 111-138.
Koterba, M.T., Wilde, F.D., and Lapham, W.W., 1995, Ground-water data-collection protocols and proce dures for the National Water-Quality Assessment Program Collection and documentation of water- quality samples and related data: U.S. Geological Survey Open-File Report 95-399, 113 p.
Lapham, W.W, Wilde, F.D., and Koterba, M.T., 1995, Ground-water data-collection protocols and proce dures for the National Water-Quality Assessment Program-Selection, installation, and documentation of wells, and collection of related data: U.S. Geological Survey Open-File Report 95-398, 69 p.
Leahy, P.P., Rosenshein, J.S., and Knopman, D.S., 1990, Implementation plan for the National Water-Quality Assessment Program: U.S. Geological Survey Open- File Report 90-174, 10 p.
Leahy, P.P., and Thompson, T.H., 1994, U.S. Geological Survey National Water-Quality Assessment Program: U.S. Geological Survey Open-File Report 94-70, 4 p.
Pankow, J.F., and Cherry, J.A., 1996, Dense chlorinated solvents and other DNAPLs in groundwater: Portland, Oreg., Waterloo Press, 522 p.
Scott, J.C., 1990, Computerized stratified random site- selection approaches for design of a ground-water- quality sampling network: U.S. Geological Survey Water-Resources Investigations Report 90-4101, 109 p.
Tennant, PA., Norman, C.G., and Vicory, A.H., Jr., 1992, The Ohio River Valley Water Sanitation Commission's Toxic Substances Control Program for the Ohio River: Water Science and Technology, v. 26, no. 7-8, p. 1779- 1788.
U.S. Environmental Protection Agency, 1992, Protection of environment (Appendix B to Part 136-Definition and procedure for determination of the method detection limit-Revision 1.11): U.S. Code of Federal Regula tions, Title 40, parts 100-149, revised as of July 1, 1992, p. 565-567.
U.S. Geological Survey, 1994, Still more insights into sam ple handling and analysis at the NWQL:National Water Quality Laboratory Newsletter, v. 2, no. 4, p. 3.
References Cited 27


SUPPLEMENTAL INFORMATION

Instructions and blank forms for completing the data inventory for volatile organic compounds (VOCs) in ground water
Instructions for filling out data-inventory Forms A and B
Inventory as many local, State, and Federal programs as possible in and near the Study Unit by filling out Form A during discussions with those agencies. If the answer on Form A, page 3, column entitled "Useful for Study Unit or National Synthesis?" is yes "Y," fill out Form B as completely as possible. Filling out Form B may require visits to the agency and (or) review of references describing the program in question. No column should be left completely blank. Write out repeated information in columns rather than using "ditto" or "do." If after a reasonable attempt, information for a particular column is not known, write "NK" in that column; if the answer to a column is yes, write "Y"; if no, write "N." Following these guidelines will result in consistent information compiled by all Study Units. If there are any questions, call NAWQA VOC National Synthesis at (605) 394-1780. Details on selected columns on Forms A and B are described below.
Form A, Column entitled: "Arbitrary number" This is an arbitrary sequential number for every contact. Start with the four-letter Study-Unit abbreviation (for example, LINJ01, LINJ02, LINJ03, and so forth, where LINJ stands for Long Island/New Jersey Study Unit; 01 stands for the first inventory, 02 for the second inventory, 03 for the third inventory, and so forth).
Form A, Column entitled: "Agency contacted" List alphabetically by two-letter postal abbreviation for the State, for example, NJ Department of Environmental Protection or NJ USGS District office, and so forth.
Form A, Column entitled: "Short program/network/study name commonly referred to by agency" Unique name to keep track of multiple monitoring program by one agency (for example, statewide ground-water-quality monitoring programs, ambient ground-water-quality network, public water-supply monitoring, and so forth).
Form A, Column entitled: "Useful for Study Unit or National Synthesis (Y/N)?" Will the program possibly provide VOC data useful to meet either or all of the three following objectives at a Study Unit, regional or national scale? (1) To assess the occurrence, status (for example, comparison to drinking water-quality regulations or advisories), and distribution of VOCs in ground water; (2) to determine causal relations among VOCs in shallow ground water and natural and human factors; or (3) to determine trends in VOCs. If the answer is yes (Y), complete Form B for that program.
Form B, Column entitled: "Arbitrary number" Use the same arbitrary number that was assigned in Form A (for example, LINJ01).
Form B, Column entitled: "Agency conducting program" List alphabetically by two-letter postal abbreviation for theState or a county name, and so forth., U.S. first, then agency name (for example, NJ Dept of Health, U.S. EPA, NJ USGS District office, and so forth).
Form B, Column entitled: "Was the selection of wells random or targeted?" Were wells selected randomly or was the selection targeted to a specific type of well (for example, targeted to only public water-supply wells), or other factors (for example, targeted to only to a particular land-use setting, and so forth)?
Supplemental Information 31

Form
A.
Rec
ord
of fi
rst
scre
en o
f pos
sibl
e m
onito
ring
prog
ram
s fo
r vo
latil
e or
gani
c co
mpo
unds
(V
OC
s) in
gro
und
wat
er fo
r
[Y=y
es,
N=n
o]
Stu
dy U
nit
(D
O o O c
Arb
itrary
nu
mbe
r (e
xam
ple:
LI
NJ0
1)
Age
ncy
cont
acte
d (li
st a
lpha
betic
ally
by
two-
lette
r po
stal
ab
brev
iatio
n fo
r th
e S
tate
, U
S g
over
nmen
t ag
ency
, C
ount
y, a
nd s
o fo
rth)
Dat
e co
nta
ct
mad
e (f
or
exam
ple,
11
/25/
94)
Per
son
cont
acte
d/
phon
e nu
mbe
r
Sho
rt p
rogr
am/n
etw
ork/
stud
y na
me
com
mon
ly r
efer
red
to b
y th
e ag
ency
Use
ful f
or
Stu
dy
Uni
t or
Nat
iona
l S
ynth
esis
(Y
/N)?
Exp
lain
ind
icat
ion
of Y
or
N in
pr
evio
us c
olum
n re
lativ
e to
the
th
ree
obje
ctiv
es.
(Fill
out
For
m B
if
data
will
be
usef
ul)
o O (D C

c=)
,0l_0)*J
5c
2COc
OO
CO
2O)o
COc'l_o
o
CO
ICO
CO
E o
LL
2 3t^co «
(O ^ CO OE ® f«Q.CO
- 5 3(O ^CO Q. o>£co 8
o O cQ. Q O ^,
o "5 S 2o 2 o--£O "c t \ ®
CO O "- .£
° ^ B w~~ CT >» O
^o§«^ E
COc 5
2CO
O co0 0 -^ 0) < COOcol°-O ir
II (OII
w
2 o oCOO)
'CD
m/network/study nly referred to by
agency
CD O Q)D> E £u5 E(0 ^
°-l? c i.2?t.i « o ^ = in > w
Agency condu( (list alphabetic: postal abbrevi State, U.S. g agency, an<
T3 2 ^
« E i.'c *
PillF|l *
2 5 Q-o . e c E "52 5 « Z
c x 13
Supplemental Information 33

Form
B.
Sum
mar
y of
mon
itorin
g-pr
ogra
m in
form
atio
n fo
r vo
latil
e or
gani
c co
mpo
unds
(V
OC
s) in
gro
und
wat
er fo
r __
Stu
dy U
nit
Contin
ued
(D O O
O (D O 9 (fl
O o
Arb
itra
ry
num
ber
(exa
mpl
e:
LIN
J01)
Brie
f st
atem
ent
of th
e ob
ject
! ve(
s) o
f the
pro
gram
, ne
twor
k, o
r st
udy
List
type
s of
ana
lyse
s av
aila
ble
othe
r th
an V
OC
s (f
or e
xam
ple,
pe
stic
ides
, nu
trie
nts,
maj
or i
ons,
tr
ace
elem
ents
)
Is t
here
a w
ritte
n de
scrip
tion
of
the
netw
ork
desi
gn (
Y/N
/NK
)?
If Y
es,
give
ref
eren
ce (
auth
or,
date
)

T3 (D
a
(D 03
ac
1O)
O O
ac. D oQ.
O OO'c(0
1 o c §% t> 2 E?
* 8| 5
O) 4) ^^ CO.£ Q. C 3
» i_ 15. O .2 E »0 ~ 5 Is^ >* CO CQ
m ° o 2-<y ^ S. 7
r §1^.2 g" * £J ^ o g
E
w
Ills'S o » r2* t_ O*^S o o> c |^5-
HHijis|S
|fi i."
« s> sP CO
s |EO > a.
Q. o §9- 1 3CO O o-0) (0 CO.> 2 cO co ~
c i '1§ oc-ar« fe 3 c Q. 0 cCO at O CO2 fi " c^ d 'D 0)CD o > s=
to * " o en
> i_ _« ^
O)2Q.6)
mE o
Supplemental Information 35

(D O
o .a c
Form
B.
Sum
mar
y of
mon
itorin
g-pr
ogra
m i
nfor
mat
ion
for v
olat
ile o
rgan
ic c
ompo
unds
(V
OC
s) in
gro
und
wat
er fo
r __ S
tudy
Uni
t Con
tinue
d
Arb
itrar
y nu
mbe
r (e
xam
ple:
LI
NJ0
1)
List
use
s of
site
s in
the
netw
ork
(for
exa
mpl
e, O
=ob
serv
atio
n,
M=m
ine,
and
so
fort
h;
use
GW
SI
C02
3 co
des)
Lis
t us
es o
f wat
er f
rom
wel
ls
in t
he n
etw
ork
(for
exa
mpl
e,
C=
com
mer
cial
, H
=do
mes
tic,
^irr
igatio
n,
N=
indu
stria
l, P
=pu
blic
, an
d so
fo
rth
; us
e G
WS
I C
024
code
s)
Are
gro
und-
wat
er
sam
plin
g pro
toco
ls
docu
men
ted
(Y/N
/NK
)?
If Y
es,
give
ref
eren
ce
(aut
hor,
dat
e)
Wer
e w
ells
inst
alle
d or
w
ere
exis
ting
wel
ls
sam
pled
or
both
? (^
inst
alle
d,
E=
exis
ting,
B=
both
)
For
wel
ls w
ith p
umps
, w
ere
sam
ples
col
lect
ed
at th
e w
ell h
ead,
bef
ore
hold
ing
tank
or
trea
tmen
t (Y
/N/M
IX)?
(D c

T3 O
CD>s
T33
CO
o
-a
I o>C
O O
CO T3
3 O Q.
O OO'cCO
po0)
O)o
O)c
CO
E 3
CO
CO E o
LL
oc ?.9- 2
* * * '5-
fi||
O '= 32 «
0 « l"^"
'J
(0 S,£
O) .^
(Q «^ kT
Q.O. Jo 5" "S
§ i w'
it!5 ? £o
"53
TJ
"5 vir- ' O"S "5.2 ES n^ wE J23 «
oc >0)£.2
0) O 0)> = « « o0) O ~ ^ £
0-2 | = = J5
fi-Ff
2 5 "o-5^3 « (Q ^~
< c «,
Supplemental Information 37

A
O o O 1 o m CO O
O (0
Form
B.
Sum
mar
y of
mon
itorin
g-pr
ogra
m i
nfor
mat
ion
for
vola
tile
orga
nic
com
poun
ds (
VO
Cs)
in g
roun
d w
ater
for
Stu
dy U
nit C
ontin
ued
Arb
itrar
y nu
mbe
r (e
xam
ple:
LI
NJ0
1)
Is th
ere
any
info
rmat
ion
on h
ow
this
fie
ld Q
C d
ata
is u
sed
durin
g da
ta a
naly
sis
(Y/N
/NK
)? I
f the
re
is a
writ
ten
docu
men
t, gi
ve
refe
renc
e (a
utho
r, d
ate)
Wha
t sc
he
du
le w
as u
sed
for
anal
yses
of
VO
Cs?
(f
or e
xam
ple,
EP
A 5
24.2
, U
SG
S S
H
1380
, U
SG
S S
H 2
090)
If a
sche
dule
is u
sed
whe
re th
e m
etho
d of
labo
rato
ry a
naly
sis
is
not
pres
crib
ed,
list t
he m
etho
d of
la
bora
tory
ana
lysi
s, (
for
exam
ple,
pu
rge
and
trap
with
GC
/MS
)
List
the
gene
ral r
epor
ting
leve
l fo
r an
alyt
es o
n th
e V
OC
sc
hedu
le (
ng/L
)

TJCD13 C
CD>»
T313
CO
£»_0)
ic132 en
O O
CO T3
D O Q.
O OO'c
C"Q) W
IP filloJ » c >
° M W
O
S "55 JB
f J|lz» .2 * SS ^w "55 > 2 >^ 0 5 o o.^-
1 -I .E E So"-o g £ 3
° ** § | »"
"Q ~O O 0) O)
iiiiJ.2 § C 0 Q.-1 o « -^
o8 ""g <v _
0) fl) (0 «*S «lE a -o C.« .o1 -
2
w 0o
pt2
>. ,_ Q) --^IIP3 1 « z £ c£IJ
D) O
O)c
CO
ED
CO
CDE o
Supplemental Information 39

Form
B.
Sum
mar
y of
mon
itorin
g-pr
ogra
m i
nfor
mat
ion
for
vola
tile
orga
nic
com
poun
ds (
VO
Cs)
in g
roun
d w
ater
for _
_ S
tudy
Unit
Contin
ued
Arb
itrar
y nu
mbe
r (e
xam
ple:
LI
NJ0
1)
How
are
the
VO
C d
ata
stor
ed f
or
this
pro
gram
(fo
r ex
ampl
e, p
aper
fil
e, a
scii
file,
PC
dat
a ba
se,
STO
RE
T, N
WIS
)?
Wha
t qu
ality
-con
trol
che
cks
are
used
to e
nsur
e ac
cura
te
tra
nsc
rip
tion
of t
he d
ata?
Indi
cate
how
acc
essi
ble
VO
C
data
are
? E
asy
(dig
ital),
diff
icult
(pap
er o
r pr
oprie
tary
), o
r al
read
y on
US
GS
sys
tem
?
Are
the
re w
ell-l
ocat
ion
data
in
the
data
base
? If
yes,
ind
icat
e by
la
titud
e an
d lo
ngitu
de (
lat/l
ong)
or
oth
er (
O).
(D O
O
O c I O
O
w (D c CO

TJ 0)13 C
CO
0)
c 132O)
/o o
13 oQ.
O OO'c
CO
(0 O)o
O)c
(0
E 3
CO
CO
E o
0) CO
i .I*lill« E o - p « = £ « r Jo «£ §»o
§3*"ls a -5 Q. S wg = E g -o E co E g^ nT X CO wmili IT 8-35 « « § ^0 0) -g = >£ co .-§ | fc0 ^ (0 > =o> « > - ca o co « «=:2 E .2 §> S. o «- « ^0 0- £ - C'5> S 5 S «o n * 5 £ o 5 .2 5 o
What types of hydroge with this program data If data are limited, li
hydraulic properties, size/material, s
£ "~§ c "°lf ? .2 o. « 5 * « c « «2i_ co t o>TT i E g 2 8 1 o « fi -og ^o§S0) ^. & w .£ C'fv. (/) 0)
5i^ s lt 7» 2. - JD
S §S ag> co n Q coo £ -o
he types of network-scale llary information that are e which affect ground-water (for example, land use, land population, soil type, mean
irecipitation, recharge areas,
arge rates, and so forth)
M « & r"£ 0 JQ > iT _ tit» c « £ o> co o>"j CO m > 3 >-
CO 2 O C > i o cco cr w =
> k. (U »
2^?os 1 liSiS 3
Supplemental Information 41

Form
B.
Sum
mar
y of
mon
itorin
g-pr
ogra
m in
form
atio
n fo
r vol
atile
org
anic
com
poun
ds (
VO
Cs)
in g
roun
d w
ater
for _
_ S
tudy
Uni
t Con
tinue
d
'or
Assessment
of
the
Occurrence,
Status, and
Distribution
of
VOCs
in
Aquifers of
the
U
Arb
itra
ry
num
ber
(exa
mpl
e:
LIN
J01)
Wha
t typ
es o
f hy
drog
eolo
gic
or w
ell d
ata
are
avai
labl
e fr
om o
ther
dat
a ba
ses?
Ind
icat
e ho
w th
ese
othe
r da
ta a
re s
tore
d (f
or e
xam
ple,
GW
SI,
pape
r fil
es/r
epor
ts,
Sta
te d
ata
base
)
0)
c"c
o'c
ID> o12f r\
i_ ,0i_CD
IC
1
k
O)c
y^^.
O O *^
coQ.Eooo'c
CO
o
To"o> i_£CO
To
£r££.£
E
O)
2Q.cn
_C'i_ O
4 1'coE
.,
O^«
COEE
C/)
ctiEo u_
c(0
1 S"aT
||S8 11o £! *C Q. 3
2 c"5
J
2 c m oTJ '«: o g0) .£ C .0.!2 33 £
CT'-S ?2 '^ "^.
U Q. O
0) O 3"^ ~~ w
o> 3
g 1^ £"S gS "S.2 c-1
SSo>2Q.0)
t?lT2 §0 kT(0 O
TJ *^
V J.
C0)
0)"S
l_
5
£? - Ji " »
| I « irf C Q J
Supplemental Information 43

(D
O o O
Form
B.
Sum
mar
y of
mon
itorin
g-pr
ogra
m in
form
atio
n fo
r vo
latil
e or
gani
c co
mpo
unds
(V
OC
s) in
gro
und
wat
er fo
r __
Stu
dy U
nit
Co
ntin
ue
d
D> 3 a
g
w* 5s c o" 3 O
O
w
Arb
itrar
y nu
mbe
r (e
xam
ple:
LI
NJ0
1)
Com
men
t on
the
suita
bili
ty o
f this
VO
C a
nd a
ccom
pany
ing
data
for
asse
ssm
ent o
f oc
curr
ence
, st
atus
, an
d d
istr
ibu
tion
of V
OC
s in
gro
und
wat
er,
and
for
desc
ribin
g th
e re
latio
ns a
mon
g V
OC
s in
sha
llow
gro
und
wat
er a
nd n
atur
al a
nd h
uman
fac
tors
.