plainfield school district 202 · introduction 3 • plainfield school district 202 is proud to be...
TRANSCRIPT
Plainfield School District 202
Fiscal Year 2019 Budget Highlights

Table of Contents 2
• Introduction• District Mission Statement• Board Objectives• Budget/Fund Accounting Overview• Assumptions Influencing FY2019 Budget• FY2019 Budget Summary• Historical Fund Summary• District 202 Total Revenue History• FY2019 Projected District 202 Operating Revenue Source• District 202 Total Expenditure History• FY2019 Projected District 202 Operating Expenditure by Object & Function• Financial Profile Summary• Operating Revenue History• Operating Expenditure History• Operating Fund Balance History• Unaudited FY2018 vs. Projected FY2019

Introduction 3
• Plainfield School District 202 is proud to be part of a community that values its children’s future through education. The leaders of District 202 take great pride in educating students by utilizing provided resources.
• This budget summary represents a comprehensive description of the 2018-2019 Plainfield School District 202 Budget. This document provides pertinent information to better understand where our schools get their funding and how the funds are spent, and explains our financial plan for fiscal operations for the 2018-2019 school year.
Rick EngstromAssistant Superintendent for Business and Operations

District Mission Statement 4
• District 202’s mission is to serve the community as the primary source of comprehensive, high quality education in a trusting, supportive environment - to develop, at all levels, responsible, successful citizens by providing an education, in cooperation with home and community, which fosters each individual's value, uniqueness, and importance and promotes lifelong learning in an ever-changing society.

Board Objectives 5
• Develop and implement a responsible, sustainable financial plan while maintaining high quality educational programs
• Keep property taxes as low as possible
• Implement a balanced operating budget each year (no structural deficits)
• Maintain “recognition status” on the ISBE Financial Profile Score

Budget/Fund Accounting Overview 6
• 10-Education Fund• The Education Fund is the largest fund in terms of dollars and volume of transactions. It includes items
related to the educational programs. Teachers’ salaries and benefits, instructional materials, student technology, and special education costs are just a few prominent examples of expenditures from this fund.
• 20-Operations and Maintenance Fund• The Operations and Maintenance Fund captures the cost relating to the operating and maintaining of school
buildings and grounds. Custodial, Maintenance, and Grounds salaries/benefits are the largest expenditures in this fund. Utility costs, building maintenance/equipment and other operational essentials are expended from O&M fund as well. Revenue is received from local taxes, Evidence-Based Funding, interest income and rental.
• 30-Debt Service Fund• This fund is used solely for payment of principal and interest of debt and capital leases.
• 40-Transportation Fund• Expenditures associated with student transportation needs of Plainfield School District 202 are located in the
Transportation Fund. Regular, vocational and special education transportation are included. Revenues include local taxes, Evidence-Based Funding and state transportation reimbursement.

Budget/Fund Accounting Overview 7
• 50-Municipal Retirement Fund • Also known as the IMRF/SS Fund, this fund is used to pay the District’s share of required pension
contributions.• 60-Capital Improvement Fund
• Major construction and improvement projects are funded through the Capital Improvement Fund and draw revenues from bond issues and transfers.
• 70-Working Cash Fund• No expenditures can be made from the Working Cash Fund, but specific taxes levied or working cash bond
issues are deposited in this fund and used to supplement the revenue for other funds. Transfers can be made with Board of Education approval to designated funds.
• 80-Tort Fund • This fund is responsible for liability costs of Plainfield School District 202.
• 90-Life Safety Fund• The Life Safety Fund is used for eligible code-required building projects.

Budget/Fund Accounting Overview 8
• Revenue Classifications• Revenues are recorded according to the Illinois School Program Accounting Standards.
• Fund (Education, O&M, Transportation, Working Cash, Etc.) • Source (Local, State, Federal)
• Three Major Categories• Local – Property Taxes, Corporate Taxes, Tuition, Interest Income, Food Service, Activity Income,
Textbooks, Other Local Revenue• State-Evidence Base Funding (EBF), Categorical Grants, Transportation reimbursement, Special
Education• Federal – Federal Grants
• Expenditure Classification• Expenditures are recorded according to the Illinois School Program Accounting Standards.
• Fund – (Education, O&M, Transportation, Working Cash, Etc.) established for specific activities or objectives and operates in accordance with designated purposes
• Functions – designates the specific program or purpose for which funds are used• Objects – describes the type of expense within each function

Assumptions Influencing FY2019 Budget 9
• Property tax is budgeted at 99.75% of extended levy.• Evidence-Based Funding (EBF)
• EBF is represented at 100% of last years amount. We could potential see new or Tier Funding. The amount due to Plainfield School District 202 is calculated based on our district’s ability to raise local resources as well student enrollment of the District.
• FY19 EBF Base = $86,864,495• (General State Aid, English Learners Education, Sp. Ed Personnel, Sp. Ed Funding for Children, Sp. Ed Summer School)
• FY19 EBF Tier Funding Money = ?• 100% Restricted Grants-In-Aid = $13,359,180
• (Sp. Ed Private Tuition, Sp. Ed Orphanage, CTEI, IL Free Lunch/Breakfast, Driver Education, Reg/Voc. Transportation, Sp. Ed Transportation, Early Childhood-Block Grant)
• Local Revenue• Plainfield School District 202 is experiencing a decrease in student enrollment.
• Corporate Personal Property Replacement Tax• This tax is set by the Illinois State Department of Revenue.

Assumptions Influencing FY2019 Budget 10
• Salaries Increases • Tied to CPI (2.1%) with Floor (0.5%) and Ceiling (1.5%)
• 2.5% annual increase for Administration and Non-Union Support Staff plus CPI• APT salaries are budgeted to accommodate - Average Step 2.75% plus 0.5% to Base• PASS salaries are budgeted to accommodate 2.25% increase per the PASS contract.
• 1% ∆ ≈ +/- $1.65 million• Benefits
• Benefits are budgeted to reflect an 2% increase due to health care premium increases.• 1% ∆ ≈ +/- $350,000
• $1,000,000 is budgeted as contingency to allow for building-specific enrollment changes and Special Education needs.
• Student/Teacher Ratio remains at current levels• Additional hire of 16 Paraprofessionals
• School Allocations remain at current allocations• Departments remain at 100% of requested amounts to support department initiatives • Yearly Routine Maintenance
• $2 million out of Capital Projects Fund (60)• $1 million out of Operations & Maintenance Fund (20)• $1 million out of Tort Fund (80)

FY2019 Budget Summary 11
Fund * Unaudited Est. Fund Balance 7/1/2018 Revenue Expenditures Surplus(Deficit) Bond Sales/Perm. Trans Est. Ending Fund Balance 6/30/2019
10-Education $38,953,834 $229,344,894 $227,065,496 $2,279,398 ($2,564,361) $38,668,871 20-O&M $11,803,743 $23,028,119 $20,017,701 $3,010,419 $0 $14,814,161 40-Transportation $13,817,020 $18,431,061 $16,022,785 $2,408,277 $0 $16,225,296 50-IMRF/SS $1,176,367 $6,465,751 $6,461,569 $4,182 $0 $1,180,549 70-Working Cash $38,113,732 $1,963,050 $0 $1,963,050 $0 $40,076,782 80-Tort $1,553,742 $4,252,206 $6,319,157 ($2,066,951) $0 ($513,209)
TOTAL OPERATING $105,418,437 $283,485,082 $275,886,707 $7,598,375 ($2,564,361) $110,452,451 30-Debt Service $10,448,868 $29,216,210 $33,909,287 ($4,693,077) $3,365,702 $9,121,493 60-Capital Projects $4,632,012 $886,110 $1,825,542 ($939,431) ($801,341) $2,891,239
TOTAL-ALL FUNDS $120,499,317 $313,587,402 $311,621,536 $1,965,866 $0 $122,465,183 *Note FY2017: Based on Modified Accrual Basis. State Budget Report & AFR are based on Accrual BasesEstimated Revenue State is still scheduled to pay in FY18 based on scheduled date
10-Education 10-Education 40-Transportation 40-Transportation
Special Ed. Private Tuition $1,514,138 Regular/Vocational Transportation $2,207,021
Special Ed. Orphanage $69,239 Special Education Transportation $2,216,058
T.P.I & T.B.E. $47,828
State Free Lunch & Breakfast $13,158
Driver Education $77,388Early Childhood Block $109,866
TOTAL $1,831,617 TOTAL $4,423,079

Historical Fund Summary 12
Fund Balance FY15 FY16 FY17 FY18(Unaudited) FY19 (Bud.)10-Education $12,617,965 $17,274,083 $25,962,293 $38,953,834 $38,668,871
20-O&M ($1,209,460) $2,892,122 $7,927,518 $11,803,743 $14,814,161 30-Debt Service $15,525,787 $16,605,972 $17,945,025 $10,448,868 $9,121,493
40-Transportation $2,793,114 $5,301,972 $9,588,394 $13,817,020 $16,225,296 50-IMRF/SS ($586,448) $585,542 $1,051,430 $1,176,367 $1,180,549
60-Capital Projects $12,969,533 $10,732,968 $9,316,155 $4,632,012 $2,891,239 70-Working Cash $27,763,744 $37,901,264 $36,247,545 $38,113,732 $40,076,782
80-Tort $3,024,579 $3,405,997 $2,552,766 $1,553,742 ($513,209)YEAR-END FUND
BALANCE $72,898,814 $94,699,920 $110,591,126 $120,499,317 $122,465,183
($20,000,000)$0
$20,000,000$40,000,000$60,000,000$80,000,000
$100,000,000$120,000,000$140,000,000
FY15 FY16 FY17 FY18(Unaudited) FY19 (Bud.)
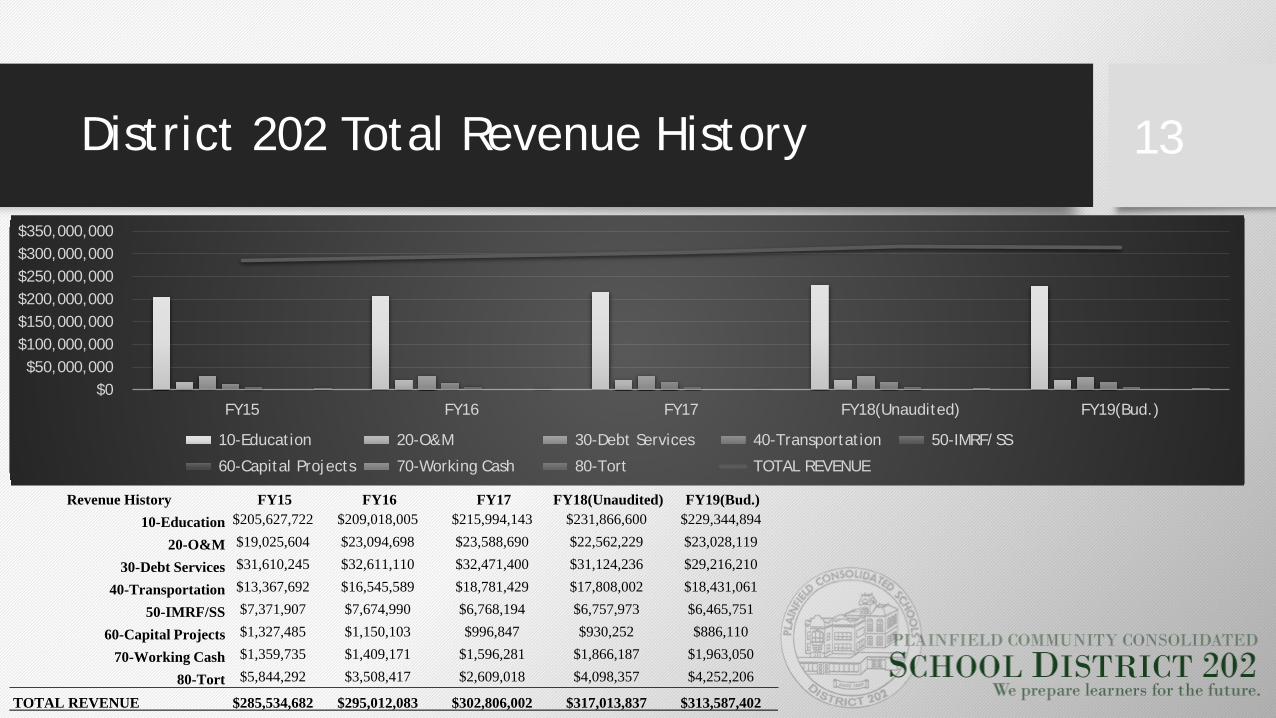
District 202 Total Revenue History 13
Revenue History FY15 FY16 FY17 FY18(Unaudited) FY19(Bud.) 10-Education $205,627,722 $209,018,005 $215,994,143 $231,866,600 $229,344,894
20-O&M $19,025,604 $23,094,698 $23,588,690 $22,562,229 $23,028,119
30-Debt Services $31,610,245 $32,611,110 $32,471,400 $31,124,236 $29,216,210
40-Transportation $13,367,692 $16,545,589 $18,781,429 $17,808,002 $18,431,061
50-IMRF/SS $7,371,907 $7,674,990 $6,768,194 $6,757,973 $6,465,751
60-Capital Projects $1,327,485 $1,150,103 $996,847 $930,252 $886,110
70-Working Cash $1,359,735 $1,409,171 $1,596,281 $1,866,187 $1,963,050
80-Tort $5,844,292 $3,508,417 $2,609,018 $4,098,357 $4,252,206
TOTAL REVENUE $285,534,682 $295,012,083 $302,806,002 $317,013,837 $313,587,402
$0$50,000,000
$100,000,000$150,000,000$200,000,000$250,000,000$300,000,000$350,000,000
FY15 FY16 FY17 FY18(Unaudited) FY19(Bud.)
10-Education 20-O&M 30-Debt Services 40-Transportation 50-IMRF/SS
60-Capital Projects 70-Working Cash 80-Tort TOTAL REVENUE

FY2018 Projected District 202 Operating Revenue Source
(10 – Ed., 20 – O&M, 40 – Trans., 50 – IMRF, 70 – Working Cash, 80 – Tort)
14
Source Revenue %
Property Taxes $159,337,904 56.2%
CPPR Tax $628,800 0.2%
Tuition $795,391 0.3%
Transportation Fee $2,300 0.0%
Interest Income $1,150,000 0.4%
Food Service $4,084,393 1.4%
Activity Income $959,789 0.3%
Textbooks $3,608,133 1.3%
Other Local Revenue $1,824,280 0.6%
Evidence-Based Funding $86,864,495 30.6%
Other State Sources $13,359,180 4.7%
Other Federal Sources $10,870,416 3.8%
TOTAL $283,485,082 100.0%
56.2%
0.2%0.3%0.0%0.4%
1.4%0.3%
1.3%0.6%
30.6%
4.7%3.8%
Property Taxes CPPR Tax Tuition
Transportation Fee Interest Income Food Service
Activity Income Textbooks Other Local Revenue
Evidence Base Funding Other State Sources Other Federal Sources

District 202 Total Expenditure History 15
Expenditure History FY15 FY16 FY17 FY18(Unaudited) FY19(Bud.)10-Education $198,734,791 $202,279,226 $205,742,748 $216,749,039 $227,065,496
20-O&M $19,186,579 $18,993,116 $18,556,594 $18,686,005 $20,017,70130 - Debt Services $35,064,962 $34,826,137 $32,471,399 $109,822,873 $33,909,287
40-Transportation $14,344,083 $13,967,438 $15,280,383 $13,579,376 $16,022,78550-IMRF/SS $6,377,248 $6,503,000 $6,302,306 $6,633,036 $6,461,569
60 - Capital Projects $3,193,554 $5,841,077 $4,857,450 $4,822,935 $1,825,54270-Working Cash $0 $0 $0 $0 $0
80-Tort $4,856,562 $3,126,999 $3,462,249 $5,097,382 $6,319,157TOTAL EXPENDITURE
HISTORY $281,757,779 $285,536,993 $286,673,129 $375,390,646 $311,621,536
$0
$100,000,000
$200,000,000
$300,000,000
$400,000,000
FY15 FY16 FY17 FY18(Unaudited) FY19(Bud.)
10-Education 20-O&M 30 - Debt Services
40-Transportation 50-IMRF/SS 60 - Capital Projects
70-Working Cash 80-Tort TOTAL EXPENDITURE HISTORY

FY2018 Projected District 202Operating Expenditure Object & Function
(10 – Ed., 20 – O&M, 40 – Trans., 50 – IMRF, 70 – Working Cash, 80 – Tort)
16
Object Expenditures %Salary $158,526,012 57.5%Benefits $57,280,975 20.8%Purchased Services $36,870,791 13.4%Supplies $11,780,082 4.3%Capital Outlay $3,779,511 1.4%Other/Interest/Principal $7,649,337 2.8%
TOTAL $275,886,707 100%57.5%
20.8%
13.4%
4.3%
1.4%2.8%
Salary Benefits Purchased Services Supplies Capital Outlay Other/Interest/Principal
Function Expenditures %Instruction $169,956,534 61.6%Support Services $98,352,850 35.6%Community Services $420,186 0.2%Payments to Other Gov. Units $7,157,137 2.6%Provisions for Contingencies $0 0.0%
TOTAL $275,886,707 100%

Financial Profile Summary 17
Financial Profile SummaryCategory Weight 2013 2014 2015 2016 2017
Fund Balance to Revenue 0.35 1.05 1.05 1.05 1.40 1.40Expenditure to Revenue 0.35 1.05 1.40 1.40 1.40 1.40
Days Cash on Hand 0.10 0.20 0.20 0.30 0.30 0.30Short Term Borrowing Ability 0.10 0.40 0.40 0.40 0.40 0.40
Long Term Debt Margin 0.10 0.10 0.10 0.20 0.20 0.20TOTAL SCORE 2.80 3.15 3.35 3.70 3.70
Designation Early Warning Review Review Recognition Recognition
2017
Category BenchmarkPlainfield CSD
202 Weight ScoreFund Balance to Revenue >=.25 0.308 0.35 1.40Expenditure to Revenue <=$1.00 0.928 0.35 1.40
Days Cash on Hand >=180 162.000 0.10 0.30Short Term Borrowing Ability 100.000 0.10 0.40
Long Term Debt Margin 42.170 0.10 0.20SUMMARY FINANCIAL RECOGNITION 3.70

Operating Revenue History 18
Operating Revenue History FY15 FY16 FY17 FY18(Uaudited) FY19(Bud.)
10-Education $202,638,965 $209,018,005 $215,994,143 $231,866,600 $229,344,894
20-O&M $19,165,605 $23,094,698 $23,588,690 $22,562,229 $23,028,119
40-Transportation $11,570,453 $16,545,589 $18,781,429 $17,808,002 $18,431,061
70-Working Cash $1,359,734 $1,409,171 $1,596,281 $1,866,187 $1,963,050
TOTAL OPERATING REVENUE $234,734,758 $250,067,463 $259,960,543 $274,103,018 $272,767,125
$0
$100,000,000
$200,000,000
$300,000,000
FY15 FY16 FY17 FY18(Uaudited) FY19(Bud.)
10-Education 20-O&M
40-Transportation 70-Working Cash
TOTAL OPERATING REVENUE

Operating Expenditure History 19
Operating Expenditure History FY15 FY17 FY17 FY18(Unaadited) FY19(Bud.)10-Education $198,734,791 $202,279,226 $205,742,748 $216,749,039 $227,065,496
20-O&M $19,186,579 $18,993,116 $18,556,594 $18,686,005 $20,017,701
40-Transportation $14,344,083 $13,967,438 $15,280,383 $13,579,376 $16,022,785
70-Working Cash $0 $0 $0 $0 $0
TOTAL EXPENDITURE HISTORY $232,265,453 $235,239,780 $239,579,725 $249,014,420 $263,105,982
$0
$50,000,000
$100,000,000
$150,000,000
$200,000,000
$250,000,000
$300,000,000
FY15 FY17 FY17 FY18(Unaadited) FY19(Bud.)
10-Education 20-O&M
40-Transportation 70-Working Cash
TOTAL EXPENDITURE HISTORY

Operating Fund Balance History 20
Fund Balance FY15 FY16 FY17 FY18 (Unaudited) FY19(Bud.)10-Education $12,617,965 $17,274,083 $25,962,293 $38,953,834 $38,668,871
20-O&M ($1,209,460) $2,892,122 $7,927,518 $11,803,743 $14,814,161 40-Transportation $2,793,114 $5,301,972 $9,588,394 $13,817,020 $16,225,296 70-Working Cash $27,763,744 $37,901,264 $36,247,545 $38,113,732 $40,076,782
YEAR-END FUND BALANCE $41,965,363 $63,369,441 $79,725,750 $102,688,329 $109,785,111
($20,000,000)$0
$20,000,000$40,000,000$60,000,000$80,000,000
$100,000,000$120,000,000
FY15 FY16 FY17 FY18 (Unaudited) FY19(Bud.)

Unaudited Est. FY2018 vs. Projected FY2019 21
$317,013,837 $313,587,402
$375,390,646
$311,621,536
FY2018 FY2019
TOTAL BUDGET
Revenue Expenditure