pl concept i-5 aa bakersfield sylmar january 2012 rev 0 · guidelines january 2010 draft document...
TRANSCRIPT

DRAFT
Document Preparation andGeneral Formatting
Guidelines
January 2010
DRAFT
Document Preparation andGeneral Formatting
Guidelines
January 2010
Conceptual I-5 Corridor StudyBakersfield to
San Fernando Valley (Sylmar)
January 2012
Sacramento
Stockton
Downtown Modesto
Downtown Merced
San Francisco Transbay Terminal
Fresno
Kings/Tulare Regional Station(Potential Station)
Gilroy
San Jose Diridon Redwood City
or Palo Alto
Millbrae-SFO
Bakersfield
Palmdale
Ontario Airport San Fernando
Norwalk Riverside
Murrieta
Escondido
University City
San Diego
IndustryLos Angeles
Anaheim
THIS PAGE INTENTIONALLY LEFT BLANK

California High-Speed Train Project
CONCEPTUAL I-5 CORRIDOR STUDY BAKERSFIELD TO SAN FERNANDO
VALLEY (SYLMAR)

CALIFORNIA HIGH-SPEED TRAIN PROJECT CONCEPTUAL I-5 CORRIDOR STUDY BAKERSFIELD TO SAN FERNANDO VALLEY (SYLMAR)
JANUARY 2012, REV 0
U.S. Department of Transportation Federal Railroad Administration Page‐i
TABLE OF CONTENTS EXECUTIVE SUMMARY ...................................................................................................................... I
1.0 BACKGROUND ..................................................................................................................... 1
1.1 Program EIR/EIS Analysis 1
1.2 Project EIR/EIS Analysis 1
1.3 Stakeholder / Community Input on the Antelope Valley Alignment 2
2.0 PURPOSE OF CONCEPTUAL STUDY ........................................................................................ 3
2.1 Area of Study 4
3.0 OUTREACH ON THE I-5 ALIGNMENT ...................................................................................... 5
3.1 List of Briefings 6
4.0 CONSTRAINTS ON THE ALIGNMENT ...................................................................................... 8
4.1 Natural Environment considerations 8
4.2 Seismic Fault Analysis 10
4.3 Garlock Fault Crossings 13
4.4 Other Constraints 14
5.0 ALIGNMENT DEVELOPMENT ................................................................................................ 17
5.1 Methodology 17
5.2 Alignment Development 20
5.3 Results of the Alignment Study 20
5.4 Potentially Feasible Alignments 21
5.5 Outreach on Alignments 24
5.6 Selection of Representative Alignments for Comparative Analysis 24
6.0 RESULTS OF ALIGNMENT ASSESSMENT ............................................................................... 30
6.1 Engineering Feasibility 30
6.2 Travel Time Analysis 30
6.3 Comparative Capital Costs and Risk Analysis 30
7.0 COMPARISON OF CORRIDORS ............................................................................................ 32
7.1 Comparison Process 32
7.2 Derivation of Data for HST Design Objectives comparison 33
7.3 Antelope Valley and I-5 Alternatives Comparison 35
7.4 Comparison Summary 43
8.0 CONCLUSIONS ................................................................................................................... 43

CALIFORNIA HIGH-SPEED TRAIN PROJECT CONCEPTUAL I-5 CORRIDOR STUDY BAKERSFIELD TO SAN FERNANDO VALLEY (SYLMAR)
JANUARY 2012, REV 0
U.S. Department of Transportation Federal Railroad Administration Page‐ii
APPENDIX A - ESTIMATING METHODOLOGY AND DETAILED COST BUDGETS ...................................... A
APPENDIX B - I-5 ALIGNMENT RISK ANALYSIS METHODOLOGY AND RESULTS ..................................... B

CALIFORNIA HIGH-SPEED TRAIN PROJECT CONCEPTUAL I-5 CORRIDOR STUDY BAKERSFIELD TO SAN FERNANDO VALLEY (SYLMAR)
JANUARY 2012, REV 0
U.S. Department of Transportation Federal Railroad Administration Page‐iii
TABLES Table 6.2-1 Travel Times for Sample Alignments 30
Table 6.3-1 Key Quantities and Costs for Bakersfield to Sylmar 31
Table 6.3-2 Risk Adjusted Costs 32
Table 7.2-1 Bakersfield to Sylmar travel times 33
Table 7.2-2 HST Phase 1 Ridership and Revenue Estimates with Five Minute Time Saving 34
Table 7.2-3 HST Phase 1 Operating Cash Flow 35
Table 7.3-1 Options Comparison (Program EIR/EIS Section 6.4) 35
Table 7.3-2 Other Comparisons 37
FIGURES Figure 2.0-1 I-5 Study Area 4
Figure 4.1-1 Natural Environment Considerations 9
Figure 4.2-1 Seismic Constraints 12
Figure 4.3-1 Garlock Fault Profile 13
Figure 4.3-2 Length of Garlock Fault Approaches 14
Figure 4.4-1 Existing Land Use and Major Proposed Developments 16
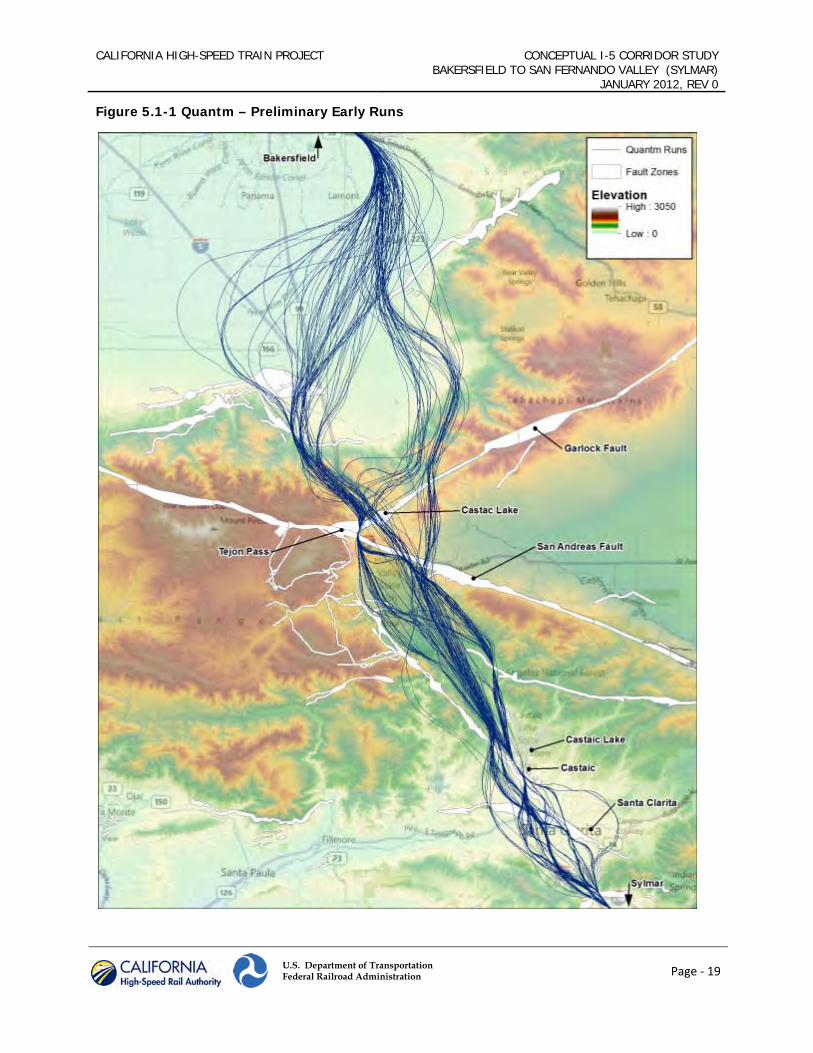
Figure 5.1-1 Quantm – Preliminary Early Runs 19
Figure 5.4-1 Potentially Feasible Alignments with Fault Hazard Zones 22
Figure 5.4-2 Potentially Feasible Alignments with Parks and Conservation Areas 23
Figure 5.6-1 Representative Alignments in the Tejon Pass Area 26
Figure 5.6-2 Representative Alignment and Natural Resources 27
Figure 5.6-3 Representative Alignment and Land Use 28
Figure 5.6-4 Detail of Representative Alignments in Santa Clarita Area 29
Figure 6.3-1 Evolution from Base Cost Estimate to Risk Adjusted Cost Estimate 32
ABBREVIATIONS / ACRONYMS AA ..................... Alternatives Analysis Amtrak ............. National Railroad Passenger Corporation Authority .......... California High‐Speed Rail Authority Caltrans ............ California Department of Transportation CDFG................. California Department of Fish and Game CEQA ................ California Environmental Quality Act CGS ................... California Geological Survey CHSTP ............... California High Speed Train Project CNPS ................. California Native Plant Society CRHR ................ California Register of Historical Resources

CALIFORNIA HIGH-SPEED TRAIN PROJECT CONCEPTUAL I-5 CORRIDOR STUDY BAKERSFIELD TO SAN FERNANDO VALLEY (SYLMAR)
JANUARY 2012, REV 0
U.S. Department of Transportation Federal Railroad Administration Page‐iv
CWA ................. Clean Water Act EIR .................... Environmental Impact Report EIS ..................... Environmental Impact Statement EMT .................. Engineering Management Team FEMA ................ Federal Emergency Management Agency FRA ................... Federal Railroad Administration GIS .................... Geographic Information System HOV .................. High Occupancy Vehicle HST ................... High‐Speed Train LADOT .............. City of Los Angeles, Department of Transportation LA River ............ Los Angeles River LASHP ............... Los Angeles State Historic Park LAUS ................. Los Angeles Union Station LEDPA ............... Least Environmentally Damaging Practicable Alternative LOSSAN ............. Los Angeles to San Diego Passenger Rail Corridor Metro ............... Los Angeles County Metropolitan Transportation Authority mph .................. Miles per hour NB ..................... Northbound NEPA ................. National Environmental Policy Act NRHP ................ National Register of Historic Places PMT .................. Program Management Team ROW ................. Right‐of‐Way SB ..................... Southbound SCG ................... Southern California Gas Company SCRRA ............... Southern California Regional Rail Authority (Metrolink) SR ..................... State Route SWG .................. Stakeholder Working Group TM .................... Technical Memorandum TOD .................. Transit‐Oriented Development UPRR ................ Union Pacific Railroad USGS ................. United States Geological Survey USEPA ............... United States Environmental Protection Agency

CALIFORNIA HIGH-SPEED TRAIN PROJECT CONCEPTUAL I-5 CORRIDOR STUDY BAKERSFIELD TO SAN FERNANDO VALLEY (SYLMAR)
JANUARY 2012, REV 0
U.S. Department of Transportation Federal Railroad Administration Executive Summary‐i
EXECUTIVE SUMMARY Over the past several years, project-level studies have led to an increase in estimated capital cost between Palmdale and Sylmar and recognition of impacts on existing residential and planned developments. These factors led the California High-Speed Rail Authority (Authority) to conduct a Conceptual Study (Study) of the I-5 corridor to confirm the decision to advance the Antelope Valley corridor route made with the Statewide 2005 Program Environmental Impact Report/Environmental Impact Statement (2005 Program EIR/EIS). Specifically, this Study assessed potential alternatives along the I-5 to determine if new conditions and factors exist that would justify reconsidering the 2005 Program EIR/EIS decision to drop the I-5 corridor in favor of the Antelope Valley corridor. Results of the Study confirm the 2005 decision.
With the 2005 Program EIR/EIS, the Authority and Federal Railroad Administration (FRA) evaluated two corridors between Bakersfield and Sylmar, one along the I-5 and another through the Antelope Valley. The Antelope Valley corridor was selected in the 2005 Program EIR/EIS to be carried forward because it would have fewer potential environmental impacts, it would be less subject to seismic activity, it would have considerably less tunneling and thereby have fewer constructability issues, and it would increase connectivity and accessibility. The Antelope Valley alignment was also found to offer greater opportunities for alignment variations through the mountains to avoid impacts to environmental resources, have less growth inducing impacts on urbanized land and farmland conversion, would provide service to the fastest growing area of Los Angeles County, and had strong support in Los Angeles County.
The 2005 Program EIR/EIS noted comments from the US Environmental Protection Agency and the US Army Corps of Engineers stating concerns regarding potential impacts to the Santa Clara River through the Soledad Canyon portion of the Antelope Valley alignment. The Authority and FRA also committed to study and consider an option that closely follows State Route 14 (SR 14) through Soledad Canyon as an avoidance option for potential impacts to the Santa Clara River. As a result of project-level study, the current Antelope Valley alignments now diverge from the Santa Clara River and follow SR 14 more closely, thus reducing environmental impacts but with the consequence of increasing tunnel length, construction risk and cost.
The Study revisited the analysis from the 2005 Program EIR/EIS and involved additional engineering design sufficient to identify potential alignments generally following the I-5 that meet minimum engineering criteria. The Study updates the engineering and environmental impact analysis, made in the 2005 Program EIR/EIS, using the current preliminary engineering for the Antelope Valley alignments and new conceptual engineering of the I-5 alignments.
A number of alignments were identified that meet the engineering criteria and avoid crossing wilderness and roadless areas, and that, due to topography, cross other environmentally sensitive areas predominantly in tunnel. However, all these feasible alignments cross existing and planned development, and at this conceptual level of design the costs of mitigating these impacts are difficult to quantify. To clearly compare with the current Antelope Valley alignments, a representative “most viable” I-5 alignment was used. For purposes of comparing the estimated capital costs, allowances for environmental mitigation, impact avoidance and contingency to reflect the differing levels of design development have been included.
The conclusion in the 2005 Program EIR/EIS that the Antelope Valley corridor would have fewer potential environmental impacts than an I-5 alignment is confirmed by this Study, though the difference is less than it was in 2005. The following summary points describe environmental attributes where the I-5 and

CALIFORNIA HIGH-SPEED TRAIN PROJECT CONCEPTUAL I-5 CORRIDOR STUDY BAKERSFIELD TO SAN FERNANDO VALLEY (SYLMAR)
JANUARY 2012, REV 0
U.S. Department of Transportation Federal Railroad Administration Executive Summary‐ii
Antelope Valley alignments are now comparatively better, worse or the same as they were in the 2005 Program EIR/EIS.
Cultural Resources – The 2005 Program EIR/EIS concluded that the Antelope Valley corridor would have greater potential impacts on cultural and paleontological resources. This has been confirmed in the current Study.
Biological Resources – The 2005 Program EIR/EIS concluded that the Antelope Valley corridor would have slightly more potential impacts on biological resources than the I-5 corridor. This analysis was updated by identifying species and habitat within 1,000 feet of the above-ground alignments during the Study and showed that the I-5 alignments impact slightly more species, including the California Condor. Current Antelope Valley alignments have less potential impacts on biological resources than at the program-level, due in part to the current SR 14 alignment avoiding the Santa Clara River in Soledad Canyon between Palmdale and Sylmar. The Antelope Valley alignments therefore now have less potential to impact biological resources than an I-5 alignment.
Wetlands and Water Bodies – The 2005 Program EIR/EIS concluded that the Antelope Valley corridor would have less potential for water-related impacts. Some of the current Antelope Valley alignments have an impact on Lake Palmdale and Una Lake and tunnel under the California Aqueduct. The Study I-5 alignments do not impact any lakes directly, but cross tributaries feeding Pyramid Lake and a large floodplain south of Bakersfield. The Study found the impacts from both I-5 and Antelope Valley alignments are now similar.
Growth Inducing Impacts – In the 2005 Program EIR/EIS, it was concluded that the I-5 corridor would likely indirectly induce population growth around the potential station in Bakersfield. Consequently, farmland conversion in the Central Valley would likely occur. While the Antelope Valley corridor would likely indirectly induce population growth in the Mohave Desert areas closest to the proposed Palmdale station, it would induce less growth than an I-5 alignment. The Study does not change these conclusions.
National Forests – In the 2005 Program EIR/EIS, the most significant difference in potential environmental impacts was in regard to impacts to National Forests. The Antelope Valley corridor was not expected to go through National Forest. The I-5 Study alignment crosses Angeles and Los Padres National Forest for 14 miles. It also passes in tunnel under Wind Wolves Preserve for four miles. The current Antelope Valley alignments still avoid National Forest, so the Study confirms the conclusion of the 2005 Program EIR/EIS.
Farmland – The 2005 Program EIR/EIS concluded that the Antelope Valley corridor would have less potential impacts on prime farmland, but greater impacts on grazing land. This has been confirmed in the current Study.
Opportunities For Using Alignment Variations To Avoid Sensitive Resources – The 2005 Program EIR/EIS concluded that the Antelope Valley corridor offered greater opportunities for high-speed train alignment variations, particularly through the mountainous areas of the corridor, to avoid impacts to environmental resources. In contrast, the more challenging terrain of the I-5 corridor greatly limits the ability to avoid sensitive resources and seismic constraints. This has been confirmed in the Study.
The I-5 and Antelope Valley alignments were also compared with respect to meeting Project objectives, and the Study re-evaluated factors relating to constructability and cost that were considered in the 2005 Program EIR/EIS.

CALIFORNIA HIGH-SPEED TRAIN PROJECT CONCEPTUAL I-5 CORRIDOR STUDY BAKERSFIELD TO SAN FERNANDO VALLEY (SYLMAR)
JANUARY 2012, REV 0
U.S. Department of Transportation Federal Railroad Administration Executive Summary‐iii
Tunnel Length – In the 2005 Program EIR/EIS, the Antelope Valley corridor had 13 miles of tunnel while the I-5 corridor had 33 miles. After project-level preliminary engineering the Antelope Valley alignments now have 29 miles of tunnel and the conceptual engineering developed in the Study for the I-5 corridor has 31 miles. The length of tunnel is now comparable for both corridors.
Capital Cost – In the 2005 Program EIR/EIS, the cost for the I-5 corridor was estimated at $6.58B, while the cost of the Antelope Valley corridor was estimated at $6.46B. During preliminary engineering, the relative cost of the Antelope Valley alignments has increased in part to avoid and reduce impacts. The Draft 2012 Business Plan cost estimate for the Antelope Valley alignment (between Bakersfield and Sylmar) is between $15.0 billion and $15.5 billion. A risk adjusted capital cost estimate for the I-5 alignment allows for mitigation, avoidance and contingency amounts, and reflects the differing levels of design development between the I-5 and Antelope Valley corridors. The risk adjusted cost estimate is $15.1 billion. Like the 2005 Program EIR/EIS, the Study concludes that the cost of an I-5 alignment would be of a similar magnitude to the Antelope Valley alternatives.
Alignment Length and Travel Time – The 2005 Program EIR/EIS concluded an I-5 alignment would be 33 to 36 miles shorter in length and provide travel time savings of 10 to 12 minutes compared to an Antelope Valley alignment. The Antelope Valley alignments are now up to five miles shorter than envisaged at the Program stage while the Study I-5 alignments are now longer, diverging from the Antelope valley alignments east of Bakersfield. The Study finds that the I-5 alignment would now only be 23 to 25 miles shorter. The analysis of the current Antelope Valley alignments and the I-5 alignments shows that, because of this additional length, the longer steep gradients and the sharp curves needed in Santa Clarita and Tejon Pass, the travel time saving is on average likely to be only three to five minutes. This is substantially less than the anticipated length and travel time advantage in 2005 and confirms the decision to drop the I-5 corridor from further consideration.
Stations – The 2005 Program EIR/EIS considered a station in Santa Clarita, but rejected it in favor of a station in Sylmar. The Santa Clarita station location considered did not provide a direct connection to Metrolink. In addition, factors such as low population and potential future ridership, operational reasons related to terrain, right-of-way issues and cost and impacts to potential cultural resources on the Santa Clara River rejected the option of a station in Santa Clarita. The Study did identify one possible station location adjacent to Metrolink, one along the Santa Clara River and one along the I-5. All potential station locations identified in the Study are in developed areas with significant impacts and restricted right-of-way. City of Santa Clarita staff has expressed concerns about the impacts of the I-5 alignment on the city and have not indicated support for a station. Thus, the conclusions of the 2005 Program EIR/EIS are largely unchanged.
Seismic – The 2005 Program EIR/EIS concluded that the I-5 corridor would have considerably higher seismic issues than the Antelope Valley corridor. Project-level studies for the Antelope Valley have resulted in alignments that cross the San Gabriel fault (which has a low probability of rupture and a small predicted movement) in tunnel. However, the I-5 corridor remains more seismically active than the Antelope Valley corridor, paralleling the San Gabriel fault for 20 miles, and passing through the intersection of the Garlock and San Andreas faults. The topography of the Tehachapi Mountains restricts the feasible alignments to the Tejon Pass. This restriction results in all potentially feasible alignments crossing through the intersection of the San Andreas

CALIFORNIA HIGH-SPEED TRAIN PROJECT CONCEPTUAL I-5 CORRIDOR STUDY BAKERSFIELD TO SAN FERNANDO VALLEY (SYLMAR)
JANUARY 2012, REV 0
U.S. Department of Transportation Federal Railroad Administration Executive Summary‐iv
and Garlock faults. The Study has confirmed that the seismic risk for the I-5 alignment is still greater than for the Antelope Valley alignments.
Constructability – In the 2005 Program EIR/EIS, there were concerns about constructability of an I-5 alignment, particularly relating overall amount of tunneling and to the length of individual tunnels. With the increased amount of tunneling now found necessary on the Antelope Valley alignments, constructability for the I-5 corridor is now comparable with the Antelope Valley.
Connectivity into the Antelope Valley – By definition the Antelope Valley alignment will provide greater connectivity into the Antelope Valley. In the 2005 Program EIR/EIS it was noted that this was the fastest growing area in Los Angeles County, and that the high-speed train system would also provide connectivity to Palmdale Airport and Metrolink commuter rail service. While the economic recession has slowed growth, the Antelope Valley continues to be one of the fastest growing areas in Los Angeles County. Since 2005, additional factors that favor the Antelope Valley alignment include the proposed DesertXpress rail service between Victorville and Las Vegas, which recently received environmental approval and the planned High Desert Corridor that will significantly improve connectivity between Victorville and Palmdale. The Study confirms the greater connectivity potential of the Antelope Valley alignments.
The Study also evaluated operational aspects, including ridership, operating costs and maintenance costs that were not compared qualitatively in the 2005 Program EIR/EIS. The Study’s ridership analysis has shown that the loss of Antelope Valley commuters for an I-5 alignment reduces the anticipated number of riders by approximately two million annually (5%) and ridership revenue by about $50 million per year (2%). The shorter I-5 route length is expected to reduce operations and maintenance costs, also by about $50 million per year. As a result, the net cash flow for the I-5 and the Antelope Valley alternatives would be similar.
During outreach on this Study, most of the stakeholders consulted expressed a preference for the Antelope Valley alignments in order to meet the community needs of the residents in Palmdale and Lancaster. Local residents, businesses, elected officials and regional organizations have emphasized the importance of the high-speed rail system serving the Antelope Valley. Stakeholders that have confirmed their support for the Antelope Valley alignment and urged that the I-5 alignment not be considered further include Los Angeles County Supervisor Michael Antonovich and Kern County, the cities of Arvin, Tehachapi, Lancaster and Palmdale, and the community of Rosamond. The Tejon Ranch Company oppose the I-5 alignment. The Center for Biological Diversity oppose the I-5 alignment due to the potential impacts on the Wind Wolves preserve. There has been very little support for an I-5 alignment by stakeholders in the Antelope Valley and Santa Clarita. The City of Santa Clarita has concerns that the potential impacts of an I-5 alignment on the city would be much greater than the impacts from an alignment via Palmdale, although they recognize the opportunity that the I-5 alignment provides for a possible station location in Santa Clarita and the benefits this would bring. The Los Angeles Metropolitan Transportation Authority (Metro) recognizes the opportunity for connectivity and increased mobility through the Antelope Valley.
Overall, most of the factors that led the Authority and FRA to select the Antelope Valley corridor in the 2005 Program EIR/EIS to be carried forward are not substantially changed. The Study confirms that the Antelope Valley alignments have fewer potential environmental impacts, enhanced by the selection of alignments more closely following SR 14 and avoiding the Santa Clara River. The advantage of the Antelope Valley alignments with regard to seismic risk is similar, but the advantage on the amount of tunneling and constructability issues are much reduced and the I-5 alternative could be somewhat less costly. The Antelope Valley alignments still offer greater connectivity and accessibility. The Antelope Valley alignments also have greater opportunities for alignment variations through the mountains to avoid
CALIFORNIA HIGH-SPEED TRAIN PROJECT CONCEPTUAL I-5 CORRIDOR STUDY BAKERSFIELD TO SAN FERNANDO VALLEY (SYLMAR)
JANUARY 2012, REV 0
U.S. Department of Transportation Federal Railroad Administration Executive Summary‐v
impacts to environmental resources reducing risk, have less growth inducing impacts on urbanized land and farmland conversion, would provide service to the fastest growing area of Los Angeles County, and have strong stakeholder support. Taken together these findings reinforce the Authority and FRA decision of the 2005 Program EIR/EIS selecting the Antelope Valley alignment for further study.

CALIFORNIA HIGH-SPEED TRAIN PROJECT CONCEPTUAL I-5 CORRIDOR STUDY BAKERSFIELD TO SAN FERNANDO VALLEY (SYLMAR)
JANUARY 2012, REV 0
U.S. Department of Transportation Federal Railroad Administration Page ‐ 1
1.0 BACKGROUND 1.1 Program EIR/EIS Analysis
With the 2005 CHSTP Program EIR/EIS, the Authority and FRA examined alignment opportunities between Bakersfield and Sylmar that included alignments along the I-5 (Grapevine), and through the Antelope Valley via Palmdale generally following SR 58/SR 14/Soledad Canyon. The Final Program EIR/EIS, Section 6A.4.1, concluded that the alignment through the SR 58/SR 14/Soledad Canyon Corridor (Antelope Valley) with an HST station at Palmdale was the preferred option for crossing the Tehachapi Mountains between the Central Valley and Southern California on the grounds that, despite the I-5 alignment option being estimated to be over 30 miles shorter and approximately 10 minutes faster, the Antelope Valley alignment would:
have fewer potential environmental impacts (though greater cultural and biological resource impacts);
be subject to less seismic activity and enable at-grade crossings of the San Andreas and Garlock faults;
require considerably less tunneling and consequently be easier to construct, resulting in somewhat less cost; and
provide connectivity to future Palmdale/Antelope Valley redevelopment, and to Palmdale Regional Airport if reopened to commercial passenger flights. In the 1990s and early 2000s, the Antelope Valley region (Palmdale and Lancaster) was experiencing significant development. The cities of Los Angeles, Lancaster and Palmdale wanted the HST alignment to support that fast growing population with an HST station.
At the time, the US Environmental Protection Agency (USEPA) and the US Army Corps of Engineers raised concerns regarding potential impacts to the Santa Clara River through the Soledad Canyon portion of the Antelope Valley alignment. Thus, the Program EIR/EIS defined Soledad Canyon as “a relatively wide corridor area that includes both the SR 14 and UPRR alignments between the Antelope Valley and Santa Clarita” and said that future study of the Antelope Valley alignment would consider an option closely following the SR 14 as an avoidance option for potential impacts to the Santa Clara River.
1.2 Project EIR/EIS Analysis
Project EIR/EIS work on the Los Angeles-Sylmar-Palmdale-Bakersfield sections have focused on performing a more detailed examination of the potential alignments identified in the Program EIR/EIS, including translating rather broad corridors into route alignments. Where local concerns or site-specific issues dictate, alternative alignments have been developed and evaluated.
Between Bakersfield and Palmdale, the alignment has generally remained within the corridor anticipated in the Program EIR/EIS. The most significant change has been an effort to rebalance the mixture of tunnels and viaducts on the northern slopes of the Tehachapi Mountains, a realignment to shorten the alignment and minimize impact to wind energy projects and to Mojave Air and Space Port, and crossing Rosamond and the City of Lancaster at-grade rather than on viaducts.
Between Palmdale and Sylmar there have been more challenging design issues. Alignment alternatives were investigated using a computer aided alignment planning tool (Quantm), allowing thousands of potential alignment options to be studied that generally followed the SR 14/Soledad Canyon corridor between Palmdale and Sylmar. The resulting alternatives that best met the project objectives were evaluated further through the Preliminary Alternatives Analysis report in 2010. Four alternatives were evaluated, of which one followed Soledad Canyon and three (SR 14 East, SR 14 South and SR 14 West) more closely followed the existing SR 14 freeway. The SR 14 South alternative was withdrawn from

CALIFORNIA HIGH-SPEED TRAIN PROJECT CONCEPTUAL I-5 CORRIDOR STUDY BAKERSFIELD TO SAN FERNANDO VALLEY (SYLMAR)
JANUARY 2012, REV 0
U.S. Department of Transportation Federal Railroad Administration Page ‐ 2
further consideration because it had the greatest length of tunnel and so the highest construction cost, and because of its impact to developed properties in the Acton area and elsewhere.
The Soledad Canyon alignment had the longest route length and travel time, and to avoid unacceptable environmental impacts had greater tunnel and viaduct lengths at significantly higher cost than originally envisioned at program level. Even with these improvements, it still had the most impacts to the existing Metrolink rail line, Soledad Canyon Road and Santa Clara River. It also had most geotechnical constraints, constructability issues, environmental impacts (to protected and endangered species) and residential displacements occurred through the Soledad Canyon and Acton area. It took the largest area of Angeles National Forest of any of the alternatives. It was recommended not to be considered further by the USEPA and California Department of Fish & Game (CDFG), who wrote to the Authority stating their belief that the SR 14 East and West alignments provided a greater opportunity to find the Least Environmentally Damaging Practicable Alternative (LEDPA) through this subsection. For these reasons, the Soledad Canyon alignment alternative was also withdrawn from further consideration.
At the July 2010 Board Meeting, during the presentation of the Preliminary Alternatives Analysis (PAA) findings, the Authority Board concluded that the SR 14 East and SR 14 West alignments should be studied further. These alignment alternatives pass through the Sand Canyon neighborhood in Santa Clarita and the communities of Acton and Agua Dulce.
Eliminating the Soledad Canyon alignment and taking into account the development that has occurred since the Program EIR/EIS was completed, combined with improved topographical data through the Tehachapi and San Gabriel mountains, means that the current alignments being studied between Bakersfield and Sylmar now include longer tunnel sections and elevated structures at a higher cost. The cost estimate for the high cost alternative for Bakersfield to Sylmar1 in the Draft 2012 Business Plan is $15.5 billion (the low cost alternative is $15.0 billion). Opportunities for cost reduction while maintaining project operational objectives on these alignments have been investigated, and incorporated where possible, but the cost reductions generated are limited. Any significant further cost saving is therefore only likely to result from shortening the route.
1.3 Stakeholder / Community Input on the Antelope Valley Alignment
The Preliminary and Supplemental Alternatives Analysis Reports for the Bakersfield to Palmdale and Palmdale to Los Angeles sections provide details of input obtained from stakeholders. In summary:
Significant objections have been raised about the SR 14 East and SR 14 West alignments from the communities of Acton, Agua Dulce and Sand Canyon. These communities have raised concerns about potential visual and noise impacts to residential areas and local schools from viaduct and at-grade alignments. The City of Santa Clarita has also expressed a perception of being impacted without benefit, since a Santa Clarita station is not feasible with the Antelope Valley alignment.
The balance of the Antelope Valley alignment has generally received support from the cities of Palmdale, Lancaster, Rosamond (Rosamond Community Services District), Mojave and Bakersfield, although there are concerns about potential impacts. The City of Palmdale does not favor the SR 14 West alignment, as that alignment alternative is not compatible with a station at the existing Palmdale Transportation Center.
1 The cost estimate for the high cost alternative for Bakersfield to Los Angeles in the Draft 2012 Business Plan is $20.8 billion (the low cost alternative is $19.1 billion). This compares to a cost of $10.4 billion envisioned at the Program stage in 2005 for the Bakersfield to Los Angeles section.

CALIFORNIA HIGH-SPEED TRAIN PROJECT CONCEPTUAL I-5 CORRIDOR STUDY BAKERSFIELD TO SAN FERNANDO VALLEY (SYLMAR)
JANUARY 2012, REV 0
U.S. Department of Transportation Federal Railroad Administration Page ‐ 3
Kern County is concerned about the potential for impacts to renewable energy projects (wind and solar) in eastern Kern County and impacts to their long-term transportation plans.
The Nature Conservancy is concerned about impacts on wildlife where the Antelope Valley alignment crosses the mountains. Wildlife linkages in particular need to be maintained or enhanced.
The Tejon Ranch Company and Tejon Ranch Conservancy would prefer that the high-speed train alignment not cross its property.
2.0 PURPOSE OF CONCEPTUAL STUDY The capital cost increases for the project-level alignment alternatives between Palmdale and Sylmar, and their impact on existing residential and planned development, led the Authority to consider undertaking a new Conceptual Study (Study) of the I-5 corridor to reexamine the basis of its Tier 1 decision to carry forward the Antelope Valley corridor for further study at the second tier and to drop the I-5 corridor.
Restudying the I-5 corridor was discussed at the Authority’s May 2011 Operations Committee and Board meetings and conducting the Conceptual Study was approved by the Authority Board at that time. In approving the Study, the Authority Board asked for a conceptual engineering study of the I-5 alternative to determine if feasible alignments exist, and if so, to provide a capital cost and travel time comparison of the I-5 alignments against those in the Antelope Valley, and to consider approved future developments in comparing the costs of acquiring the necessary land for the High-Speed Rail (HSR) Project. The Study was to include outreach to stakeholders to identify potential fatal flaws, while focusing on the engineering feasibility and conceptual-level cost comparison.
It was considered that if the more direct routes between Bakersfield and Sylmar (i.e. the I-5 corridor) were reintroduced for study, a new Project EIR/EIS process will be needed, beginning with scoping and a full alternatives analysis (AA) - comparing the I-5 alignment options with the alignment options through the Antelope Valley. Once scoping were restarted, it was anticipated that a Preliminary AA report would be presented to the Board after six months, a Supplemental AA after ten months, and the Draft EIS/EIR would be published after twenty months in the summer of 2013, about ten months later than if the I-5 corridor was not reintroduced.
Subsequent to the Board action this brief was expanded to include confirmation of the decision to advance the Antelope Valley corridor route made in the 2005 Program EIR/EIS. Specifically, this Study assessed a potential alternative along the I-5 to determine if new conditions and factors exist that would justify reconsidering the 2005 Program EIR/EIS decision to drop the I-5 corridor in favor of the Antelope Valley corridor.

CALIFORNIA HIGH-SPEED TRAIN PROJECT CONCEPTUAL I-5 CORRIDOR STUDY BAKERSFIELD TO SAN FERNANDO VALLEY (SYLMAR)
JANUARY 2012, REV 0
U.S. Department of Transportation Federal Railroad Administration Page ‐ 4
2.1 Area of Study
The starting point for the Study is the existing alignment of the Bakersfield to Palmdale section where it emerges from the east of Bakersfield. The end point for the Study is near Roxford Street in Sylmar, where the HSR alignment joins the existing Metrolink railroad right-of-way through the San Fernando Valley. The I-5 alignments studied generally follow the existing I-5 transportation corridor through the Tejon Pass, see Figure 2.0-1.
Figure 2.0-1 I-5 Study Area

CALIFORNIA HIGH-SPEED TRAIN PROJECT CONCEPTUAL I-5 CORRIDOR STUDY BAKERSFIELD TO SAN FERNANDO VALLEY (SYLMAR)
JANUARY 2012, REV 0
U.S. Department of Transportation Federal Railroad Administration Page ‐ 5
3.0 OUTREACH ON THE I-5 ALIGNMENT A comprehensive outreach program was conducted to ensure stakeholder input on the practicability of I-5 alignment alternatives was received and factored into the alignment feasibility determination, including the Quantm process.
Overall input obtained at stakeholder meetings included the following concerns: future residential and commercial development, impacts to animal and plant habitats, water issues including flooding, impacts to Native American ground, county roads and infrastructure, impacts to pending solar projects, agricultural impacts including division of land, access to roads during harvest, and impacts to drainage and irrigation. To the extent possible at this level of study, these concerns were addressed in the scope of the Study.
Below is an overview of key stakeholder concerns:
The City of Santa Clarita has concerns that the potential impacts of an I-5 alignment on the city would be much greater than the impacts from an alignment via Palmdale. They recognize the opportunity that the I-5 alignment provides for a possible station location in Santa Clarita and the benefits this would bring, and commented on potential station locations. They noted several developments occurring in this area including Newhall Ranch.
The Cities of Tehachapi, Rosamond (Rosamond Community Services District), Lancaster and Palmdale are supportive of HSR and the alignment through Antelope Valley and have urged that an I-5 alignment not be considered further. They view HSR as an economic development opportunity for the entire Tehachapi/Antelope Valley Region, and an opportunity to improve connections with the proposed DesertXpress and High Desert Corridor schemes.
The Los Angeles County Supervisor’s office supports the alignment through Antelope Valley with a station location in Palmdale and requested that the Authority continue to study and refine the Antelope Valley alternatives to minimize impacts to communities in Acton, Agua Dulce and Santa Clarita.
The Kern County Board of Supervisors recently voted to adopt a resolution to support the alignment through Antelope Valley and oppose the I-5 alignment. The County’s concerns include impacts to the Tejon Commerce Center and the proposed Tejon Mountain Village development.
The City of Arvin is generally supportive of HSR; concerns include potential impacts to the city from an I-5 alignment.
Kern County Farm Bureau is generally supportive of HSR and has been supportive of the alignment through Antelope Valley; concerns include potential impacts from an I-5 alignment to farms and agricultural business in southwest Kern County.
Tejon Ranch Company would prefer that the HSR not cross its property. It is especially concerned with potential impacts to Tejon Mountain Village, which is a planned mixed-use development located adjacent to the I-5 freeway, and has urged that an I-5 alignment not be considered further. They have suggested that such an alignment could make the Tejon Mountain Village development non-viable. The Tejon Ranch Company have considerable investment in obtaining their EIR for the proposed project and as a condition of the approval have agreed to dedicate 90% of their 270,000 acre holdings for conservation. Impacts to the proposed project as a result of a high-speed train corridor could jeopardize the project and void agreements to establish conservation areas.

CALIFORNIA HIGH-SPEED TRAIN PROJECT CONCEPTUAL I-5 CORRIDOR STUDY BAKERSFIELD TO SAN FERNANDO VALLEY (SYLMAR)
JANUARY 2012, REV 0
U.S. Department of Transportation Federal Railroad Administration Page ‐ 6
California State Parks expressed concern if there would be potential impacts to Fort Tejon State Historic Park or other parks close to the alignment, or land intrusions and ecological impacts to the Hungry Valley State Vehicle Recreational Area.
Wildlands Conservancy expressed concern about potential impacts of an I-5 alignment to Wind Wolves Preserve and the mouth of Tecuya Creek and is concerned about wildlife linkages where the HST alignment is not in tunnel.
The Nature Conservancy expressed preference for an I-5 alignment over the alignment alternatives through the Antelope Valley, and is concerned about wildlife linkages in both cases.
The U.S. Forest Service expressed concern about potential impacts to the national forests, and pointed out the need to avoid wilderness and roadless areas.
3.1 List of Briefings
Date Briefing 12/16/2011 Los Angeles County Supervisor Michael Antonovich staff 12/15/2011 Los Angeles County Metropolitan Transit Authority (Metro) 11/15/2011 Los Angeles County Supervisor Michael Antonovich staff 10/31/2011 US Forest Service 10/24/2011 Acton/Agua Dulce Working Group 10/20/2011 Agencies conference call:
California Dept. of Fish and Game US Environmental Protection Agency US Fish and Wildlife Service US Army Corps of Engineers
10/18/2011 City of Santa Clarita 10/13/2011 Kern County Planning Director Lorelei Oviatt 10/12/2011 Southern California Edison 10/12/2011 Sempra Energy 10/11/2011 City of Palmdale 9/13/2011 The Wildlands Conservancy 8/24/2011 City of Tehachapi 8/11/2011 City of Rosamond (Rosamond Community Services District) 8/11/2011 City of Lancaster 8/10/2011 Los Angeles County Supervisor Michael Antonovich staff 8/10/2011 City of Palmdale 8/9/2011 Tejon Ranch Company 7/25/2011 City of Santa Clarita 7/19/2011 Mountain Communities MAC 7/14/2011 Dan York, The Wildlands Conservancy 6/23/2011 Kern County Farm Bureau 6/22/2011 Kern County Supervisor Karen Goh 6/21/2011 Jeff Gaffney and Kim Matthews, Hungry Valley Recreational Area 6/17/2011 EJ Remson, The Nature Conservancy 6/13/2011 Jarrod DeGonia, Assemblymember Smyth 6/13/2011 Ernie Villegas, Assemblymember Gorell

CALIFORNIA HIGH-SPEED TRAIN PROJECT CONCEPTUAL I-5 CORRIDOR STUDY BAKERSFIELD TO SAN FERNANDO VALLEY (SYLMAR)
JANUARY 2012, REV 0
U.S. Department of Transportation Federal Railroad Administration Page ‐ 7
Date Briefing 6/9/2011 Kathy Weatherman, State Parks 6/9/2011 Dan York, The Wildlands Conservancy 6/6/2011 Tejon Ranch Company 6/1/2011 Agencies conference call:
California Dept. of Fish and Game US Environmental Protection Agency US Fish and Wildlife Service US Army Corps of Engineers US Forest Service
6/1/2011 and 5/20/2011 Chief Kathy Morgan, Tejon Indian Tribe 6/1/2011 and 5/24/2011 Lorelei Oviatt, Kern County Planning Director 6/1/2011 David Powell, City Manager - City of Arvin 5/31/2011 Disney: Deanna Detchemendy, Adam Gilbert, Lisa Pitney, and Daniel
McBrearty 5/26/2011 City of Santa Clarita staff, Supervisor Antonovich staff, Metrolink and Metro 5/23/2011 Dana Culhane, Senator Jean Fuller 5/25/2011 John McQuiston, Kern County Supervisor 5/25/2011 Vince Fong, Congressmember Kevin McCarthy 5/25/2011 Al Wagner, Senator Michael Rubio 5/23/2011 Lisa Moulton/Senator Runner and Sarah Tyndall/Assemblyman Knight 5/21/2011 Bakersfield Chamber of Commerce, Government Relations Council 5/12/2011 City of Santa Clarita staff, Supervisor Antonovich staff, Metro and Metrolink 5/3/2011 Cities of Palmdale and Lancaster, Supervisor Antonovich staff, and Senator
Runner staff 5/3/2011 Supervisor Antonovich staff 5/3/2011 Supervisor Antonovich staff and City of Santa Clarita staff

CALIFORNIA HIGH-SPEED TRAIN PROJECT CONCEPTUAL I-5 CORRIDOR STUDY BAKERSFIELD TO SAN FERNANDO VALLEY (SYLMAR)
JANUARY 2012, REV 0
U.S. Department of Transportation Federal Railroad Administration Page ‐ 8
4.0 CONSTRAINTS ON THE ALIGNMENT 4.1 Natural Environment considerations
The land for much of the study area is undeveloped and managed for conservation as part of the Angeles National Forest, Los Padres National Forest, Hungry Valley State Vehicle Recreation Area, Wind Wolves Preserve, and for the Tejon Ranch Conservation and Land Use Agreement. The Tehachapi Mountains, which are crossed by both the Antelope Valley and I-5 alignments, form a key part of the wildlife corridors linking the Sierra Nevada to the coast (see Figure 4.0-1).
Both the I-5 and the Antelope Valley corridors pass through areas identified as potentially containing endangered and threatened species. In particular the I-5 corridor passes through a sizable area designated as critical habitat for the federally endangered California Condor. Much of the alignment through this mountainous section would be in tunnel, but viaducts are also needed to cross some deep canyons while at-grade or cut-and-fill sections would also be needed.
Both the I-5 and Antelope Valley corridors would need to cross the Santa Clara River and its tributaries in Santa Clarita. Viaduct piers would likely be needed in the river bed, which could disturb habitat and increase flooding risks.

CALIFORNIA HIGH-SPEED TRAIN PROJECT CONCEPTUAL I-5 CORRIDOR STUDY BAKERSFIELD TO SAN FERNANDO VALLEY (SYLMAR)
JANUARY 2012, REV 0
U.S. Department of Transportation Federal Railroad Administration Page ‐ 9
Figure 4.1-1 Natural Environment Considerations

CALIFORNIA HIGH-SPEED TRAIN PROJECT CONCEPTUAL I-5 CORRIDOR STUDY BAKERSFIELD TO SAN FERNANDO VALLEY (SYLMAR)
JANUARY 2012, REV 0
U.S. Department of Transportation Federal Railroad Administration Page ‐ 10
4.2 Seismic Fault Analysis
The 2005 Program EIR/EIS concluded that “the limited constructability of the I-5 alignment option combined with a high risk of seismic impacts makes the I-5 alignment option likely to be impracticable”. The 2005 Program EIR/EIS alignments crossed the Garlock and San Andreas faults at the point where they intersect at Tejon Pass and the alignment paralleled the San Gabriel fault for over 20 miles. Due to these factors it was concluded that the I-5 corridor would have greater seismic hazard and constructability issues than the Antelope Valley corridor.
Two forms of seismic activity pose risks to a high-speed train alignment, ground acceleration and fault rupture. Though ground acceleration affects a wide area and does not act as a constraint on the feasibility of a high-speed train alignment, the different magnitude of predicted ground acceleration in different areas can influence the choice between alternative alignments. Fault rupture is a very localized effect and, in California, areas at risk of fault rupture are generally identified as Alquist-Priolo Earthquake Fault Zones.
For this Study, a preliminary assessment of all faults that might constrain the alignment was carried out. This identified a number of fault traces, in addition to existing Alquist-Priolo Earthquake Fault Zones, that further analysis is likely to classify as capable of surface rupture.
The current Antelope Valley alignments cross the Garlock and San Andreas fault zones at-grade. These faults have anticipated movements of greater than 20 feet (in opposite directions) in a major seismic event. To be deemed feasible, any I-5 alignment would need to cross these faults at-grade. Additionally the apex of the two faults and the large geographical area it covers is critically located such that all alignment alternatives must pass through this zone adding further seismic risk in the corridor. The fault intersection zone also represents a greater potential for high ground accelerations (Figure 4.2-1) over a greater geographical extent than anticipated outside the zone or crossing discrete faults.
Because the San Gabriel fault is well-defined and movements, if any, are expected to be small, seismic risks are only significant where the alignment is within approximately 500 feet of the fault trace. Because of topography and alignment constraints, the project-level Antelope Valley alignment now crosses the San Gabriel fault in tunnel, however this is considered acceptable because of the low risk and low range of potential movement at this location. Special construction and provision of an enlargement in the tunnel to facilitate repair after any fault movement would be required.
4.2.1 San Andreas and Garlock Faults
Both the San Andreas and Garlock faults, which meet in Tejon Pass, have Alquist-Priolo Earthquake Fault Zones defined. Following the preliminary assessment, minor adjustments to extend the Fault Hazard Zones have been made.
Since these fault zones need to be crossed entirely at-grade or on shallow cut-and-fill, anywhere that the Fault Hazard Zones contain high steep slopes, is not a possible crossing point for the alignment. It would also be unacceptable for the alignment to require significant structures (a tunnel or viaduct across I-5 for example) within these zones.
4.2.2 San Gabriel Fault
The San Gabriel fault runs roughly parallel to and east of I-5 through Santa Clarita, crosses I-5 in Castaic and continues parallel to I-5 past Pyramid Lake. The existing Alquist-Priolo Earthquake Fault Zone covers part of the fault in Santa Clarita. Following the preliminary assessment, the fault hazard zone has been extended to cover the full length of the fault.

CALIFORNIA HIGH-SPEED TRAIN PROJECT CONCEPTUAL I-5 CORRIDOR STUDY BAKERSFIELD TO SAN FERNANDO VALLEY (SYLMAR)
JANUARY 2012, REV 0
U.S. Department of Transportation Federal Railroad Administration Page ‐ 11
4.2.3 Other Faults
Preliminary fault hazard zones have been identified for other faults in the study corridor as shown on Figure 4.2-1. At this preliminary stage, it is not possible to distinguish areas within a fault zone where the majority of any fault rupture would be expected to occur. Where the evidence suggests that further study will show surface rupture unlikely over a length of fault trace, a secondary fault hazard zone has been identified. The following figure also shows contours of peak ground acceleration in a seismic event.

CALIFORNIA HIGH-SPEED TRAIN PROJECT CONCEPTUAL I-5 CORRIDOR STUDY BAKERSFIELD TO SAN FERNANDO VALLEY (SYLMAR)
JANUARY 2012, REV 0
U.S. Department of Transportation Federal Railroad Administration Page ‐ 12
Figure 4.2-1 Seismic Constraints

CALIFORNIA HIGH-SPEED TRAIN PROJECT CONCEPTUAL I-5 CORRIDOR STUDY BAKERSFIELD TO SAN FERNANDO VALLEY (SYLMAR)
JANUARY 2012, REV 0
U.S. Department of Transportation Federal Railroad Administration Page ‐ 13
4.3 Garlock Fault Crossings
Crossing the Tehachapi mountain range is an engineering challenge. Mountain crossings normally attempt to follow the easiest routes, which generally follow natural passes and valleys. The I-5 freeway follows one major valley to Tejon Pass, while the SR 58 and Union Pacific railroad follows another valley to the Tehachapi Pass. As part of this Study, all of the major valleys on the north side of the Tehachapi Mountains along the Garlock fault were investigated. See Figure 4.3-1.
Figure 4.3-1 Garlock Fault Profile
The Tehachapi Mountains are rugged, steep and difficult to traverse. The north side of the mountain range is the most difficult. Per the project requirement that alignments be at-grade while crossing faults judged capable for surface rupture, the alignment must cross the Garlock fault at-grade. The Garlock fault is unusual in that it is located near the mountain crest at a high elevation. In order to cross the fault at grade, any rail alignment must rise up to the crest. Because the rail line has a maximum allowable grade, the higher the crossing at the crest, the longer the approach required. The length of the arrows on Figure 4.3-2 indicates the length of approach required to meet the crest elevation and cross the Garlock fault at this maximum grade of 3.5%.

CALIFORNIA HIGH-SPEED TRAIN PROJECT CONCEPTUAL I-5 CORRIDOR STUDY BAKERSFIELD TO SAN FERNANDO VALLEY (SYLMAR)
JANUARY 2012, REV 0
U.S. Department of Transportation Federal Railroad Administration Page ‐ 14
Figure 4.3-2 Length of Garlock Fault Approaches
Bear Trap Canyon (which is within the Study area) is the only location which might present a feasible alternative to Tejon Pass to cross the Garlock fault at grade, other than the Tehachapi Pass which the Antelope Valley alignments currently follow. For the other alternatives, the crest elevations are higher and the approach slopes are steeper and more rugged. This results in challenging approaches that would require winding circuitous routes to flatten the grade and/or extensive structures and tunnels. In addition, there are sensitive habitats throughout the area. The Tejon Pass presents the only opportunity to follow an existing transportation corridor other than the Tehachapi Pass used by the Antelope Valley alignments. The conclusion is that Tejon Pass is most feasible location to cross the Garlock fault at grade as other locations would result in higher costs, slower travel times and greater sensitive habitat issues, and will therefore be the only location considered in the Study.
4.4 Other Constraints
4.4.1 Existing Land Use
Both the I-5 and Antelope Valley corridors would cross irrigated agricultural land in the Central Valley. To minimize impacts, the alignment should follow field boundaries where possible.
There are many oil wells in this part of the Central Valley. There are also some large commercial developments near the I-5 / SR 99 interchange; Tejon Ranch Commerce Center, previously known as Tejon Industrial Complex. These should be avoided where possible.

CALIFORNIA HIGH-SPEED TRAIN PROJECT CONCEPTUAL I-5 CORRIDOR STUDY BAKERSFIELD TO SAN FERNANDO VALLEY (SYLMAR)
JANUARY 2012, REV 0
U.S. Department of Transportation Federal Railroad Administration Page ‐ 15
Both the I-5 and Antelope Valley corridors would need to cross Tejon Ranch. This 270,000 acre property includes the northern side of the Tehachapi Mountains all the way from west of I-5 to east of SR 58.
The communities of Lebec and Gorman are close to I-5 near the top of the pass. The California Aqueduct runs parallel to I-5 from the SR 138 junction to Pyramid Lake and then crosses I-5 to terminate at Castaic Lake.
From Castaic south, the I-5 corridor runs predominantly through urban development including the City of Santa Clarita.
4.4.2 Proposed developments
There are a number of environmentally-cleared proposed developments in the I-5 corridor that could be impacted by an alignment. Three significant developments are illustrated on Figure 4.4-1, which also shows existing land uses:
Tejon Mountain Village was approved by Kern County in October 2009 and is a 20,000 acre mixed-use development that is planned to have approximately 3,500 homes, a 160,000 square foot commercial center beside I-5, and a resort with golf courses and other leisure facilities. As a condition of approval the project includes the conservation of the vast majority of Tejon Ranch; preserving 90% of the 270,000 acres of the ranch and the establishment of the Tejon Ranch Conservancy.
Tejon Ranch Commerce Center (already partially developed and previously known as Tejon Industrial Complex) is planned to be expanded into a 1,450 acre commercial, retail and distribution center development at the intersection of I-5 and SR 99.
Newhall Ranch is being developed in phases with the most recent phase approved by Los Angeles County in October 2011. This phase includes a proposed 20,000 home community west of Santa Clarita.
These projects have been in the planning and development phases for many years and their recent approval represents a significant investment by stakeholders.

CALIFORNIA HIGH-SPEED TRAIN PROJECT CONCEPTUAL I-5 CORRIDOR STUDY BAKERSFIELD TO SAN FERNANDO VALLEY (SYLMAR)
JANUARY 2012, REV 0
U.S. Department of Transportation Federal Railroad Administration Page ‐ 16
Figure 4.4-1 Existing Land Use and Major Proposed Developments

CALIFORNIA HIGH-SPEED TRAIN PROJECT CONCEPTUAL I-5 CORRIDOR STUDY BAKERSFIELD TO SAN FERNANDO VALLEY (SYLMAR)
JANUARY 2012, REV 0
U.S. Department of Transportation Federal Railroad Administration Page ‐ 17
5.0 ALIGNMENT DEVELOPMENT 5.1 Methodology
Possible alignments between Bakersfield and Sylmar, along the I-5 corridor, were investigated using a range of approaches that considered the topography, land use, and existing transportation corridors. Extensive use was made of the Quantm computer software package, which is a route optimization program. The program incorporates the topography for an entire region and then determines various potential alignments based on engineering criteria and land use constraints. During the Study, Quantm’s route alignment optimization algorithms provided the capability to analyze a vast range of alignment options in a relatively short period of time.
In addition to actual topography and alignment engineering parameters, a number of additional constraints were defined in Quantm to influence the alignments selected. Quantm first tries to satisfy all constraints and then, if not possible, will present potential solutions where different subsets of constraints are satisfied so that a variety of solutions are considered.
5.1.1 Constraints
The following constraints on alignments were applied to the Quantm program:
Mandatory Constraints
Gradient – a gradient of 3.5% is the maximum tolerable (exceptional) gradient for the high speed train
Fault Hazard Zones associated with major active faults must be crossed at or close to at-grade; in particular:
Garlock fault – between Lebec and Tehachapi Pass
San Andreas fault – between Frazier Park, the SR 138 interchange, and Palmdale
Viaducts – the maximum height of a viaduct should be 150 feet
Lakes and reservoirs – alignments requiring piers in lakes or reservoirs should be avoided
Honor Rancho Natural Gas Storage Facility – not to be crossed in tunnel
Supplemental Constraints
Gradients – gradients should be kept to a minimum and below an average of 2.5% over any 10 mile length where possible
Design speed – the alignment should be designed for a speed of 250 mph where possible. An initial maximum operating speed of 220 mph is anticipated. Slower speeds can be considered at specific locations, particularly where steep gradients will limit train speed. The design speed sets the allowable degree of curvature (i.e., sharpness) on the alignment.
Fault crossings – all Fault Hazard Zones associated with faults capable of surface rupture should be crossed at or close to grade
Tunnels – the length of a tunnel should be limited to 6 miles where possible
Viaducts – the height of a viaduct should be limited to 100 feet where possible
Freeways – freeways are to be left at their current line and level and crossed in tunnel or on viaduct where possible

CALIFORNIA HIGH-SPEED TRAIN PROJECT CONCEPTUAL I-5 CORRIDOR STUDY BAKERSFIELD TO SAN FERNANDO VALLEY (SYLMAR)
JANUARY 2012, REV 0
U.S. Department of Transportation Federal Railroad Administration Page ‐ 18
State Parks and Recreation Areas – to be avoided where possible
National Forest and Wildlands Conservancy lands – to be avoided where possible
Proposed Developments – to be avoided where possible
Existing residences and businesses – to be avoided where possible
Construction Cost – construction costs and the cost of environmental impacts, including displacement of residences and of businesses, and diversion of major utilities, should be minimized to the extent possible
The study team used the Quantm program to evaluate thousands of potential alignments. These runs were then refined to optimize potential outcomes. Figure 5.1-1 indicates a plot of early runs, not all of which proved feasible under closer examination, overlaid on the Tehachapi Mountains topography and fault hazard zones including the San Andreas and Garlock faults. The various valleys and mountains are also shown indicating topographical drivers for the alignments eventually determined potentially feasible.
CALIFORNIA HIGH-SPEED TRAIN PROJECT CONCEPTUAL I-5 CORRIDOR STUDY BAKERSFIELD TO SAN FERNANDO VALLEY (SYLMAR)
JANUARY 2012, REV 0
U.S. Department of Transportation Federal Railroad Administration Page ‐ 19
Figure 5.1-1 Quantm – Preliminary Early Runs

CALIFORNIA HIGH-SPEED TRAIN PROJECT CONCEPTUAL I-5 CORRIDOR STUDY BAKERSFIELD TO SAN FERNANDO VALLEY (SYLMAR)
JANUARY 2012, REV 0
U.S. Department of Transportation Federal Railroad Administration Page ‐ 20
5.2 Alignment Development
All the solutions from the initial Quantm runs, using a 250 mph design speed and a sustained 2.5% gradient, either failed to cross the critical faults at-grade or required viaducts of more than 200 feet in height.
The design speed and sustained gradient criteria were then progressively relaxed until Quantm was able to find some solutions that satisfied all the mandatory constraints. A slow speed zone was introduced near Tejon Pass (where the steep gradients of 3.5% on both sides of the pass will limit the speed that the HST can achieve). A number of runs, using different permutations of the supplemental constraints and intermediate start and end points, were performed to generate a variety of solutions. After each run, the results given by Quantm were examined and those which could clearly not be adjusted to satisfy the mandatory constraints were discarded. Following this assessment of the Quantm runs, all potentially feasible alignments were found to pass through a common point in Castaic. Therefore, the northern and southern subsections could conveniently be considered as independent subsections. Each of these alignments was then investigated by alignment engineers to see if a satisfactory alignment could be developed and thus determine which should be eliminated if not satisfying the mandatory constraints. In addition, the alignments were reviewed to determine whether adjustments could be made to satisfy as many of the supplemental constraints as possible. These adjustments were mainly changes to the profile, but also included some horizontal changes, for example to move the alignment closer to I-5. After these adjustments the resultant alignments were considered potentially feasible in engineering terms.
5.2.1 Bakersfield to Castaic Subsection
In this subsection, almost all of the runs which conformed to the mandatory constraints crossed the San Andreas and Garlock faults such that the resulting alignment passed between I-5 and Castac Lake, near the core of the proposed Tejon Mountain Village development. Even when this area was marked in Quantm to be avoided as a high priority, nearly all the otherwise feasible solutions presented by Quantm passed through this area. An intermediate start point in Lebec was introduced to derive alignments that did not pass between I-5 and Castac Lake, and this resulted in some additional potentially feasible alignments.
5.2.2 Castaic to Sylmar Subsection
Since Quantm is best suited to analyze topographic constraints, the less mountainous terrain and many land use constraints on the alignment through the City of Santa Clarita were not as well suited as the northern subsection for the use of Quantm. Quantm-generated alignments had to be adjusted horizontally and vertically by alignment engineers to minimize impacts and provide possible station locations.
5.3 Results of the Alignment Study
5.3.1 Bakersfield to Castaic Subsection
A number of alignments were identified that avoided crossing designated wilderness and long sections of designated roadless areas at all, and crossed Wind Wolves Preserve and Hungry Valley State Vehicle Recreation Area predominantly in tunnel. Since the Los Padres National Forest and the Angeles National Forest occupy all the land within the study area between Castaic Lake and Hungry Valley State Vehicle Recreation Area, all feasible alignments cross forest land. Portions of these alignments are above ground, but have been kept as close to the existing I-5 as possible.
CALIFORNIA HIGH-SPEED TRAIN PROJECT CONCEPTUAL I-5 CORRIDOR STUDY BAKERSFIELD TO SAN FERNANDO VALLEY (SYLMAR)
JANUARY 2012, REV 0
U.S. Department of Transportation Federal Railroad Administration Page ‐ 21
All the potentially feasible alignments derived from Quantm runs have some impact on the proposed Tejon Mountain Village development. The least expensive and fastest alignment has the greatest impacts on the proposed development. It also has a lower proportion of track in tunnel than other alignments, and therefore a higher potential for environmental impacts. The constraints on the at-grade crossing of the San Andreas and Garlock faults mean that there are few alternative alignments that have less impact on the proposed Tejon Mountain Village and such alignments are considerably more expensive and slower. By combining two alignments derived from the Quantm process and accepting a further speed reduction to 120 mph in the Tejon Pass area, it was possible to develop an alignment which did not impact the Tejon Mountain Village by staying west of I-5 through the community of Lebec. This alignment had a similar cost to the other higher cost alignments.
5.3.2 Castaic to Sylmar Subsection
Several potentially feasible alignments were found through Santa Clarita, generally staying close to either I-5 or Metrolink, where they run north-south through the city. Further refinement of this portion of the alignment would be more dependent on land use and local planning decisions than on engineering criteria. This area is rapidly developing and several further development permits have been issued to the Newhall Land and Farming Company for parts of the Newhall Ranch Community Development Project, since this Study was commenced. There is significant potential for additional constraints to be identified through additional community involvement through Santa Clarita. There is therefore a risk that no feasible alignment can be found. There is also therefore a risk that the cost of an alignment through Santa Clarita would increase as a result of outreach as has happened elsewhere as the project level EIR/EIS alignments have progressed from the program level alignments.
5.3.3 Station Options
Several possible stations locations in Santa Clarita could be considered. Any of these stations would be within the main urban area of the city and act as a focus for redevelopment.
An east station near the Newhall Metrolink station or a north station near the Santa Clara River would be possible with the alignment running close to Metrolink through Newhall. A west station, close to I-5, would have good freeway connectivity but additional measures would be needed to make a connection to Metrolink. All of these potential station locations are in areas that are currently densely developed and would have significant local and community impacts. These locations are illustrated in figures 5.4.1 and 5.4.2.
Because of the steep gradients crossing the mountains, it would be difficult to introduce a station anywhere else between Santa Clarita and the Central Valley. No other such stations have been investigated.
5.4 Potentially Feasible Alignments
Potentially feasible alignments between Bakersfield and Castaic have been identified in this Study and are illustrated on Figures 5.4-1 and 5.4-2. They are shown as broad bands to reflect the early conceptual stage of alignment development in the I-5 corridor. Between Castaic and Sylmar, even greater uncertainty exists about how alignments could be threaded through the dense urban area of Santa Clarita. Alignments in this area would be highly dependent on feedback received in a scoping process, if the I-5 corridor is advanced for further consideration. Figure 5.4-1 shows the alignment bands in relation to the fault zones, while Figure 5.4-2 shows them in relation to National Forest, parks and conservation areas.

CALIFORNIA HIGH-SPEED TRAIN PROJECT CONCEPTUAL I-5 CORRIDOR STUDY BAKERSFIELD TO SAN FERNANDO VALLEY (SYLMAR)
JANUARY 2012, REV 0
U.S. Department of Transportation Federal Railroad Administration Page ‐ 22
Figure 5.4-1 Potentially Feasible Alignments with Fault Hazard Zones

CALIFORNIA HIGH-SPEED TRAIN PROJECT CONCEPTUAL I-5 CORRIDOR STUDY BAKERSFIELD TO SAN FERNANDO VALLEY (SYLMAR)
JANUARY 2012, REV 0
U.S. Department of Transportation Federal Railroad Administration Page ‐ 23
Figure 5.4-2 Potentially Feasible Alignments with Parks and Conservation Areas

CALIFORNIA HIGH-SPEED TRAIN PROJECT CONCEPTUAL I-5 CORRIDOR STUDY BAKERSFIELD TO SAN FERNANDO VALLEY (SYLMAR)
JANUARY 2012, REV 0
U.S. Department of Transportation Federal Railroad Administration Page ‐ 24
5.5 Outreach on Alignments
Stakeholders directly affected by conceptual alignments following the I-5 were asked for input and comment.
U.S. Forest Service published Land Management Plans show that the national forest land immediately adjacent to I-5 is classed as ‘Developed Area Interface’. Discussions with the U.S. Forest Service have indicated that limited suitable development may occur if it does not conflict with national forest planned land uses. Wildlands Conservancy is content that the conceptual I-5 alignments are in tunnel where they cross Wind Wolves Preserve and avoid impacts to the mouth of Tecuya Creek.
The City of Santa Clarita has concerns that the potential impacts of an I-5 alignment on the city would be much greater than the impacts from an alignment via Palmdale. They recognize the opportunity that the I-5 alignment gives to a possible station location in Santa Clarita and the benefits this would bring. They did not feel it was appropriate to comment on specific alignments through the city at this time.
Tejon Ranch Company would prefer that the alignments not cross its property. It is especially concerned with potential impacts to the proposed Tejon Mountain Village. It objects most strongly to the direct alignment west of Castac Lake and to the Bear Trap Canyon alignment east of Castac Lake. It sees both of these routes as severing the proposed development and it has suggested that adopting either of these routes could make the Tejon Mountain Village development non-viable voiding the agreements to establish the conservation areas as well.
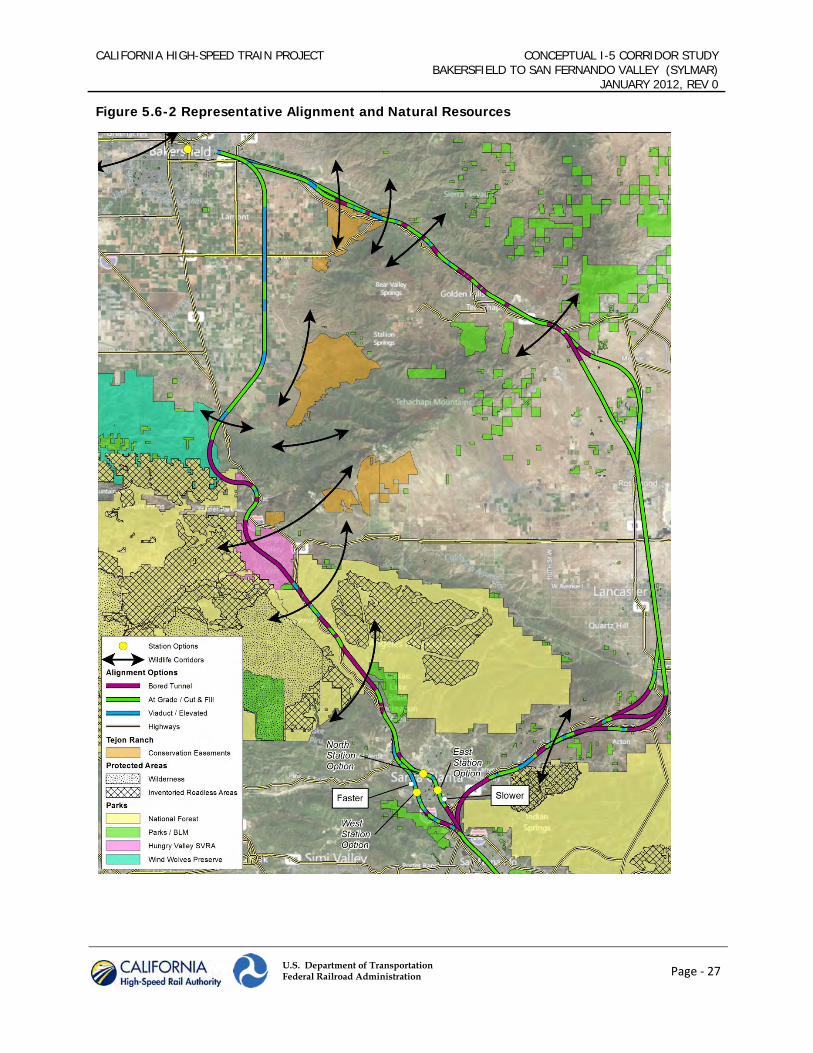
5.6 Selection of Representative Alignments for Comparative Analysis
To compare the conceptual I-5 alignments with the Antelope Valley alignments already developed through the Alternatives Analysis process, it is necessary to select a representative potentially feasible alignment within the I-5 corridor, considering constraints within the corridor, the potential for impact and ability to clear the environmental process and obtain permits. It is important to note that the chosen alignment has not been selected through a project-level scoping and Alternatives Analysis process, and was selected for a comparative analysis to assess the continued validity of the conclusions in the 2005 Program EIR/EIS supporting the selection of the Antelope Valley corridor.
For the Bakersfield to Castaic subsection, there is stakeholder concern that even with significant mitigation an I-5 alignment through the Tejon Mountain Village would render the development non-viable. Figure 5.6-1 shows two representative alignments in the Tejon Pass area, existing land uses and land uses proposed in the Tejon Mountain Village EIR. One representative alignment remains to the west of the I-5 and avoids any direct impact on Tejon Mountain Village, and the other to the east of the I-5 which would have significant direct impacts on the Tejon Mountain Village. All potentially feasible alignments identified which are to the east of the I-5 in this area have a similar magnitude of direct impact to Tejon Mountain Village. There is therefore a significant cost and schedule risk to any alignment that crosses the development. Because of the constraints imposed by crossing the Garlock and San Andreas faults at-grade, it is not possible to adjust this alternative without incurring significant cost and journey time penalties. Of all of the potentially feasible alignments identified in the Study, only one avoids any direct impact on the Tejon Mountain Village. This alignment will therefore be identified as the representative alignment to compare with the Antelope Valley alignments. This ensures that the comparison is most conservative and defensible in its consideration of project risks. Although the identified representative alignment remains west of I-5 over Tejon Pass with no direct effect on Tejon Mountain Village, it would have a considerable impact on the community of Lebec.
For the Castaic to Sylmar subsection, two representative potentially feasible alignments were identified. Costs for these two alignments are similar. One alignment runs south beside I-5 before turning east in

CALIFORNIA HIGH-SPEED TRAIN PROJECT CONCEPTUAL I-5 CORRIDOR STUDY BAKERSFIELD TO SAN FERNANDO VALLEY (SYLMAR)
JANUARY 2012, REV 0
U.S. Department of Transportation Federal Railroad Administration Page ‐ 25
Santa Clarita near the Santa Clara River to then parallel Metrolink through Newhall. This alignment requires a slow speed (120mph) to reduce displacements to homes and businesses. The other alignment runs parallel to the I-5 throughout Santa Clarita and has a 200mph design speed.
The northern subsection alignment can be combined with either of the southern subsection alignments. The alignments used for this assessment are illustrated on Figure 5.6-2 with environmental constraints and on Figure 5.6-3 with land uses. A detail of the Santa Clarita Area is shown on Figure 5.6-4.

CALIFORNIA HIGH-SPEED TRAIN PROJECT CONCEPTUAL I-5 CORRIDOR STUDY BAKERSFIELD TO SAN FERNANDO VALLEY (SYLMAR)
JANUARY 2012, REV 0
U.S. Department of Transportation Federal Railroad Administration Page ‐ 26
Figure 5.6-1 Representative Alignments in the Tejon Pass Area
CALIFORNIA HIGH-SPEED TRAIN PROJECT CONCEPTUAL I-5 CORRIDOR STUDY BAKERSFIELD TO SAN FERNANDO VALLEY (SYLMAR)
JANUARY 2012, REV 0
U.S. Department of Transportation Federal Railroad Administration Page ‐ 27
Figure 5.6-2 Representative Alignment and Natural Resources

CALIFORNIA HIGH-SPEED TRAIN PROJECT CONCEPTUAL I-5 CORRIDOR STUDY BAKERSFIELD TO SAN FERNANDO VALLEY (SYLMAR)
JANUARY 2012, REV 0
U.S. Department of Transportation Federal Railroad Administration Page ‐ 28
Figure 5.6-3 Representative Alignment and Land Use

CALIFORNIA HIGH-SPEED TRAIN PROJECT CONCEPTUAL I-5 CORRIDOR STUDY BAKERSFIELD TO SAN FERNANDO VALLEY (SYLMAR)
JANUARY 2012, REV 0
U.S. Department of Transportation Federal Railroad Administration Page ‐ 29
Figure 5.6-4 Detail of Representative Alignments in Santa Clarita Area

CALIFORNIA HIGH-SPEED TRAIN PROJECT CONCEPTUAL I-5 CORRIDOR STUDY BAKERSFIELD TO SAN FERNANDO VALLEY (SYLMAR)
JANUARY 2012, REV 0
U.S. Department of Transportation Federal Railroad Administration Page ‐ 30
6.0 RESULTS OF ALIGNMENT ASSESSMENT 6.1 Engineering Feasibility
This Study found several potentially feasible alignments between Bakersfield and Sylmar generally following the I-5 corridor. The alignment from Bakersfield to Castaic shown on Figure 5.6-2 and Figure 5.6-3 was identified as the most viable I-5 alignment considering the numerous constraints along the corridor and the likelihood of being approved and permitted. As noted earlier this alignment has not been selected through a project level scoping and Alternatives Analysis process, however, it represents a potentially feasible and reasonable alignment for the comparison with the Antelope Valley alternatives. Two alignments through Santa Clarita (between Castaic and Sylmar) are retained for comparison with the Antelope Valley alternatives.
6.2 Travel Time Analysis
Travel time was assessed, taking account of alignment geometry and train performance, for non-stop trains both northbound and southbound. The effect of stopping a northbound train at a Santa Clarita station shortly before the long climb to Tejon Pass was also assessed. The steep gradients reduce the speed by the top of Tejon Pass to 160 mph northbound and 120 mph southbound.
The station stop in Santa Clarita is far enough from the start of the steep climb up to Tejon Pass for a stopped northbound train at the station to accelerate to more than 100 mph before it starts to climb. If this had not been possible, then a stopping train might have delayed a following non-stop service.
Non-stop travel times between Bakersfield and Sylmar are given in table 6.2-1.
Table 6.2-1 Travel Times for Representative Alignments
Travel time for a non-stop train
Bakersfield to Castaic
Castaic to Sylmar
Faster Slower
Southbound travel time 26:09 5:57 7:16
Northbound travel time 25:00 5:50 7:11
6.3 Comparative Capital Costs and Risk Analysis
Detailed quantities including, for example, a breakdown of heights of viaducts and embankments and depths of cuts, were derived from the selected alignments. These quantities allowed the cost estimate to be made at the same level of detail as was used for preparing cost estimates for the Palmdale to Los Angeles section. To be consistent with the Draft 2012 Business Plan, the cost estimate is done from the Bakersfield station to Sylmar. Two alignments are considered for the Antelope Valley, one combining all the highest cost subsections and one combining all the lowest cost subsections. Right-of-way allowance in the cost comparison is based on current land uses, to be consistent with the allowances made in the Antelope Valley alignment estimates. The change in the comparison that would result from future changes to land use has been considered in the risk analysis.
The range of estimated costs for the section between Bakersfield Station and Sylmar are illustrated on Table 6.3-1. Key quantities are also given in Table 6.3-1. A description of cost-estimating methodologies and assumptions used to develop capital cost estimates along with a full breakdown of the cost comparison is included in Appendix A.

CALIFORNIA HIGH-SPEED TRAIN PROJECT CONCEPTUAL I-5 CORRIDOR STUDY BAKERSFIELD TO SAN FERNANDO VALLEY (SYLMAR)
JANUARY 2012, REV 0
U.S. Department of Transportation Federal Railroad Administration Page ‐ 31
Table 6.3-1 Key Quantities and Costs for Bakersfield to Sylmar
Antelope Valley ** I-5 Alignment***
Low Cost High Cost
Total length (miles) 116.7 119.0 93.4
Number of tunnels 16 19 16
Longest tunnel (miles) 7.1 7.1 8.7
Tunnel length (miles) 29.4 29.3 31.4
Total viaduct length (miles) 24.9 24.7 23.6
High viaduct (>90') (miles) 7.5 9.7 1.1
Medium viaduct (60'‐80') (miles) 5.4 4.1 7.2
Low viaduct (20'‐50') (miles) 12.0 11.0 15.3
Base Cost Estimate ($ billions)* 15.0 15.5 13.5 * Costs include right-of-way based on current land use, allocated and unallocated contingencies, and soft costs. ** The Antelope Valley cost estimates are taken from the 2012 Draft Business Plan. *** The I-5 cost estimates are based on conceptual engineering for the most viable alignment following estimating methodologies used in the 2012 Draft Business Plan. Final quantities depend on more detailed engineering to the 15% level, which was not performed for this Study.
Because the engineering for the I-5 alignment is at 5% design level (i.e. less developed than the Bakersfield to Sylmar alignments), risk analysis was performed to account for potential increases in cost resulting from further design development and community and stakeholder input. A risk assessment approach was used that is modeled on the Federal Transit Administration’s (FTA) risk assessment process, but differs since it does not offer a way to distinguish between 5% and 15% design levels. A risk workshop identified necessary adjustments to the base cost estimate for the I-5 alignment, and contingencies were then adjusted to reflect relatively higher or lower risk for given cost categories compared to the Antelope Valley corridor. This process is summarized in the Figure 6.3-1 below. Details of the methodology and adjustments made are explained in Appendix B.

CALIFORNIA HIGH-SPEED TRAIN PROJECT CONCEPTUAL I-5 CORRIDOR STUDY BAKERSFIELD TO SAN FERNANDO VALLEY (SYLMAR)
JANUARY 2012, REV 0
U.S. Department of Transportation Federal Railroad Administration Page ‐ 32
Figure 6.3-1 Evolution from Base Cost Estimate to Risk Adjusted Cost Estimate
Table 6.3-2 Risk Adjusted Costs
Cost Estimate Type I-5 Alignment
Base Cost Estimate (BCE) $13.5B
Risk Adjusted Cost Estimate
$15.1B
The risk adjusted cost for the I-5 alignment accounts for the potential increase in costs of construction methods in Santa Clarita based on future community involvement. For example, wherever the representative alignment is elevated above existing ground levels in developed areas, the risk adjusted cost estimate assumes a viaduct will be required, rather than an embankment.
7.0 COMPARISON OF CORRIDORS 7.1 Comparison Process
As discussed above, the purpose of this Study is to evaluate whether the basis for the Tier 1 selection of the Antelope Valley corridor remains sound in light of the refined project definition that has been developed as part of the second tier environmental process and changes that have occurred over time. This section compares the information about the conceptual I-5 alignments described above, along with information about the Antelope Valley alignments developed in the Project EIR/EIS process and the original 2005 Program EIR/EIS comparisons. The slower alignment though Santa Clarita, which offers the opportunity for direct connection to Metrolink in Newhall, will be used in the environmental comparison with the range of Antelope Valley alternatives. Both alternatives through Santa Clarita will be used to evaluate the range of travel time savings.
• Consistent with Draft 2012 Business Plan estimating methodologies
• Based on assumed contingency
• Does not account for varying levels in design development below 15% design level
Base Cost Estimate (BCE)
• Remove Allocated/Unallocated Contingency
• Adjustments to relfect design criteria variances, scope discrepancies, anticipated construction means and methods
Stripped and Adjusted Base Cost Estimate
(SABCE) • Review potential uncertainty for each cost category
• Reflect assessed uncertainty in varyng contingency levels
• Reflect level of engineering in contingency levels
Risk Assessment
• Calculate Risk Adjusted Allocated Contingencies
• Add Unallocated Contingencies
• Combine with SABCE to arrive with Risk Adjusted Cost Estimate
Risk Adjusted Cost Estimate (RACE)

CALIFORNIA HIGH-SPEED TRAIN PROJECT CONCEPTUAL I-5 CORRIDOR STUDY BAKERSFIELD TO SAN FERNANDO VALLEY (SYLMAR)
JANUARY 2012, REV 0
U.S. Department of Transportation Federal Railroad Administration Page ‐ 33
To conduct this evaluation, the I-5 corridor is compared to the Antelope Valley corridor using the same categories as used in section 6.4 of the 2005 Program EIR/EIS. Because the I-5 representative alignments are at a conceptual level of design, the information available is not as detailed or definitive as that used during the project EIR/EIS process. To make a like-for-like comparison, the statistics for the Antelope Valley alignments were derived using the same conceptual level methodology. The results of this Study are then compared with the information from section 6.4 of the 2005 Program EIR/EIS and the analysis in section 6A.4.1 of the 2005 Program EIR/EIS.
7.2 Derivation of Data for HST Design Objectives comparison
7.2.1 Travel Time
Travel times were calculated for the range of Antelope Valley alignments as shown in Table 7.2-1. The Antelope Valley northbound travel times are faster than the southbound because the climb from the San Fernando Valley to Tehachapi Pass is more gradual than the climb from the San Joaquin Valley. The difference in gradient means that train speed is not reduced to the same extent. The average of northbound and southbound travel times is used for the comparison.
Table 7.2-1 Bakersfield to Sylmar travel times
Travel time for a non-stop train (min:sec)
I-5 Grapevine
Antelope Valley
Faster Slower Faster Slower
Southbound 33:15 34:34 39:07 40:31
Northbound 32:06 33:20 35:17 36:21
Average 32:40 33:57 37:21 38:26
The I-5 alignment with the fastest travel time follows the I-5 through Santa Clarita at 200 mph. This gives a calculated average travel time saving of between 4 minutes 31 seconds and 5 minutes 45 seconds, compared with the range of Antelope Valley options. The 120 mph slower speed zone through Newhall reduces this time saving by 1 minute 16 seconds, giving a calculated average travel time saving of between 3 minutes 15 seconds and 4 minutes 29 seconds, compared with the range of Antelope Valley alignments.
7.2.2 Route Length
The I-5 alignment is between 23 and 25 miles shorter than the Antelope Valley alignments.
7.2.3 Ridership
A quantitative comparison of ridership was not carried out in the 2005 Program EIR/EIS. For the Study, the current California High Speed Train ridership and revenue model was used with three Phase 1 scenarios to investigate a station in Santa Clarita instead of Palmdale and different travel times south of Bakersfield into the Los Angeles Basin. All other variables were held constant in these runs. The only difference between the base scenario and the recent 2012 Draft Business Plan forecast is in the intra-SCAG local trips, which are 2 million higher than in previous runs, due to correction of an error discovered in the summary tabulation routine.
Two runs were made for the I-5 alternative:

CALIFORNIA HIGH-SPEED TRAIN PROJECT CONCEPTUAL I-5 CORRIDOR STUDY BAKERSFIELD TO SAN FERNANDO VALLEY (SYLMAR)
JANUARY 2012, REV 0
U.S. Department of Transportation Federal Railroad Administration Page ‐ 34
One to identify the combined effect of run time change and station relocation to Santa Clarita, using a savings of 5 minutes for travel between Bakersfield and San Fernando station
One with no run time difference, to identify the specific impact of moving the station to Santa Clarita as opposed to that of the run time difference
The riders and revenue estimates for the two alignments assuming a run time difference of 5 minutes are shown below in Table 7.2-2 for two major market segments:
longer inter-regional trips that cross regional boundaries such as between the southern California Basin, San Joaquin Valley counties, the Bay Area, or the Sacramento region
shorter local trips that are made entirely within the southern California Basin or the Bay Area
Inter-regional trips and revenue show no net significant change with the I-5 alignment. The time saving attracts about 600,000 more long trips, such as the Bay Area to LA and south, but the move of the station from Palmdale to Santa Clarita offsets that gain. Significant numbers of trips are lost to and from southern Kern County by travelers who use the Palmdale station instead of Bakersfield (and for whom Santa Clarita is not convenient), and from travelers to and from the Palmdale/Antelope Valley itself. The revenue increases because of a higher proportion of long trips. The revenue increase directly attributable to the 5 minute time saving is $50M per year, and this can be assumed to be proportional to the travel time saving and factored for different travel times.
Local trips within southern California decline 28% by moving the station to Santa Clarita from Palmdale. The HST service has less of a competitive time advantage for local trips, which are southerly-oriented and already well served by the San Fernando Valley station. Revenue declines slightly more because lost Palmdale trips are longer than the average trip in the region and have a higher-than-average fare.
Table 7.2-2 HST Phase 1 Ridership and Revenue Estimates with Five Minute Time Saving
Annual, year 2030 Antelope Valley with Palmdale
I‐5 with Santa Clarita Difference % change
Riders (millions)
Inter‐regional 28.6 28.5 ‐ 0.1 ‐ 0.3%
Local southern California
7.13 5.14 ‐ 1.99 ‐ 28%
Local Bay Area 3.3 3.3 ‐‐ ‐‐
TOTAL 39.0 37.0 ‐ 2.0 ‐ 5%
Revenue (billions, 2010$)
Inter‐regional $ 2.10 $ 2.12 + $ 0.02 + 1%
Local southern California
$ 0.19 $ 0.13 ‐ $ 0.06 ‐ 36%
Local Bay Area $ 0.06 $ 0.06 ‐‐ ‐‐
TOTAL $ 2.36 $ 2.31 ‐ $ 0.05 ‐ 2%
Assumes high HST fares, travel conditions of high end of business plan range, 5 minute savings for I‐5 alignment compared to Palmdale, and modeled markets only.

CALIFORNIA HIGH-SPEED TRAIN PROJECT CONCEPTUAL I-5 CORRIDOR STUDY BAKERSFIELD TO SAN FERNANDO VALLEY (SYLMAR)
JANUARY 2012, REV 0
U.S. Department of Transportation Federal Railroad Administration Page ‐ 35
7.2.4 Operations and Maintenance Costs
A quantitative comparison of operations and maintenance costs was not carried out in the 2005 Program EIR/EIS. The effect of the alignments on Operating & Maintenance (O&M) cost was estimated from the Parsons Brinckerhoff O&M cost model, with the primary variable being the shorter length of the I-5 alignments.
In the O&M cost model, the length of the alignment affects two cost categories: 1) train operations-related costs covering train crews, electric power, and trainset maintenance, and 2) infrastructure maintenance cost. I-5 alignments that are 25 miles shorter would reduce maintenance of infrastructure, with administration and contingency amounts added, by roughly $6.25 million per year. Savings in train operations labor, trainset maintenance, and energy consumption for 192 trains daily, again with administration and contingency amounts added, would be roughly $43.8 million. The total is an approximately $50 million saving.
7.2.5 Operating Cash Flow
Combining revenue increases and O&M savings gives a change to operating cash flow as shown in table 7.2-6. The range of travel time (3.25 to 5.75 minutes) and route length (23 to 25 miles) savings have been accounted for by factoring inter-regional revenue and O&M costs as described above.
Table 7.2-3 HST Phase 1 Operating Cash Flow
Antelope Valley via Palmdale
(2010 $ billions/year)
I-5 Cost Differential (2010 $ billions/year)
I-5 Cost Differential (Percentage)
Faster Slower Faster Slower
Revenue $2.36 ($0.04) ($0.07) ‐2% ‐3%
Operations & Maintenance
$1.10 ($0.05) ($0.05) ‐5% ‐4%
Operating Cash Flow $1.20 $0.01 ($0.02) 1% ‐2%
7.2.6 Capital Cost
The capital cost comparison is discussed in the previous section. The I-5 alignment risk adjusted capital cost estimate is $0.1B more expensive than the Antelope Valley low cost alternative and $0.4B less expensive that the Antelope Valley high cost alignment.
7.3 Antelope Valley and I-5 Alternatives Comparison Table 7.3-1 Options Comparison (Program EIR/EIS Section 6.4)
Alignment AV 2011 I-5 2011 Comparison with 2005
Length in miles 117 to 119 miles 92 to 94 miles More favorable to Antelope Valley than 2005

CALIFORNIA HIGH-SPEED TRAIN PROJECT CONCEPTUAL I-5 CORRIDOR STUDY BAKERSFIELD TO SAN FERNANDO VALLEY (SYLMAR)
JANUARY 2012, REV 0
U.S. Department of Transportation Federal Railroad Administration Page ‐ 36
Alignment AV 2011 I-5 2011 Comparison with 2005
Cost (dollars) $15.0B - $15.5B $15.1B More favorable to I-5 than 2005
Travel Time (min) 37 to 38 minutes 33 to 35 minutes More favorable to Antelope Valley than 2005
Ridership Higher inter-regional ridership; higher intra-regional ridership; higher overall revenue
Lower inter-regional ridership; lower intra-regional ridership; lower overall revenue
Similar
Constructability 29 miles of tunnel
Crosses San Gabriel fault in tunnel
Crosses San Andreas fault and Garlock fault separately
31 miles of tunnel
Runs parallel to San Gabriel fault
Crosses San Andreas fault and Garlock fault at convergence
More favorable to I-5 than 2005
Operational Issues Average speed
Length of sustained grade over 3%
Average speed
Length of sustained grade over 3%
Similar
Travel Conditions Palmdale station serving Antelope Valley
Faster express times between Northern and Southern California
Similar
Noise and Vibration
14,400 to 14,900 residential parcels within ½ mile of above ground alignment
12,700 to 13,000 residential parcels within ½ mile of above ground alignment
Similar
Land Use and Communities and Property
100 to 120 residential parcels within ½ mile of above ground alignment
137 residential parcels within ½ mile of above ground alignment
Similar
Farmlands: Acres of farmlands
375 to 584 acres (748 to 1003 acres including vacant land)
639 acres (689 acres including vacant land)
Similar
Aesthetics and Visual Resources
Not studied Not studied N/A

CALIFORNIA HIGH-SPEED TRAIN PROJECT CONCEPTUAL I-5 CORRIDOR STUDY BAKERSFIELD TO SAN FERNANDO VALLEY (SYLMAR)
JANUARY 2012, REV 0
U.S. Department of Transportation Federal Railroad Administration Page ‐ 37
Alignment AV 2011 I-5 2011 Comparison with 2005
Cultural Resources and Paleontological Resources
4 listed sites within 1,000 feet of the alignment
Paleontological not studied
3 listed sites within 1,000 feet of the alignment.
Paleontological not studied
Similar
Hydrology and Water Resources
Impact on Palmdale Lake and Una Lake
Large floodplain south of Bakersfield
More favorable to I-5 than 2005
Biological Resources, Including Wetlands
11 Threatened/Endangered Species with California Natural Diversity Database, California Native Plant Society database or US Fish and Wildlife Service database entries within 1,000 feet of the alignment
12 Threatened/Endangered Species with California Natural Diversity Database, California Native Plant Society database or US Fish and Wildlife Service database entries within 1,000 feet of the alignment.
Includes California Condor habitat
More favorable to Antelope Valley than 2005
Section 4(f) and 6(f) Resources
2 to 3 miles above ground in NF / park
Less than 1 mile in tunnel
4 miles above ground in NF / park
24 miles in tunnel
Similar
Growth Induced Impacts
Population growth in the Mojave Desert areas closest to Palmdale Station
Farmland conversion in Central Valley
Similar
Table 7.3-2 Other Comparisons
Alignment AV 2011 I-5 2011 Comparison with 2005
San Andreas fault crossing Garlock fault crossing White Wolf fault crossing
Santa Susana fault crossing
“At-grade” “At-grade” Similar
San Gabriel fault crossing
Tunnel with fault chamber “At-grade” More favorable to I-5 than 2005

CALIFORNIA HIGH-SPEED TRAIN PROJECT CONCEPTUAL I-5 CORRIDOR STUDY BAKERSFIELD TO SAN FERNANDO VALLEY (SYLMAR)
JANUARY 2012, REV 0
U.S. Department of Transportation Federal Railroad Administration Page ‐ 38
Alignment AV 2011 I-5 2011 Comparison with 2005
Distances travelled through areas with high predicted ground motions
Two miles at more than 90%g (peak ground acceleration)
14 miles at more than 80%g
21 miles at more than 70%g
Five miles at more than 90%g
23 miles at more than 80%g
36 miles at more than 70%g
Similar
Antelope Valley Connectivity
Palmdale Airport
DesertXpress (planned high speed train between Victorville and Las Vegas)
High Desert Corridor (planned freeway linking SR14 and I-15)
None More favorable to Antelope Valley than 2005
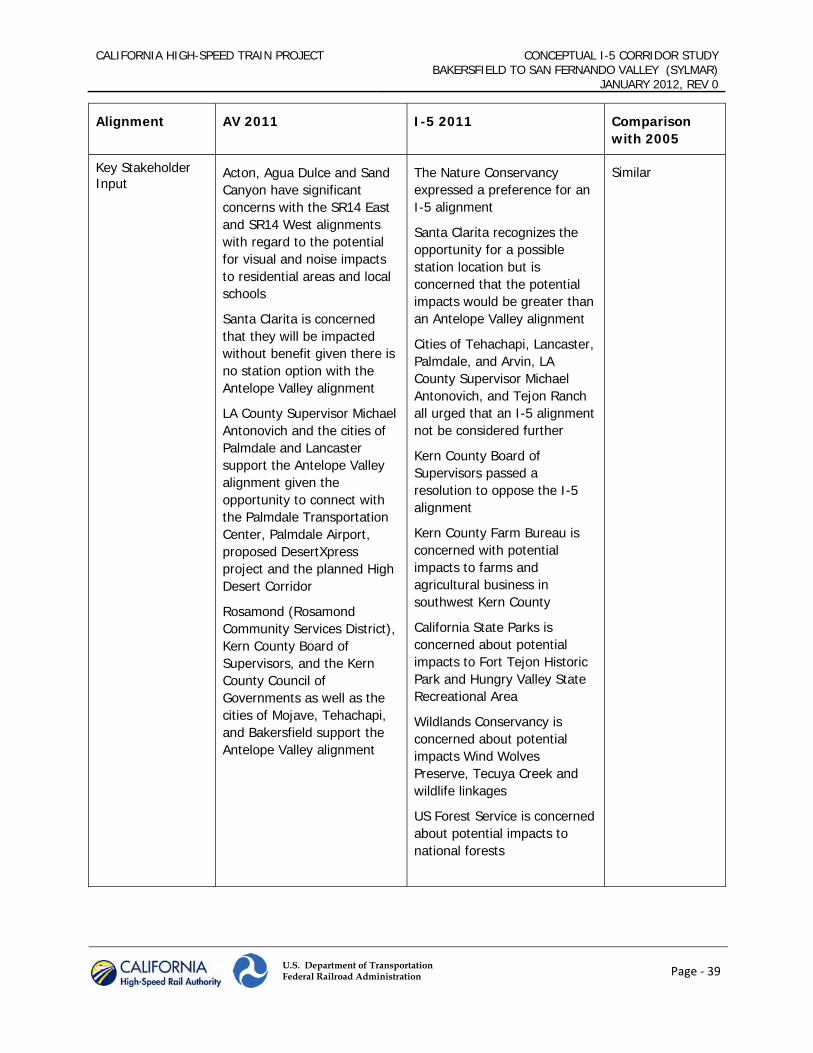
CALIFORNIA HIGH-SPEED TRAIN PROJECT CONCEPTUAL I-5 CORRIDOR STUDY BAKERSFIELD TO SAN FERNANDO VALLEY (SYLMAR)
JANUARY 2012, REV 0
U.S. Department of Transportation Federal Railroad Administration Page ‐ 39
Alignment AV 2011 I-5 2011 Comparison with 2005
Key Stakeholder Input
Acton, Agua Dulce and Sand Canyon have significant concerns with the SR14 East and SR14 West alignments with regard to the potential for visual and noise impacts to residential areas and local schools
Santa Clarita is concerned that they will be impacted without benefit given there is no station option with the Antelope Valley alignment
LA County Supervisor Michael Antonovich and the cities of Palmdale and Lancaster support the Antelope Valley alignment given the opportunity to connect with the Palmdale Transportation Center, Palmdale Airport, proposed DesertXpress project and the planned High Desert Corridor
Rosamond (Rosamond Community Services District), Kern County Board of Supervisors, and the Kern County Council of Governments as well as the cities of Mojave, Tehachapi, and Bakersfield support the Antelope Valley alignment
The Nature Conservancy expressed a preference for an I-5 alignment
Santa Clarita recognizes the opportunity for a possible station location but is concerned that the potential impacts would be greater than an Antelope Valley alignment
Cities of Tehachapi, Lancaster, Palmdale, and Arvin, LA County Supervisor Michael Antonovich, and Tejon Ranch all urged that an I-5 alignment not be considered further
Kern County Board of Supervisors passed a resolution to oppose the I-5 alignment
Kern County Farm Bureau is concerned with potential impacts to farms and agricultural business in southwest Kern County
California State Parks is concerned about potential impacts to Fort Tejon Historic Park and Hungry Valley State Recreational Area
Wildlands Conservancy is concerned about potential impacts Wind Wolves Preserve, Tecuya Creek and wildlife linkages
US Forest Service is concerned about potential impacts to national forests
Similar

CALIFORNIA HIGH-SPEED TRAIN PROJECT CONCEPTUAL I-5 CORRIDOR STUDY BAKERSFIELD TO SAN FERNANDO VALLEY (SYLMAR)
JANUARY 2012, REV 0
U.S. Department of Transportation Federal Railroad Administration Page ‐ 40
7.3.1 Antelope Valley and I-5 Alternatives Comparison (Program EIR/EIS section 6A.4.1)
The following points describe where the I-5 and Antelope Valley alignments are now comparatively better, worse or the same as they were in the 2005 Program EIR/EIS in terms of environmental impacts and meeting project objectives in terms of environmental impacts.
Cultural Resources – The 2005 Program EIR/EIS concluded that the Antelope Valley corridor would have greater potential impacts on cultural and paleontological resources. This has been confirmed in the current Study.
Biological Resources – The 2005 Program EIR/EIS concluded that the Antelope Valley corridor would have slightly more potential impacts on biological resources than the I-5 corridor. This analysis was updated by identifying species and habitat within 1,000 feet of the above-ground alignments during the Study and showed that the I-5 alignments impact slightly more species, including the California Condor. Current Antelope Valley alignments have less potential impacts on biological resources than at the program-level, due in part to the current SR 14 alignment avoiding the Santa Clara River in Soledad Canyon between Palmdale and Sylmar. The Antelope Valley alignments therefore now have less potential to impact biological resources than an I-5 alignment.
Wetlands and Water Bodies – The 2005 Program EIR/EIS concluded that the Antelope Valley corridor would have less potential for water-related impacts. Some of the current Antelope Valley alignments have an impact on Lake Palmdale and Una Lake and tunnel under the California Aqueduct. The Study I-5 alignments do not impact any lakes directly, but cross tributaries feeding Pyramid Lake and a large floodplain south of Bakersfield. The Study found the impacts from both I-5 and Antelope Valley alignments are now similar.
Growth Inducing Impacts – In the 2005 Program EIR/EIS, it was concluded that the I-5 corridor would likely indirectly induce population growth around the potential station in Bakersfield. Consequently, farmland conversion in the Central Valley would likely occur. While the Antelope Valley corridor would likely indirectly induce population growth in the Mohave Desert areas closest to the proposed Palmdale station, it would induce less growth than an I-5 alignment. The Study does not change these conclusions.
Parks and National Forests – In the 2005 Program EIR/EIS, the most significant difference in potential environmental impacts was in regard to impacts to major parklands and National Forest. The Antelope Valley corridor was not expected to go through major parks while the I-5 alignment potentially impacted five parks or national forests. The Study shows that the I-5 alignment has no above-ground impact on four of these, crossing under Hungry Valley State Vehicular Recreation Area and Fort Tejon State Historic Park in tunnel. It crosses Angeles and Los Padres National Forest for 14 miles, but is only above ground for four miles. It also passes in tunnel under Wind Wolves Preserve for four miles. The current Antelope Valley alignments cross up to three miles of Bureau of Land Management property and local parks of which less than a mile is in tunnel. Thus Antelope Valley option still has less impact than the I-5 alignment on National Forest and parklands, but the difference between the two alignments has been reduced.
Farmland – The 2005 Program EIR/EIS concluded that the Antelope Valley corridor would have less potential impacts on prime farmland, but greater impacts on grazing land. This has been confirmed in the current Study.
Opportunities For Using Alignment Variations To Avoid Sensitive Resources – The 2005 Program EIR/EIS concluded that the Antelope Valley corridor offered greater opportunities for high-speed

CALIFORNIA HIGH-SPEED TRAIN PROJECT CONCEPTUAL I-5 CORRIDOR STUDY BAKERSFIELD TO SAN FERNANDO VALLEY (SYLMAR)
JANUARY 2012, REV 0
U.S. Department of Transportation Federal Railroad Administration Page ‐ 41
train alignment variations, particularly through the mountainous areas of the corridor, to avoid impacts to environmental resources. In contrast, the more challenging terrain of the I-5 corridor greatly limits the ability to avoid sensitive resources and seismic constraints. This has been confirmed in the Study.
The I-5 and Antelope Valley alignments were also compared with respect to meeting Project objectives, and the Study re-evaluated factors relating to constructability and cost that were considered in the 2005 Program EIR/EIS.
Tunnel Length – In the 2005 Program EIR/EIS, the Antelope Valley corridor had 13 miles of tunnel while the I-5 corridor had 33 miles. After project-level preliminary engineering the Antelope Valley alignments now have 29 miles of tunnel and the conceptual engineering developed in the Study for the I-5 corridor has 31 miles. The length of tunnel is now comparable for both corridors.
Capital Cost – In the 2005 Program EIR/EIS, the cost for the I-5 corridor was estimated at $6.58B, while the cost of the Antelope Valley corridor was estimated at $6.46B. During preliminary engineering, the relative cost of the Antelope Valley alignments has increased in part to avoid and reduce impacts. The Draft 2012 Business Plan cost estimate for the Antelope Valley alignment (between Bakersfield and Sylmar) is between $15.0 billion and $15.5 billion. A risk adjusted capital cost estimate for the I-5 alignment allows for mitigation, avoidance and contingency amounts, and reflects the differing levels of design development between the I-5 and Antelope Valley corridors. The risk adjusted cost estimate is $15.1 billion. Like the 2005 Program EIR/EIS, the Study concludes that the cost of an I-5 alignment would be of a similar magnitude to the Antelope Valley alternatives.
Alignment Length and Travel Time – The 2005 Program EIR/EIS concluded an I-5 alignment would be 33 to 36 miles shorter in length and provide travel time savings of 10 to 12 minutes compared to an Antelope Valley alignment. The Antelope Valley alignments are now up to five miles shorter than envisaged at the Program stage while the Study I-5 alignments are now longer, diverging from the Antelope valley alignments east of Bakersfield. The Study finds that the I-5 alignment would now only be 23 to 25 miles shorter. The analysis of the current Antelope Valley alignments and the I-5 alignments shows that, because of this additional length, the longer steep gradients and the sharp curves needed in Santa Clarita and Tejon Pass, the travel time saving is on average likely to be only three to five minutes. This is substantially less than the anticipated length and travel time advantage in 2005 and confirms the decision to drop the I-5 corridor from further consideration.
Stations – The 2005 Program EIR/EIS considered a station in Santa Clarita, but rejected it in favor of a station in Sylmar. The Santa Clarita station location considered did not provide a direct connection to Metrolink. In addition, factors such as low population and potential future ridership, operational reasons related to terrain, right-of-way issues and cost and impacts to potential cultural resources on the Santa Clara River rejected the option of a station in Santa Clarita. The Study did identify one possible station location adjacent to Metrolink, one along the Santa Clara River and one along the I-5. All potential station locations identified in the Study are in developed areas with significant impacts and restricted right-of-way. City of Santa Clarita staff has expressed concerns about the impacts of the I-5 alignment on the city and have not indicated support for a station. Thus, the conclusions of the 2005 Program EIR/EIS are largely unchanged.
Seismic – The 2005 Program EIR/EIS concluded that the I-5 corridor would have considerably higher seismic issues than the Antelope Valley corridor. Project-level studies for the Antelope

CALIFORNIA HIGH-SPEED TRAIN PROJECT CONCEPTUAL I-5 CORRIDOR STUDY BAKERSFIELD TO SAN FERNANDO VALLEY (SYLMAR)
JANUARY 2012, REV 0
U.S. Department of Transportation Federal Railroad Administration Page ‐ 42
Valley have resulted in alignments that cross the San Gabriel fault (which has a low probability of rupture and a small predicted movement) in tunnel. However, the I-5 corridor remains more seismically active than the Antelope Valley corridor, paralleling the San Gabriel fault for 20 miles, and passing through the intersection of the Garlock and San Andreas faults. The most viable alignment is further from the San Gabriel fault than during the Program EIR/EIS so the hazards of following this fault are reduced. The topography of the Tehachapi Mountains restricts the feasible alignments to the Tejon Pass. This restriction results in all potentially feasible alignments crossing through the intersection of the San Andreas and Garlock faults. The Study has confirmed that the seismic risk for the I-5 alignment is still greater than for the Antelope Valley alignments.
Constructability – In the 2005 Program EIR/EIS, there were concerns about constructability of an I-5 alignment, particularly relating overall amount of tunneling and to the length of individual tunnels. With the increased amount of tunneling now found necessary on the Antelope Valley alignments, constructability for the I-5 corridor is now comparable with the Antelope Valley.
Connectivity into the Antelope Valley – By definition the Antelope Valley alignment will provide greater connectivity into the Antelope Valley. In the 2005 Program EIR/EIS it was noted that this was the fastest growing area in Los Angeles County, and that the high-speed train system would also provide connectivity to Palmdale Airport and Metrolink commuter rail service. While the economic recession has slowed growth, the Antelope Valley continues to be one of the fastest growing areas in Los Angeles County. Since 2005, additional factors that favor the Antelope Valley alignment include the proposed DesertXpress rail service between Victorville and Las Vegas, which recently received environmental approval and the planned High Desert Corridor that will significantly improve connectivity between Victorville and Palmdale. The Study confirms the greater connectivity potential of the Antelope Valley alignments.
7.3.2 Station Comparison (Program EIR/EIS Table 2-H-18b)
The 2005 Program EIR/EIS considered five station locations in Santa Clarita, and rejected all of them for reasons including intermodal connections, construction issues, capital cost, right of way issues/cost, land use compatibility and conflicts, visual quality impacts, floodplain impacts and wildlife refuge impacts. One of the station locations considered in that document (Magic Mountain Parkway/I5) is similar to one of the potential station locations identified as part of this Study in section 5.3.3 (the west station). None of the information presented in the 2005 Program EIR/EIS evaluation matrix for the Magic Mountain Parkway/I5 has changed, with intermodal connections, population/employment catchment (growth is geographically constrained in Santa Clarita due to the surrounding mountainous topography), right of way issues/cost and cultural resources impacts still constraints to providing a station in Santa Clarita.
Section 5.3.3 considers an east station, which would provide direct connection to the existing Santa Clarita Metrolink Station. This location was not considered in the 2005 Program EIR/EIS as it was not on an assessed route corridor. Compared to the Magic Mountain Parkway/I5 station location, intermodal connections are better to public transit (Metrolink) but less good to the freeway system (I-5). The east station is therefore no better in comparison to the Magic Mountain Parkway/I5 station than the west station. Section 5.3.3 considers a north station, which is also no better in comparison to the Magic Mountain Parkway/I5 station.
The City of Santa Clarita has not expressed a preference towards any station locations within the city.
The Study has largely confirmed the reasons the 2005 Program EIR/EIS rejected the Santa Clarita Station locations.

CALIFORNIA HIGH-SPEED TRAIN PROJECT CONCEPTUAL I-5 CORRIDOR STUDY BAKERSFIELD TO SAN FERNANDO VALLEY (SYLMAR)
JANUARY 2012, REV 0
U.S. Department of Transportation Federal Railroad Administration Page ‐ 43
7.4 Comparison Summary
Overall, most of the factors that led the Authority and FRA to select the Antelope Valley corridor in the 2005 Program EIR/EIS to be carried forward are not substantially changed. The Study confirms that the Antelope Valley alignments have fewer potential environmental impacts, enhanced by the selection of alignments more closely following SR 14 and avoiding the Santa Clara River. The advantage of the Antelope Valley alignments with regard to seismic risk is similar, but the advantage on the amount of tunneling and constructability issues are much reduced and the I-5 alternative could be somewhat less costly. The Antelope Valley alignments still offer greater connectivity and accessibility. The Antelope Valley alignments also have greater opportunities for alignment variations through the mountains to avoid impacts to environmental resources reducing risk, have less growth inducing impacts on urbanized land and farmland conversion, would provide service to the fastest growing area of Los Angeles County, and have strong stakeholder support. Taken together these findings reinforce the Authority and FRA decision of the 2005 Program EIR/EIS selecting the Antelope Valley alignment for further study.
8.0 CONCLUSIONS Most of the stakeholders consulted expressed a preference for the Antelope Valley alignment in order to meet the community needs of the residents in Palmdale and Lancaster. Local residents, businesses, elected officials and regional organizations have emphasized the importance of the High-Speed Rail system serving the Antelope Valley. There has been very little support for an I-5 alignment by stakeholders in the Antelope Valley, Santa Clarita, and Kern County.
Taken together, the information developed on the I-5 and Antelope Valley corridors in the 2005 Program EIR/EIS and the updated information on the I-5 corridor and the Antelope Valley alignments, confirm the Authority and FRA decision of the 2005 Program EIR/EIS selecting the Antelope Valley alignment for further study.

CALIFORNIA HIGH-SPEED TRAIN PROJECT CONCEPTUAL I-5 CORRIDOR STUDY BAKERSFIELD TO SAN FERNANDO VALLEY (SYLMAR)
JANUARY 2012, REV 0
U.S. Department of Transportation Federal Railroad Administration Appendix A ‐ 1
APPENDIX A - ESTIMATING METHODOLOGY AND DETAILED COST BUDGETS
Prepared by: Vladimir Kanevskiy 4 Jan 2012
Date
Checked by: Richard Smith 4 Jan 2012
Date
Reviewed by: Don Currie 4 Jan 2012
Date
Approved by: Mike Gillam 4 Jan 2012
Date

CALIFORNIA HIGH-SPEED TRAIN PROJECT CONCEPTUAL I-5 CORRIDOR STUDY BAKERSFIELD TO SAN FERNANDO VALLEY (SYLMAR)
JANUARY 2012, REV 0
U.S. Department of Transportation Federal Railroad Administration Appendix A ‐ 2
A1 Estimate Purpose
The capital cost estimates supporting the I-5 Conceptual Study (Study) have been developed to provide a cost comparison between Bakersfield to Sylmar alignment via Palmdale (Antelope Valley alternatives as currently defined by the Alternative Analysis studies) and Bakersfield to Sylmar via I-5 corridor as described in this Study memo. Note that this appendix describes how the base cost estimate was derived; adjustments following the risk workshop are described in Appendix B.
A2 Estimating Format
A consistent format is developed for the reporting, estimating, and managing of the project’s capital costs. Standard Cost Categories (SCC) established by the Federal Railroad Administration (FRA) as part of American Recovery and Reinvestment Act (ARRA) grant application requirements have also been adopted in development of I-5 capital cost estimates.
A3 Estimating Software
Commercially available database software systems were used depending on the type of work elements. For example, Timberline was used for surface heavy construction work elements and HCSS was used for underground work elements. However, in order to provide uniformity between numerous work elements and sections of the different corridors and to provide a consistent platform for reporting and analysis requirements, the cost data are exported to Microsoft Excel. This will better enable the review, edit consolidation and reporting of estimate components over the course and provide more flexibility to make adjustments.
A4 FRA Standard Cost Category (SCC)
The methodology used for generating capital cost estimates has been consistent with FRA guidelines for estimating capital costs. The heart of the FRA guidance is the SCC, which enables FRA-funded projects to develop budget baselines that summarize to the SCC. This cost structure is used for capital cost detail and summary sheets, and is described further below. Where the level of design does not support quantity measurements, parametric estimating techniques were utilized.
A5 Work Breakdown Structure (WBS)
This involves the development of the Work Breakdown Structure (WBS) that is applied to cost estimating and cost reporting. The WBS for estimating includes a coding system that is used for estimating elements. The WBS for reporting includes the development of a coding system that allows the cost estimates to be sorted and presented by categories and subcategories as prescribed by the FRA.
A6 Estimated Unit Costs
The development of construction unit costs for each of the construction activities that is identified and quantified from the design documents. The development of individual or composite estimated unit costs is accomplished through the use of historical bid data and by unit cost analysis, as appropriate, using labor, equipment and material rates. Unit costs are expressed in year 2010 dollars and are adjusted to reflect any regional variations.
These methods are used either individually or in combination. When limited engineering details are available, the historical bid price method is typically used.
CALIFORNIA HIGH-SPEED TRAIN PROJECT CONCEPTUAL I-5 CORRIDOR STUDY BAKERSFIELD TO SAN FERNANDO VALLEY (SYLMAR)
JANUARY 2012, REV 0
U.S. Department of Transportation Federal Railroad Administration Appendix A ‐ 3
A6.1 Historical Bid Price Method
Historical bid prices are typically used to develop costs for common construction elements. When using this method, the time of bid and conditions of the historical project used for pricing is taken into account and factors applied as needed:
Adjust bid prices where the bid date is older than 12 months from the current date by using an appropriate escalation factor
Adjust bid prices to reflect conditions of the project, such as type of terrain, geographical location, soil, traffic and other related factors. For location factor adjustments, the City Cost Index as published by RS Means is used.
Sources for historical bid prices that are used may come from local, regional, statewide and national levels, as well as from international high-speed rail projects with unique high-speed elements. Historical unit prices that are used for the California High-Speed Train Project (CHSTP) will be verified for appropriateness and documented as to their source as well as any adjustments for site, escalation or location factors.
A6.2 Unit Cost Analysis Method
The estimated unit cost analysis method is typically used to develop costs for complex construction elements including but not limited to viaducts, retained earth systems, tunneling and underground structures. This method allows for unit costs to be developed based on current local construction and market conditions, such as changes which might affect productivity or the cost of labor or materials. The following steps are required in order to develop a unit price using this method:
Analyze the proposed construction conditions Estimate production rates Compile a list of materials Obtain materials prices using local available sources Determine labor and equipment rates Calculate direct unit price using the above factors Add allowances for contractor overhead and profit to arrive at a in place unit price
o Markup allowance on labor 20% o Markup allowance on equipment 20% o Markup allowance on material 7% o Markup allowance on subcontract or composite unit cost 7% o Markup allowance for profit 8%
The following sources are used to obtain basic cost data that is input into the database estimating program in order to develop any needed construction unit prices:
Labor Rates – RS Means national wages adjusted by City Cost Index factor, Federal Davis-Bacon Wage Determination and/or California Department of Industrial Relations Prevailing Wage Determinations.
Equipment Rates – RS Means and/or Corp of Engineers Construction Equipment Ownership and Operating Expense Schedule, Region VII.
Material Prices - Material and supply prices for locally available material are obtained from local supplier quotes, if possible. Secondary sources of material cost data may be taken from RS Means, Engineering News-Report (ENR) or other published resource.

CALIFORNIA HIGH-SPEED TRAIN PROJECT CONCEPTUAL I-5 CORRIDOR STUDY BAKERSFIELD TO SAN FERNANDO VALLEY (SYLMAR)
JANUARY 2012, REV 0
U.S. Department of Transportation Federal Railroad Administration Appendix A ‐ 4
A list of prototypical work elements and the units of measure had been developed with corresponding estimated unit cost. When required, additional project-specific work elements reflecting unique site conditions and configurations were identified and their estimated costs were developed in addition to prototypical unit costs. Examples of these project-specific unit costs include very high and/or long span iconic bridge structures, grade separations, specific roadway improvements, unique utility relocations, staged construction to accommodate existing rail or vehicular traffic, or restrictive site access conditions in urban areas.
A7 Quantity Takeoffs
The quantity takeoffs were prepared by direct measurement and calculation of construction elements that are shown in design drawings, sketches, electronically calculated from CADD files as well as an allowance quantity based on professional experience and judgment. Measured quantities have been predominantly parametric rather than volumetric due to the preliminary nature of available drawings or sketches, and then applied on composite unit prices that account for cost of various prototypical guideway configurations on per mile basis.
A8 Allocated and Unallocated Contingencies
Contingency, in the statistical sense, is the estimated percentage by which a calculated value may differ from its true or final value and is typically included in an estimate as an allowance for the level of engineering design completion or to address imperfections in the estimating methods used at the various project development stages. Contingency is typically added to a particular item or group of items by the use of percentage multipliers. Contingency is generally greatest for the early stage of project development and decreases with advancement in the level of engineering design and pricing detail. During the preliminary design of the CHSTP, the limited level of design information that is available requires the use of contingency allowances that are allocated against specific construction or procurement cost categories. The percentage selected for a given cost category are generally based on level of definition of the scope of work involved and substantiated by professional judgment and experience relative to level of uncertainty and historical cost variability typically seen for work within a particular cost category. Contingency has been assigned into two major categories – allocated and unallocated.
Allocated contingency is added to each cost category based on an assessment of the quality of design information; means and methods; and site accessibility available for individual items of work. This contingency typically falls in a range of 10% to 25%. The exact percentage selected for each cost category is based on professional judgment and experience related to the cost variability typically seen for items of work within a particular cost category. The contingency is generally higher for underground elements reflecting the additional exposure for unknowns as well as the construction complexity. It is also higher for stations, terminals, storage yard facilities and utilities since their design progress is still in the conceptual level and identification of all the utilities are not determined.
The Base Cost Estimates for the Antelope Valley and I-5 alignments reflect allocated contingencies levels to match the estimates in the 2012 Draft Business Plan. The contingencies applied and changes to them to reflect differences in the level of design are considered in the risk analysis as described in Appendix B.
Unallocated contingency is typically included to address uncertainties that are more global in nature like schedule delays, changes in contracting environment, or other such issues that are not associated with individual construction activities. Unallocated contingencies are estimated at 5%of the total construction costs.
A9 Environmental Mitigation
CALIFORNIA HIGH-SPEED TRAIN PROJECT CONCEPTUAL I-5 CORRIDOR STUDY BAKERSFIELD TO SAN FERNANDO VALLEY (SYLMAR)
JANUARY 2012, REV 0
U.S. Department of Transportation Federal Railroad Administration Appendix A ‐ 5
An allowance to account for the cost of environmental mitigation that relates to hydrology and water resources; wetland impact; hazardous material and waste; historic/archaeology; safety and security; noise, vibration and air quality during construction and permanent aesthetic features is included in the total capital cost. This allowance is based on 3% of the total cost of track structures, track work, station buildings, roadway modification and highway grade separation.
A10 Right-of-Way Cost Estimate
This involves preparing estimated quantities of impacted properties, either permanent takes or temporary easements, which result from construction, operation, and maintenance of proposed high-speed train alignment alternatives. In order to arrive at the estimated cost, professional experience and judgment in the area of property valuation, business damages, and legal and administrative issues as they relate to the estimation of right-of-way costs are applied. In the base cost estimate, unit rates for different land uses have been applied for Bakersfield to Palmdale and for the I-5 alignments, while the Palmdale to Sylmar alignment quantities are based on a property analysis as described above.
A11 Vehicle Estimate
Vehicles costs are not included in these estimates.
A12 Program Implementation/Professional Services Add-ons
Program Implementation costs are included to represent the costs of engineering, project and construction management, contract administration, permits and fees, training/start-up/testing and any force account work. These add-on costs are calculated as a percentage of construction costs only (applied individually and not cumulatively and excluding vehicle procurement and right-of-way costs) and presented under Professional Services cost category in the estimate. The management and administration cost associated with right-of-way and rolling stock are included with the respective items.
Program Management 3.0% Final Design 6.0% Construction Management 4.0% Agency Costs 0.5% Total 13.5%
In addition, an allowance for system start-up and pre-revenue testing is added to the Professional Services cost category in the amount of 6% of the Train Controls, Communications and Electrification construction costs.
A13 Escalation
Estimates are prepared in Base Year dollars with the Base Year defined as 2010. No escalation to midpoint of construction was added to the capital cost estimate prepared.
A14 Finance Charge
Finance charges are not included.

10 Track Structure & Track10.01 Track structure: Viaduct10.02 Track structure: Major/Movable bridge10.03 Track structure: Undergrade Bridges10.04 Track structure: Culverts and drainage structures10.05 Track structure: Cut and Fill (> 4' height/depth)10.06 Track structure: At-grade (grading and subgrade stabilization)10.07 Track structure: Tunnel10.08 Track structure: Retaining walls and systems10.09 Track new construction: Conventional ballasted 10.10 Track new construction: Non-ballasted10.11 Track rehabilitation: Ballast and surfacing10.12 Track rehabilitation: Ditching and drainage10.13 Track rehabilitation: Component replacement (rail, ties, etc)10.14 Track: Special track work (switches, turnouts, insulated joints)10.15 Track: Major interlockings10.16 Track: Switch heaters (with power and control)10.17 Track: Vibration and noise dampening10.18 Other linear structures including fencing, sound walls
20 STATIONS, TERMINALS, INTERMODAL20.01 Station buildings: Intercity passenger rail only20.02 Station buildings: Joint use (commuter rail, intercity bus)20.03 Platforms20.04 Elevators, escalators20.05 Joint commercial development 20.06 Pedestrian / bike access and accommodation, landscaping, parking lots20.07 Automobile, bus, van accessways including roads20.08 Fare collection systems and equipment20.09 Station security
30 SUPPORT FACILITIES: YARDS, SHOPS, ADMIN. BLDGS30.01 Administration building: Office, sales, storage, revenue counting30.02 Light maintenance facility 30.03 Heavy maintenance facility30.04 Storage or maintenance-of-way building/bases30.05 Yard and yard track
40 SITEWORK, RIGHT OF WAY, LAND, EXISTING IMPROVEMENTS40.01 Demolition, clearing, site preparation40.02 Site utilities, utility relocation40.03 Hazardous material, contaminated soil removal/mitigation, ground water treatments40.04 Environmental mitigation: wetlands, historic/archeology, parks40.05 Site structures including retaining walls, sound walls40.06 Temporary facilities and other indirect costs during construction40.07 Purchase or lease of real estate 40.08 Highway/pedestrian overpass/grade separations40.09 Relocation of existing households and businesses
50 COMMUNICATIONS & SIGNALING50.01 Wayside signaling equipment50.02 Signal power access and distribution50.03 On-board signaling equipment50.04 Traffic control and dispatching systems50.05 Communications50.06 Grade crossing protection50.07 Hazard detectors: dragging equipment high water, slide, etc.50.08 Station train approach warning system
60 ELECTRIC TRACTION60.01 Traction power transmission: High voltage 60.02 Traction power supply: Substations 60.03 Traction power distribution: Catenary and third rail60.04 Traction power control
70 VEHICLES 70.00 Vehicle acquisition: Electric locomotive70.01 Vehicle acquisition: Non-electric locomotive70.02 Vehicle acquisition: Electric multiple unit70.03 Vehicle acquisition: Diesel multiple unit70.04 Veh acq: Loco-hauled passenger cars w/ ticketed space70.05 Veh acq: Loco-hauled passenger cars w/o ticketed space
Total for Category 60 ELECTRIC TRACTION
Total for Category 20 STATIONS, TERMINALS, INTERMODAL
Total for Category 30 SUPPORT FACILITIES: YARDS, SHOPS, ADMIN. BLDGS
Subtotal for Sitework, Land & Existing ImprovementsSubtotal for Right of Way
Total for Category 40 SITEWORK, RIGHT OF WAY, LAND, EXISTING IMPROVEMENTS
Total for Category 50 COMMUNICATIONS & SIGNALING
Total for Category 10 Track Structure & Track
Environmental Segment:
Detailed Capital Cost Budget
Total Allocated Cost (Base Yr FY10 Dollars )
Allocated Contingency (Base Yr FY10 Dollars)
TOTAL COST (Base Yr FY10 Dollars)
1,408,473,937$ 211,271,091$ 1,619,745,028$ -$ -$ -$ -$ -$ -$
4,011,645$ 601,747$ 4,613,392$ 33,900,615$ 8,475,154$ 42,375,768$ 46,332,284$ 6,949,843$ 53,282,127$
2,445,007,198$ 611,251,800$ 3,056,258,998$ 77,008,126$ 15,401,625$ 92,409,751$ 94,626,293$ 14,193,944$ 108,820,237$
169,016,848$ 25,352,527$ 194,369,375$ -$ -$ -$ -$ -$ -$ -$ -$ -$ -$ -$ -$ -$ -$ -$ -$ -$ -$ -$ -$ -$ -$ -$ -$
4,278,376,946$ 893,497,730$ 5,171,874,676$
-$ -$ -$ -$ -$ -$ -$ -$ -$ -$ -$ -$ -$ -$ -$ -$ -$ -$ -$ -$ -$ -$ -$ -$ -$ -$ -$ -$ -$ -$
-$ -$ -$ -$ -$ -$ -$ -$ -$
11,937,521$ 2,984,380$ 14,921,901$ -$ -$ -$
11,937,521$ 2,984,380$ 14,921,901$
-$ -$ -$ 30,759,469$ 7,689,867$ 38,449,336$
-$ -$ -$ 131,730,670$ 26,346,134$ 158,076,804$
6,682,884$ 1,670,721$ 8,353,605$ 175,640,893$ 17,564,089$ 193,204,983$ 103,082,783$ 20,616,557$ 123,699,340$
63,265,511$ 15,816,378$ 79,081,889$ -$ -$ -$
408,079,427$ 69,087,189$ 477,166,616$ 103,082,783$ 20,616,557$ 123,699,340$ 511,162,210$ 89,703,746$ 600,865,955$
100,370,905$ 15,055,636$ 115,426,541$ -$ -$ -$ -$ -$ -$ -$ -$ -$
15,587,813$ 2,338,172$ 17,925,986$ -$ -$ -$ -$ -$ -$ -$ -$ -$
115,958,719$ 17,393,808$ 133,352,527$
-$ -$ -$ 196,881,635$ 29,532,245$ 226,413,880$ 172,018,017$ 25,802,702$ 197,820,719$
-$ -$ -$ 368,899,651$ 55,334,948$ 424,234,599$
-$ -$ -$ -$ -$ -$ -$ -$ -$ -$ -$ -$ -$ -$ -$ -$ -$ -$
BFD-PMDLow Cost Total
B1-End + NEW E2 + Alt T3-1 + Alt AV4
Appendix A - Detailed Cost Budgets
Page 1 of 12

Environmental Segment:
Detailed Capital Cost Budget
70.06 Vehicle acquisition: Maintenance of way vehicles70.07 Vehicle acquisition: Non-railroad support vehicles70.08 Vehicle refurbishment: Electric locomotive70.09 Vehicle refurbishment: Non-electric locomotive70.10 Vehicle refurbishment: Electric multiple unit70.11 Vehicle refurbishment: Diesel multiple unit70.12 Veh refurb: Passeng. loco-hauled car w/ ticketed space70.13 Veh refurb: Non-passeng loco-hauled car w/o ticketed space70.14 Vehicle refurbishment: Maintenance of way vehicles70.15 Spare parts
80 PROFESSIONAL SERVICES80.01 Service Development Plan/Service Environmental80.02 Preliminary Engineering/Project Environmental80.03 Final design80.04 Project management for design and construction80.05 Construction administration & management 80.06 Professional liability and other non-construction insurance 80.07 Legal; Permits; Review Fees by other agencies, cities, etc.80.08 Surveys, testing, investigation80.09 Engineering inspection80.10 Start up
TOTAL CAPITAL COSTS (10-100)100 FINANCE CHARGESSubtotal (10-90)
Total for Category 70 VEHICLES
Total for Category 80 PROFESSIONAL SERVICES
Subtotal (10-80)90 UNALLOCATED CONTINGENCY
Total Allocated Cost (Base Yr FY10 Dollars )
Allocated Contingency (Base Yr FY10 Dollars)
TOTAL COST (Base Yr FY10 Dollars)
BFD-PMDLow Cost Total
B1-End + NEW E2 + Alt T3-1 + Alt AV4
-$ -$ -$ -$ -$ -$ -$ -$ -$ -$ -$ -$ -$ -$ -$ -$ -$ -$ -$ -$ -$ -$ -$ -$ -$ -$ -$ -$ -$ -$ -$ -$ -$
-$
-$ -$ -$ -$ -$ -$
339,837,792$ -$ 339,837,792$ 186,646,510$ -$ 186,646,510$ 248,862,013$ -$ 248,862,013$
-$ -$ -$ 31,107,752$ -$ 31,107,752$
-$ -$ -$ -$ -$ -$
33,455,228$ -$ 33,455,228$ 839,909,293$ -$ 839,909,293$
6,126,244,340$ 1,058,914,611$ 7,185,158,951$ 264,316,752$
7,449,475,703$
7,449,475,703$
Appendix A - Detailed Cost Budgets
Page 2 of 12

10 Track Structure & Track10.01 Track structure: Viaduct10.02 Track structure: Major/Movable bridge10.03 Track structure: Undergrade Bridges10.04 Track structure: Culverts and drainage structures10.05 Track structure: Cut and Fill (> 4' height/depth)10.06 Track structure: At-grade (grading and subgrade stabilization)10.07 Track structure: Tunnel10.08 Track structure: Retaining walls and systems10.09 Track new construction: Conventional ballasted 10.10 Track new construction: Non-ballasted10.11 Track rehabilitation: Ballast and surfacing10.12 Track rehabilitation: Ditching and drainage10.13 Track rehabilitation: Component replacement (rail, ties, etc)10.14 Track: Special track work (switches, turnouts, insulated joints)10.15 Track: Major interlockings10.16 Track: Switch heaters (with power and control)10.17 Track: Vibration and noise dampening10.18 Other linear structures including fencing, sound walls
20 STATIONS, TERMINALS, INTERMODAL20.01 Station buildings: Intercity passenger rail only20.02 Station buildings: Joint use (commuter rail, intercity bus)20.03 Platforms20.04 Elevators, escalators20.05 Joint commercial development 20.06 Pedestrian / bike access and accommodation, landscaping, parking lots20.07 Automobile, bus, van accessways including roads20.08 Fare collection systems and equipment20.09 Station security
30 SUPPORT FACILITIES: YARDS, SHOPS, ADMIN. BLDGS30.01 Administration building: Office, sales, storage, revenue counting30.02 Light maintenance facility 30.03 Heavy maintenance facility30.04 Storage or maintenance-of-way building/bases30.05 Yard and yard track
40 SITEWORK, RIGHT OF WAY, LAND, EXISTING IMPROVEMENTS40.01 Demolition, clearing, site preparation40.02 Site utilities, utility relocation40.03 Hazardous material, contaminated soil removal/mitigation, ground water treatments40.04 Environmental mitigation: wetlands, historic/archeology, parks40.05 Site structures including retaining walls, sound walls40.06 Temporary facilities and other indirect costs during construction40.07 Purchase or lease of real estate 40.08 Highway/pedestrian overpass/grade separations40.09 Relocation of existing households and businesses
50 COMMUNICATIONS & SIGNALING50.01 Wayside signaling equipment50.02 Signal power access and distribution50.03 On-board signaling equipment50.04 Traffic control and dispatching systems50.05 Communications50.06 Grade crossing protection50.07 Hazard detectors: dragging equipment high water, slide, etc.50.08 Station train approach warning system
60 ELECTRIC TRACTION60.01 Traction power transmission: High voltage 60.02 Traction power supply: Substations 60.03 Traction power distribution: Catenary and third rail60.04 Traction power control
70 VEHICLES 70.00 Vehicle acquisition: Electric locomotive70.01 Vehicle acquisition: Non-electric locomotive70.02 Vehicle acquisition: Electric multiple unit70.03 Vehicle acquisition: Diesel multiple unit70.04 Veh acq: Loco-hauled passenger cars w/ ticketed space70.05 Veh acq: Loco-hauled passenger cars w/o ticketed space
Total for Category 60 ELECTRIC TRACTION
Total for Category 20 STATIONS, TERMINALS, INTERMODAL
Total for Category 30 SUPPORT FACILITIES: YARDS, SHOPS, ADMIN. BLDGS
Subtotal for Sitework, Land & Existing ImprovementsSubtotal for Right of Way
Total for Category 40 SITEWORK, RIGHT OF WAY, LAND, EXISTING IMPROVEMENTS
Total for Category 50 COMMUNICATIONS & SIGNALING
Total for Category 10 Track Structure & Track
Environmental Segment:
Detailed Capital Cost Budget
Total Allocated Cost (Base Yr FY10 Dollars )
Allocated Contingency (Base Yr FY10 Dollars)
TOTAL COST (Base Yr FY10 Dollars)
1,719,440,890$ 257,916,133$ 1,977,357,023$ -$ -$ -$ -$ -$ -$
3,410,804$ 511,621$ 3,922,425$ 13,599,812$ 3,399,953$ 16,999,765$ 54,616,273$ 8,192,441$ 62,808,715$
2,147,729,206$ 536,932,302$ 2,684,661,508$ 211,072,683$ 42,214,537$ 253,287,220$
92,526,232$ 13,878,935$ 106,405,167$ 172,526,487$ 25,878,973$ 198,405,461$
-$ -$ -$ -$ -$ -$ -$ -$ -$
1,679,087$ 251,863$ 1,930,950$ -$ -$ -$ -$ -$ -$ -$ -$ -$ -$ -$ -$
4,416,601,476$ 889,176,757$ 5,305,778,233$
-$ -$ -$ -$ -$ -$ -$ -$ -$ -$ -$ -$ -$ -$ -$ -$ -$ -$ -$ -$ -$ -$ -$ -$ -$ -$ -$ -$ -$ -$
-$ -$ -$ -$ -$ -$ -$ -$ -$
11,937,521$ 2,984,380$ 14,921,901$ -$ -$ -$
11,937,521$ 2,984,380$ 14,921,901$
-$ -$ -$ 20,859,935$ 5,214,984$ 26,074,919$
-$ -$ -$ 136,313,714$ 27,262,743$ 163,576,456$
6,682,567$ 1,670,642$ 8,353,208$ 181,751,618$ 18,175,162$ 199,926,780$ 118,155,537$ 23,631,107$ 141,786,644$
87,708,957$ 21,927,239$ 109,636,196$ -$ -$ -$
433,316,791$ 74,250,769$ 507,567,560$ 118,155,537$ 23,631,107$ 141,786,644$ 551,472,328$ 97,881,877$ 649,354,204$
100,433,913$ 15,065,087$ 115,499,000$ -$ -$ -$ -$ -$ -$ -$ -$ -$
15,597,599$ 2,339,640$ 17,937,238$ -$ -$ -$ -$ -$ -$ -$ -$ -$
116,031,511$ 17,404,727$ 133,436,238$
-$ -$ -$ 197,005,226$ 29,550,784$ 226,556,010$ 172,126,000$ 25,818,900$ 197,944,900$
-$ -$ -$ 369,131,227$ 55,369,684$ 424,500,911$
-$ -$ -$ -$ -$ -$ -$ -$ -$ -$ -$ -$ -$ -$ -$ -$ -$ -$
BFD-PMDHigh Cost Total
B2-End + New E4 +Alt T3-2 + Alt AV3B
Appendix A - Detailed Cost Budgets
Page 3 of 12

Environmental Segment:
Detailed Capital Cost Budget
70.06 Vehicle acquisition: Maintenance of way vehicles70.07 Vehicle acquisition: Non-railroad support vehicles70.08 Vehicle refurbishment: Electric locomotive70.09 Vehicle refurbishment: Non-electric locomotive70.10 Vehicle refurbishment: Electric multiple unit70.11 Vehicle refurbishment: Diesel multiple unit70.12 Veh refurb: Passeng. loco-hauled car w/ ticketed space70.13 Veh refurb: Non-passeng loco-hauled car w/o ticketed space70.14 Vehicle refurbishment: Maintenance of way vehicles70.15 Spare parts
80 PROFESSIONAL SERVICES80.01 Service Development Plan/Service Environmental80.02 Preliminary Engineering/Project Environmental80.03 Final design80.04 Project management for design and construction80.05 Construction administration & management 80.06 Professional liability and other non-construction insurance 80.07 Legal; Permits; Review Fees by other agencies, cities, etc.80.08 Surveys, testing, investigation80.09 Engineering inspection80.10 Start up
TOTAL CAPITAL COSTS (10-100)100 FINANCE CHARGESSubtotal (10-90)
Total for Category 70 VEHICLES
Total for Category 80 PROFESSIONAL SERVICES
Subtotal (10-80)90 UNALLOCATED CONTINGENCY
Total Allocated Cost (Base Yr FY10 Dollars )
Allocated Contingency (Base Yr FY10 Dollars)
TOTAL COST (Base Yr FY10 Dollars)
BFD-PMDHigh Cost Total
B2-End + New E4 +Alt T3-2 + Alt AV3B
-$ -$ -$ -$ -$ -$ -$ -$ -$ -$ -$ -$ -$ -$ -$ -$ -$ -$ -$ -$ -$ -$ -$ -$ -$ -$ -$ -$ -$ -$ -$ -$ -$
-$
-$ -$ -$ -$ -$ -$
349,696,062$ -$ 349,696,062$ 191,586,145$ -$ 191,586,145$ 255,448,194$ -$ 255,448,194$
-$ -$ -$ 31,931,024$ -$ 31,931,024$
-$ -$ -$ -$ -$ -$
33,476,229$ -$ 33,476,229$ 862,137,654$ -$ 862,137,654$
6,327,311,716$ 1,062,817,425$ 7,390,129,141$ 273,258,703$
7,663,387,844$
7,663,387,844$
Appendix A - Detailed Cost Budgets
Page 4 of 12

10 Track Structure & Track10.01 Track structure: Viaduct10.02 Track structure: Major/Movable bridge10.03 Track structure: Undergrade Bridges10.04 Track structure: Culverts and drainage structures10.05 Track structure: Cut and Fill (> 4' height/depth)10.06 Track structure: At-grade (grading and subgrade stabilization)10.07 Track structure: Tunnel10.08 Track structure: Retaining walls and systems10.09 Track new construction: Conventional ballasted 10.10 Track new construction: Non-ballasted10.11 Track rehabilitation: Ballast and surfacing10.12 Track rehabilitation: Ditching and drainage10.13 Track rehabilitation: Component replacement (rail, ties, etc)10.14 Track: Special track work (switches, turnouts, insulated joints)10.15 Track: Major interlockings10.16 Track: Switch heaters (with power and control)10.17 Track: Vibration and noise dampening10.18 Other linear structures including fencing, sound walls
20 STATIONS, TERMINALS, INTERMODAL20.01 Station buildings: Intercity passenger rail only20.02 Station buildings: Joint use (commuter rail, intercity bus)20.03 Platforms20.04 Elevators, escalators20.05 Joint commercial development 20.06 Pedestrian / bike access and accommodation, landscaping, parking lots20.07 Automobile, bus, van accessways including roads20.08 Fare collection systems and equipment20.09 Station security
30 SUPPORT FACILITIES: YARDS, SHOPS, ADMIN. BLDGS30.01 Administration building: Office, sales, storage, revenue counting30.02 Light maintenance facility 30.03 Heavy maintenance facility30.04 Storage or maintenance-of-way building/bases30.05 Yard and yard track
40 SITEWORK, RIGHT OF WAY, LAND, EXISTING IMPROVEMENTS40.01 Demolition, clearing, site preparation40.02 Site utilities, utility relocation40.03 Hazardous material, contaminated soil removal/mitigation, ground water treatments40.04 Environmental mitigation: wetlands, historic/archeology, parks40.05 Site structures including retaining walls, sound walls40.06 Temporary facilities and other indirect costs during construction40.07 Purchase or lease of real estate 40.08 Highway/pedestrian overpass/grade separations40.09 Relocation of existing households and businesses
50 COMMUNICATIONS & SIGNALING50.01 Wayside signaling equipment50.02 Signal power access and distribution50.03 On-board signaling equipment50.04 Traffic control and dispatching systems50.05 Communications50.06 Grade crossing protection50.07 Hazard detectors: dragging equipment high water, slide, etc.50.08 Station train approach warning system
60 ELECTRIC TRACTION60.01 Traction power transmission: High voltage 60.02 Traction power supply: Substations 60.03 Traction power distribution: Catenary and third rail60.04 Traction power control
70 VEHICLES 70.00 Vehicle acquisition: Electric locomotive70.01 Vehicle acquisition: Non-electric locomotive70.02 Vehicle acquisition: Electric multiple unit70.03 Vehicle acquisition: Diesel multiple unit70.04 Veh acq: Loco-hauled passenger cars w/ ticketed space70.05 Veh acq: Loco-hauled passenger cars w/o ticketed space
Environmental Segment:
Detailed Capital Cost Budget
Total for Category 10 Track Structure & Track
Total for Category 60 ELECTRIC TRACTION
Total for Category 20 STATIONS, TERMINALS, INTERMODAL
Total for Category 30 SUPPORT FACILITIES: YARDS, SHOPS, ADMIN. BLDGS
Subtotal for Sitework, Land & Existing ImprovementsSubtotal for Right of Way
Total for Category 40 SITEWORK, RIGHT OF WAY, LAND, EXISTING IMPROVEMENTS
Total for Category 50 COMMUNICATIONS & SIGNALING
Total Allocated Cost (Base Yr FY10 Dollars )
Allocated Contingency (Base Yr FY10 Dollars)
TOTAL COST (Base Yr FY10 Dollars)
453,258,194$ 67,988,729$ 521,246,923$ -$ -$ -$ -$ -$ -$
8,429,609$ 1,264,441$ 9,694,050$ 140,339,638$ 35,084,909$ 175,424,547$
28,252,540$ 4,237,881$ 32,490,421$ 3,454,723,654$ 863,680,913$ 4,318,404,567$
-$ -$ -$ 73,255,493$ 10,988,324$ 84,243,817$ 83,689,689$ 12,553,453$ 96,243,142$
-$ -$ -$ -$ -$ -$ -$ -$ -$
15,789,610$ 2,368,441$ 18,158,051$ -$ -$ -$ -$ -$ -$ -$ -$ -$ -$ -$ -$
4,257,738,426$ 998,167,093$ 5,255,905,519$
176,973,498$ 44,243,374$ 221,216,872$ -$ -$ -$ -$ -$ -$ -$ -$ -$ -$ -$ -$ -$ -$ -$ -$ -$ -$ -$ -$ -$ -$ -$ -$
176,973,498$ 44,243,374$ 221,216,872$
-$ -$ -$ -$ -$ -$ -$ -$ -$ -$ -$ -$ -$ -$ -$ -$ -$ -$
-$ -$ -$ 102,394,947$ 25,598,737$ 127,993,683$
-$ -$ -$ 139,084,177$ 27,816,835$ 166,901,012$
34,258,722$ 8,564,680$ 42,823,402$ 185,445,569$ 18,544,557$ 203,990,126$ 273,961,000$ 54,792,200$ 328,753,200$
64,773,641$ 16,193,410$ 80,967,051$ -$ -$ -$
525,957,055$ 96,718,220$ 622,675,275$ 273,961,000$ 54,792,200$ 328,753,200$ 799,918,055$ 151,510,420$ 951,428,475$
49,523,874$ 7,428,581$ 56,952,455$ -$ -$ -$ -$ -$ -$ -$ -$ -$
7,691,162$ 1,153,674$ 8,844,837$ -$ -$ -$ -$ -$ -$ -$ -$ -$
57,215,036$ 8,582,255$ 65,797,292$
-$ -$ -$ 97,143,104$ 14,571,466$ 111,714,570$ 84,875,180$ 12,731,277$ 97,606,457$
-$ -$ -$ 182,018,284$ 27,302,743$ 209,321,026$
-$ -$ -$ -$ -$ -$ -$ -$ -$ -$ -$ -$ -$ -$ -$ -$ -$ -$
PMD-LAUSubsectionSR-14 EAST
Appendix A - Detailed Cost Budgets
Page 5 of 12

Environmental Segment:
Detailed Capital Cost Budget
70.06 Vehicle acquisition: Maintenance of way vehicles70.07 Vehicle acquisition: Non-railroad support vehicles70.08 Vehicle refurbishment: Electric locomotive70.09 Vehicle refurbishment: Non-electric locomotive70.10 Vehicle refurbishment: Electric multiple unit70.11 Vehicle refurbishment: Diesel multiple unit70.12 Veh refurb: Passeng. loco-hauled car w/ ticketed space70.13 Veh refurb: Non-passeng loco-hauled car w/o ticketed space70.14 Vehicle refurbishment: Maintenance of way vehicles70.15 Spare parts
80 PROFESSIONAL SERVICES80.01 Service Development Plan/Service Environmental80.02 Preliminary Engineering/Project Environmental80.03 Final design80.04 Project management for design and construction80.05 Construction administration & management 80.06 Professional liability and other non-construction insurance 80.07 Legal; Permits; Review Fees by other agencies, cities, etc.80.08 Surveys, testing, investigation80.09 Engineering inspection80.10 Start up
100 FINANCE CHARGES
Total for Category 70 VEHICLES
Total for Category 80 PROFESSIONAL SERVICES
Subtotal (10-80)90 UNALLOCATED CONTINGENCY
TOTAL CAPITAL COSTS (10-100)
Subtotal (10-90)
Total Allocated Cost (Base Yr FY10 Dollars )
Allocated Contingency (Base Yr FY10 Dollars)
TOTAL COST (Base Yr FY10 Dollars)
PMD-LAUSubsectionSR-14 EAST
-$ -$ -$ -$ -$ -$ -$ -$ -$ -$ -$ -$ -$ -$ -$ -$ -$ -$ -$ -$ -$ -$ -$ -$ -$ -$ -$ -$ -$ -$ -$ -$ -$
-$ -$ -$ -$ -$ -$
365,987,860$ -$ 365,987,860$ 191,247,480$ -$ 191,247,480$ 254,996,639$ -$ 254,996,639$
-$ -$ -$ 31,874,580$ -$ 31,874,580$
-$ -$ -$ -$ -$ -$
16,507,099$ -$ 16,507,099$ 860,613,658$ -$ 860,613,658$
6,334,476,956$ 1,229,805,885$ 7,564,282,841$ 273,693,165$
7,837,976,006$
7,837,976,006$
Appendix A - Detailed Cost Budgets
Page 6 of 12

10 Track Structure & Track10.01 Track structure: Viaduct10.02 Track structure: Major/Movable bridge10.03 Track structure: Undergrade Bridges10.04 Track structure: Culverts and drainage structures10.05 Track structure: Cut and Fill (> 4' height/depth)10.06 Track structure: At-grade (grading and subgrade stabilization)10.07 Track structure: Tunnel10.08 Track structure: Retaining walls and systems10.09 Track new construction: Conventional ballasted 10.10 Track new construction: Non-ballasted10.11 Track rehabilitation: Ballast and surfacing10.12 Track rehabilitation: Ditching and drainage10.13 Track rehabilitation: Component replacement (rail, ties, etc)10.14 Track: Special track work (switches, turnouts, insulated joints)10.15 Track: Major interlockings10.16 Track: Switch heaters (with power and control)10.17 Track: Vibration and noise dampening10.18 Other linear structures including fencing, sound walls
20 STATIONS, TERMINALS, INTERMODAL20.01 Station buildings: Intercity passenger rail only20.02 Station buildings: Joint use (commuter rail, intercity bus)20.03 Platforms20.04 Elevators, escalators20.05 Joint commercial development 20.06 Pedestrian / bike access and accommodation, landscaping, parking lots20.07 Automobile, bus, van accessways including roads20.08 Fare collection systems and equipment20.09 Station security
30 SUPPORT FACILITIES: YARDS, SHOPS, ADMIN. BLDGS30.01 Administration building: Office, sales, storage, revenue counting30.02 Light maintenance facility 30.03 Heavy maintenance facility30.04 Storage or maintenance-of-way building/bases30.05 Yard and yard track
40 SITEWORK, RIGHT OF WAY, LAND, EXISTING IMPROVEMENTS40.01 Demolition, clearing, site preparation40.02 Site utilities, utility relocation40.03 Hazardous material, contaminated soil removal/mitigation, ground water treatments40.04 Environmental mitigation: wetlands, historic/archeology, parks40.05 Site structures including retaining walls, sound walls40.06 Temporary facilities and other indirect costs during construction40.07 Purchase or lease of real estate 40.08 Highway/pedestrian overpass/grade separations40.09 Relocation of existing households and businesses
50 COMMUNICATIONS & SIGNALING50.01 Wayside signaling equipment50.02 Signal power access and distribution50.03 On-board signaling equipment50.04 Traffic control and dispatching systems50.05 Communications50.06 Grade crossing protection50.07 Hazard detectors: dragging equipment high water, slide, etc.50.08 Station train approach warning system
60 ELECTRIC TRACTION60.01 Traction power transmission: High voltage 60.02 Traction power supply: Substations 60.03 Traction power distribution: Catenary and third rail60.04 Traction power control
70 VEHICLES 70.00 Vehicle acquisition: Electric locomotive70.01 Vehicle acquisition: Non-electric locomotive70.02 Vehicle acquisition: Electric multiple unit70.03 Vehicle acquisition: Diesel multiple unit70.04 Veh acq: Loco-hauled passenger cars w/ ticketed space70.05 Veh acq: Loco-hauled passenger cars w/o ticketed space
Environmental Segment:
Detailed Capital Cost Budget
Total for Category 10 Track Structure & Track
Total for Category 60 ELECTRIC TRACTION
Total for Category 20 STATIONS, TERMINALS, INTERMODAL
Total for Category 30 SUPPORT FACILITIES: YARDS, SHOPS, ADMIN. BLDGS
Subtotal for Sitework, Land & Existing ImprovementsSubtotal for Right of Way
Total for Category 40 SITEWORK, RIGHT OF WAY, LAND, EXISTING IMPROVEMENTS
Total for Category 50 COMMUNICATIONS & SIGNALING
Total Allocated Cost (Base Yr FY10 Dollars )
Allocated Contingency (Base Yr FY10 Dollars)
TOTAL COST (Base Yr FY10 Dollars)
591,653,597$ 88,748,040$ 680,401,637$ -$ -$ -$ -$ -$ -$
7,824,833$ 1,173,725$ 8,998,558$ 143,467,706$ 35,866,926$ 179,334,632$
13,028,953$ 1,954,343$ 14,983,296$ 3,264,872,392$ 816,218,098$ 4,081,090,490$
-$ -$ -$ 50,157,759$ 7,523,664$ 57,681,422$ 76,854,420$ 11,528,163$ 88,382,583$
-$ -$ -$ -$ -$ -$ -$ -$ -$
13,832,343$ 2,074,851$ 15,907,194$ -$ -$ -$ -$ -$ -$ -$ -$ -$ -$ -$ -$
4,161,692,002$ 965,087,810$ 5,126,779,812$
176,973,498$ 44,243,374$ 221,216,872$ -$ -$ -$ -$ -$ -$ -$ -$ -$ -$ -$ -$ -$ -$ -$ -$ -$ -$ -$ -$ -$ -$ -$ -$
176,973,498$ 44,243,374$ 221,216,872$
-$ -$ -$ -$ -$ -$ -$ -$ -$ -$ -$ -$ -$ -$ -$ -$ -$ -$
-$ -$ -$ 106,697,491$ 26,674,373$ 133,371,864$
-$ -$ -$ 135,385,623$ 27,077,125$ 162,462,747$
10,015,373$ 2,503,843$ 12,519,216$ 180,514,164$ 18,051,416$ 198,565,580$ 199,640,000$ 39,928,000$ 239,568,000$
57,475,730$ 14,368,933$ 71,844,663$ -$ -$ -$
490,088,381$ 88,675,690$ 578,764,070$ 199,640,000$ 39,928,000$ 239,568,000$ 689,728,381$ 128,603,690$ 818,332,070$
46,625,530$ 6,993,830$ 53,619,360$ -$ -$ -$ -$ -$ -$ -$ -$ -$
7,241,043$ 1,086,156$ 8,327,200$ -$ -$ -$ -$ -$ -$ -$ -$ -$
53,866,574$ 8,079,986$ 61,946,560$
-$ -$ -$ 91,457,884$ 13,718,683$ 105,176,567$ 79,907,930$ 11,986,189$ 91,894,119$
-$ -$ -$ 171,365,814$ 25,704,872$ 197,070,686$
-$ -$ -$ -$ -$ -$ -$ -$ -$ -$ -$ -$ -$ -$ -$ -$ -$ -$
PMD-LAUSubsectionSR-14 WEST
Appendix A - Detailed Cost Budgets
Page 7 of 12

Environmental Segment:
Detailed Capital Cost Budget
70.06 Vehicle acquisition: Maintenance of way vehicles70.07 Vehicle acquisition: Non-railroad support vehicles70.08 Vehicle refurbishment: Electric locomotive70.09 Vehicle refurbishment: Non-electric locomotive70.10 Vehicle refurbishment: Electric multiple unit70.11 Vehicle refurbishment: Diesel multiple unit70.12 Veh refurb: Passeng. loco-hauled car w/ ticketed space70.13 Veh refurb: Non-passeng loco-hauled car w/o ticketed space70.14 Vehicle refurbishment: Maintenance of way vehicles70.15 Spare parts
80 PROFESSIONAL SERVICES80.01 Service Development Plan/Service Environmental80.02 Preliminary Engineering/Project Environmental80.03 Final design80.04 Project management for design and construction80.05 Construction administration & management 80.06 Professional liability and other non-construction insurance 80.07 Legal; Permits; Review Fees by other agencies, cities, etc.80.08 Surveys, testing, investigation80.09 Engineering inspection80.10 Start up
100 FINANCE CHARGES
Total for Category 70 VEHICLES
Total for Category 80 PROFESSIONAL SERVICES
Subtotal (10-80)90 UNALLOCATED CONTINGENCY
TOTAL CAPITAL COSTS (10-100)
Subtotal (10-90)
Total Allocated Cost (Base Yr FY10 Dollars )
Allocated Contingency (Base Yr FY10 Dollars)
TOTAL COST (Base Yr FY10 Dollars)
PMD-LAUSubsectionSR-14 WEST
-$ -$ -$ -$ -$ -$ -$ -$ -$ -$ -$ -$ -$ -$ -$ -$ -$ -$ -$ -$ -$ -$ -$ -$ -$ -$ -$ -$ -$ -$ -$ -$ -$
-$
-$ -$ -$ -$ -$ -$
355,605,645$ -$ 355,605,645$ 185,573,340$ -$ 185,573,340$ 247,431,120$ -$ 247,431,120$
-$ -$ -$ 30,928,890$ -$ 30,928,890$
-$ -$ -$ -$ -$ -$
15,541,035$ -$ 15,541,035$ 835,080,030$ -$ 835,080,030$
6,088,706,298$ 1,171,719,732$ 7,260,426,030$ 262,681,313$
7,523,107,343$
7,523,107,343$
Appendix A - Detailed Cost Budgets
Page 8 of 12

10 Track Structure & Track10.01 Track structure: Viaduct10.02 Track structure: Major/Movable bridge10.03 Track structure: Undergrade Bridges10.04 Track structure: Culverts and drainage structures10.05 Track structure: Cut and Fill (> 4' height/depth)10.06 Track structure: At-grade (grading and subgrade stabilization)10.07 Track structure: Tunnel10.08 Track structure: Retaining walls and systems10.09 Track new construction: Conventional ballasted 10.10 Track new construction: Non-ballasted10.11 Track rehabilitation: Ballast and surfacing10.12 Track rehabilitation: Ditching and drainage10.13 Track rehabilitation: Component replacement (rail, ties, etc)10.14 Track: Special track work (switches, turnouts, insulated joints)10.15 Track: Major interlockings10.16 Track: Switch heaters (with power and control)10.17 Track: Vibration and noise dampening10.18 Other linear structures including fencing, sound walls
20 STATIONS, TERMINALS, INTERMODAL20.01 Station buildings: Intercity passenger rail only20.02 Station buildings: Joint use (commuter rail, intercity bus)20.03 Platforms20.04 Elevators, escalators20.05 Joint commercial development 20.06 Pedestrian / bike access and accommodation, landscaping, parking lots20.07 Automobile, bus, van accessways including roads20.08 Fare collection systems and equipment20.09 Station security
30 SUPPORT FACILITIES: YARDS, SHOPS, ADMIN. BLDGS30.01 Administration building: Office, sales, storage, revenue counting30.02 Light maintenance facility 30.03 Heavy maintenance facility30.04 Storage or maintenance-of-way building/bases30.05 Yard and yard track
40 SITEWORK, RIGHT OF WAY, LAND, EXISTING IMPROVEMENTS40.01 Demolition, clearing, site preparation40.02 Site utilities, utility relocation40.03 Hazardous material, contaminated soil removal/mitigation, ground water treatments40.04 Environmental mitigation: wetlands, historic/archeology, parks40.05 Site structures including retaining walls, sound walls40.06 Temporary facilities and other indirect costs during construction40.07 Purchase or lease of real estate 40.08 Highway/pedestrian overpass/grade separations40.09 Relocation of existing households and businesses
50 COMMUNICATIONS & SIGNALING50.01 Wayside signaling equipment50.02 Signal power access and distribution50.03 On-board signaling equipment50.04 Traffic control and dispatching systems50.05 Communications50.06 Grade crossing protection50.07 Hazard detectors: dragging equipment high water, slide, etc.50.08 Station train approach warning system
60 ELECTRIC TRACTION60.01 Traction power transmission: High voltage 60.02 Traction power supply: Substations 60.03 Traction power distribution: Catenary and third rail60.04 Traction power control
70 VEHICLES 70.00 Vehicle acquisition: Electric locomotive70.01 Vehicle acquisition: Non-electric locomotive70.02 Vehicle acquisition: Electric multiple unit70.03 Vehicle acquisition: Diesel multiple unit70.04 Veh acq: Loco-hauled passenger cars w/ ticketed space70.05 Veh acq: Loco-hauled passenger cars w/o ticketed space
Detailed Capital Cost Budget
Total for Category 10 Track Structure & Track
Environmental Segment:
Total for Category 50 COMMUNICATIONS & SIGNALING
Total for Category 60 ELECTRIC TRACTION
Total for Category 20 STATIONS, TERMINALS, INTERMODAL
Total for Category 30 SUPPORT FACILITIES: YARDS, SHOPS, ADMIN. BLDGS
Subtotal for Sitework, Land & Existing ImprovementsSubtotal for Right of Way
Total for Category 40 SITEWORK, RIGHT OF WAY, LAND, EXISTING IMPROVEMENTS
Total Allocated Cost (Base Yr FY10 Dollars )
Allocated Contingency (Base Yr FY10 Dollars)
TOTAL COST (Base Yr FY10 Dollars)
1,671,009,164$ 250,651,375$ 1,921,660,538$ -$ -$ -$ -$ -$ -$
22,772,454$ 3,415,868$ 26,188,323$ 434,570,258$ 108,642,565$ 543,212,823$
20,878,829$ 3,131,824$ 24,010,653$ 4,899,904,366$ 1,224,976,091$ 6,124,880,457$
61,486,716$ 12,297,343$ 73,784,059$ 90,815,019$ 13,622,253$ 104,437,272$
207,800,739$ 31,170,111$ 238,970,849$ -$ -$ -$ -$ -$ -$ -$ -$ -$
69,345,394$ 10,401,809$ 79,747,203$ -$ -$ -$ -$ -$ -$ -$ -$ -$ -$ -$ -$
7,478,582,938$ 1,658,309,239$ 9,136,892,177$ -$ -$ -$ -$ -$ -$
176,973,498$ 44,243,374$ 221,216,872$ -$ -$ -$ -$ -$ -$ -$ -$ -$ -$ -$ -$ -$ -$ -$ -$ -$ -$ -$ -$ -$ -$ -$ -$
176,973,498$ 44,243,374$ 221,216,872$ -$ -$ -$ -$ $ - $ - -$ -$ -$ -$ -$ -$ -$ -$ -$
11,937,521$ 2,984,380$ 14,921,901$ -$ -$ -$
11,937,521$ 2,984,380$ 14,921,901$ -$ -$ -$ -$ $ - $ - -$ -$ -$
125,225,197$ 31,306,299$ 156,531,496$ -$ -$ -$
239,596,204$ 47,919,241$ 287,515,445$ -$ -$ -$
319,461,605$ 31,946,161$ 351,407,766$ 414,476,769$ 82,895,354$ 497,372,123$ 193,820,980$ 48,455,245$ 242,276,225$
-$ -$ -$ 878,103,986$ 159,626,946$ 1,037,730,932$ 414,476,769$ 82,895,354$ 497,372,123$
1,292,580,755$ 242,522,299$ 1,535,103,055$ -$ -$ -$ -$ -$ -$
117,332,517$ 17,599,878$ 134,932,395$ -$ -$ -$ -$ -$ -$ -$ -$ -$
18,221,988$ 2,733,298$ 20,955,286$ -$ -$ -$ -$ -$ -$ -$ -$ -$
135,554,505$ 20,333,176$ 155,887,680$ -$ -$ -$ -$ -$ -$ -$ -$ -$
230,152,530$ 34,522,879$ 264,675,409$ 201,087,226$ 30,163,084$ 231,250,310$
-$ -$ -$ 431,239,756$ 64,685,963$ 495,925,719$
-$ -$ -$ -$ -$ -$ -$ -$ -$ -$ -$ -$ -$ -$ -$ -$ -$ -$ -$ -$ -$ -$ -$ -$
I-5 Alignment "Most Viable Alternative"B2-END + North Tie In + D5+B1 + C1
Appendix A - Detailed Cost Budgets
Page 9 of 12

Detailed Capital Cost Budget
Environmental Segment:
70.06 Vehicle acquisition: Maintenance of way vehicles70.07 Vehicle acquisition: Non-railroad support vehicles70.08 Vehicle refurbishment: Electric locomotive70.09 Vehicle refurbishment: Non-electric locomotive70.10 Vehicle refurbishment: Electric multiple unit70.11 Vehicle refurbishment: Diesel multiple unit70.12 Veh refurb: Passeng. loco-hauled car w/ ticketed space70.13 Veh refurb: Non-passeng loco-hauled car w/o ticketed space70.14 Vehicle refurbishment: Maintenance of way vehicles70.15 Spare parts
80 PROFESSIONAL SERVICES80.01 Service Development Plan/Service Environmental80.02 Preliminary Engineering/Project Environmental80.03 Final design80.04 Project management for design and construction80.05 Construction administration & management 80.06 Professional liability and other non-construction insurance 80.07 Legal; Permits; Review Fees by other agencies, cities, etc.80.08 Surveys, testing, investigation80.09 Engineering inspection80.10 Start up
Total for Category 70 VEHICLES
Total for Category 80 PROFESSIONAL SERVICES
Subtotal (10-80)
Subtotal (10-90)90 UNALLOCATED CONTINGENCY
100 FINANCE CHARGESTOTAL CAPITAL COSTS (10-100)
Total Allocated Cost (Base Yr FY10 Dollars )
Allocated Contingency (Base Yr FY10 Dollars)
TOTAL COST (Base Yr FY10 Dollars)
I-5 Alignment "Most Viable Alternative"B2-END + North Tie In + D5+B1 + C1
-$ -$ -$ -$ -$ -$ -$ -$ -$ -$ -$ -$ -$ -$ -$ -$ -$ -$ -$ -$ -$ -$ -$ -$ -$ -$ -$ -$ -$ -$ -$ -$ -$ -$ -$ -$ -$ -$ -$ -$ -$ -$ -$ -$ -$
624,645,713$ -$ 624,645,713$ 331,877,258$ -$ 331,877,258$ 442,503,011$ -$ 442,503,011$
-$ -$ -$ 55,312,876$ -$ 55,312,876$
-$ -$ -$ -$ -$ -$
39,108,804$ -$ 39,108,804$ 1,493,447,663$ -$ 1,493,447,663$
11,020,316,635$ 2,033,078,432$ 13,053,395,067$ 476,343,449$
13,529,738,516$
13,529,738,516$
Appendix A - Detailed Cost Budgets
Page 10 of 12

10 Track Structure & Track10.01 Track structure: Viaduct10.02 Track structure: Major/Movable bridge10.03 Track structure: Undergrade Bridges10.04 Track structure: Culverts and drainage structures10.05 Track structure: Cut and Fill (> 4' height/depth)10.06 Track structure: At-grade (grading and subgrade stabilization)10.07 Track structure: Tunnel10.08 Track structure: Retaining walls and systems10.09 Track new construction: Conventional ballasted 10.10 Track new construction: Non-ballasted10.11 Track rehabilitation: Ballast and surfacing10.12 Track rehabilitation: Ditching and drainage10.13 Track rehabilitation: Component replacement (rail, ties, etc)10.14 Track: Special track work (switches, turnouts, insulated joints)10.15 Track: Major interlockings10.16 Track: Switch heaters (with power and control)10.17 Track: Vibration and noise dampening10.18 Other linear structures including fencing, sound walls
20 STATIONS, TERMINALS, INTERMODAL20.01 Station buildings: Intercity passenger rail only20.02 Station buildings: Joint use (commuter rail, intercity bus)20.03 Platforms20.04 Elevators, escalators20.05 Joint commercial development 20.06 Pedestrian / bike access and accommodation, landscaping, parking lots20.07 Automobile, bus, van accessways including roads20.08 Fare collection systems and equipment20.09 Station security
30 SUPPORT FACILITIES: YARDS, SHOPS, ADMIN. BLDGS30.01 Administration building: Office, sales, storage, revenue counting30.02 Light maintenance facility 30.03 Heavy maintenance facility30.04 Storage or maintenance-of-way building/bases30.05 Yard and yard track
40 SITEWORK, RIGHT OF WAY, LAND, EXISTING IMPROVEMENTS40.01 Demolition, clearing, site preparation40.02 Site utilities, utility relocation40.03 Hazardous material, contaminated soil removal/mitigation, ground water treatments40.04 Environmental mitigation: wetlands, historic/archeology, parks40.05 Site structures including retaining walls, sound walls40.06 Temporary facilities and other indirect costs during construction40.07 Purchase or lease of real estate 40.08 Highway/pedestrian overpass/grade separations40.09 Relocation of existing households and businesses
50 COMMUNICATIONS & SIGNALING50.01 Wayside signaling equipment50.02 Signal power access and distribution50.03 On-board signaling equipment50.04 Traffic control and dispatching systems50.05 Communications50.06 Grade crossing protection50.07 Hazard detectors: dragging equipment high water, slide, etc.50.08 Station train approach warning system
60 ELECTRIC TRACTION60.01 Traction power transmission: High voltage 60.02 Traction power supply: Substations 60.03 Traction power distribution: Catenary and third rail60.04 Traction power control
70 VEHICLES 70.00 Vehicle acquisition: Electric locomotive70.01 Vehicle acquisition: Non-electric locomotive70.02 Vehicle acquisition: Electric multiple unit70.03 Vehicle acquisition: Diesel multiple unit70.04 Veh acq: Loco-hauled passenger cars w/ ticketed space70.05 Veh acq: Loco-hauled passenger cars w/o ticketed space
Detailed Capital Cost Budget
Environmental Segment:
Total for Category 10 Track Structure & Track
Total for Category 20 STATIONS, TERMINALS, INTERMODAL
Total for Category 30 SUPPORT FACILITIES: YARDS, SHOPS, ADMIN. BLDGS
Subtotal for Sitework, Land & Existing ImprovementsSubtotal for Right of Way
Total for Category 40 SITEWORK, RIGHT OF WAY, LAND, EXISTING IMPROVEMENTS
Total for Category 50 COMMUNICATIONS & SIGNALING
Total for Category 60 ELECTRIC TRACTION
Total Allocated Cost (Base Yr FY10 Dollars )
Allocated Contingency (Base Yr FY10 Dollars)
TOTAL COST (Base Yr FY10 Dollars)
1,671,009,164$ 324,399,669$ 1,995,408,833$ -$ -$ -$ -$ -$ -$
22,772,454$ 3,415,868$ 26,188,323$ 434,570,258$ 108,642,565$ 543,212,823$
20,878,829$ 3,131,824$ 24,010,653$ 5,469,904,366$ 1,640,971,310$ 7,110,875,675$
61,486,716$ 12,297,343$ 73,784,059$ 90,815,019$ 13,622,253$ 104,437,272$
207,800,739$ 31,170,111$ 238,970,849$ -$ -$ -$ -$ -$ -$ -$ -$ -$
34,345,394$ 5,151,809$ 39,497,203$ -$ -$ -$ -$ -$ -$ -$ -$ -$ -$ -$ -$
8,013,582,938$ 2,142,802,752$ 10,156,385,690$ -$ -$
193,973,498$ 48,493,374$ 242,466,872$ -$ -$ -$ -$ -$ -$ -$ -$ -$ -$ -$ -$ -$ -$ -$ -$ -$ -$ -$ -$ -$ -$ -$ -$
193,973,498$ 48,493,374$ 242,466,872$ -$ -$ -$ -$ -$ -$ -$ -$ -$ -$ -$
11,937,521$ 2,984,380$ 14,921,901$ -$ -$ -$
11,937,521$ 2,984,380$ 14,921,901$ -$ -$ -$ -$ -$
125,225,197$ 31,306,299$ 156,531,496$ -$ -$ -$
550,380,429$ 137,595,107$ 687,975,536$ 34,000,000$ 8,500,000$ 42,500,000$
333,840,572$ 33,384,057$ 367,224,629$ 414,476,769$ 165,790,708$ 580,267,477$ 193,820,980$ 48,455,245$ 242,276,225$
-$ -$ -$ 1,237,267,179$ 259,240,709$ 1,496,507,887$
414,476,769$ 165,790,708$ 580,267,477$ 1,651,743,948$ 425,031,416$ 2,076,775,364$
-$ -$
117,332,517$ 17,599,878$ 134,932,395$ -$ -$ -$ -$ -$ -$ -$ -$ -$
18,221,988$ 2,733,298$ 20,955,286$ -$ -$ -$ -$ -$ -$ -$ -$ -$
135,554,505$ 20,333,176$ 155,887,680$ -$ -$ -$ -$ -$
230,152,530$ 34,522,879$ 264,675,409$ 201,087,226$ 30,163,084$ 231,250,310$
-$ -$ -$ 431,239,756$ 64,685,963$ 495,925,719$
-$ -$ -$ -$ -$ -$ -$ -$ -$ -$ -$ -$ -$ -$ -$ -$ -$ -$ -$ -$
RISK ADJUSTED
I-5 Alignment "Most Viable Alternative"B2-END + North Tie In + D5+B1 + C1
Appendix A - Detailed Cost Budgets
Page 11 of 12

Detailed Capital Cost Budget
Environmental Segment:
70.06 Vehicle acquisition: Maintenance of way vehicles70.07 Vehicle acquisition: Non-railroad support vehicles70.08 Vehicle refurbishment: Electric locomotive70.09 Vehicle refurbishment: Non-electric locomotive70.10 Vehicle refurbishment: Electric multiple unit70.11 Vehicle refurbishment: Diesel multiple unit70.12 Veh refurb: Passeng. loco-hauled car w/ ticketed space70.13 Veh refurb: Non-passeng loco-hauled car w/o ticketed space70.14 Vehicle refurbishment: Maintenance of way vehicles70.15 Spare parts
80 PROFESSIONAL SERVICES80.01 Service Development Plan/Service Environmental80.02 Preliminary Engineering/Project Environmental80.03 Final design80.04 Project management for design and construction80.05 Construction administration & management 80.06 Professional liability and other non-construction insurance 80.07 Legal; Permits; Review Fees by other agencies, cities, etc.80.08 Surveys, testing, investigation80.09 Engineering inspection80.10 Start up
Subtotal (10-80)
Total for Category 70 VEHICLES
Total for Category 80 PROFESSIONAL SERVICES
Subtotal (10-90)90 UNALLOCATED CONTINGENCY
TOTAL CAPITAL COSTS (10-100)100 FINANCE CHARGES
Total Allocated Cost (Base Yr FY10 Dollars )
Allocated Contingency (Base Yr FY10 Dollars)
TOTAL COST (Base Yr FY10 Dollars)
RISK ADJUSTED
I-5 Alignment "Most Viable Alternative"B2-END + North Tie In + D5+B1 + C1
-$ -$ -$ -$ -$ -$ -$ -$ -$ -$ -$ -$ -$ -$ -$ -$ -$ -$ -$ -$ -$ -$ -$ -$ -$ -$ -$ -$ -$ -$ -$ -$ -$ -$ -$ -$ -$ -$ -$ -$ -$ -$
615,812,664$ -$ 615,812,664$ 327,107,874$ -$ 327,107,874$ 436,143,831$ -$ 436,143,831$
-$ -$ -$ 54,517,979$ -$ 54,517,979$
-$ -$ -$ -$ -$ -$
38,394,756$ -$ 38,394,756$ 1,471,977,105$ -$ 1,471,977,105$
11,910,009,269$ 2,704,331,062$ 14,614,340,331$ 521,901,608$
15,136,241,939$
15,136,241,939$
Appendix A - Detailed Cost Budgets
Page 12 of 12

CALIFORNIA HIGH-SPEED TRAIN PROJECT CONCEPTUAL I-5 CORRIDOR STUDY BAKERSFIELD TO SAN FERNANDO VALLEY (SYLMAR)
JANUARY 2012, REV 0
U.S. Department of Transportation Federal Railroad Administration Appendix B ‐ 1
APPENDIX B - I-5 ALIGNMENT RISK ANALYSIS METHODOLOGY AND RESULTS
Prepared by: Vladimir Kanevskiy 4 Jan 2012
Date
Checked by: Richard Smith 4 Jan 2012
Date
Reviewed by: Don Currie 4 Jan 2012
Date
Approved by: Mike Gillam 4 Jan 2012
Date

CALIFORNIA HIGH-SPEED TRAIN PROJECT CONCEPTUAL I-5 CORRIDOR STUDY BAKERSFIELD TO SAN FERNANDO VALLEY (SYLMAR)
JANUARY 2012, REV 0
U.S. Department of Transportation Federal Railroad Administration Appendix B ‐ 2
B1 Introduction
Because the engineering for the I-5 alignment has only been developed to a 5% design level lacking the benefit of the alternative analysis process already conducted for the Antelope Valley alignment alternatives, further risk analysis was performed to account for potential increases in cost resulting from further design development and community and stakeholder input.
The approach for this risk analysis is modeled on the Federal Transit Administration’s (FTA) risk assessment process. However the FTA’s beta model is primarily designed for controlling risk as a project progresses through detailed design and construction and so is not appropriate for distinguishing between 5% and 15% design levels.
The objectives of the risk analysis process were to identify available project information for the I-5 alignment and explore and analyze risks in order to reflect resulting level of uncertainty in the capital cost estimate. Figure B1-1 illustrates application of the risk analysis starting with the Base Cost Estimate (BCE) and arriving at Risk Adjusted Cost Estimate (RACE).
Figure B1-1 Evolution from Base Cost Estimate to Risk Adjusted Cost Estimate
The process is described in more detail below:
Take the categories which make up the base cost estimate (BCE).
Remove the allocated and unallocated contingency (see Appendix A).
Adjust individual categories based on a review of the cost estimates and underlying assumptions to determine the stripped, adjusted base cost (SABCE).
Adjust the allocated contingency for each cost category to recognize differences in relative risk due to the different stages of design development.
Recombine the SABCE plus risk adjusted allocated contingency and add in unallocated contingency to give a risk adjusted cost estimate (RACE).
• Consistent with Draft 2012 Business Plan estimating methodologies
• Based on assumed contingency
• Does not account for varying levels in design development below 15% design level
Base Cost Estimate (BCE)
• Remove Allocated/Unallocated Contingency
• Adjustments to relfect design criteria variances, scope discrepancies, anticipated construction means and methods
Stripped and Adjusted Base Cost Estimate
(SABCE) • Review potential uncertainty for each cost category
• Reflect assessed uncertainty in varyng contingency levels
• Reflect level of engineering in contingency levels
Risk Assessment
• Calculate Risk Adjusted Allocated Contingencies
• Add Unallocated Contingencies
• Combine with SABCE to arrive with Risk Adjusted Cost Estimate
Risk Adjusted Cost Estimate (RACE)

CALIFORNIA HIGH-SPEED TRAIN PROJECT CONCEPTUAL I-5 CORRIDOR STUDY BAKERSFIELD TO SAN FERNANDO VALLEY (SYLMAR)
JANUARY 2012, REV 0
U.S. Department of Transportation Federal Railroad Administration Appendix B ‐ 3
B2 Summary Results
Adjustments to the Stripped Base Cost Estimate as described above increased the total cost of the I-5 alignment and included the following:
Short tunnel method - tunnels under 1 mile in length cannot usually be constructed using a tunnel boring machine, as assumed in the I-5 Base Cost Estimate, but need to be constructed using the more expensive drill and blast technique.
Station cost adjustment –it has been assumed that a station in Santa Clarita will be more expensive than a station in Palmdale which was assumed to represent Santa Clarita station costs in the Base Cost Estimate.
Soundwall adjustment –an allowance for sound walls was not included the base cost estimate for I-5.
Santa Clarita mitigation – because the I-5 alignment through urban Santa Clarita has not been subject to the same level of public and stakeholder input as the Antelope Valley alignments, an additional allowance has been made to reflect the likely need to locally realign the route or change the construction method (for example from open cut to cut and cover tunnel).
Adjustments to contingencies accounted for environmental and right-of-way issues, uncertainties about ‘very high’ viaduct structures and uncertainties about rock quality for tunneling close to faults.
It should be noted that this approach is not able to fully account for the full (potential) impact of risks associated with obtaining land to construct the I-5 alternative. The direct cost of obtaining land has been increased for these alternatives, but this remains a small proportion of the total cost. However, if it is necessary to realign the route or increase tunnel lengths to reduce impacts, the cost increases arising from these changes could be much higher.
The costs of the I-5 alignment at the different stages of this risk analysis process are given in Table B2-1.
Table B2-1 Risk Analysis Stages Summary
Estimate Type I-5 alignment option
(billions)
Base Cost Estimate (BCE)
$13.5
BCE w/o contingency $11.0
Stripped, Adjusted BCE $11.9
Risk Adjusted Cost Estimate $15.1
A detailed account of adjustments to the I-5 alignment Base Cost Estimate individual cost categories resulting from the review of the cost estimate and underlying assumptions is summarized in Table B2-2 below.

CALIFORNIA HIGH-SPEED TRAIN PROJECT CONCEPTUAL I-5 CORRIDOR STUDY BAKERSFIELD TO SAN FERNANDO VALLEY (SYLMAR)
JANUARY 2012, REV 0
U.S. Department of Transportation Federal Railroad Administration Appendix B ‐ 4
Table B2-2 Adjustments to the I-5 Base Cost Estimate
Component I-5 Alignment Option
(billions)
Short tunnels +$570M
Special Trackwork -$35M
Stations +$17M
Soundwalls +$34M
Santa Clarita mitigation +$300M
Total Adjustment +$886M
The following Principle Risks and Uncertainties have been identified on the I-5 alignment alternative:
10.07 Tunnel: The San Gabriel Fault runs roughly parallel to and east of I-5 through Santa Clarita, crosses I-5 in Castaic and continues parallel to I-5 past Pyramid Lake. The alignment also crosses the San Andreas and Garlock faults at-grade or on shallow cut or fill near Tejon Pass.
40.04 Environmental mitigation: Wetlands, historic/archeology, parks, designated critical/essential habitats. Wildlife linkages could be impacted where the HST alignment is not in tunnel.
40.07 Purchase or lease of real estate: The I-5 alignment has not been subject to the same level of stakeholder and public comment, and detailed investigation of land values has not been carried out.
Having considered these risks, the allocated contingencies for each cost category that had been initially applied on the I-5 Base Cost Estimate (BCE) were subsequently adjusted as indicated in Table B5-1 (changed values are highlighted):
Table B5-1 Allocated Contingency Levels by Cost Category
Standard Cost Category No. Description
I-5 BCE Contingency
Levels
I-5 Risk Adjusted Contingency
Levels
10 Track Structures and Track
10.01 Track structure: Viaduct 15.0% 20.0%
10.02 Track structure: Major/Movable bridges 15.0% 15.0%

CALIFORNIA HIGH-SPEED TRAIN PROJECT CONCEPTUAL I-5 CORRIDOR STUDY BAKERSFIELD TO SAN FERNANDO VALLEY (SYLMAR)
JANUARY 2012, REV 0
U.S. Department of Transportation Federal Railroad Administration Appendix B ‐ 5
Standard Cost Category No. Description
I-5 BCE Contingency
Levels
I-5 Risk Adjusted Contingency
Levels
10.03 Track structure: Undergrade bridges 15.0% 15.0%
10.04 Track structure: Culverts and drainage structures
15.0% 15.0%
10.05 Track structure: Cut and Fill (> 4' height/depth)
25.0% 25.0%
10.06 Track structure: At-grade (grading and subgrade stabilization)
15.0% 15.0%
10.07 Track structure: Tunnel 25.0% 30%
10.08 Track structure: Retaining walls and systems
20.0% 20.0%
10.09 Track new construction: Conventional ballasted
15.0% 15.0%
10.10 Track new construction: Non-ballasted 15.0% 15.0%
10.11 Track rehabilitation: Ballast and surfacing
15.0% 15.0%
10.12 Track rehabilitation: Ditching and drainage
15.0% 15.0%
10.13 Track rehabilitation: Component replacement (rail, ties, etc)
15.0% 15.0%
10.14 Track: Special track work (switches, turnouts, insulated joints)
15.0% 15.0%
10.15 Track: Major interlocking 15.0% 15.0%
10.16 Track: Switch heaters (with power and control)
15.0% 15.0%
10.17 Track: Vibration and noise dampening 15.0% 15.0%
10.18 Other linear structures including fencing, sound walls
20.0% 20.0%
20 Stations, Terminals, Intermodal 25% 25%
30 Support Facilities: Yards, Shops, Administrative Buildings
25% 25%
40 Sitework, Right of Way, Land, Existing Improvements
40.01 Demolition, clearing, site preparation 25% 25%
40.02 Site utilities, utility relocation 25% 25%
40.03 Hazardous material, contaminated soil removal/mitigation, ground water treatments
20% 20%
40.04 Environmental mitigation: wetlands, historic/archeology, parks
20% 25%
40.05 Site structures including retaining walls, sound walls
25% 25%
40.06 Temporary facilities and other indirect costs during construction
10% 10%
40.07 Purchase or lease of real estate 20% 40%

CALIFORNIA HIGH-SPEED TRAIN PROJECT CONCEPTUAL I-5 CORRIDOR STUDY BAKERSFIELD TO SAN FERNANDO VALLEY (SYLMAR)
JANUARY 2012, REV 0
U.S. Department of Transportation Federal Railroad Administration Appendix B ‐ 6
Standard Cost Category No. Description
I-5 BCE Contingency
Levels
I-5 Risk Adjusted Contingency
Levels
40.08 Highway/pedestrian overpass/grade separations
25% 25%
40.09 Relocation of existing households and businesses*
0% 0%
50 Communications & Signaling 15% 15%
60 Electric Traction 15% 15%
70 Vehicles 0% 0%
80 Professional Services 0% 0% * Estimated as part of SCC 40.07