pkcε phosphorylation of ryr2: a novel link between
TRANSCRIPT

PKCε Phosphorylation of RyR2:
A Novel Link between Diabetes and Arrhythmia.
Alexander Wong
Supervisor: Dr. Peter Jones
A thesis submitted in partial fulfilment for the degree of
Bachelor of Biomedical Science with Honours University of Otago
Dunedin, New Zealand
October 2017

ii
Abstract
Cardiovascular disease (CVD) is the leading cause of death in the world. Arrhythmia is a type
of CVD which can be caused by store overload induced calcium (Ca2+) release (SOICR) in
cardiomyocytes. SOICR occurs through the cardiac ryanodine receptor (RyR2). RyR2
phosphorylation is known to be a cause of SOICR. Patients with diabetes (DM) have an
increased risk of arrhythmia as well as an increase in RyR2 phosphorylation by certain kinases.
One kinase activated in DM is Protein Kinase C (PKC). PKC isoforms; α, ε, β2 and δ have an
increased activity in the DM heart. Our study aimed to determine the effect of PKC on RyR2
in regard to SOICR. We hypothesised that activation or overexpression of PKC would result in
an increase in SOICR consistent with RyR2 phosphorylation by other kinases. SOICR was
examined in HEK293 cells expressing RyR2 with or without PKC overexpression in the
presence and absence of a PKC activator (Dic8) and inhibitor (Go6983). Dic8, as well as
Go6983, resulted in an increase in the occurrence of SOICR. Recent studies in the lab show
that ATP analogues directly affect RyR2 resulting in SOICR, making the results of Go6983
hard to interpret. Overexpression of PKCα, with or without Dic8, resulted in small increase in
the occurrence of SOICR. However, overexpression of PKCε, with or without Dic8, resulted in
a large increase in the occurrence of SOICR. The propensity for SOICR is determined by the
sensitivity of RyR2 to sarcoplasmic reticulum (SR) Ca2+. To study if PKC altered the sensitivity
of RyR2 to SR Ca2+ a SR targeted Ca2+ sensing protein, D1ER, was used. Overexpression of
PKCα resulted in no change in the sensitivity of RyR2 to SR Ca2+, however, consistent with the
increase in the propensity for SOICR, PKCε resulted in an increase in the sensitivity of RyR2
to SR Ca2+. Our data indicate that akin to other kinases, PKCε can increase SOICR through the
RyR2 due to an increase in RyR2’s sensitivity to SR Ca2+. These findings may represent a novel
link through which DM mediated changes in cell signalling increase the risk of arrhythmias.

iii
Acknowledgements
Firstly, I would like to give my thanks and appreciation to my supervisor Dr. Peter Jones. Thank
you for always having your door open to me when I needed help. I am very grateful for all the
ongoing support, constructive feedback and guidance you have given me throughout this year.
I am grateful to have been a part of such stimulating research in the Jones Laboratory.
Many thanks to Janet McLay, our assistant research fellow, for giving up her time to teach me
the experimental protocols that I needed for my project. I would also like to thank the rest of
the Jones Laboratory; Akash Chakraborty, Luis Gonano, Michelle Munro and Callum Tanner,
for not only their expertise and the enormous help they have given me throughout this year, but
also the close friendships I have formed with them.
To the Department of Physiology and the School of Biomedical Sciences, thank you for the
opportunities I have been given and the environment you have provided to allow me to grow
and thrive. Through the School of Biomedical Sciences, I am honoured to have received the
inaugural Elizabeth Jean Trotter Scholarship, donated by Dr. Hugh Bodle, that has helped me
immensely with my finances as well as my confidence in my ability to succeed.
To my wonderful and beautiful Fiancé, Mika Smith, and my family; thank you for your support,
strength, and belief in me. To my fellow honours students; Kevin Jagau, Hamish Aitken-Buck,
Caitlin Arpel and Rachael Iremonger, thank you for your companionship. I have enjoyed all
our cheerful conversations through a tough yet exciting year.
I would like to dedicate this thesis to my beloved uncle, Francis Wong, whom sadly passed
away in late November this year.

iv
Table of Contents
Abstract ....................................................................................................................................... ii
Acknowledgements ................................................................................................................... iii
Table of Contents ...................................................................................................................... iv
List of Figures .......................................................................................................................... viii
List of Tables ............................................................................................................................. ix
List of Abbreviations .................................................................................................................. x
1 Introduction ........................................................................................................................ 1
1.1 Diabetes ....................................................................................................................... 1
1.1.1 Diabetic Heart Disease ......................................................................................... 1
1.2 Contraction of the Heart .............................................................................................. 2
1.2.1 Heart Conduction .................................................................................................. 2
1.2.2 Excitation-Contraction Coupling .......................................................................... 3
1.3 Arrhythmia ................................................................................................................... 4
1.3.1 Store Overload Induced Ca2+ Release .................................................................. 4
1.3.2 RyR2 Modifications ............................................................................................. 6
1.4 PKC .............................................................................................................................. 8
1.4.1 Structure of PKC .................................................................................................. 9
1.4.2 Activation of PKC .............................................................................................. 10
1.4.3 PKC Activity in Diabetes ................................................................................... 11
1.5 Aims and Hypothesis ................................................................................................. 13
2 Methods ............................................................................................................................ 14

v
2.1 Cell Culture ................................................................................................................ 14
2.1.1 Preparation of HEK293 Cells for Subculture ..................................................... 14
2.1.2 Subculture ........................................................................................................... 14
2.1.3 Preparation of HEK293 Cells for Imaging ......................................................... 15
2.1.4 HEK293 cDNA Transfection ............................................................................. 16
2.1.5 Induction of RyR2 Expression ........................................................................... 16
2.2 Single-cell Imaging .................................................................................................... 17
2.2.1 Cytosolic Ca2+ Imaging ...................................................................................... 17
2.2.2 Luminal Ca2+ Imaging ........................................................................................ 18
2.3 Western Blot .............................................................................................................. 20
2.3.1 Collection of HEK293 Cell Lysates ................................................................... 20
2.3.2 Preparation of Polyacrylamide Gels ................................................................... 21
2.3.3 Sample Preparation for SDS-PAGE ................................................................... 23
2.3.4 SDS-PAGE ......................................................................................................... 23
2.3.5 Membrane Transfer ............................................................................................ 23
2.3.6 Membrane Blotting ............................................................................................. 24
2.3.7 Membrane Developing ....................................................................................... 24
2.3.8 Western blot analysis .......................................................................................... 25
2.4 Statistical Analysis ..................................................................................................... 25
3 Results .............................................................................................................................. 26
3.1 Cell Viability .............................................................................................................. 26
3.2 Endogenous PKC ....................................................................................................... 26
vi
3.2.1 Cytosolic Ca2+ Imaging ...................................................................................... 26
3.3 PKCα Overexpression ............................................................................................... 31
3.3.1 Western Blot Analysis ........................................................................................ 31
3.3.2 Cytosolic Ca2+ Imaging ...................................................................................... 33
3.3.3 Luminal Ca2+ Imaging ........................................................................................ 37
3.4 PKCε Overexpression ................................................................................................ 41
3.4.1 Cytosolic Ca2+ Imaging ...................................................................................... 41
3.4.2 Luminal Ca2+ Imaging ........................................................................................ 45
4 Discussion ......................................................................................................................... 47
4.1 Results ........................................................................................................................ 47
4.1.1 PKC Activation Effect on SOICR ...................................................................... 49
4.1.2 PKC Inhibition Effect on SOICR ....................................................................... 50
4.1.3 Effect of PKCα Overexpression on SOICR ....................................................... 50
4.1.4 Effect of PKCε Overexpression on SOICR ........................................................ 51
4.2 Proposed Model of Action of PKCε on SOICR ........................................................ 52
4.2.1 PKCε Phosphorylation of RyR2 ......................................................................... 52
4.2.2 CaMKII Phosphorylation of RyR2 ..................................................................... 53
4.2.3 Oxidation of RyR2 ............................................................................................. 54
4.3 Limitations ................................................................................................................. 56
4.4 Future Steps ............................................................................................................... 57
4.4.1 Cellular Studies .................................................................................................. 57
4.4.2 Animal Studies ................................................................................................... 58

vii
4.5 Summary .................................................................................................................... 59
References ................................................................................................................................ 60
viii
List of Figures
Figure 1.1 Conduction of the Heart. ........................................................................................... 2
Figure 1.2 Excitation Contraction Coupling. ............................................................................. 3
Figure 1.3 SOICR. ...................................................................................................................... 5
Figure 1.4 RyR2 – Multi-phosphorylation Site Model. ............................................................. 7
Figure 1.5 Structure of PKC isoforms. ....................................................................................... 9
Figure 1.6 Activation of PKC through GPCR. ......................................................................... 11
Figure 1.7 Formation of AGE’s ................................................................................................ 12
Figure 2.1 Luminal Ca2+ Fluorescent Trace. ............................................................................ 20
Figure 3.1 HEK293 Cells Visualised Using Microscopy. ........................................................ 26
Figure 3.2 Dic8 Increases the Occurrence of SOICR. .............................................................. 28
Figure 3.3 Go6983 Increases the Occurrence of SOICR. ........................................................ 30
Figure 3.4 PKCα Transfection Results in Robust Expression. ................................................. 32
Figure 3.5 PKCα has a Small Effect on the Occurrence of SOICR. ........................................ 34
Figure 3.6 Dic8 does not Further Increase the Effect of PKCα Overexpression. .................... 36
Figure 3.7 PKCα Reduces Store Size. ...................................................................................... 38
Figure 3.8 Overexpression of PKCα with Dic8 Reduces Release Threshold. ......................... 40
Figure 3.9 PKCε Increases the Occurrence of SOICR. ............................................................ 42
Figure 3.10 Dic8 does not Further Increase the Effect on the Occurrence of SOICR in Cells
Transfected with PKCε. ............................................................................................................ 44
Figure 3.11 PKCε reduces release and termination threshold. ................................................. 46
Figure 4.1 Proposed Model: PKCε Mediated Phosphorylation of RyR2 Linking DM to
Arrhythmia. .............................................................................................................................. 53
Figure 4.2 Proposed Model: PKCε Activation of CaMKII Links DM to Arrhythmia. ............ 54
Figure 4.3 Proposed Model: PKCε Mediated Oxidation of RyR2 Links DM to arrhythmia. .. 55

ix
List of Tables
Table 2.1 Running Gel ............................................................................................................. 22
Table 2.2 Stacking Gel ............................................................................................................. 22
x
List of Abbreviations
AF Atrial Fibrillation
AFL Atrial Flutter
AGE Advanced Glycated End Products
ANOVA Analysis of Variance
aPKC Atypical PKC
APS Ammonium Persulfate
AV Atrioventricular
BSA Bovine Serum Albumin
Ca2+ Calcium Ion
CaMKII Ca2+/Calmodulin-Dependant Protein Kinase II
CFP Cyan Fluorescent Protein
CICR Ca2+ Induced Ca2+ Release
CPC Cardiac Pacemaker Cells
cPKC Conventional PKC
CPVT Catecholaminergic Polymorphic Ventricular Tachycardia
CVD Cardiovascular Disease
DAD Delayed After Depolarisation
Dic8 1,2-Dioctanoyl-sn-Glycerol
DM Diabetes Mellitus
DMEM Dulbecco's Modified Eagle's Medium
EDTA Ethylenediaminetetraacetic Acid
F Fluorescence Resonance Energy Transfer
FBS Fetal Bovine Serum
GAPDH Glyceraldehyde 3-Phosphate Dehydrogenase
GPCR-αq G-Protein Coupled Receptor αq

xi
HEK293 Human Embryonic Kidney 293
HRP Horseradish Peroxidase
IP3 Inositol 1,4,5-Triphosphate
KRH Krebs-Ringer HEPES
NCX Na+ Ca2+ Exchanger
NEAA Non-Essential Amino Acids
n Sample Size
nPKC Novel PKC
PAGE Polyacrylamide Gel Electrophoresis
PBS Phosphate Buffered Saline
PBS-T PBS Tween-20
PDK1 Pyruvate Dehydrogenase Kinase 1
PIP2 Inositol Phospholipids
PIP3 Phosphatidylinositol (3,4,5)-Trisphosphate
PKA Protein Kinase A
PKC Protein Kinase C
PKG Protein Kinase G
PLC Phospholipase-C
PM Plasma Membrane
PMCA Plasma Membrane Ca2+ ATPase
RA Right Atrium
ROI Region of Interest
RyR2 Ryanodine Receptor 2
S Serine Residue
SA Sinoatrial
SB Sample Buffer

xii
SEM Standard Error of the Mean
SERCA Sarco/Endoplasmic Reticulum Ca2+ ATPase
SDS Sodium Dodecyl Sulfate
SOICR Store Overload-Induced Ca2+ Release
SR Sarcoplasmic Reticulum
TEMED Tetramethylethylenediamine
YFP Yellow Fluorescent Protein

1
1 Introduction
1.1 Diabetes
Diabetes mellitus (DM) is a disease characterised by hyperglycemia, and is clinically diagnosed
as a fasting blood plasma glucose level ≥7.0 mmol/L (Zimmet et al., 2001). There are two types
of DM; type 1, a T-lymphocyte autoimmune disease which accounts for approximately 10% of
all DM, and type 2 a metabolic disorder which accounts for approximately 90% of all DM
(Zimmet et al., 2001). The worldwide prevalence of DM has almost doubled from 1980 (4.7%)
to 2014 (8.5%) and is still on the rise (NCD Risk Factor Collaboration, 2016). In 2014, it was
estimated 3.7 million deaths were attributed to DM worldwide where over 50% were
cardiovascular disease (CVD) related (NCD Risk Factor Collaboration, 2016).
1.1.1 Diabetic Heart Disease
Patients with DM are known to have many CVD’s, including; microangiopathy,
macroangiopathy, cardiomyopathy, and arrhythmias, all of which are related due to many
molecular and biochemical changes that can occur in hyperglycemic environments (Grundy et
al., 1999). Diabetic micro/macro-angiopathy has been well described in the literature, as most
DM patients will experience some form of vessel dysfunction, which can result in retinopathy,
nephropathy, or neuropathy (Alonso-Moran et al., 2014). In addition to vessel disease, one
epidemiological study comparing 293,124 DM against 552,624 non-DM hospitalized patients,
between the years 1990 and 2000, showed an increase in the percent occurrences of atrial
fibrillation (AF) and atrial flutter (AFL) in DM compared to the non-DM (14.9% versus 10.3%,
and 4% versus 2.5%, respectively) (Movahed et al., 2005). The increased association and risk
of arrhythmia in DM patients increases the risk of heart failure and death in these patients
(Siscovick et al., 2010).

2
1.2 Contraction of the Heart
1.2.1 Heart Conduction
The heart beats due to spontaneous electrical activity generated by cardiac pacemaker cells
(CPCs) in the sinoatrial (SA) node, located in the upper region of the right atrium (RA). CPCs
in the SA node generate a wave of electrical activity which propagates down towards the
atrioventricular (AV) node, located in the lower region of the RA (Figure 1.1). Here, the wave
of electrical activity is then sent down the bundle of His fibres which are located within the
intraventricular septum, before moving through the Purkinje fibres which are located around
the walls of the left and right ventricular walls (Figure 1.1). Electrical stimulation of
cardiomyocytes results in a coordinated contraction of the myocardium, as cardiomyocytes are
all connected by intercalated discs that contain desmosomes (physical connection) and gap
junctions (electrical connection) (Saffitz, 2005). This process results in rhythmic contraction
and relaxation of the heart.
Figure 1.1 Conduction of the Heart.
CPCs in the SA node send electrical activity that propagates down to the AV node followed by
the Bundle of His then through the Purkinje fibres in the left and right ventricles. Adapted from
Wiley et al., 2011.

3
1.2.2 Excitation-Contraction Coupling
The propagating electrical signal must be converted to a chemical one to drive contraction; this
process is known as excitation-contraction coupling (Sandow, 1952). Electrical activity
generated by the pacemaker cells in the heart described in Section 1.2.1, results in a change in
the membrane potential at the level of cardiomyocytes resulting in the opening of voltage-gated
L-type calcium (Ca2+) channels on the plasma membrane (PM), slightly raising the tightly
regulated Ca2+ concentration in the cytosol (Figure 1.2) (Aronsen et al., 2013). This slight Ca2+
increase activates the ryanodine receptor 2 (RyR2), which is a Ca2+ release channel located on
the sarcoplasmic reticulum (SR) membrane (Figure 1.2) (Zhang et al., 2015). Activation of the
RyR2 causes a large amount of Ca2+ to be released into the cytosol from the SR, a process
termed Ca2+ induced Ca2+ release (CICR), which is sufficient for contraction of the heart (Figure
1.2) (Aronsen et al., 2013). The high Ca2+ concentration in the cytosol is then either recycled
into the SR by the sarco/endoplasmic reticulum Ca2+ ATPase (SERCA) or extruded out of the
cell through the Na+ Ca2+ exchanger (NCX) or the PM Ca2+ ATPase (PMCA) channel, to
prepare for the sequential contraction of the heart (Figure 1.2) (Eisner et al., 2013).
Figure 1.2 Excitation Contraction Coupling.
The opening of the LTCC after depolarisation of the PM allows for Ca2+ entry into the
cardiomyocyte. Ca2+ activates the RyR2 allowing for CICR from the SR. Ca2+ binds to the
myofilament allowing for contraction of the cell. Ca2+ is then recycled into the SR via SERCA
and removed from the cell via the NCX and PMCA. Created with Microsoft PowerPoint.
4
1.3 Arrhythmia
Cardiac arrhythmia is a CVD characterised by an irregular heartbeat, which can be clinically
diagnosed using electrocardiography, where any changes in the normal conduction of the heart,
described in Section 1.2.1, is considered cardiac arrhythmia (Grace & Roden, 2012). There are
many factors that can cause arrhythmia, however, one underlying factor is the disruption of
Ca2+ handling proteins in cardiomyocytes (Wagner et al., 2015). In particular, an increased
activity of the RyR2 can result in arrhythmia due to spontaneous Ca2+ leak from the SR (Jones
et al., 2008). The clinical implications of arrhythmia can vary from mild outcomes, such as
reducing the quality of life, to severe outcomes including sudden cardiac death (Grace & Roden,
2012).
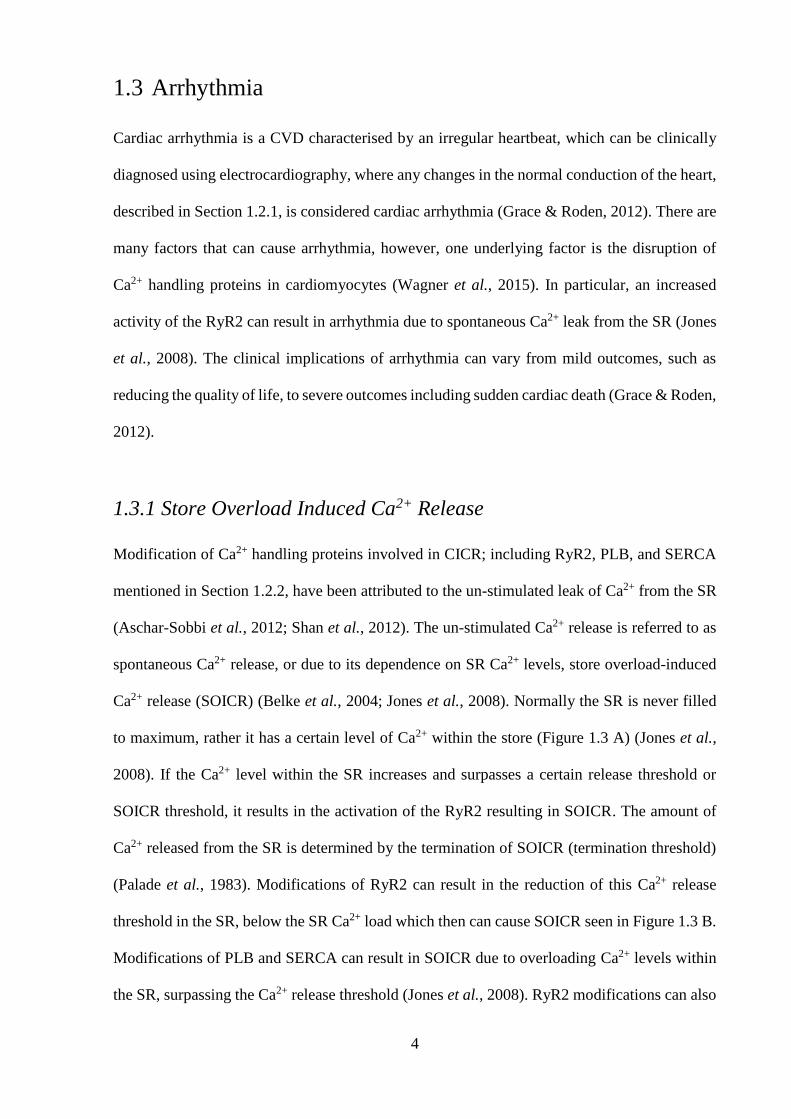
1.3.1 Store Overload Induced Ca2+ Release
Modification of Ca2+ handling proteins involved in CICR; including RyR2, PLB, and SERCA
mentioned in Section 1.2.2, have been attributed to the un-stimulated leak of Ca2+ from the SR
(Aschar-Sobbi et al., 2012; Shan et al., 2012). The un-stimulated Ca2+ release is referred to as
spontaneous Ca2+ release, or due to its dependence on SR Ca2+ levels, store overload-induced
Ca2+ release (SOICR) (Belke et al., 2004; Jones et al., 2008). Normally the SR is never filled
to maximum, rather it has a certain level of Ca2+ within the store (Figure 1.3 A) (Jones et al.,
2008). If the Ca2+ level within the SR increases and surpasses a certain release threshold or
SOICR threshold, it results in the activation of the RyR2 resulting in SOICR. The amount of
Ca2+ released from the SR is determined by the termination of SOICR (termination threshold)
(Palade et al., 1983). Modifications of RyR2 can result in the reduction of this Ca2+ release
threshold in the SR, below the SR Ca2+ load which then can cause SOICR seen in Figure 1.3 B.
Modifications of PLB and SERCA can result in SOICR due to overloading Ca2+ levels within
the SR, surpassing the Ca2+ release threshold (Jones et al., 2008). RyR2 modifications can also

5
result in a reduction in the termination threshold, resulting in an increased amount of Ca2+ every
time RyR2 is activated seen in Figure 1.3 C (Tang et al., 2012). A reduction of termination
threshold does not result in SOICR, however, the combination of reduced termination threshold
along with release threshold would result in an increased occurrence of SOICR along with a
high amount of Ca2+ leak resulting in elevated cytosolic Ca2+ levels, Figure 1.3 D.
Figure 1.3 SOICR.
(A) The SR is filled with a certain level of Ca2+ (blue) where if this level would increase over
the SOICR threshold it would result in SOICR. After activation of the RyR2 in CICR, only a
proportion of Ca2+ is released to ensure the SR does not get emptied completely. (B)
Modification of the RyR2 can result in a reduction of the SOICR threshold, increasing the
occurrence of SOICR. (C) Modification of RyR2 can result in a reduction in termination of
SOICR, releasing a higher proportion of Ca2+ when activated. (D) A combination of a decreased
SOICR threshold and termination of SOICR results high a large SOICR event. Created with
Microsoft PowerPoint.
As Ca2+ levels are tightly regulated in the cytosol of cardiomyocytes, an increase in Ca2+ release
due to SOICR must be adequately removed by an increase of SERCA or the NCX activity. An
increase in SERCA activity is not effective at reducing the Ca2+ levels, as an increased uptake
of Ca2+ into the SR would result in a sequential SOICR event. As a result, the high amounts of
Ca2+ in the cytosol must be extruded by increased activity of NCX (Venetucci et al., 2007).
NCX is effective at maintaining the Ca2+ levels during SOICR events, however, because it is
6
an electrogenic exchanger, one Ca2+ ion out of the cytosol into the extracellular space for three
Na+ ions from the extracellular space into the cytosol, removal of high amounts of Ca2+ results
in an elevated level of Na+ within the cytosol (Venetucci et al., 2007). An increase of cations
within the cytosol causes an increase in the membrane potential, which can then result in the
depolarization of the cardiomyocyte membrane, considered as delayed after depolarisation
(DAD) (Bers, 2002; Belke et al., 2004; Venetucci et al., 2007). If there are enough
cardiomyocytes experiencing DAD’s, the electrical depolarization can be propagated
throughout the whole heart due to the electrical connection between the cardiomyocytes
(Saffitz, 2005). The occurrence of these DAD’s throughout the whole heart leads to contraction
of the heart, in the absence of a pacemaker depolarization wave, resulting in arrhythmia
(Houser, 2000).
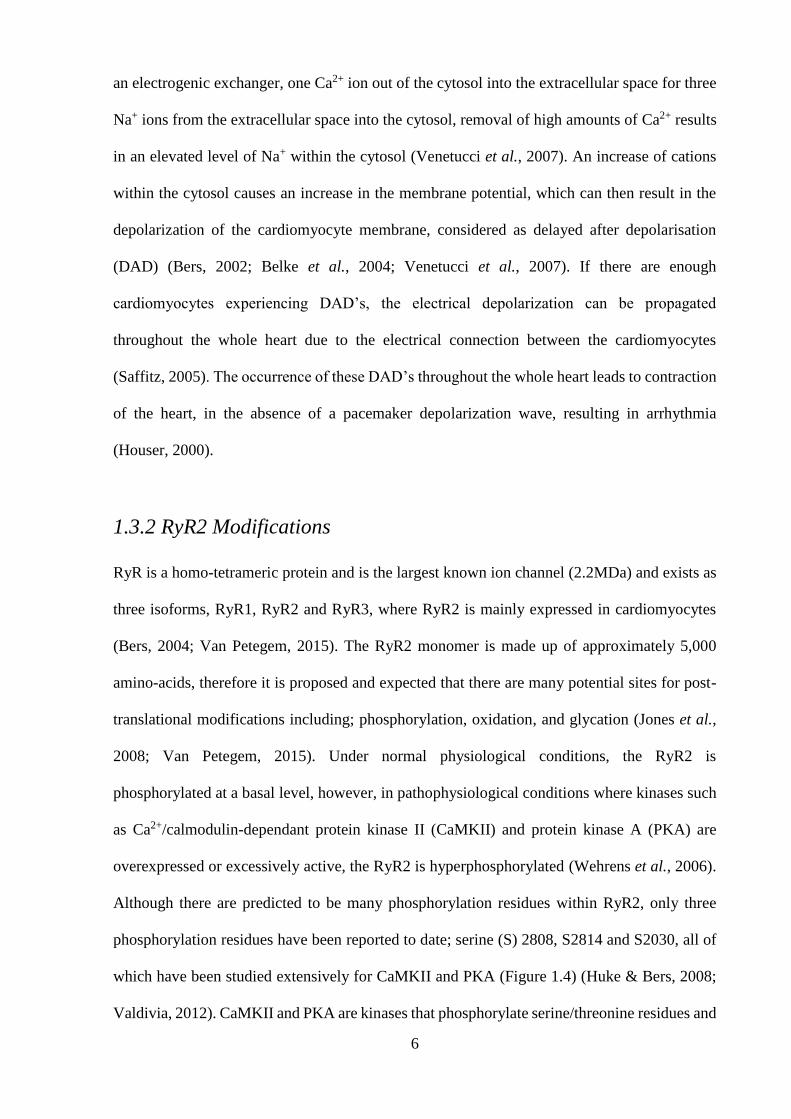
1.3.2 RyR2 Modifications
RyR is a homo-tetrameric protein and is the largest known ion channel (2.2MDa) and exists as
three isoforms, RyR1, RyR2 and RyR3, where RyR2 is mainly expressed in cardiomyocytes
(Bers, 2004; Van Petegem, 2015). The RyR2 monomer is made up of approximately 5,000
amino-acids, therefore it is proposed and expected that there are many potential sites for post-
translational modifications including; phosphorylation, oxidation, and glycation (Jones et al.,
2008; Van Petegem, 2015). Under normal physiological conditions, the RyR2 is
phosphorylated at a basal level, however, in pathophysiological conditions where kinases such
as Ca2+/calmodulin-dependant protein kinase II (CaMKII) and protein kinase A (PKA) are
overexpressed or excessively active, the RyR2 is hyperphosphorylated (Wehrens et al., 2006).
Although there are predicted to be many phosphorylation residues within RyR2, only three
phosphorylation residues have been reported to date; serine (S) 2808, S2814 and S2030, all of
which have been studied extensively for CaMKII and PKA (Figure 1.4) (Huke & Bers, 2008;
Valdivia, 2012). CaMKII and PKA are kinases that phosphorylate serine/threonine residues and

7
are normally auto-inhibited due to their respective regulatory domain blocking the catalytic
sites of the kinase (Zhang et al., 2012; Erickson, 2014). There is a large debate on the functional
effect of phosphorylation of these three RyR2 residues; however, intracellular Ca2+ imaging,
when hyperphosphorylated at Serine 2808, shows Ca2+ leak (Fischer et al., 2015). It is proposed
that hyperphosphorylation of the RyR2 can result in a reduction in the release threshold, causing
SOICR events, which is linked to arrhythmias (Xiao et al., 2007). Because many kinases
phosphorylate serine/threonine residues, an abundance of serine and threonine residues within
RyR2 make it plausible to assume that there may be many other kinases and phosphorylation
sites that could affect the activity of RyR2.
Figure 1.4 RyR2 – Multi-phosphorylation Site Model.
Proposed model of RyR2 showing a specific phosphorylation “hot spot”. Within this “hot spot”
serine 2808, 2811 and 2814 are proposed to be able to be phosphorylated by PKA and CaMKII.
Image taken from (Valdivia, 2012).
As mentioned, pathophysiological conditions can result in an increased activity of kinases
including CaMKII and PKA. Acute hyperglycemic environments have shown to cause the
addition of O-linked glycosylation at the serine 279 region of CaMKII (Erickson et al., 2013).

8
This O-linked glycosylation modification of CaMKII results in overactivation of the kinase,
leading to spontaneous Ca2+ release from the SR, which had been also linked with
arrhythmogenesis (Erickson et al., 2013). Similarly, the hyperglycaemic environment in DM
increases the production of diacylglycerol (DAG) an agonist for protein kinase C (PKC) (Xia
et al., 1994). PKC and protein kinase G (PKG) are two other kinases that have been shown to
be able to phosphorylate the RyR2, although their effect and the residues targeted are unknown
(Takasago et al., 1991).
1.4 PKC
PKC is a family of kinases that can regulate the activity of proteins via phosphorylation of
hydroxyl groups on serine or threonine amino acid residues (Newton, 2003). The PKC family
contains 15 different isoforms within humans, all of which are divided into 3 separate
subfamilies based on their activation requirements; conventional (cPKC), novel (nPKC) and
atypical (aPKC) (Newton, 2003). PKC’s function has been well described in cell proliferation,
cell survival and cell apoptosis, where changes in PKC expression have been linked to many
diseases including cancer, Alzheimer’s disease and DM (Hongpaisan et al., 2011; Liao et al.,
2013; Maurya & Vinayak, 2015). In the heart, PKC has been shown to be involved in
myocardial infarction, acute reperfusion injury, compensatory hypertrophy and vascular
dysfunction (Braz et al., 2004; Mochly-Rosen et al., 2012; Newton et al., 2016). Western blot
analysis shows that within a rat heart, PKC isoforms; α, β2, δ, ε and γ are expressed, with PKCα
as the most expressed isozyme in the human heart (Borghini et al., 1994; Ping et al., 1997;
Simonis et al., 2007; Geraldes & King, 2010).

9
1.4.1 Structure of PKC
All PKC isoforms contain a regulatory domain connected to a catalytic domain via a hinge
region (Geraldes & King, 2010; Steinberg, 2012). Among all three subfamilies of PKC, the
catalytic domain is conserved (Geraldes & King, 2010; Steinberg, 2012). The catalytic domain
contains a C3 region, specific for ATP binding and a C4 region, for substrate binding (Figure
1.5) (Geraldes & King, 2010; Steinberg, 2012). Within the regulatory domain is a
pseudosubstrate region, which contains a small amino acid sequence that binds and inhibits the
catalytic domain (Geraldes & King, 2010; Steinberg, 2012). The subfamilies differ in the
regulatory domain. cPKC and the nPKC subfamilies contain a C1 region within the regulatory
domain, for the binding of DAG (Figure 1.5) (Geraldes & King, 2010). cPKC is the only
subfamily with a C2 region that has a Ca2+ binding/sensor (Figure 1.5) (Geraldes & King, 2010).
Figure 1.5 Structure of PKC isoforms.
cPKC, nPKC, and aPKC contain a regulatory domain connected to the catalytic domain via the
hinge region. In cPKC’s, the regulatory domain contains a C1 region for DAG binding and a
C2 region for Ca2+ binding to activation of the kinase. In nPKC’s, the regulatory domain
contains a C1 region for DAG binding for activation of the kinase. In aPKC’s, the regulatory
domain contains a PB1 region for phosphatidylinositols binding for activation of the kinase.
The catalytic domain containing a C3, ATP binding region and a C4, substrate binding region.
Pseudosubstrate within the regulatory domain region inhibits the catalytic domain in all 3 sub-
classes. Image taken from (Geraldes & King, 2010).
10
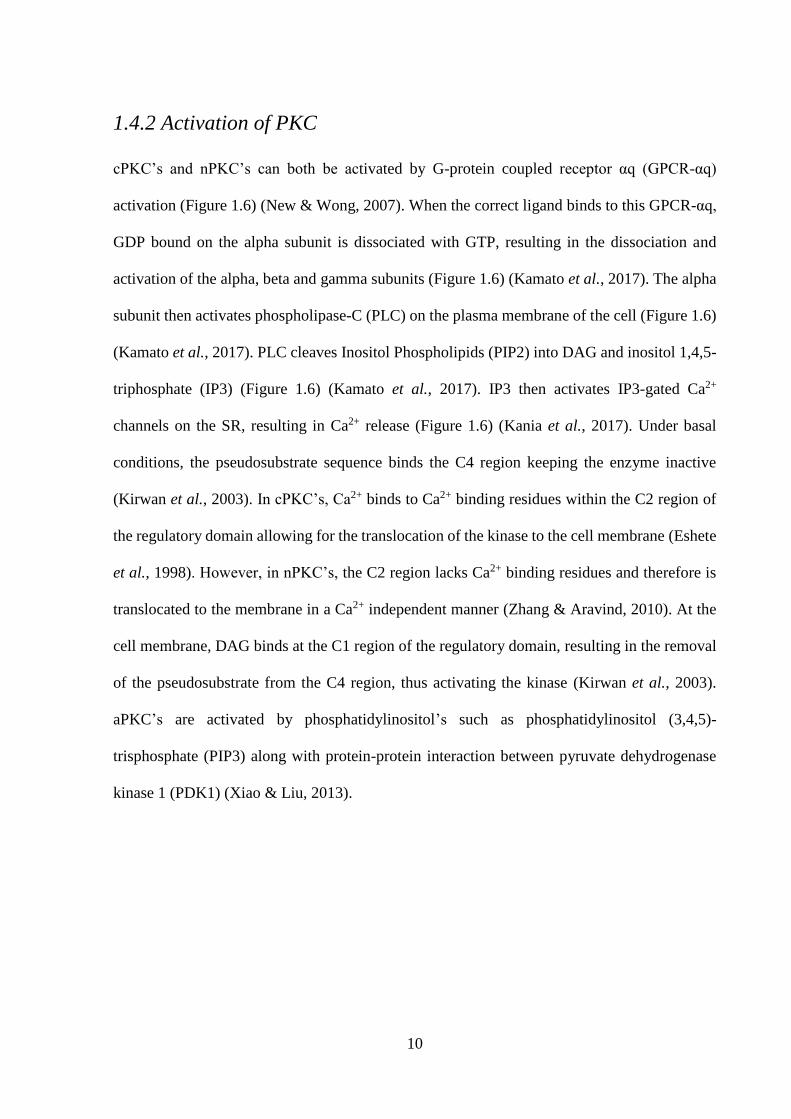
1.4.2 Activation of PKC
cPKC’s and nPKC’s can both be activated by G-protein coupled receptor αq (GPCR-αq)
activation (Figure 1.6) (New & Wong, 2007). When the correct ligand binds to this GPCR-αq,
GDP bound on the alpha subunit is dissociated with GTP, resulting in the dissociation and
activation of the alpha, beta and gamma subunits (Figure 1.6) (Kamato et al., 2017). The alpha
subunit then activates phospholipase-C (PLC) on the plasma membrane of the cell (Figure 1.6)
(Kamato et al., 2017). PLC cleaves Inositol Phospholipids (PIP2) into DAG and inositol 1,4,5-
triphosphate (IP3) (Figure 1.6) (Kamato et al., 2017). IP3 then activates IP3-gated Ca2+
channels on the SR, resulting in Ca2+ release (Figure 1.6) (Kania et al., 2017). Under basal
conditions, the pseudosubstrate sequence binds the C4 region keeping the enzyme inactive
(Kirwan et al., 2003). In cPKC’s, Ca2+ binds to Ca2+ binding residues within the C2 region of
the regulatory domain allowing for the translocation of the kinase to the cell membrane (Eshete
et al., 1998). However, in nPKC’s, the C2 region lacks Ca2+ binding residues and therefore is
translocated to the membrane in a Ca2+ independent manner (Zhang & Aravind, 2010). At the
cell membrane, DAG binds at the C1 region of the regulatory domain, resulting in the removal
of the pseudosubstrate from the C4 region, thus activating the kinase (Kirwan et al., 2003).
aPKC’s are activated by phosphatidylinositol’s such as phosphatidylinositol (3,4,5)-
trisphosphate (PIP3) along with protein-protein interaction between pyruvate dehydrogenase
kinase 1 (PDK1) (Xiao & Liu, 2013).

11
Figure 1.6 Activation of PKC through GPCR.
Binding of a ligand results in a downstream pathway resulting in activation of PLC which
cleaves PIP2 into IP3 and DAG. IP3 then causes Ca2+ release from the SR. Ca2+ allows for the
translocation of cPKC to the PM to interact with DAG for activation. DAG alone can activate
nPKC. Created with Microsoft PowerPoint.
1.4.3 PKC Activity in Diabetes
The chronic hyperglycaemic environments seen in DM results in many molecular and
biochemical changes which underlie the multitude of pathologies associated with DM. In
normal physiological states, many proteins/lipids are glycosylated, with the covalent bonding
of sugar molecules added to them with enzymatic control (Aebi, 2013). However,
hyperglycemic environments can result in glycation, covalent bonding of sugar molecules to
proteins and lipids without enzymatic function within hours (Adrover et al., 2008). These
glycated proteins/lipids (Schiff bases) can then be turned into Amadori products if the
hyperglycaemic environment persists, both of which are reversible using glycaemic control
(Figure 1.7) (Pieters et al., 2007). Within weeks or months of chronic hyperglycaemic

12
environments, as seen in DM, Amadori products then become irreversible advanced glycated
end products (AGE’s) (Figure 1.7) (Stitt et al., 1998). AGE’s can then result in
pathophysiological changes resulting in inflammation, oxidative stress, and fibrosis which are
linked to vascular dysfunction (Bodiga et al., 2014). Schiff bases, as well as Amadori products,
can also lead to reactive intermediates (Figure 1.7) (Puttaiah et al., 2006). These reactive
intermediates can then result in many physiological changes including increasing the synthesis
of DAG (Xia et al., 1994). In the DM rat heart, PKC isoforms α, ε, β2 and δ have an increased
activity, however, the consequence of each individual isoform is not well understood (Geraldes
& King, 2010).
Figure 1.7 Formation of AGE’s
Glycation of proteins and lipids in the presence of glucose form Schiff bases. Within
Weeks/Months, there is a build of reactive intermediates and AGEs seen in DM. It is the
reactive intermediates that result in an increase in DAG in DM patients. Created with Microsoft
PowerPoint.

13
1.5 Aims and Hypothesis
DM leads to many forms of molecular and biochemical changes which can result in post-
translational modification of proteins in the heart, including phosphorylation, oxidation, and
glycation, which may explain the links between DM and CVD (Bodiga et al., 2014). As
described in Section 1.4.3, hyperglycemic environments have been shown to cause an
accumulation in DAG due to increased glycolytic intermediates, which then results in an
increased activation of PKC, which has been associated with many vascular alterations
including diabetic neuropathy (Geraldes & King, 2010). The molecular pathways through
which DM has an increased risk or association to arrhythmia is not fully understood. It is well
described that phosphorylation of RyR2 can result in SOICR, however, the effect of PKC
phosphorylation on RyR2 and the occurrence of SOICR has not yet been investigated. Research
investigating how an increase in PKC activation or expression, as seen in DM, can affect the
RyR2 resulting in SOICR could serve as the molecular pathway linking DM and arrhythmia.
Therefore, the aim of the study is to assess the effect of PKC on the occurrence of SOICR and
the store dynamics of Ca2+ release. To test the aim, I will complete the following objectives:
1. The effect of endogenous PKC on SOICR
2. The effect of PKCα on SOICR and store dynamics
3. The effect of PKCε on SOICR and store dynamics
I hypothesise that activation and inhibition of endogenous PKC would result in an increase and
decrease in the occurrence of SOICR respectively. I also hypothesise that both overexpression
of PKCα and PKCε will increase the occurrence of SOICR due to a decrease in the release
threshold of the SR.
14
2 Methods
2.1 Cell Culture
2.1.1 Preparation of HEK293 Cells for Subculture
Flp-In T-REx human embryonic kidney 293 (HEK293) cells expressing RyR2 under the control
of the tetracycline repressor were stored in at minus 80 °C. A 1 mL aliquot of thawed HEK293
cells were added to a 75 cm2 culture flask containing 30 mL of pre-warmed (37°C) Dulbecco's
Modified Eagle's Medium (DMEM) solution (1.8 mM CaCl2, 25 mM D-Glucose, 5.3 mM KCL,
4 mM L-Glutamine, 0.8 mM MgSO4, 110 mM NaCl, 33 mM NaHCO2, 0.9 mM NaH2PO-H2O
– pH 7.4) modified with 10% fetal bovine serum (FBS), 1% non-essential amino acids (NEAA),
1% penicillin and 1% streptomycin. HEK293 cells were then cultivated in a humidified
incubator, maintained at 37 °C with an atmosphere of 5% CO2. After 24 hours of cultivation,
the existing growth medium was aspirated and replaced with 20 mL of fresh pre-warmed (37
°C) DMEM solution.
2.1.2 Subculture
Once HEK293 cells in 75 cm2 or 25 cm2 culture flasks reached the desired confluence (~90%),
they were then re-subcultured into either a 75 cm2 or 25 cm2 culture flask, where a maximum
of nine passages was allowed before HEK293 cells were discarded and a new batch of HEK293
cells were subcultured. First, the existing growth medium was aspirated and cells were washed
twice with either 5 mL or 2 mL of pre-warmed sterile phosphate buffered saline (PBS) (2.7 mM
KCL, 1.8 mM KH2PO4, 137 mM NaCl, 10 mM Na2HPO4 – pH 7.4), followed by a 5-minute
incubation in either 3mL or 1mL PBS at room temperature (22 - 25 °C), depending on the
culture flask size (75 cm2 or 25 cm2 respectively). The cell culture flask was then agitated to
allow for detachment of the HEK293 cells from the internal surface. 17 mL or 6.5 mL of fresh

15
pre-warmed DMEM solution was added, respective to the culture flask size; 75 cm2 or 25 cm2,
to attain a final volume of 7.5 mL or 20 mL. The mixture was then pipetted 3 times to ensure
homogenous cell suspension. HEK293 cells from the 25 cm2 culture flask were then seeded
onto glass coverslips for single-cell imaging or into another culture flask for later use. HEK293
cells that were transferred into new 25 cm2 culture flask were diluted with fresh pre-warmed
DMEM, with the volume determined by the required time of incubation. HEK293 cells from
the 75 cm2 culture flask could then be transferred into 100 mm diameter cell culture dishes in
preparation for cell lysate collection or subcultured into another culture flask for later use. Cell
proliferation of HEK293 cells was maintained for 24-72 hours before cells were used for single-
cell imaging or the preparation of cell lysate collection for western blot analysis. An inverted
microscope was used to assess cell confluence, and confirm the absence of bacterial or fungal
contaminants.
2.1.3 Preparation of HEK293 Cells for Imaging
In preparation for single-cell imaging (Section 2.2), 13 mm diameter glass coverslips were
sterilized in 70% ethanol and placed into a six-well culture plate (three glass coverslips per
well). The coverslips were coated with poly-L-lysine for 5 minutes to facilitate cell adhesion. 1
mL of suspended HEK293 cells from the 25 cm2 culture flask (Section 2.1.2) was then diluted
in 18 mL of fresh pre-warmed (37 °C) DMEM, followed by an aliquot of 3 mL per well. In
preparation of cell lysate collection for western blot analysis (Section 2.3), 1 mL of suspended
HEK293 cells from the 75 cm2 culture flask (2.1.2) was added to each 100 mm diameter cell
culture dishes containing 9 mL of fresh pre-warmed DMEM.

16
2.1.4 HEK293 cDNA Transfection
HEK293 cells were transfected using the Ca2+-phosphate precipitation method which facilitates
the endocytosis of cDNA into the cells (Graham & van der Eb, 1973). A 500 µL CaCl2-cDNA
(62 µL CaCl2 + 5 µg cDNA + ddH2O to make 500 µL) transfection mixture was pipetted in a
dropwise motion into a separate 50 mL tube containing 500 µL HEPES buffered saline (1.2
mM CaCl2, 20 mM HEPES, 2.4 mM K2HPO4, 1.2 mM MgCl2, 115 mM NaCl – pH 7.4) where
agitation of the solution was required to ensure co-precipitation. Thereafter, co-precipitate
containing 0.9 µg of cDNA was then added into the individual wells of the culture plates 24
hours post-seeding of the HEK293 cells (Section 2.1.3). For cytosolic Ca2+ imaging (Section
2.2.1), individual wells were either transfected with or without PKCα/ε cDNA. Specifically, for
luminal Ca2+ imaging (Section 2.2.2), 5 µg of D1ER cDNA was also included in the transfection
mixture for each condition. For lysate collection (2.3.1), 5µg PKCα cDNA or mock (cDNA
excluded) was added to each cell culture plates, 24 hours post-preparation of HEK293 cells
(Section 2.1.3).
2.1.5 Induction of RyR2 Expression
Twenty-four hours post-transfection (Section 2.1.4) of HEK293 cells grown on 13 mm diameter
glass coverslips for single-cell imaging, the existing growth medium was aspirated and each
well was washed twice with 3 mL of pre-warmed DMEM. For cytosolic Ca2+ imaging (Section
2.2.1), HEK293 cells were induced with 0.1 µg of tetracycline to induce RyR2 expression per
well. For luminal Ca2+ imaging (Section 2.2.2), HEK293 cells were induced with 0.3 µg of
tetracycline per well. HEK293 cells grown in 100 mm diameter culture plates for the collection
of cell lysates (Section 2.3.1), were induced with 10 µg of tetracycline per plate.
17
2.2 Single-cell Imaging
2.2.1 Cytosolic Ca2+ Imaging
To assess SOICR, HEK293 cells grown on glass coverslips, transfected with or without PKCα/ε
were imaged 16-20 hours post-induction (Section 2.1.5). The acetoxymethyl ester (AM) form
of the Ca2+ indicator, Fluo-4 AM dissolved in dimethyl sulphoxide (DMSO) and 12% pluronic
acid enabled the visualisation of Ca2+ release events, known as SOICR. Glass coverslips were
rinsed in 0 mM Ca2+ Krebs-ringer HEPES (KRH) (25 mM HEPES, 125 mM NaCl, 6 mM
Glucose, 5 mM KCL, 1.2 mM MgCl2 – pH 7.4) followed by an incubation in 1 mL of Ca2+ free
KRH containing 1 mg/mL of bovine serum albumin (BSA) with 2.5 µM Fluo-4 AM solution
for 10 minutes, followed by a 10-minute wash in 0 mM Ca2+ KRH, before being mounted on
the perfusion chamber. Coverslips were imaged on an inverted microscope with a 20x objective
lens while being superfused with KRH containing incremental Ca2+ concentrations (0, 0.1, 0.2,
0.3, 0.5, 1 mM), followed by 1 mM Ca2+ + 20 mM caffeine (RyR2 agonist) for the duration of
2, 4, 4, 4, 4, 4 and 2 minutes respectively (Kong et al., 2008). Caffeine was used to confirm
RyR2 expression in each cell. The flow of the solutions was driven by gravity with a constant
superfusion flow rate of ~3 mL per minute. The initial raw data collected was a video recording
of HEK293 cells, within a chosen field of view, over the 24 minute experimental time course
using NIS-Elements AR software (v4.0). The region of interest on the coverslip was determined
using light microscopy to find an area of well distributed and appropriately confluent cells. The
Fluo4-AM loaded in HEK293 cells underwent excitation at 470 nm with emission captured
through a long-pass emission filter (>515 nm) with an exposure time of 100 milliseconds, while
images were collected every 2 seconds. A separate region of interest (ROI) was drawn around
150-250 cells per glass coverslip and the SOICR events were seen as transient increases
cytosolic Ca2+ (fluorescence peaks).

18
2.2.1.1 Data Analysis
The susceptibility to SOICR was determined by the Ca2+ concentration required to elicit the
initial occurrence of fluorescent peaks. Traces of cytosolic Ca2+ fluorescence are presented as
F/F0, with F indicative of the fluorescent intensity at time point, t, and F0 indicative of the
fluorescent intensity recorded at 0 mM Ca2+. The cumulative fraction of cells experiencing
SOICR at each Ca2+ concentration was then calculated and fitted with a non-linear regression
for the individual glass coverslip, where the sample size (n) is the number of coverslips per
condition. Cells that experienced SOICR events at 0 mM Ca2+ were excluded as they represent
unhealthy cells. Cells that had no caffeine-induced Ca2+ transients at 1 mM Ca2+ with 20 mM
caffeine were also excluded, as changes in fluorescent intensity could not be attributed to RyR2
mediated release.
2.2.2 Luminal Ca2+ Imaging
To assess the characteristics of SOICR, HEK293 cells grown on glass coverslips that were
transfected with D1ER, with or without co-transfection of PKCα/ε were imaged 16-20 hours
post-induction. Glass coverslips were washed in 0 mM Ca2+ KRH for 10 minutes before being
mounted on the perfusion chamber. Coverslips were imaged on an inverted microscope with a
20 x objective lens while being superfused with KRH containing 0 mM Ca2+, 1 mM Ca2+, 2
mM Ca2+, 2 mM Ca2+ + 2 mM tetracaine and 2 mM Ca2+ + 20 mM caffeine for the duration of
2, 4, 7, 5 and 5 minutes respectively. 1-2 mM Ca2+ results in oscillations of fluorescence, where
the downward peak represents Ca2+ release through RyR2 from the SR, while the upward peak
is Ca2+ filling into the SR via SERCA. As the amount of Ca2+ load within the SR is dependent
on the balance of SERCA-mediated influx and RyR2-mediated efflux, inactivation of RyR2
renders the amount of Ca2+ load dependant on SERCA. Therefore, tetracaine, a RyR2
antagonist, results in an upward peak of fluorescence due to Ca2+ filling the SR to the maximum
(Overend et al., 1997). Caffeine, a RyR2 agonist, results in a downward peak of fluorescence

19
is due to complete depletion of Ca2+ through RyR2 from the SR (Kong et al., 2008). The flow
of the solutions was driven by gravity with a constant superfusion flow rate of ~3 mL per
minute. As described in Section 2.2.1.1, data of cells fluorescing over the 24 minute
experimental time course were collected by NIS-Elements AR software (v4.0). D1ER
underwent excitation at 436 nm with emissions of the yellow fluorescent protein (YFP) and
cyan fluorescent protein (CFP) captured through a dual dichronic beamsplitter at 535 nm and
480 nm respectively with an exposure time of 100 milliseconds. The two image recordings of
the YFP and CFP channel were collected simultaneously every 2 seconds, where the amount of
fluorescence resonance energy transfer (F) was determined by the ratio of these emissions
(YFP/CFP). A ROI was drawn around 10-40 cells per glass coverslip.
2.2.2.1 Data Analysis
Four parameters were derived from the traces of luminal Ca2+ fluorescence for each cell, as
shown in Figure 2.1; Fmax, Fmin, FSOICR, and Ftermi. Between 0-2 mM Ca2+, oscillations of F
represent the release of Ca2+ through the RyR2 from the SR (downward deflection) and the
refilling of Ca2+ into the SR through SERCA activity (upward deflection). The average peaks
of oscillation represent the luminal Ca2+ required to activate RyR2 Ca2+ release, termed the
release threshold of SOICR (FSOICR), where the average nadir of oscillation represents the
luminal Ca2+ required to inactivate RyR2 Ca2+ release and is termed the termination threshold
(Ftermi) of SOICR. As described in Section 2.2.2, the subsequent addition of tetracaine and
caffeine determined the maximum (Fmax) and minimum (Fmin) capacity of SR Ca2+ store,
respectively. These parameters were normalised to Fmin, and the characteristics of SOICR were
calculated; store size (Fmax – Fmin), release threshold ([FSOICR – Fmin] / [Fmax – Fmin] x 100),
termination threshold ([Ftermi – Fmin] / [Fmax – Fmin] x 100). The percentage of store size, release
threshold and termination threshold of cells were then calculated and plotted, where the sample
size (n) is the number of cells per condition.

20
Figure 2.1 Luminal Ca2+ Fluorescent Trace.
The parameters used to determine the characteristics of SOICR; maximum (Fmax), minimum
(Fmin), release threshold (FSOICR) and termination threshold (Ftermi). Bar represents the
concentration of the superfusate, and the length of the bar is proportional to the duration of
superfusion.
2.3 Western Blot
2.3.1 Collection of HEK293 Cell Lysates
HEK293 cells were grown in ten 100 mm diameter culture dishes for each condition (Section
2.1.2). After 24 hours, the culture plates were either transfected with or without PKCa cDNA
(Section 2.1.4). 24 hours post-transfection, the plates were then induced undiluted tetracycline
(Section 2.1.5), 18 hours prior to harvesting of HEK293 cells. Growth medium was discarded
and culture dishes were washed twice in PBS containing 0.5 mM ethylenediaminetetraacetic
acid (EDTA) then incubated with 2.5 mL of PBS-EDTA for 10 minutes. Plates were agitated
to allow the detachment of HEK293 cells from the internal surface. PBS-EDTA solution
containing HEK293 cells was collected into a 50 mL tube, where a further 1.25 mL of PBS-
EDTA solution was added to each plate for the collection of any residual cells, making a total
of 37.5 mL per condition. Tubes containing cells were centrifuged at 1000 g for 10 minutes.
The supernatant was discarded and the pellet was resuspended with 2 mL of lysis buffer (1%
CHAPS, 25 mM HEPES/Tris, 137 mM NaCl, 0.5% Soybean phosphatidylcholine – pH 7.05)

21
containing protease inhibitors (2 µg/ml Aprotinin, 1 Mm Benzamide, 2.5 mM DTT, 2 µg/ml
Leupeptin, 2 µg/ml Pepstatin A, 0.525 mM PMSF) to minimise protein degradation for 1 hour
on ice. To remove insoluble material, lysates were separated into two 1 mL eppendorff tubes
and centrifuged at 16,000 g for 30 minutes at 4 °C, where the supernatant was then transferred
into two CyroTubes and cryopreserved at minus 80 °C until required for sodium dodecyl sulfate
(SDS) polyacrylamide gel electrophoresis (SDS-PAGE) (Section 2.3.4). The protein
concentration was measured on a BioTek Take3 Micro-Volume Plate Reader, where for each
condition, 3 biological samples were conducted.
2.3.2 Preparation of Polyacrylamide Gels
Two glass plates pre-cleaned with 70% ethanol were loaded onto a plastic clamp to form a gel
cast. Running gel solution was pipetted to fill approximately 70% of the gel cast, this was
overlaid with 1 mL of H2O to prevent gel desiccation. Running gel was left to set at room
temperature for 1-hour. A 6% and 12% acrylamide running gel was made for total RyR2 and
total PKCα with glyceraldehyde 3-phosphate dehydrogenase (GAPDH) respectively. Once the
gel had set, the H2O was removed and stacking gel solution was pipetted to fill the rest of the
gel cast. While ensuring for no air bubbles, a 10 well plastic gel comb, with 1.5 mm wells, was
introduced for the formation of wells and the gel was left to set at room temperature for 1 hour
for the formation of a polyacrylamide gel.

22
Table 2.1 Running Gel
Ingredients 6%
(µL)
12%
(µL)
MilliQ-H2O 4632 3432
Tris/ HCl (1.5 M - pH 8.8) 2000 2000
Acrylamide (40%) 1200 2400
SDS (10%) 80 80
APS (Ammonium persulfate) (10%) 80 80
TEMED (Tetramethylethylenediamine) 8 8
Table 2.2 Stacking Gel
Ingredients 4%
(µL)
MilliQ-H2O 5032
Tris/ HCl (0.5 M - pH 6.8) 2000
Acrylamide (40%) 800
SDS (10%) 80
APS (10%) 80
TEMED 8

23
2.3.3 Sample Preparation for SDS-PAGE
Cell lysates were thawed and diluted with an appropriate volume of Laemmli’s sample buffer
(SB) (10% β-mercaptoethanol, 0.004% Bromphenol Blue, 20% Glycerol, 4% SDS, 125 µM
Tris-HCl). Samples were solubilised in a heating block at 95 °C for 7 minutes to denature the
proteins and centrifuged at 1400 g for 2 minutes to remove insoluble material.
2.3.4 SDS-PAGE
SDS-PAGE was used to separate protein based on its molecular weight. The gel cassette
containing the gel (Section 2.3.2) was introduced into the electrophoresis tank filled with
running buffer (192 mM Glycine, 0.1% SDS, 25 mM Tris). The plastic comb was removed
carefully from the gel where prepared samples containing 3µg/µL of protein (Section 2.3.3)
were loaded from left to right after the addition of 7 µL of Precision Plus Protein Ladder in the
first well to visualise protein migration; sample order was: Ladder, Mock #1, PKCα #1, Mock
#2, PKCα #2, Mock #3 and PKCα #3. SDS-PAGE ran for 1-hour at 60 V, 400 mA to allow the
samples to move through the stacking gel. The voltage was then turned up to 100V and left for
4 or 1 hours for the 6% and 12% gel respectively.
2.3.5 Membrane Transfer
A wet-transfer method was used to transfer proteins to a nitrocellulose membrane. The gel was
detached carefully from the cassette, removing the stacking gel layer before being placed within
a transfer sandwich (sponge, filter paper, nitrocellulose membrane, gel, filter paper, sponge)
held together by a transfer cassette. The transfer cassette was then introduced into a transfer
tank filled with transfer buffer (192 mM Glycine, 20% Methanol, 0.01% SDS, 25 mM Tris).
The protein samples were transferred from the gel to the nitrocellulose membrane overnight
(900 minutes) in a 4 °C room, set at 54 V, 400 mA.
24
2.3.6 Membrane Blotting
The membrane was removed from the transfer sandwich and placed in a container with Ponceau
S total protein stain to check for clear band transfer to the membrane. The membrane was then
washed in PBS, followed by two PBS with 0.5% tween-20 (PBS-T) washes. The membrane
containing PKCα and GAPDH protein from the 12% gel was then cut into two separate
membranes at the 50 kDa ladder band to allow the processing of the proteins independently.
The membranes were then incubated in a 5% milk PBS-T solution for 1.5 hours to prevent non-
specific antibody binding, where all incubations occurred on a platform mixer unless stated
otherwise. The membranes were then washed with PBS three times, ensuring complete removal
of the milk PBS-T solution before being incubated with a primary antibody. The membrane
containing RyR2 from the 6% gel was incubated in mouse-anti-RyR2 (Abcam, 1: 1,000
dilution) for 4 hours. The membrane containing PKCα from the 12% gel was incubated in
mouse-anti-PKCα (Abcam, 1: 1,000 dilution) for 2 hours. The membrane containing GAPDH
was incubated in rabbit-anti-GAPDH conjugated with horseradish peroxidase (HRP) (Abcam,
1: 2,500 dilution) for 2 hours. The membranes were then washed with PBS-T three times (5
minutes, 10 minutes, 5 minutes) followed by three PBS washes. Membranes containing RyR2
as well as PKCα were then incubated separately with the same HRP conjugated secondary
antibodies, goat-anti-mouse (Abcam, 1: 20,000 dilution) for 2 hours, then washed with PBS-T
three times (5 minutes, 10 minutes, 5 minutes) followed by three PBS washes.
2.3.7 Membrane Developing
Membranes were incubated in 4 mL of Super Signal West Pico Chemiluminescent Substrate
for 5 minutes while tilting the box. The membrane was then placed between two clear plastic
sheets and images were captured in Syngene Pxi 4 Imager.

25
2.3.8 Western blot analysis
Densitometry analysis was performed with GeneTools (v4.0) software, normalised to GAPDH
([Density of RyR2 or PKCα] / [Density of GAPDH from the same sample]). The data was then
processed to give the fold change of PKCα transfected HEK293 cells to mock transfected
HEK293 cells for both total RyR2 and PKCα ([normalised PKCα or Mock transfection density]
/ [Mock transfection density average]).
2.4 Statistical Analysis
All statistical analyses were performed on GraphPad Prism (v6.0) software, where statistical
significance is denoted as p ≤ 0.05 *, p ≤ 0.01 **, p ≤ 0.001 ***, data are expressed as mean ±
standard error of the mean (SEM). For data sets that presented a normal distribution; western
blot analysis and luminal Ca2+ imaging analysis, an unpaired two-tailed student’s t-test was
used. For data sets that contained more than two conditions including; luminal Ca2+ imaging, a
one-way analysis of variance (ANOVA) was performed. For data sets that contained two
variables with more than two conditions including; cytosolic Ca2+ imaging analysis, a two-way
ANOVA was performed along with the most appropriate post-hoc test, mentioned for each
result (Dunnett or Sidak).
.
26
3 Results
3.1 Cell Viability
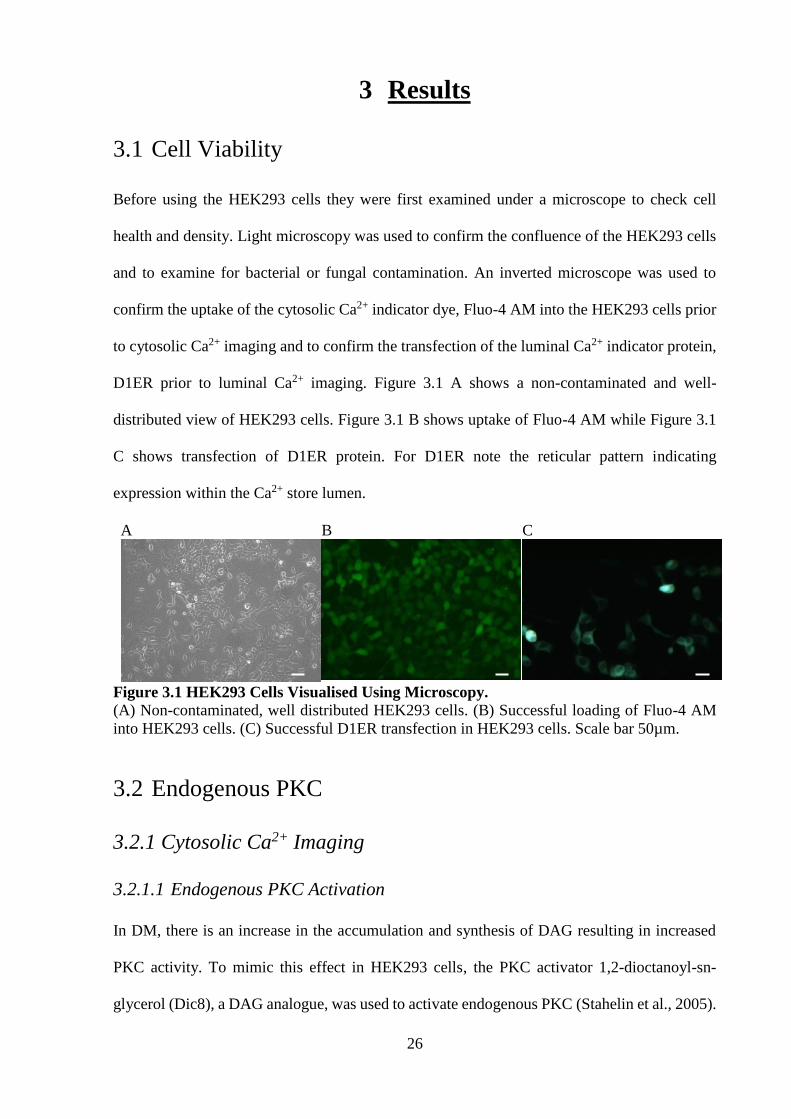
Before using the HEK293 cells they were first examined under a microscope to check cell
health and density. Light microscopy was used to confirm the confluence of the HEK293 cells
and to examine for bacterial or fungal contamination. An inverted microscope was used to
confirm the uptake of the cytosolic Ca2+ indicator dye, Fluo-4 AM into the HEK293 cells prior
to cytosolic Ca2+ imaging and to confirm the transfection of the luminal Ca2+ indicator protein,
D1ER prior to luminal Ca2+ imaging. Figure 3.1 A shows a non-contaminated and well-
distributed view of HEK293 cells. Figure 3.1 B shows uptake of Fluo-4 AM while Figure 3.1
C shows transfection of D1ER protein. For D1ER note the reticular pattern indicating
expression within the Ca2+ store lumen.
A
B
C
Figure 3.1 HEK293 Cells Visualised Using Microscopy.
(A) Non-contaminated, well distributed HEK293 cells. (B) Successful loading of Fluo-4 AM
into HEK293 cells. (C) Successful D1ER transfection in HEK293 cells. Scale bar 50µm.
3.2 Endogenous PKC
3.2.1 Cytosolic Ca2+ Imaging
3.2.1.1 Endogenous PKC Activation
In DM, there is an increase in the accumulation and synthesis of DAG resulting in increased
PKC activity. To mimic this effect in HEK293 cells, the PKC activator 1,2-dioctanoyl-sn-
glycerol (Dic8), a DAG analogue, was used to activate endogenous PKC (Stahelin et al., 2005).

27
See Figure 3.4 for endogenous PKC expression level quantification. HEK293 cells were loaded
with the cytosolic Ca2+ indicator dye, Fluo-4 AM and continuously superfused with KRH
containing increasing Ca2+ concentrations (0, 0.1, 0.2, 0.3, 0.5, 1 mM) to elicit SOICR. To
confirm RyR2 expression the HEK293 cells were superfused with 1 mM Ca2+ KRH solution
containing 20 mM caffeine at the end of each experiment. Caffeine is a RyR2 agonist and
depletes the luminal Ca2+ store which can be observed as a large increase in cytosolic Ca2+.
SOICR events were visualised as transient peaks in the cytosolic Ca2+ fluorescence as seen in
Figure 3.2 A. The cumulative fraction of cells in each condition (Vehicle treated, 10 µM Dic8
treated and 20 µM Dic8 treated HEK293 cells) exhibiting Ca2+ oscillations (SOICR events) was
plotted against the concentration of Ca2+. These data points were fitted with a non-linear
regression (Vehicle treated HEK293 cells R2 = 0.87, 10 µM Dic8 treated HEK293 cells R2 =
0.90 and 20 µM Dic8 treated HEK293 cells R2 = 0.84) and statistical significance assessed with
a two-way ANOVA with a Dunnett’s post hoc test. As shown in Figure 3.2 B, an increase in
Ca2+ concentration in the superfusate resulted in an increase in the fraction of cells undergoing
SOICR in a dose-response manner for each condition as expected. The addition of 10µM Dic8
resulted in an increase in the percentage of cells undergoing SOICR compared to the vehicle
treated HEK293 cells at 0.3 mM Ca2+ (47.69 ± 3.7 versus 34.85 ± 4.0) (p = 0.013). Application
of 20 µM Dic8 led to a greater increase in the percentage of cells undergoing SOICR compared
to the vehicle treated HEK293 cells at 0.2 (30.07 ± 13.11 versus 16.82 ± 3.38) (p = 0.046), 0.3
(52.37 ± 9.27 versus 34.85 ± 4.0) (p = 0.006), 0.5 (67.23 ± 4.79 versus 51.32 ± 2.93) (p = 0.014)
and 1 mM Ca2+ (77.7 ± 4.07 versus 63.31 ± 2.56) (p = 0.028) suggesting a dose response effect.

28
A
B
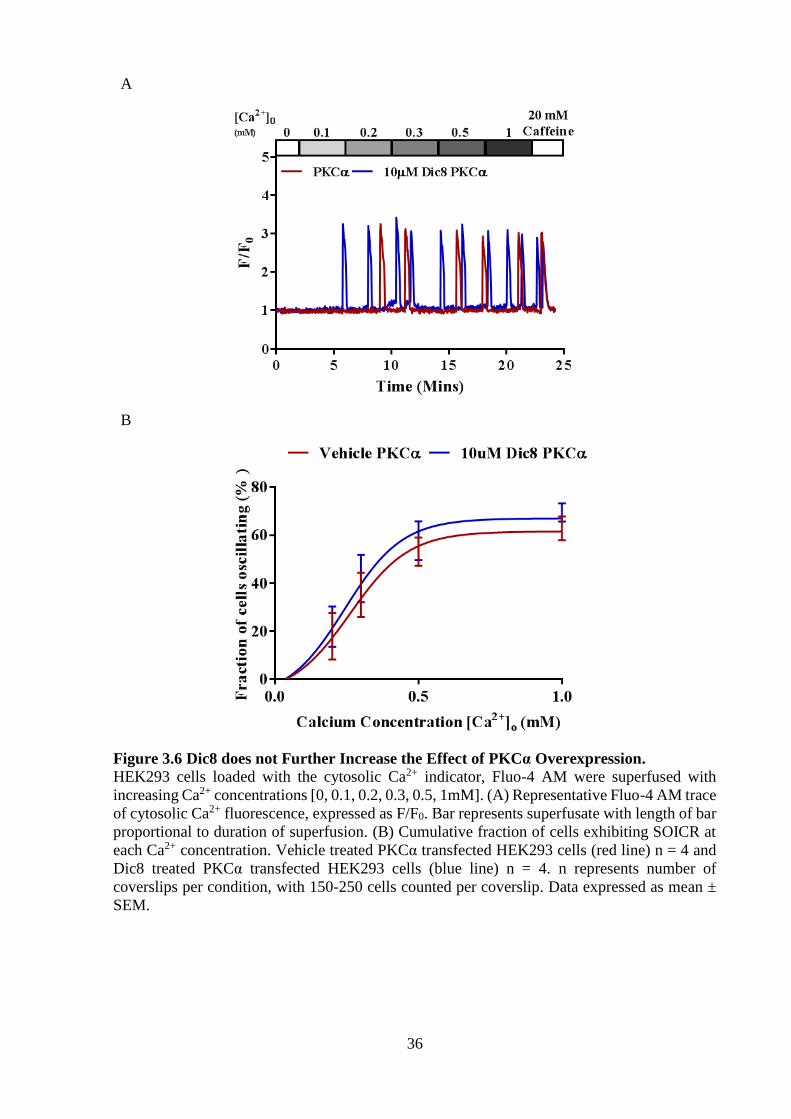
Figure 3.2 Dic8 Increases the Occurrence of SOICR. HEK293 cells loaded with the cytosolic Ca2+ indicator, Fluo-4 AM were superfused with
increasing Ca2+ concentrations [0, 0.1, 0.2, 0.3, 0.5, 1mM]. (A) Representative Fluo-4 AM trace
of cytosolic Ca2+ fluorescence, expressed as F/F0. Bar represents superfusate with length of bar
proportional to duration of superfusion. (B) Cumulative fraction of cells exhibiting SOICR at
each Ca2+ concentration. Vehicle treated HEK293 cells (red line) n = 11, 10µM Dic8 treated
HEK293 cells (blue line) n = 8 and 20µM Dic8 treated HEK293 cells (green line) n = 4. n
represents number of coverslips per condition, with 150-250 cells counted per coverslip. Data
expressed as mean ± SEM.

29
3.2.1.2 Endogenous PKC Inhibition
A multi-isoform PKC inhibitor, Go6983 was used to determine if inhibition of endogenous
PKC influenced SOICR in HEK293 cells. Go6983 inhibits PKC by binding the ATP binding
site of the catalytic domain (Sakwe et al., 2005). As described in Section 3.2.1.1, HEK293 cells
were loaded with Fluo-4 AM and continuously superfused with KRH containing increasing
Ca2+ concentrations to elicit SOICR in these cells. SOICR was visualised as transient peaks in
the cytosolic Ca2+ fluorescence as seen in Figure 3.3 A. The cumulative fraction of cells for
each condition (Vehicle treated and 5µM Go6983 treated HEK293 cells) exhibiting Ca2+
oscillations was plotted against the concentration of Ca2+. These data points were fitted with a
non-linear regression (Vehicle treated HEK293 cells R2 = 0.94 and 5µM Go6983 treated
HEK293 cells R2 = 0.89) and statistical significance assessed with a two-way ANOVA with a
Sidak’s post hoc test. As described in Section 3.2.1.1, an increase in Ca2+ concentration results
in an increase of fraction of cells undergoing SOICR seen in Figure 3.3 A. Figure 3.3 B shows
that inhibition of endogenous PKC in HEK293 cells using Go6983 results in an increase in the
percentage of cells undergoing SOICR compared to the mock transfected HEK293 cells at 0.2
(40.2 ± 4.82 versus 16.83 ± 3.07), 0.3 (57.42 ± 4.49 versus 33.03 ± 2.37), 0.5 (66.37 ± 3.25
versus 45.61 ± 1.96) and 1 mM Ca2+ (75.11 ± 2.41 versus 53.86 ± 0.69) (p < 0.0001 for all
points). Whilst performing this assay a member in the lab has shown that the use of ATP
inhibitors directly affects the RyR2, resulting in an increase in the occurrence of SOICR,
therefore, I discontinued using Go6983 for the rest of the study as any results obtained could
be due a direct effect on RyR2 rather than through the modification of PKC activity.

30
A
B
Figure 3.3 Go6983 Increases the Occurrence of SOICR. HEK293 cells loaded with the cytosolic Ca2+ indicator, Fluo-4 AM were superfused with
increasing Ca2+ concentrations [0, 0.1, 0.2, 0.3, 0.5, 1mM]. (A) Representative Fluo-4 AM trace
of cytosolic Ca2+ fluorescence, expressed as F/F0. Bar represents superfusate with length of bar
proportional to duration of superfusion. (B) Cumulative fraction of cells exhibiting SOICR at
each Ca2+ concentration. Vehicle treated HEK293 cells (red line) n = 7 and 5uM Go6983 treated
HEK293 cells (blue line) n = 8. n represents number of coverslips per condition, with 150-250
cells counted per coverslip. Data expressed as mean ± SEM.

31
3.3 PKCα Overexpression
As activation of endogenous PKC led to an increase in SOICR, I next explored which isoform
could be responsible.
3.3.1 Western Blot Analysis
Before determining the functional effect of increasing PKCα expression I first determined the
endogenous PKCα expression level (the prevalent isoform in HEK293 cells) and increase
obtained by transfecting with PKCα, cDNA using western blotting. Cell lysates harvested from
HEK293 cells transfected with or without PKCα cDNA were loaded into a 6% (RyR2) and 12%
polyacrylamide gels (PKC and GAPDH) to allow protein separation based on their molecular
weight using SDS-PAGE. Following wet-transfer of the proteins onto a nitrocellulose
membrane, primary and secondary antibodies followed by enhanced chemiluminescence was
used to visualise the proteins of interest; RyR2, PKCα, and GAPDH. A protein ladder was used
to confirm the molecular weight of the protein of interest. The expression of each protein of
interest (RyR2 and PKC) was normalised with GAPDH and modified to represent fold changes.
Statistical significance was assessed with an unpaired t-test. The RyR2 protein band appeared
above the 250 kDa protein ladder band as RyR2 has an expected weight of 563 kDa. The PKCα
and GAPDH protein bands appeared to be adjacent to the protein ladder bands of 75 kDa and
37 kDa aligning with their respective expected weight of 75 kDa and 37 kDa. Figure 3.4 C
shows representative images of the total RyR2, PKCα and GAPDH bands at each condition. As
seen in Figure 3.4 B, PKCα transfected HEK293 cells resulted in an approximately 5.5-fold
increase in total PKCα compared to that of mock transfected HEK293 cells (5.45 ± 0.41 versus
1 ± 0.11) (p = 0.0005). PKCα transfected HEK293 cells resulted in no change in total RyR2
compared to that of mock seen in Figure 3.4 C (0.79 ± 0.22 versus 1 ± 0.16) (p = 0.48).

32
A
B
C
Figure 3.4 PKCα Transfection Results in Robust Expression.
Western blot analysis of harvested HEK293 cell lysates with or without PKCα were developed
and analysed. (A) Images of RyR2, PKCα and GAPDH total protein bands for PKCα and mock
transfected HEK293 cell lysates. (B) PKCα total normalised against GAPDH and adjusted to
show fold changes of protein for PKCα transfected HEK293 cells (blue bar) against the mock
transfected HEK293 cells (red bar) n = 3 independent lysates per condition. (C) RyR2 total
normalised against GAPDH and adjusted to show fold changes of protein for PKCα transfected
HEK293 cells (blue bar) against the mock transfected HEK293 cells (red bar) n = 3 independent
lysates per condition. Data expressed as mean ± SEM.

33
3.3.2 Cytosolic Ca2+ Imaging
3.3.2.1 PKCα Overexpression
Not only is PKCα the most expressed PKC isoform in the heart, but PKCα has been shown to
have an increase expression/activity in DM. As seen in Figure 3.2 B, activation of endogenous
PKC increased the incidence of SOICR; however, the isoform(s) responsible are unknown.
As PKCα is the isoform with the highest expression in the heart, HEK293 cells were transfected
with or without PKCα and its effect on SOICR was assessed. As described in Section 3.2.1.1,
HEK293 cells were loaded with Fluo-4 AM and continuously superfused with KRH containing
increasing Ca2+ concentrations to elicit SOICR. SOICR was visualised as transient peaks in the
cytosolic Ca2+ fluorescence (Figure 3.5 A). The cumulative fraction of cells for each condition
(Mock transfected and PKCα transfected HEK293 cells) exhibiting Ca2+ oscillations was
plotted against the concentration of Ca2+. These data points were fitted with a non-linear
regression (Mock transfected HEK293 cells R2 = 0.83 and PKCα transfected HEK293 cells R2
= 0.84) and statistical significance assessed with a two-way ANOVA with a Sidak’s post hoc
test. As mentioned in Section 3.2.1.1, an increase in Ca2+ concentration results in an increase
of fraction of cells undergoing SOICR seen in Figure 3.5 A. PKCα transfected HEK293 cells
had an increase in the percentage of cells undergoing SOICR compared to the mock transfected
HEK293 cells at 0.3 mM Ca2+ (34.04 ± 2.69 versus 24.91 ± 3.84) (p = 0.047). PKCα transfected
HEK293 cells appeared to have no changes in the percentage of cells undergoing SOICR at 0.1,
0.2, 0.5 and 1mM Ca2+.

34
A
B
Figure 3.5 PKCα has a Small Effect on the Occurrence of SOICR.
HEK293 cells loaded with the cytosolic Ca2+ indicator, Fluo-4 AM were superfused with
increasing Ca2+ concentrations [0, 0.1, 0.2, 0.3, 0.5, 1mM]. (A) Representative Fluo-4 AM trace
of cytosolic Ca2+ fluorescence, expressed as F/F0. Bar represents superfusate with length of bar
proportional to duration of superfusion. (B) Cumulative fraction of cells exhibiting SOICR at
each Ca2+ concentration. Mock transfected HEK293 cells (red line) n = 13 and PKC transfected
HEK293 cells (blue line) n = 25. n represents number of coverslips per condition, with 150-250
cells counted per coverslip. Data expressed as mean ± SEM.

35
3.3.2.2 PKCα Overexpression and Activation with Dic8
Figure 3.5 B shows overexpression of PKCα results in a small change in the incidence of
SOICR. Based on Figure 3.2 B, showing that activation of endogenous PKC with Dic8
increased the incidence of SOICR I decided to see if PKCα overexpression with or without
Dic8 could further increase the incidence of SOICR. As described in Section 3.2.1.1, HEK293
cells were loaded with Fluo-4 AM and continuously superfused with KRH containing
increasing Ca2+ concentrations to elicit SOICR in these cells. SOICR was visualised as transient
peaks in the cytosolic Ca2+ fluorescence as seen in Figure 3.6 A. The cumulative fraction of
cells for each condition (Vehicle treated and 10µM Dic8 treated PKCα transfected HEK293
cells) exhibiting Ca2+ oscillations was plotted against the concentration of Ca2+. These data
points were fitted with a non-linear regression (Vehicle treated PKCα transfected HEK293 cells
R2 = 0.82 and 10µM Dic8 treated PKCα transfected HEK293 cells R2 = 0.84) and statistical
significance assessed with a two-way ANOVA with a Sidak’s post hoc test. Consistent with
Section 3.2.1.1, an increase in Ca2+ concentration resulted in an increase of fraction of cells
undergoing SOICR seen in Figure 3.6 A. I initially believed that PKCα overexpression may
have only shown a small effect on SOICR, seen in Figure 3.5 due to a lack of agonists, however,
in Figure 3.6 B, there was no change in the percentage of cells undergoing SOICR between the
PKCα transfected HEK293 cells treated with or without the PKC agonist, Dic8, at all Ca2+
concentrations (p > 0.05) suggesting that PKCα may not be responsible for the increase in
SOICR observed due to Dic8 treatment alone (Figure 3.5).
36
A
B
Figure 3.6 Dic8 does not Further Increase the Effect of PKCα Overexpression.
HEK293 cells loaded with the cytosolic Ca2+ indicator, Fluo-4 AM were superfused with
increasing Ca2+ concentrations [0, 0.1, 0.2, 0.3, 0.5, 1mM]. (A) Representative Fluo-4 AM trace
of cytosolic Ca2+ fluorescence, expressed as F/F0. Bar represents superfusate with length of bar
proportional to duration of superfusion. (B) Cumulative fraction of cells exhibiting SOICR at
each Ca2+ concentration. Vehicle treated PKCα transfected HEK293 cells (red line) n = 4 and
Dic8 treated PKCα transfected HEK293 cells (blue line) n = 4. n represents number of
coverslips per condition, with 150-250 cells counted per coverslip. Data expressed as mean ±
SEM.

37
3.3.3 Luminal Ca2+ Imaging
3.3.3.1 PKCα Overexpression
To confirm the small effect of PKCα on the occurrence of SOICR in Figure 3.5, SR store
dynamics were assessed. HEK293 cells were transfected with the luminal Ca2+ indicator
protein, D1ER and continuously superfused with KRH containing increasing Ca2+
concentrations (0, 1, 2 mM) to elicit SOICR in these cells. To fill the Ca2+ store to maximum,
HEK293 cells were superfused with a 2 mM Ca2+ KRH solution containing 2 mM tetracaine
which blocks RyR2. Finally, to deplete the Ca2+ store, HEK293 cells were superfused with 2
mM Ca2+ KRH solution containing 20 mM caffeine. Fmax, Fmin, FSOICR and Ftermi parameters
were determined from the single cell luminal Ca2+ fluorescence traces and normalised to Fmin
to calculate SOICR characteristics, seen in Figure 3.7 A. The percentage of store size (Fmax –
Fmin), release threshold ([FSOICR – Fmin] / [Fmax – Fmin] x 100) and termination threshold ([Ftermi
– Fmin] / [Fmax – Fmin] x 100) were calculated for each condition (Mock transfected HEK293
cells and PKCα transfected HEK293 cells) and statistical significance was assessed with an
unpaired two-tailed student’s t-test. Figure 3.7 B and Figure 3.7 C shows PKCα results in no
change in the total store size and release threshold between mock and PKCα transfected
HEK293 cells (p > 0.05), inconsistent with the small change in SOICR observed in Figure 3.5
B. Figure 3.7 D shows that PKCα transfected HEK293 cells have an increased termination
threshold compared to the mock transfected HEK293 (48 ± 1.96 versus 43.4 ± 1.01) (p = 0.038).

38
A
B
C
D
Figure 3.7 PKCα Reduces Store Size.
HEK293 cells transfected with the luminal Ca2+ indicator protein, D1ER were superfused with
increasing Ca2+ concentrations [0,1, 2mM] followed by tetracaine and caffeine. (A)
Representative D1ER trace luminal Ca2+ fluorescence, expressed as F/F0. Bar represents
superfusate with length of bar proportional to duration of superfusion. Bar graph of the
percentage of (B) store size, (C) release threshold and (D) termination threshold for each
condition. Mock transfected HEK293 cells (red bar) n = 110 and PKCε transfected HEK293
cells (blue bar) n = 30. n represents the number of cells per condition. Data expressed as mean
± SEM.

39
3.3.3.2 PKCα Overexpression and Activation with Dic8
To determine the effect of PKCα plus Dic8 on the occurrence of SOICR, seen in Figure 3.6, SR
store dynamics were also assessed and compared against the results from Figure 3.7.
HEK293 cells were co-transfected with PKCα and the luminal Ca2+ indicator protein, D1ER
and continuously superfused with KRH containing increasing Ca2+ concentrations (0, 1, 2 mM)
to elicit SOICR in these cells. To fill the Ca2+ store to maximum, HEK293 cells were superfused
with a 2 mM Ca2+ KRH solution containing 2 mM tetracaine which blocks RyR2. Finally, to
deplete the Ca2+ store, HEK293 cells were superfused with 2 mM Ca2+ KRH solution containing
20 mM caffeine. Fmax, Fmin, FSOICR and Ftermi parameters were determined from the single cell
luminal Ca2+ fluorescence traces and normalised to Fmin to calculate SOICR characteristics. The
percentage of store size (Fmax – Fmin), release threshold ([FSOICR – Fmin] / [Fmax – Fmin] x 100)
and termination threshold ([Ftermi – Fmin] / [Fmax – Fmin] x 100) were calculated for Dic8 treated
PKCα transfected HEK293 cells, and statistical significance was assessed with a one-way
ANOVA. Figure 3.8 A and C shows no change in the total store size and termination threshold
between the mock, PKCα transfected, and PKCα transfection with Dic8 (p > 0.05). Figure 3.8
B shows that PKCα transfection with Dic8 results in a significant decrease in the release
threshold compared to the mock and PKCα transfected HEK293 cells (85.56 ± 1.51 versus
90.77 ± 0.53 and 90.39 ± 0.74) (p = 0.001, 0.006). The reduction in the release threshold of
SOICR could either be due to PKCα being further activated with Dic8 or an independent effect
of Dic8. An independent effect of Dic8 on the release threshold for SOICR would be consistent
with the increase in the occurrence of SOICR observed in Figure 3.2.

40
A
B
C
Figure 3.8 Overexpression of PKCα with Dic8 Reduces Release Threshold.
HEK293 cells transfected with the luminal Ca2+ indicator protein, D1ER were superfused with
increasing Ca2+ concentrations [0,1, 2mM] followed by tetracaine and caffeine. Bar graph of
the percentage of (A) store size, (B) release threshold and (C) termination threshold for each
condition. Mock transfected HEK293 cells (red bar) n = 110, PKCε transfected HEK293 cells
(blue bar) n = 30 and Dic8 treated PKCε transfected HEK293 cells (green bar) n = 27. n
represents the number of cells per condition. Data expressed as mean ± SEM.

41
3.4 PKCε Overexpression
3.4.1 Cytosolic Ca2+ Imaging
3.4.1.1 PKCε Overexpression
As endogenous activation of PKC in HEK293 cells using Dic8 resulted in an increase in the
occurrence of SOICR (Figure 3.2 B) and PKCα isoform appears to have only a small effect on
the occurrence of SOICR (Figure 3.5 B), the next logical step was to determine the effect of
other PKC isoforms, specifically PKCε, which is also expressed in HEK293 cells. PKCε differs
from PKCα based on the structure and its mode of activation, as it requires only DAG and not
Ca2+. PKCε is also highly expressed in the heart and has also been shown to have an increased
expression/activity in DM. As described in Section 3.2.1.1, HEK293 cells were loaded with
Fluo-4 AM and continuously superfused with KRH containing increasing Ca2+ concentrations
to elicit SOICR in these cells. SOICR was visualised as transient peaks in the cytosolic Ca2+
fluorescence as seen in Figure 3.9 A. The cumulative fraction of cells for each condition (Mock
transfected and PKCε transfected HEK293 cells) exhibiting Ca2+ oscillations was plotted
against the concentration of Ca2+. These data points were fitted with a non-linear regression
(Mock transfected HEK293 cells R2 = 0.88 and PKCε transfected HEK293 cells R2 = 0.86) and
statistical significance assessed with a two-way ANOVA with a Sidak’s post hoc test. As in
Section 3.2.1.1, an increase in Ca2+ concentration results in an increase of fraction of cells
undergoing SOICR seen in Figure 3.9 A. PKCε transfected HEK293 cells had an increase in
the percentage of cells undergoing SOICR compared to the mock transfected HEK293 cells at
0.5 (62.61 ± 5.1 versus 40.33 ± 3.06) (p = 0.0008) and 1 mM Ca2+ (70.8 ± 4.43 versus 45.6 ±
2.67) (p = 0.0001).

42
A
B
Figure 3.9 PKCε Increases the Occurrence of SOICR.
HEK293 cells loaded with the cytosolic Ca2+ indicator, Fluo-4 AM were superfused with
increasing Ca2+ concentrations [0, 0.1, 0.2, 0.3, 0.5, 1mM]. (A) Representative Fluo-4 AM trace
of cytosolic Ca2+ fluorescence, expressed as F/F0. Bar represents superfusate with length of bar
proportional to duration of superfusion. (B) Cumulative fraction of cells exhibiting SOICR at
each Ca2+ concentration. Mock transfected HEK293 cells (red line) n = 6 and PKCε transfected
HEK293 cells (blue line) n = 6. n represents number of coverslips per condition, with 150-250
cells counted per coverslip. Data expressed as mean ± SEM.

43
3.4.1.2 PKCε Overexpression and Activation with Dic8
Figure 3.9 B showed transfection of PKCε results in a significant increase in the incidence of
SOICR in HEK293 cells. Based on Figure 3.2 B, showing that activation of endogenous PKC
with Dic8 increased the incidence of SOICR I decided to see if PKCε overexpression with or
without Dic8 could increase the incidence of SOICR even further. As described in Section
3.2.1.1, HEK293 cells were loaded with Fluo-4 AM and continuously superfused with KRH
containing increasing Ca2+ concentrations to elicit SOICR in these cells. SOICR was visualised
as transient peaks in the cytosolic Ca2+ fluorescence as seen in Figure 3.10 A. The cumulative
fraction of cells for each condition (Vehicle treated and 10µM Dic8 treated PKCε transfected
HEK293 cells) exhibiting Ca2+ oscillations was plotted against the concentration of Ca2+. These
data points were fitted with a non-linear regression (Vehicle treated PKCε transfected HEK293
cells R2 = 0.95 and 10µM Dic8 treated PKCε transfected HEK293 cells R2 = 0.93) and statistical
significance assessed with a two-way ANOVA with a Sidak’s post hoc test. As in Section
3.2.1.1, an increase in Ca2+ concentration results in an increase of fraction of cells undergoing
SOICR seen in Figure 3.10 A. In Figure 3.10 B, there was no change in the percentage of cells
undergoing SOICR between the PKCε transfected HEK293 cells treated with or without Dic8
at all Ca2+ concentrations (p > 0.05), suggesting the overexpressed PKCε activity cannot be
further increased using the PKC agonist, Dic8.

44
A
B
Figure 3.10 Dic8 does not Further Increase the Effect on the Occurrence of SOICR in
Cells Transfected with PKCε.
HEK293 cells loaded with the cytosolic Ca2+ indicator, Fluo-4 AM were superfused with
increasing Ca2+ concentrations [0, 0.1, 0.2, 0.3, 0.5, 1mM]. (A) Representative Fluo-4 AM trace
of cytosolic Ca2+ fluorescence, expressed as F/F0. Bar represents superfusate with length of bar
proportional to duration of superfusion. (B) Cumulative fraction of cells exhibiting SOICR at
each Ca2+ concentration. Vehicle treated PKCε transfected HEK293 cells (red line) n = 4 and
Dic8 treated PKCε transfected HEK293 cells (blue line) n = 4. n represents number of
coverslips per condition, with 150-250 cells counted per coverslip. Data expressed as mean ±
SEM.

45
3.4.2 Luminal Ca2+ Imaging
3.4.2.1 PKCε Overexpression
To confirm the effect of PKCε on the occurrence of SOICR in Figure 3.9, SR store dynamics
were also assessed. HEK293 cells were co-transfected with PKCε and the luminal Ca2+
indicator protein, D1ER. As described in Section 2.3.3.1, cells are continuously superfused with
different KRH solutions; 0, 1, 2 mM Ca2+, 2 mM Ca2+ with 2 mM tetracaine and 2 mM Ca2+
with 20 mM caffeine. Fmax, Fmin, FSOICR and Ftermi parameters were determined from the single
cell luminal Ca2+ fluorescence traces and normalised to Fmin to calculate SOICR characteristics,
seen in Figure 3.11 A. The percentage of store size (Fmax – Fmin), release threshold ([FSOICR –
Fmin] / [Fmax – Fmin] x 100) and termination threshold ([Ftermi – Fmin] / [Fmax – Fmin] x 100) were
calculated for each condition (Mock transfected HEK293 cells and PKCε transfected HEK293
cells) and statistical significance was assessed with an unpaired two-tailed student’s t-test.
Figure 3.11 B shows no change in the total store size between the PKCε and mock transfected
HEK293 cells (p = 0.85). Figure 3.11 C and Figure 3.11 D show that PKCε transfected HEK293
cells resulted in a decrease in both termination threshold (38.22 ± 1.61 versus 43.4 ± 1.01) (p =
0.005) and release threshold (87.47 ± 1.07 versus 90.77 ± 0.53) (p = 0.002) respectively,
consistent with the increase in SOICR observed in Figure 3.9 B.

46
A
B
C
D
Figure 3.11 PKCε reduces release and termination threshold. HEK293 cells transfected with the luminal Ca2+ indicator protein, D1ER were superfused with
increasing Ca2+ concentrations [0,1, 2mM] followed by tetracaine and caffeine. (A)
Representative D1ER trace luminal Ca2+ fluorescence. Bar represents superfusate with length
of bar proportional to duration of superfusion. Bar graph of the percentage of (B) store size, (C)
release threshold and (D) termination threshold for each condition. Mock transfected HEK293
cells (red bar) n = 110 and PKCε transfected HEK293 cells (blue bar) n = 52. n represents the
number of cells per condition. Data expressed as mean ± SEM.

47
4 Discussion
4.1 Results
In this study, I hypothesised that one of the possible molecular pathways in which DM patients
have an increased risk and association with arrhythmia was due to excessive PKC activity, due
to an accumulation of DAG, resulting in phosphorylation of RyR2 triggering SOICR a
precursor for arrhythmogenesis. To test this hypothesis, I first looked at the effect of activation
or inhibition of endogenous PKC in HEK293 cells on the occurrence of SOICR. My results
showed that activation of PKC using Dic8 increased the occurrence of SOICR, suggesting that
one or many of the PKC isoforms expressed endogenously in HEK293 can phosphorylate the
RyR2, resulting in the increase in SOICR (Figure 3.2). I then showed that when inhibiting
endogenous PKC in HEK293 cells, using Go6983, there is a massive increase in the occurrence
of SOICR; this was unexpected as an increased activity of endogenous PKC also showed an
increase in the occurrence of SOICR (Figure 3.3). The result of increased and decreased
endogenous PKC activity in HEK293 suggests that that either Dic8 or Go6983 may have effects
on proteins other than PKC or that modulation of PKC in HEK293 cells alters multiple
pathways linked to SOICR. Through the work of others in the lab, we found that Go6983 is
likely to be affecting RyR2 directly (See Section 4.1.2). Disregarding the effect of Go6983 my
other data suggest that activation of PKC increases the incidence of SOICR as hypothesised.
As it was unclear which PKC isoform/s resulted in an increase of SOICR occurrence using
Dic8, I next aimed to determine the isoform responsible. I chose to start with examining the
effect of PKCα on the occurrence of SOICR, as it has the highest isoform expression in the
human heart (Simonis et al., 2007). To look at the effect of PKCα I overexpressed this isoform
in my HEK293 cell model. Western blot analysis showed that PKCα was successfully
transfected, where its expression increased by 5.5-fold when transfected with PKCα cDNA

48
(Figure 3.4). My research showed that overexpression of PKCα in HEK293 cells resulted in a
small increase in the occurrence of SOICR at low Ca2+ concentrations, which suggests that
PKCα is unlikely to be the isoform responsible for the effect of endogenous activation of PKC
in HEK293 cells (Figure 3.5). As a cPKC isoform, PKCα requires both Ca2+ and DAG for
activation, hence when I overexpressed PKCα in HEK293 cells, I was uncertain if there are
enough substrates (DAG or Ca2+) for activation. As activation of endogenous PKC using Dic8
increased SOICR occurrence, I looked at the effect of overexpressed PKCα, with or without
Dic8. My results showed that PKCα plus Dic8 did not result in an increase in SOICR occurrence
compared to PKCα alone, suggesting that PKCα may not be phosphorylating the RyR2,
resulting in SOICR (Figure 3.6) under the conditions used in my assay. To further investigate
whether PKCα affects SR dynamics, HEK293 cells were co-transfected with both D1ER and
PKCα. My results show that overexpression of PKCα does not alter the SR store size or the
release threshold for SOICR, but instead results in an increase in the termination threshold,
suggesting overexpressed PKCα in HEK293 cells has no effect on increasing the occurrence of
SOICR but may actually reduce the magnitude of release (Figure 3.7). To then investigate the
whether PKCα with Dic8 affects SR dynamics, HEK293 cells were co-transfected with both
D1ER and PKCα, then treated with or without Dic8. My results show that overexpression of
PKCα with Dic8 show a decrease in the release threshold, suggesting overexpression of PKCα
with Dic8 should result in an increase in the occurrence of SOICR (Figure 3.8). Interestingly to
note is that the significant increase in the termination threshold by overexpressed PKCα in
Figure 3.7 is lost when using a one-way ANOVA with three conditions.
Following on from PKCα, I then decided to test a nPKC isoform that also has high expression
in the heart, PKCε, to see if there is a difference between the cPKC and nPKC subclasses. The
rationale for looking at a nPKC was that they do not need Ca2+ to be activated, just DAG which
I could add exogenously if required. My research showed that overexpression of PKCε in

49
HEK293 cells resulted in a dramatic increase in the occurrence of SOICR (Figure 3.9). This
suggests that PKCε may be one of the isoforms responsible for the increase in SOICR
occurrence due to endogenous activation of PKC in HEK293 cells, as these cells express PKCε
endogenously (Sakwe et al., 2004). As PKCε only requires DAG for activation, the addition of
Dic8 in HEK293 cells with overexpressed PKCε may result in a greater level of activity. When
I looked at the effect of overexpressed PKCε, with or without Dic8, my results showed that
PKCε with Dic8 did not result in a further increase in SOICR occurrence, suggesting that the
overexpressed PKCε was already fully activated by endogenous DAG (Figure 3.10). As
HEK293 cell were grown in high glucose concentrations their DAG levels could already be
very high (Ayo et al., 1991). To understand the mechanism behind the increased occurrence of
SOICR seen in overexpression of PKCε, I looked at its effect on SR dynamics. HEK293 cells
were co-transfected with D1ER and PKCε, and my results show that overexpression of PKCε
does not alter the SR store size and instead results in a decrease in both the release and
termination thresholds for SOICR (Figure 3.11). This suggests that PKCε phosphorylates the
RyR2 decreasing the release threshold for SOICR making it more likely to be surpassed
increasing the incidence of SOICR. This is consistent with the proposed effects of PKA and
CaMKII phosphorylation of RyR2 (Xiao et al., 2007; McCauley & Wehrens, 2011).
4.1.1 PKC Activation Effect on SOICR
As hypothesised, Dic8 increased the occurrence of SOICR in endogenous HEK293 cells. As
Dic8 is a DAG analogue, the effect in seen HEK293 cells would most likely be due to the
activation of cPKC and/or nPKC, but not an aPKC, as aPKCs require phosphatidylinositols for
activation (Xiao & Liu, 2013).

50
4.1.2 PKC Inhibition Effect on SOICR
Go6983 increased the occurrence of SOICR in HEK293 cells. This was inconsistent with the
effect of activation of PKC and contradictory to what I had hypothesised. However, Go6983
inhibits PKC by binding to the ATP site within the catalytic domain of PKC, preventing PKC
function. Currently, a Ph.D. project in the lab is looking at the effect of ATP-based kinase
inhibitors and their effect on RyR2 and SOICR. The results thus far show that many ATP-based
kinase inhibitors directly activate the RyR2, resulting in SOICR. This suggests that Go6983
may act on RyR2 in a similar way, making any results obtained using this drug difficult to
interpret. For this reason, I decided to discontinue the use of Go6983 for the rest of the study.
In the future, to determine the effect of inhibiting endogenous PKC in HEK293 cells, I could
use Calphostin C; a potent and selective PKC inhibitor that specifically targets the regulatory
domain of PKC (Kobayashi et al., 1989). I would expect to see the opposite effect of PKC
activation, therefore, a decrease in the occurrence of SOICR along with an increase in the
release threshold for SOICR.
4.1.3 Effect of PKCα Overexpression on SOICR
Overexpression of PKCα resulted in no change in the release threshold for SOICR, which was
inconsistent with a small increase in the occurrence of SOICR. I, therefore, reject my hypothesis
that PKCα would decrease the release threshold for SOICR and increase the SOICR occurrence,
as an increase in SOICR occurrence is expected to be matched with a decreased release
threshold for SOICR. However, the very small increase in SOICR occurrence would only
require a small reduction in the release threshold for SOICR which could have been below the
sensitivity of my SR Ca2+ measurement assay. Interestingly, PKCα overexpression results in an
increase in the termination threshold for SOICR. An increase in termination threshold without
a change in release threshold for SOICR would imply a reduction in the fraction of Ca2+ release,
however, this possibly would have no effect on the occurrence of SOICR. Though, when the

51
conditions mock, PKCα and PKCα with Dic8 were assessed (Figure 3.8 C), there were no
differences seen in the termination threshold, therefore, PKCα possibly has no consistent effect
on termination threshold.
Although Figure 3.4 shows that transfection of PKCα increased the total protein level, it gives
no indication of misfolded or inactive proteins, therefore, the use of a PKC activity assay could
be used to determine the activity of PKCα transfection (Murillo-Carretero et al., 2017).
My results showed that PKCα with Dic8 decreased release threshold for SOICR (Figure 3.8 B).
This result could suggest that Dic8 activates the overexpressed PKCα, allowing for a significant
reduction in release threshold which would be consistent with the small increase in SOICR
occurrence with PKCα. Alternatively, it could be that Dic8 results in a decreased release
threshold for SOICR, regardless of the overexpression of PKCα, which is consistent with the
increase in the SOICR occurrence seen with Dic8 alone. To confirm if the results shown in
Figure 3.8 B is Dic8 independent, luminal Ca2+ imaging comparing Dic8 versus vehicle treated
HEK293 cells would be performed in the future, where the decrease in the release threshold
would be compared to the decrease release threshold in the Dic8 with PKCα overexpression.
4.1.4 Effect of PKCε Overexpression on SOICR
Overexpression of PKCε resulted in a reduction in the termination threshold and release
threshold for SOICR which was consistent with the large increase in the occurrence of SOICR.
A reduction of the termination threshold means that there is an increase in the amount of Ca2+
released during Ca2+ release events (CICR and SOICR), whereas a reduction of the release
threshold for SOICR means that less Ca2+ within the SR is required to activate RyR2, resulting
in a SOCIR event. Therefore, I accepted my hypothesis that PKCε can modulate SOICR (the
RyR2), as the increase in SOICR occurrence was matched with a decreased release threshold

52
for SOICR. As mentioned in Section 1.3.1, a reduction of the release threshold can lead to a
SOICR event, therefore, severely increasing the occurrence of arrhythmia (Liu et al., 2017).
Though the reduction of release threshold for SOICR between PKCε transfection versus mock
transfected HEK293 cells seems like a small change (~3% decrease), it is consistent with other
studies that looked at RyR2 mutations, that can cause sudden cardiac death, which showed a
~9% reduction in the release threshold for SOICR (Liu et al., 2013).
4.2 Proposed Model of Action of PKCε on SOICR
PKCε results in a reduction of the release threshold and termination threshold, along with an
increased occurrence of SOICR, however, the molecular interaction that results in these changes
are unknown. The current literature has led us to the deduction that there are three proposed
models in which these effects could occur.
4.2.1 PKCε Phosphorylation of RyR2
Kinases that become overexpressed, such as CaMKII and PKA, can lead to RyR2
phosphorylation, resulting in the reduction of the release threshold and termination threshold,
increasing the occurrence of SOICR and the amount of Ca2+ released (Wehrens et al., 2006).
Transgenic mice that had an acute overexpression of CaMKIIδ resulted in an increase in Ca2+
leak (SOICR) as well as an increase in RyR2 phosphorylation at S2809 and S2815 (Kohlhaas
et al., 2006). I therefore hypothesise that in DM, an increased activity PKCε results in a similar
fashion to these kinases through the phosphorylation of the RyR2 resulting in a structural
conformational change, resulting in both the reduction of the release threshold for SOICR,
thereby increasing Ca2+ leak (SOICR) and a reduction in termination threshold, increasing the
amount of Ca2+ released. As discussed in Section 1.3.1, if the SR Ca2+ load exceeds this release
threshold for SOICR, it results in RyR2-mediated Ca2+ release from the SR, where a reduction
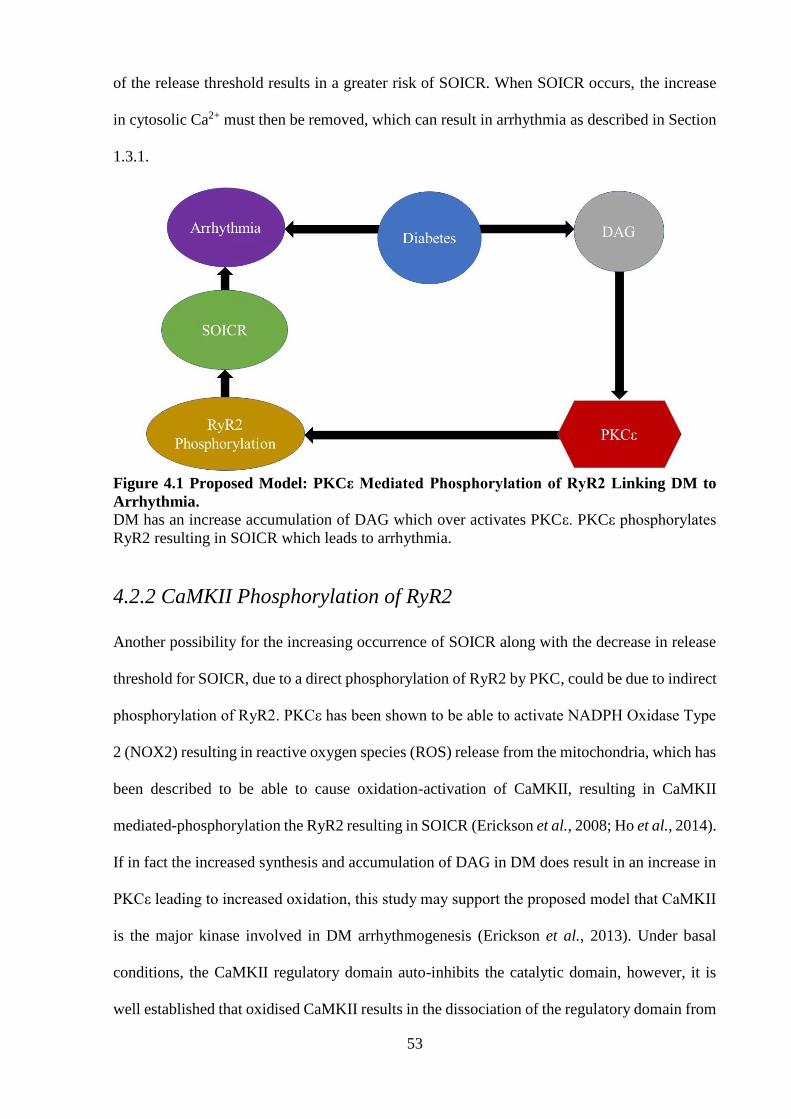
53
of the release threshold results in a greater risk of SOICR. When SOICR occurs, the increase
in cytosolic Ca2+ must then be removed, which can result in arrhythmia as described in Section
1.3.1.
Figure 4.1 Proposed Model: PKCε Mediated Phosphorylation of RyR2 Linking DM to
Arrhythmia.
DM has an increase accumulation of DAG which over activates PKCε. PKCε phosphorylates
RyR2 resulting in SOICR which leads to arrhythmia.
4.2.2 CaMKII Phosphorylation of RyR2
Another possibility for the increasing occurrence of SOICR along with the decrease in release
threshold for SOICR, due to a direct phosphorylation of RyR2 by PKC, could be due to indirect
phosphorylation of RyR2. PKCε has been shown to be able to activate NADPH Oxidase Type
2 (NOX2) resulting in reactive oxygen species (ROS) release from the mitochondria, which has
been described to be able to cause oxidation-activation of CaMKII, resulting in CaMKII
mediated-phosphorylation the RyR2 resulting in SOICR (Erickson et al., 2008; Ho et al., 2014).
If in fact the increased synthesis and accumulation of DAG in DM does result in an increase in
PKCε leading to increased oxidation, this study may support the proposed model that CaMKII
is the major kinase involved in DM arrhythmogenesis (Erickson et al., 2013). Under basal
conditions, the CaMKII regulatory domain auto-inhibits the catalytic domain, however, it is
well established that oxidised CaMKII results in the dissociation of the regulatory domain from

54
the catalytic domain, leading to over-activity of the kinase (Erickson et al., 2008; Erickson et
al., 2011). Not only can oxidised CaMKII result in an increase in activity, but recent studies
have also shown that O-linked glycosylation (another modification occurring in diabetes) of
CaMKII can increase its activity (Erickson et al., 2013).
Figure 4.2 Proposed Model: PKCε Activation of CaMKII Links DM to Arrhythmia. DM has an increase accumulation of DAG which over activates PKCε. PKCε activates NOX2
increase ROS production and release increase CaMKII activation. Hyperglycemic environment
in DM results in O-linked glycosylation of CaMKII increasing its activation. Hyper activation
of CaMKII results in phosphorylation of RyR2 allowing for SOICR which leads to arrhythmia.
4.2.3 Oxidation of RyR2
Oxidation of the RyR2 has been shown to lead to a reduction of the release threshold resulting
in SOICR, therefore, the increased occurrence of SOICR when there is overexpression of PKCε
may be due to the activation of NOX2 causing ROS production and release, which then could
result in the oxidation of RyR2 (Mi et al., 2015; Waddell et al., 2016).

55
Figure 4.3 Proposed Model: PKCε Mediated Oxidation of RyR2 Links DM to arrhythmia.
DM has an increase accumulation of DAG which over activates PKCε. PKCε activates NOX2
increase ROS production. The increase in ROS can lead to oxidation of RyR2 allowing for
SOICR which leads to arrhythmia.
Overall, I propose that there are three possible models by which PKCε may result in a reduction
of release threshold along with increased SOICR as seen in my study. To determine the most
probable mode in which PKCε acts to increase SOICR, overexpression of PKCε with either;
anti-oxidants to prevent oxidation of CaMKII or RyR2 by reducing ROS, CaMKII inhibitor
(KN-93) to prevent CaMKII phosphorylation of RyR2 by preventing the dissociation of the
autoinhibitory regulatory domain from the catalytic domain, or NOX2 inhibitor (Apocynin) to
prevent ROS production by preventing the assembly of the NOX2 subunits (Birben et al., 2012;
Pellicena & Schulman, 2014; Qin et al., 2017). If there is still a reduction in release threshold
with increased SOICR when using an anti-oxidant, KN-93 and Phox-l2, then I would accept
the proposed model in Figure 4.1. If, however, the use of KN-93 results abolishes the effect,
PKCε would most likely be due to the activation of CaMKII, therefore, I would accept the
proposed model in Figure 4.2. If the effect is still seen with KN-93 but abolished or reduced
significantly with Apocynin, I would accept the proposed model in Figure 4.3. It is also possible
that all three proposed models work together simultaneously.

56
4.3 Limitations
In my study I used HEK293 cells expressing RyR2 where the dynamics of Ca2+ release and
entry were directly mediated by RyR2 and SERCA respectively, therefore, changes seen in
SOICR could directly be linked to RyR2 mediated changes. However, in a cardiomyocyte, there
are many other Ca2+ handling proteins that can be altered which could affect SOICR or the
accumulation of Ca2+ within the cytosol. Currently, what is known about PKC role in the
activity of other Ca2+ handling proteins is that PKCα in heart failure has been shown to
phosphorylate protein phosphatase 1 (PP1), activating it, resulting in hypophosphorylation of
PLB, thereby decreasing SERCA function (Braz et al., 2004). The effect of PKC, regardless of
isoform, on other Ca2+ handling proteins such as LTCC, NCX and Ca2+-ATPase are not yet
established, therefore, I must interpret results found in future studies on PKC in animal or
human cardiac tissue with consideration of the multifaceted system.
Due to time constraints, I was unable to complete an ideal suite of experiments. To complete
my study, it would be prudent to perform the following additional work:
1) Western blot analysis looking at total RyR2, PKCε and GAPDH using cell lysates from
HEK293 cells transfected with PKCε to confirm transfection efficiency and that PKCε
does not change RyR2 expression.
2) Luminal Ca2+ imaging to determine if Dic8 alone reduces the release threshold for
SOICR, mentioned in Section 4.1.3.
3) Cytosolic and luminal Ca2+ imaging using Calphostin C to determine the effect of ATP-
based kinase inhibitor independent inhibition of endogenous PKC on SOICR.

57
4.4 Future Steps
4.4.1 Cellular Studies
To determine if the effect of Dic8 was specific to one of the subclasses, the use of a broad
spectrum nPKC or cPKC (Bisindolylmaleimide) inhibitor could be used along with Dic8 (Hers
et al., 1999). If the nPKC inhibitor or Bisindolylmaleimide attenuates the increase in SOICR
seen by Dic8, then it is most likely the subclass being activated with Dic8 resulting in an
increase in SOICR occurrence. The development of a broad nPKC inhibitor is required.
To confirm my hypothesis that RyR2 phosphorylation by PKC is what results in the decreased
release threshold and thus the increased SOICR occurrence, western blotting looking at total
phosphorylation of RyR2 using an antibody that binds specifically to phosphorylated residues
normalised to total RyR2 would be required. I could then compare RyR2 phosphorylation levels
between PKCα, PKCε, and mock transfected HEK293 cell lysates. As my results showed a
decreased release threshold and termination threshold as well as an increase in SOICR
occurrence with PKCε transfected HEK293 cells, I would expect an increase in total RyR2
phosphorylation compared to the mock transfected cells, where I would expect to see little/no
change in total RyR2 phosphorylation due to PKCα. If results show an increase in RyR2
phosphorylation, the next step would then be to determine the site of phosphorylation. One way
is to use bioinformatics (software/websites) to predict possibly PKC phosphorylation sites
within RyR2 that matches the consensus sequence (Bauerova-Hlinkova et al., 2010; Gao et al.,
2010). The presence/ absence of these sites can then be confirmed using mass spectrometry
(Dephoure et al., 2013). The sites can then be manipulated using site-directed mutagenesis to
perform functional studies and specific antibodies can be developed that target these sites of
interest to understand the level of phosphorylation (Carter, 1986; Goto & Inagaki, 2007).

58
In many proposed models of RyR2, there is a certain phosphorylation ‘hot spot’ where three
residues have been proposed to be phosphorylated by PKA, CaMKII, and PKG (Valdivia,
2012). Due to the intensive research into RyR2 phosphorylation at these sites, HEK293 cell
models expressing mutant forms of RyR2 have been developed where serine is replaced by
alanine at the proposed phosphorylation target to prevent phosphorylation (Meng et al., 2007).
To determine if one of these three sites is a potential site of phosphorylation, the increase of
SOICR occurrence due to PKCε transfection, would be diminished or abolished when using
these HEK293 cell mutants with either one, two, or all three sites being altered from serine to
alanine.
Along with PKCα and PKCε, PKCβ2 and PKCδ have also been shown to be expressed in the
heart and also have an increased activity or expression in DM (Borghini et al., 1994). Using the
same experimental design as this study examining the effect of PKCβ2 and PKCδ could give
further insight into which isoform results in the highest promotion of SOICR, in order to
propose a potential therapeutic target in DM, as well as if RyR2 phosphorylation is also
dependent on the subclass rather than the isoform (PKCβ2 and PKCδ are cPKC and nPKC
respectively). One thing that must be considered is that each isoform may be phosphorylating
the RyR2 at different rates and at different sites all with different effects making the model yet
more complicated.
4.4.2 Animal Studies
Following from cellular studies, the next step would be to determine the effect of PKC mediated
SOICR in rat cardiomyocytes. Not only have DM rats been shown to have an increased risk of
arrhythmia, they also show an increase in Ca2+ leak within the cardiomyocytes compared to
non-DM (Smogorzewski et al., 1998; Movahed et al., 2005; Yaras et al., 2005). For my
experiment, rat hearts of DM and non-DM would be excised and cardiomyocytes would be

59
isolated using enzymatic digestion. These isolated cardiomyocytes would then be loaded with
a cytosolic Ca2+ indicator dye, where cytosolic Ca2+ imaging would be performed to determine
the occurrence of SOICR (Mu et al., 2014). Therefore, my experiment would be to see the effect
of SOICR in DM rat cardiomyocytes treated with a PKC inhibitor. I would expect that in the
DM rat cardiomyocytes, PKC inhibition would attenuate the increased occurrence in SOICR,
reducing the SOICR release similar to that of the non-DM rat. As my study showed that PKCε
increases SOICR, I would test the effect of PKCε inhibitor peptide that inhibits the translocation
of the active PKCε.
Functional effects of PKC inhibitors can also be used to see the generation of arrhythmia. DM
rats experiencing arrhythmogenic events, seen on an electrocardiography would be treated with
PKC inhibitors, where the occurrence of arrhythmic events would be compared between pre-
treatment and post-treatment. Here I would expect to see a reduction in arrhythmogenic events
in the post-treatment.
4.5 Summary
In summary, my results suggest that PKCε causes a reduction in the release threshold and
termination threshold, thereby resulting in an increase in the occurrence SOICR. The way in
which PKCε does this may either be through direct phosphorylation of RyR2, indirect
phosphorylation of RyR2 through the oxidation-activation of CaMKII, or oxidation-activation
of RyR2. PKCε is not only highly expressed in the heart, but it has increased activation in DM,
therefore, it may be a novel link between DM and arrhythmia.

60
References
Adrover M, Vilanova B, Frau J, Munoz F & Donoso J. (2008). The pyridoxamine action on
Amadori compounds: A reexamination of its scavenging capacity and chelating effect.
Bioorg Med Chem 16, 5557-5569.
Aebi M. (2013). N-linked protein glycosylation in the ER. Biochim Biophys Acta 1833, 2430-
2437.
Alonso-Moran E, Orueta JF, Fraile Esteban JI, Arteagoitia Axpe JM, Marques Gonzalez ML,
Toro Polanco N, Ezkurra Loiola P, Gaztambide S & Nuno-Solinis R. (2014). The
prevalence of diabetes-related complications and multimorbidity in the population with
type 2 diabetes mellitus in the Basque Country. BMC Public Health 14, 1059.
Aronsen JM, Swift F & Sejersted OM. (2013). Cardiac sodium transport and excitation-
contraction coupling. J Mol Cell Cardiol 61, 11-19.
Aschar-Sobbi R, Emmett TL, Kargacin GJ & Kargacin ME. (2012). Phospholamban
phosphorylation increases the passive calcium leak from cardiac sarcoplasmic
reticulum. Pflugers Arch 464, 295-305.
Ayo SH, Radnik R, Garoni JA, Troyer DA & Kreisberg JI. (1991). High glucose increases
diacylglycerol mass and activates protein kinase C in mesangial cell cultures. Am J
Physiol 261, F571-577.
Bauerova-Hlinkova V, Hostinova E, Gasperik J, Beck K, Borko L, Lai FA, Zahradnikova A &
Sevcik J. (2010). Bioinformatic mapping and production of recombinant N-terminal
domains of human cardiac ryanodine receptor 2. Protein Expr Purif 71, 33-41.
Belke DD, Swanson EA & Dillmann WH. (2004). Decreased sarcoplasmic reticulum activity
and contractility in diabetic db/db mouse heart. Diabetes 53, 3201-3208.
Bers DM. (2002). Cardiac excitation-contraction coupling. Nature 415, 198-205.
Bers DM. (2004). Macromolecular complexes regulating cardiac ryanodine receptor function.
J Mol Cell Cardiol 37, 417-429.
Birben E, Sahiner UM, Sackesen C, Erzurum S & Kalayci O. (2012). Oxidative stress and
antioxidant defense. World Allergy Organ J 5, 9-19.
Bodiga VL, Eda SR & Bodiga S. (2014). Advanced glycation end products: role in pathology
of diabetic cardiomyopathy. Heart Fail Rev 19, 49-63.
Borghini I, Ania-Lahuerta A, Regazzi R, Ferrari G, Gjinovci A, Wollheim CB & Pralong WF.
(1994). Alpha, beta I, beta II, delta, and epsilon protein kinase C isoforms and
compound activity in the sciatic nerve of normal and diabetic rats. J Neurochem 62,
686-696.
Braz JC, Gregory K, Pathak A, Zhao W, Sahin B, Klevitsky R, Kimball TF, Lorenz JN, Nairn
AC, Liggett SB, Bodi I, Wang S, Schwartz A, Lakatta EG, DePaoli-Roach AA, Robbins
J, Hewett TE, Bibb JA, Westfall MV, Kranias EG & Molkentin JD. (2004). PKC-alpha
61
regulates cardiac contractility and propensity toward heart failure. Nat Med 10, 248-
254.
Carter P. (1986). Site-directed mutagenesis. Biochem J 237, 1-7.
Dephoure N, Gould KL, Gygi SP & Kellogg DR. (2013). Mapping and analysis of
phosphorylation sites: a quick guide for cell biologists. Mol Biol Cell 24, 535-542.
Eisner D, Bode E, Venetucci L & Trafford A. (2013). Calcium flux balance in the heart. J Mol
Cell Cardiol 58, 110-117.
Erickson JR. (2014). Mechanisms of CaMKII Activation in the Heart. Front Pharmacol 5, 59.
Erickson JR, He BJ, Grumbach IM & Anderson ME. (2011). CaMKII in the cardiovascular
system: sensing redox states. Physiol Rev 91, 889-915.
Erickson JR, Joiner ML, Guan X, Kutschke W, Yang J, Oddis CV, Bartlett RK, Lowe JS,
O'Donnell SE, Aykin-Burns N, Zimmerman MC, Zimmerman K, Ham AJ, Weiss RM,
Spitz DR, Shea MA, Colbran RJ, Mohler PJ & Anderson ME. (2008). A dynamic
pathway for calcium-independent activation of CaMKII by methionine oxidation. Cell
133, 462-474.
Erickson JR, Pereira L, Wang L, Han G, Ferguson A, Dao K, Copeland RJ, Despa F, Hart GW,
Ripplinger CM & Bers DM. (2013). Diabetic hyperglycaemia activates CaMKII and
arrhythmias by O-linked glycosylation. Nature 502, 372-376.
Eshete F, Chung H, Gannon-Murakami L & Murakami K. (1998). Ca2+ modulation of cis-
unsaturated fatty acid-induced mutant protein kinase C activity: indication of inhibitory
Ca2+-binding site in protein kinase C-alpha. Biochem J 333 ( Pt 1), 215-221.
Fischer TH, Herting J, Mason FE, Hartmann N, Watanabe S, Nikolaev VO, Sprenger JU, Fan
P, Yao L, Popov AF, Danner BC, Schondube F, Belardinelli L, Hasenfuss G, Maier LS
& Sossalla S. (2015). Late INa increases diastolic SR-Ca2+-leak in atrial myocardium
by activating PKA and CaMKII. Cardiovasc Res 107, 184-196.
Gao J, Thelen JJ, Dunker AK & Xu D. (2010). Musite, a tool for global prediction of general
and kinase-specific phosphorylation sites. Mol Cell Proteomics 9, 2586-2600.
Geraldes P & King GL. (2010). Activation of protein kinase C isoforms and its impact on
diabetic complications. Circ Res 106, 1319-1331.
Goto H & Inagaki M. (2007). Production of a site- and phosphorylation state-specific antibody.
Nat Protoc 2, 2574-2581.
Grace AA & Roden DM. (2012). Systems biology and cardiac arrhythmias. Lancet 380, 1498-
1508.
Graham FL & van der Eb AJ. (1973). A new technique for the assay of infectivity of human
adenovirus 5 DNA. Virology 52, 456-467.

62
Grundy SM, Benjamin IJ, Burke GL, Chait A, Eckel RH, Howard BV, Mitch W, Smith SC, Jr.
& Sowers JR. (1999). Diabetes and cardiovascular disease: a statement for healthcare
professionals from the American Heart Association. Circulation 100, 1134-1146.
Hers I, Tavare JM & Denton RM. (1999). The protein kinase C inhibitors bisindolylmaleimide
I (GF 109203x) and IX (Ro 31-8220) are potent inhibitors of glycogen synthase kinase-
3 activity. FEBS Lett 460, 433-436.
Ho HT, Liu B, Snyder JS, Lou Q, Brundage EA, Velez-Cortes F, Wang H, Ziolo MT, Anderson
ME, Sen CK, Wehrens XH, Fedorov VV, Biesiadecki BJ, Hund TJ & Gyorke S. (2014).
Ryanodine receptor phosphorylation by oxidized CaMKII contributes to the cardiotoxic
effects of cardiac glycosides. Cardiovasc Res 101, 165-174.
Hongpaisan J, Sun MK & Alkon DL. (2011). PKC epsilon activation prevents synaptic loss,
Abeta elevation, and cognitive deficits in Alzheimer's disease transgenic mice. J
Neurosci 31, 630-643.
Houser SR. (2000). When does spontaneous sarcoplasmic reticulum CA(2+) release cause a
triggered arrythmia? Cellular versus tissue requirements. Circ Res 87, 725-727.
Huke S & Bers DM. (2008). Ryanodine receptor phosphorylation at Serine 2030, 2808 and
2814 in rat cardiomyocytes. Biochem Biophys Res Commun 376, 80-85.
Jones PP, Jiang D, Bolstad J, Hunt DJ, Zhang L, Demaurex N & Chen SR. (2008). Endoplasmic
reticulum Ca2+ measurements reveal that the cardiac ryanodine receptor mutations
linked to cardiac arrhythmia and sudden death alter the threshold for store-overload-
induced Ca2+ release. Biochem J 412, 171-178.
Kamato D, Mitra P, Davis F, Osman N, Chaplin R, Cabot PJ, Afroz R, Thomas W, Zheng W,
Kaur H, Brimble M & Little PJ. (2017). Gaq proteins: molecular pharmacology and
therapeutic potential. Cell Mol Life Sci 74, 1379-1390.
Kania E, Roest G, Vervliet T, Parys JB & Bultynck G. (2017). IP3 Receptor-Mediated Calcium
Signaling and Its Role in Autophagy in Cancer. Front Oncol 7, 140.
Kirwan AF, Bibby AC, Mvilongo T, Riedel H, Burke T, Millis SZ & Parissenti AM. (2003).
Inhibition of protein kinase C catalytic activity by additional regions within the human
protein kinase Calpha-regulatory domain lying outside of the pseudosubstrate sequence.
Biochem J 373, 571-581.
Kobayashi E, Nakano H, Morimoto M & Tamaoki T. (1989). Calphostin C (UCN-1028C), a
novel microbial compound, is a highly potent and specific inhibitor of protein kinase C.
Biochem Biophys Res Commun 159, 548-553.
Kohlhaas M, Zhang T, Seidler T, Zibrova D, Dybkova N, Steen A, Wagner S, Chen L, Brown
JH, Bers DM & Maier LS. (2006). Increased sarcoplasmic reticulum calcium leak but
unaltered contractility by acute CaMKII overexpression in isolated rabbit cardiac
myocytes. Circ Res 98, 235-244.
Kong H, Jones PP, Koop A, Zhang L, Duff HJ & Chen SR. (2008). Caffeine induces Ca2+
release by reducing the threshold for luminal Ca2+ activation of the ryanodine receptor.
Biochem J 414, 441-452.

63
Liao MH, Xiang YC, Huang JY, Tao RR, Tian Y, Ye WF, Zhang GS, Lu YM, Ahmed MM,
Liu ZR, Fukunaga K & Han F. (2013). The disturbance of hippocampal
CaMKII/PKA/PKC phosphorylation in early experimental diabetes mellitus. CNS
Neurosci Ther 19, 329-336.
Liu Y, Kimlicka L, Hiess F, Tian X, Wang R, Zhang L, Jones PP, Van Petegem F & Chen SR.
(2013). The CPVT-associated RyR2 mutation G230C enhances store overload-induced
Ca2+ release and destabilizes the N-terminal domains. Biochem J 454, 123-131.
Liu Y, Wei J, Wong King Yuen SM, Sun B, Tang Y, Wang R, Van Petegem F & Chen SRW.
(2017). CPVT-associated cardiac ryanodine receptor mutation G357S with reduced
penetrance impairs Ca2+ release termination and diminishes protein expression. PLoS
One 12, e0184177.
Maurya AK & Vinayak M. (2015). Modulation of PKC signaling and induction of apoptosis
through suppression of reactive oxygen species and tumor necrosis factor receptor 1
(TNFR1): key role of quercetin in cancer prevention. Tumour Biol 36, 8913-8924.
McCauley MD & Wehrens XH. (2011). Ryanodine receptor phosphorylation,
calcium/calmodulin-dependent protein kinase II, and life-threatening ventricular
arrhythmias. Trends Cardiovasc Med 21, 48-51.
Meng X, Xiao B, Cai S, Huang X, Li F, Bolstad J, Trujillo R, Airey J, Chen SR, Wagenknecht
T & Liu Z. (2007). Three-dimensional localization of serine 2808, a phosphorylation
site in cardiac ryanodine receptor. J Biol Chem 282, 25929-25939.
Mi T, Xiao Z, Guo W, Tang Y, Hiess F, Xiao J, Wang Y, Zhang JZ, Zhang L, Wang R, Jones
PP & Chen SR. (2015). Role of Cys(3)(6)(0)(2) in the function and regulation of the
cardiac ryanodine receptor. Biochem J 467, 177-190.
Mochly-Rosen D, Das K & Grimes KV. (2012). Protein kinase C, an elusive therapeutic target?
Nat Rev Drug Discov 11, 937-957.
Movahed MR, Hashemzadeh M & Jamal MM. (2005). Diabetes mellitus is a strong,
independent risk for atrial fibrillation and flutter in addition to other cardiovascular
disease. Int J Cardiol 105, 315-318.
Mu YH, Zhao WC, Duan P, Chen Y, Zhao WD, Wang Q, Tu HY & Zhang Q. (2014). RyR2
modulates a Ca2+-activated K+ current in mouse cardiac myocytes. PLoS One 9,
e94905.
Murillo-Carretero M, Geribaldi-Doldán N, Flores-Giubi E, García-Bernal F, Navarro-Quiroz
E, Carrasco M, Macías-Sánchez A, Herrero-Foncubierta P, Delgado-Ariza A,
Verástegui C, Domínguez-Riscart J, Daoubi M, Hernández-Galán R & Castro C (2017).
ELAC (3,12-di-O-acetyl-8-O-tigloilingol), a plant-derived lathyrane diterpene, induces
subventricular zone neural progenitor cell proliferation through PKCβ
activation. British Journal of Pharmacology 174, 2373-2392.

64
NCD Risk Factor Collaboration. (2016). Worldwide trends in diabetes since 1980: a pooled
analysis of 751 population-based studies with 4.4 million participants. Lancet 387,
1513-1530.
New DC & Wong YH. (2007). Molecular mechanisms mediating the G protein-coupled
receptor regulation of cell cycle progression. J Mol Signal 2, 2.
Newton AC. (2003). Regulation of the ABC kinases by phosphorylation: protein kinase C as a
paradigm. Biochem J 370, 361-371.
Newton AC, Antal CE & Steinberg SF. (2016). Protein kinase C mechanisms that contribute to
cardiac remodelling. Clin Sci (Lond) 130, 1499-1510.
Overend CL, Eisner DA & O'Neill SC. (1997). The effect of tetracaine on spontaneous Ca2+
release and sarcoplasmic reticulum calcium content in rat ventricular myocytes. J
Physiol 502 ( Pt 3), 471-479.
Palade P, Mitchell RD & Fleischer S. (1983). Spontaneous calcium release from sarcoplasmic
reticulum. General description and effects of calcium. J Biol Chem 258, 8098-8107.
Pellicena P & Schulman H. (2014). CaMKII inhibitors: from research tools to therapeutic
agents. Front Pharmacol 5, 21.
Pieters M, van Zyl DG, Rheeder P, Jerling JC, Loots du T, van der Westhuizen FH, Gottsche
LT & Weisel JW. (2007). Glycation of fibrinogen in uncontrolled diabetic patients and
the effects of glycaemic control on fibrinogen glycation. Thromb Res 120, 439-446.
Ping P, Zhang J, Qiu Y, Tang XL, Manchikalapudi S, Cao X & Bolli R. (1997). Ischemic
preconditioning induces selective translocation of protein kinase C isoforms epsilon and
eta in the heart of conscious rabbits without subcellular redistribution of total protein
kinase C activity. Circ Res 81, 404-414.
Puttaiah S, Zhang Y, Pilch HA, Pfahler C, Oya-Ito T, Sayre LM & Nagaraj RH. (2006).
Detection of dideoxyosone intermediates of glycation using a monoclonal antibody:
characterization of major epitope structures. Arch Biochem Biophys 446, 186-196.
Qin YY, Li M, Feng X, Wang J, Cao L, Shen XK, Chen J, Sun M, Sheng R, Han F & Qin ZH.
(2017). Combined NADPH and the NOX inhibitor apocynin provides greater anti-
inflammatory and neuroprotective effects in a mouse model of stroke. Free Radic Biol
Med 104, 333-345.
Saffitz JE. (2005). Dependence of electrical coupling on mechanical coupling in cardiac
myocytes: insights gained from cardiomyopathies caused by defects in cell-cell
connections. Ann N Y Acad Sci 1047, 336-344.
Sakwe AM, Larsson M & Rask L. (2004). Involvement of protein kinase C-alpha and -epsilon
in extracellular Ca(2+) signalling mediated by the calcium sensing receptor. Exp Cell
Res 297, 560-573.
Sakwe AM, Rask L & Gylfe E. (2005). Protein kinase C modulates agonist-sensitive release of
Ca2+ from internal stores in HEK293 cells overexpressing the calcium sensing receptor.
J Biol Chem 280, 4436-4441.

65
Sandow A. (1952). Excitation-contraction coupling in muscular response. Yale J Biol Med 25,
176-201.
Shan J, Xie W, Betzenhauser M, Reiken S, Chen BX, Wronska A & Marks AR. (2012).
Calcium leak through ryanodine receptors leads to atrial fibrillation in 3 mouse models
of catecholaminergic polymorphic ventricular tachycardia. Circ Res 111, 708-717.
Simonis G, Briem SK, Schoen SP, Bock M, Marquetant R & Strasser RH. (2007). Protein
kinase C in the human heart: differential regulation of the isoforms in aortic stenosis or
dilated cardiomyopathy. Mol Cell Biochem 305, 103-111.
Siscovick DS, Sotoodehnia N, Rea TD, Raghunathan TE, Jouven X & Lemaitre RN. (2010).
Type 2 diabetes mellitus and the risk of sudden cardiac arrest in the community. Rev
Endocr Metab Disord 11, 53-59.
Smogorzewski M, Galfayan V & Massry SG. (1998). High glucose concentration causes a rise
in [Ca2+]i of cardiac myocytes. Kidney Int 53, 1237-1243.
Stahelin RV, Digman MA, Medkova M, Ananthanarayanan B, Melowic HR, Rafter JD & Cho
W. (2005). Diacylglycerol-induced membrane targeting and activation of protein kinase
Cepsilon: mechanistic differences between protein kinases Cdelta and Cepsilon. J Biol
Chem 280, 19784-19793.
Steinberg SF. (2012). Cardiac actions of protein kinase C isoforms. Physiology (Bethesda) 27,
130-139.
Stitt AW, Moore JE, Sharkey JA, Murphy G, Simpson DA, Bucala R, Vlassara H & Archer
DB. (1998). Advanced glycation end products in vitreous: Structural and functional
implications for diabetic vitreopathy. Invest Ophthalmol Vis Sci 39, 2517-2523.
Takasago T, Imagawa T, Furukawa K, Ogurusu T & Shigekawa M. (1991). Regulation of the
cardiac ryanodine receptor by protein kinase-dependent phosphorylation. J Biochem
109, 163-170.
Tang Y, Tian X, Wang R, Fill M & Chen SR. (2012). Abnormal termination of Ca2+ release is
a common defect of RyR2 mutations associated with cardiomyopathies. Circ Res 110,
968-977.
Valdivia HH. (2012). Ryanodine receptor phosphorylation and heart failure: phasing out S2808
and "criminalizing" S2814. Circ Res 110, 1398-1402.
Van Petegem F. (2015). Ryanodine receptors: allosteric ion channel giants. J Mol Biol 427, 31-
53.
Venetucci LA, Trafford AW, O'Neill SC & Eisner DA. (2007). Na/Ca exchange: regulator of
intracellular calcium and source of arrhythmias in the heart. Ann N Y Acad Sci 1099,
315-325.
Waddell HMM, Zhang JZ, Hoeksema KJ, McLachlan JJ, McLay JC & Jones PP. (2016).
Oxidation of RyR2 Has a Biphasic Effect on the Threshold for Store Overload-Induced
Calcium Release. Biophys J 110, 2386-2396.

66
Wagner S, Maier LS & Bers DM. (2015). Role of sodium and calcium dysregulation in
tachyarrhythmias in sudden cardiac death. Circ Res 116, 1956-1970.
Wehrens XH, Lehnart SE, Reiken S, Vest JA, Wronska A & Marks AR. (2006). Ryanodine
receptor/calcium release channel PKA phosphorylation: a critical mediator of heart
failure progression. Proc Natl Acad Sci U S A 103, 511-518. Wiley J (2011). The Conduction System of the Heart. Higheredbcswileycom. Available at:
http://higheredbcs.wiley.com/legacy/college/tortora/0470565101/hearthis_ill/pap13e_ch2
0_illustr_audio_mp3_am/simulations/hear/heart_conduction.html [Accessed May 31,
2017]
Xia P, Inoguchi T, Kern TS, Engerman RL, Oates PJ & King GL. (1994). Characterization of
the mechanism for the chronic activation of diacylglycerol-protein kinase C pathway in
diabetes and hypergalactosemia. Diabetes 43, 1122-1129.
Xiao B, Tian X, Xie W, Jones PP, Cai S, Wang X, Jiang D, Kong H, Zhang L, Chen K, Walsh
MP, Cheng H & Chen SR. (2007). Functional consequence of protein kinase A-
dependent phosphorylation of the cardiac ryanodine receptor: sensitization of store
overload-induced Ca2+ release. J Biol Chem 282, 30256-30264.
Xiao H & Liu M. (2013). Atypical protein kinase C in cell motility. Cell Mol Life Sci 70, 3057-
3066.
Yaras N, Ugur M, Ozdemir S, Gurdal H, Purali N, Lacampagne A, Vassort G & Turan B.
(2005). Effects of diabetes on ryanodine receptor Ca release channel (RyR2) and Ca2+
homeostasis in rat heart. Diabetes 54, 3082-3088.
Zhang D & Aravind L. (2010). Identification of novel families and classification of the C2
domain superfamily elucidate the origin and evolution of membrane targeting activities
in eukaryotes. Gene 469, 18-30.
Zhang JZ, Waddell HM & Jones PP. (2015). Regulation of RYR2 by sarcoplasmic reticulum
Ca(2+). Clin Exp Pharmacol Physiol 42, 720-726.
Zhang P, Smith-Nguyen EV, Keshwani MM, Deal MS, Kornev AP & Taylor SS. (2012).
Structure and allostery of the PKA RIIbeta tetrameric holoenzyme. Science 335, 712-
716.
Zimmet P, Alberti KG & Shaw J. (2001). Global and societal implications of the diabetes
epidemic. Nature 414, 782-787.