piroxicam derivatives thz classification€¦ · investigations of spectrally similar molecules in...
TRANSCRIPT

Piroxicam derivatives THz classification
Lukasz A. Sterczewski*1, Michal P. Grzelczak1, Kacper Nowak1, Bogusław Szlachetko1, Stanislawa
Plinska2, Berenika Szczesniak- Siega2, Wieslaw Malinka2 , and Edward F. Plinski1
1: Wroclaw University of Technology, Wybrzeze Stanislawa Wyspianskiego 27
Wroclaw, 50-370, Poland
2: Wroclaw Medical University, Wybrzeze Ludwika Pasteura 1,
Wroclaw, 50-376, Poland
ABSTRACT In this paper we report a new approach to linking the terahertz spectral shapes of drug candidates having a similar molecular
structure to their chemical and physical parameters. We examined 27 newly-synthesized derivatives of a well-known non-
steroidal anti-inflammatory drug Piroxicam used for treatment of inflammatory arthritis and chemoprevention of colon
cancer. The testing was carried out by means of terahertz pulsed spectroscopy (TPS). Using chemometric techniques we
evaluated their spectral similarity in the terahertz range and attempted to link the position on the principal component
analysis (PCA) score map to the similarity of molecular descriptors. A simplified spectral model preserved 75% and 85.1%
of the variance in 2 and 3 dimensions respectively, compared to the input 1137. We have found that in 85% of the
investigated samples a similarity of the physical and chemical parameters corresponds to a similarity in the terahertz
spectra. The effects of data preprocessing on the generated maps are also discussed. The technique presented can support
the choice of the most promising drug candidates for clinical trials in pharmacological research.
Keywords: Piroxicam, drug discovery, terahertz spectroscopy, chemometrics, principal component analysis
1. INTRODUCTION
The concept of similarity, one of the most powerful perceptual qualities, which led to the development of different
areas of sciences [1], plays a key role in the drug discovery process. Nowadays, the synthesis of many new bioactive
molecules is based on the search for those which are structurally or spectrally similar to the existing ones to imitate or
supersede them so as to minimize the oral dosage and reduce the potential side-effects. Since drugs are usually heavy
organic molecules, studies in the infrared portion of the electromagnetic spectrum, where they have strong absorption
features characteristic of their structure, are an integral part of a drug research and development. Usually, the spectral
similarity in the infrared region corresponds, with a good agreement, to the structural similarity [2]. The effective
quantification algorithms of the aforementioned spectral similarity, which constitute the core part of each spectral database,
used to be developed mainly for the rich and distinct IR spectra. Although they mostly rely on statistical and geometrical
methods, new ideas are still being introduced [3], due to the importance of this primary concept of similarity in chemical
and pharmaceutical research.
In the terahertz regime (0.1-3 THz) a large number of solid-state compounds exhibit strong vibrational modes due
to the hydrogen bonding interactions, the van der Waals forces and the vibrations of a crystal lattice. Many drugs [4],
explosives [5], plastics [6], and food ingredients [7] have shown characteristic ‘fingerprints’ in the far-infrared region.
Profitably, terahertz spectroscopy enables the detection of the phenomenon of polymorphism – the existence of a
compound in more than one crystal structure – or that of pseudo-polymorphism, such as for instance hydration, i.e. the
presence of water as an integral part of the crystal lattice. In pharmacological research, issues such as the undesired
polymorphic or pseudo-polymorphic state can significantly change the properties of a newly synthesized drug, invisible in
the near- or mid-infrared spectrum. These advantages qualify the terahertz spectroscopy as a promising tool to support the
process of conscious drug research.
Investigations of spectrally similar molecules in the terahertz part of the electromagnetic spectrum have already
been carried out [8] but their coverage was limited mainly to the study of the structural isomers of compounds: glucose
and fructose [9] or benzene [10]. The use of a statistical algorithm to measure the spectral similarity – the principal
component analysis (PCA) – on the terahertz data involved an estimation of the concentration in ternary mixtures of food
ingredients [11], and a characterization of the protein – the antibody interaction [12]. In contrast to previous works, we
Proceedings manuscript submitted to SPIE Photonics West 2016, San Francisco, CA, USA: Terahertz, RF, Millimeter, and Submillimeter-Wave Technology and Applications IX, for full version please see: http://dx.doi.org/10.1117/12.2224913
* [email protected]________________________________________

would like to propose a method to link the position of the structurally and spectrally similar molecules of a drug to the
chemical and physical parameters, as well as the drug's effectiveness. We have examined 27 newly-synthesized derivatives
of a well-known non-steroidal anti-inflammatory drug (NSAID) called Piroxicam, used for the treatment of inflammatory
arthritis and as a chemopreventive agent in colon cancer. Figure 1 shows a general structure of the derivatives examined –
the 1,2-benzothiazines. Letters ‘p’ and ‘o’ indicate the position wherein different fragment structures were substituted, yet
the Piroxicam scaffold remains unchanged.
Figure 1. General structural formula of the drug derivatives examined – the 1,2-benzothiazines
Our procedures can be divided into two classes. In the first one, we performed the a priori similarity analysis by
studying the diversity of the biophysical parameters respecting a well-known rule of thumb in drug discovery – the
Lipinski's rule of five (Ro5) [13], and a recently proposed concept of chemical beauty measure called the quantitative
estimate of drug-likeness (QED) [14], which takes into account the distribution of the molecular descriptors among the
marketed drugs, proven to be effective as therapeutics. A set of such parameters (mainly derived from the molecular
structure) is used to characterize each compound. In addition, for selected compounds we were provided with the results
of clinical trials on mice – the effective dose ED50 parameter, which indicates the drug's effectiveness at an early stage of
development.
In the second class, we decomposed the a posteriori data – the terahertz spectra – into the principal components. Next,
the spectra were projected onto a 2D or 3D space and attempts were made to link the spectral neighborhood on the map to
the molecular descriptors’ similarity.
2. SPECTROSCOPIC EXPERIMENT CONDITIONS
Sample preparation
Samples of Piroxicam analogues – the 1,2-benzothiazines – in the crystalline form were prepared as 13 mm
diameter flat-faced ~3 mm thick pellets containing 10% (40 mg) of the substance and 90% (360 mg) of the high density
spectroscopic grade polyethylene powder as a diluting matrix. Each sample powder was ground in a mortar, mixed with
diluent and pressed under the pressure of 2 tons for 2 minutes. As a reference, a pure 360 mg PE pellet was used. We
prepared one additional sample as an exception from the 10% series – with a concentration of 20% – to test the sensitivity
of the similarity measurement algorithm. To get rid of the negative absorbance we ensured that the thickness of the
reference and the sample tablet were different, which was also concurrently essential for the calculations of the absorption
coefficient.
Measurement setup
The spectra were measured with a terahertz time-domain spectrometer (THz-TDS), whose schematic is shown in
Figure 2. A pump-probe configuration of the photoconductive excitation was based on a 200 mW femtosecond laser with
a 780 nm wavelength and an 85 fs pulse duration (Menlo Systems). The terahertz beam was guided from the transmitting
to the receiving photoconductive antenna (PCA) by four off-axis gold-plated parabolic mirrors (OAPM). Samples were
placed in the focal point between the second and third parabolic mirror (from the left) in a custom-built rotary sample
holder to capture the terahertz spectra in the same conditions and to minimize the influence of the spectrometer parameter
drift. The spectral coverage of our spectrometer was up to 2.4 THz, hence samples were studied in range of 20-80 cm-1.
Absorption of water vapor lines was suppressed by filling the acrylic measurement chamber with dry nitrogen.

Figure 2. Experimental setup, M – mirror, OAPM – off axis parabolic mirror, RSH – rotary sample holder, BS – beam splitter,
ODL – optical delay line, FL – focusing lens, PCA – photoconductive antenna.
Data preparation
A series of fifty 20-ps long time domain traces for each sample was averaged in the time-domain, four times zero
padded, and Fourier-transformed with a spectral resolution of ~0.05 cm-1. The Gaussian-windowed time domain data was
used to cut out the echo caused by internal reflections in the probe (the etalon effect). The absorbance calculation process
compensates the instrumental response of the spectrometer by means of spectral deconvolution – the captured reference
sample spectrum was numerically subtracted from the remaining measurements.
In the case of similar chemical molecules, in order to measure their similarity one needs to extract the information on
the spectral shape and not that on the absolute absorbance. To amplify the variability of the spectra, one must reduce the
dominative character of the strongly absorbing molecules and ensure a possibly uniform distribution of the samples on a
similarity map. Hence the data had to be normalized. The reason for the variation spread can be the scattering effect
resulting from the particle size dispersion, the chemical substance spatial distribution within the dilutant and the porosity
of the pellet. The standard normal variate method (SNV), therefore, corrects partially the effects of the aforementioned
physical phenomena. This method subtracts the mean of each spectrum and divides it by the standard deviation. Compared
to the geometrical Area Under the Curve (AUC) and the zero-to-one absorbance span normalization, it amplifies the
variation of the low-value spectra without affecting those for which the variation is high.
3. CHEMOMETRIC ANALYSIS
By definition, chemometrics is the science that employs mathematical procedures to extract information from the
chemical data; however, it can be classified as a subfield of another modern discipline – ‘data mining’. Each
multidimensional spectroscopic measurement i = 1…N can be represented as a single point of an M-dimensional space,
where M denotes the number of spectral bands j = 1…M (frequency or wavenumber intervals of the spectrum), and N is
the total number of samples. Analogically, each molecule characterized by a set of molecular descriptors (as in the a priori
analysis) is a single point of a molecular descriptor space. Such a representation is not convenient to analyze, as our
perceptual and comparative skills are developed in a 3D world. Thus the need to reduce the dimensionality and project the
data to a lower dimensional space. Particularly, we show that the terahertz spectra can be efficiently clusterized for
comparative studies in a 2D space with the agglomerative hierarchical cluster tree, grouping the spectra with respect to
their similarity. Here the UPGMA (Unweighted Pair Group Method with Arithmetic Mean) algorithm reflects the structure
present in a pairwise similarity matrix in the form of a rooted tree (dendrogram). So the distance between any two clusters
is the mean distance between elements of each cluster. On the other hand, the main exploration tool in our analysis is based
on one of the best known statistical procedures used to compress the data into a lower dimensional representation, while
preserving most of the information – the Principal Component Analysis.

The principal component analysis
The objective of the principal component analysis (PCA) performed on the mean-corrected spectra stored as
column vectors s1, s2 … sN in the observation matrix X is to reduce the dimension of the representation space and project
the spectral information onto the 2D or 3D space by multiplying the truncated decomposition products described below.
Optionally, one can subtract the mean value from each spectrum in a normalization procedure. However, the removal of
the mean value from each spectral band i.e. column of the data matrix X is obligatory in order to maximize the information
contained therein and enhance its diversity.
First, we need to perform the eigen-decomposition of the covariance matrix C proportional to XXT – a product of
the observation matrix and its transposition. This procedure yields two matrices – the eigenvectors 𝐰𝒊 stored as column
vectors in W=[𝐰𝟏 𝐰𝟐 ⋯ 𝐰𝐌], better known as the PCA loadings, and the eigenvalues 𝛌𝐢 on the diagonal of 𝚲 sorted in a
descending order. Mathematically, this procedure can be expressed as
𝐂 ∝ 𝐗𝐗𝐓 = [𝐬𝟏 𝐬𝟐 ⋯ 𝐬𝐍] ⋅ [
𝐬𝟏
𝐬𝟐
⋮𝐬𝐍
] = 𝐖𝚲𝐖𝐓 .
(1)
The eigenvalues in Λ appear in order of their significance or the explained variance of data, which is simply the
ratio of each eigenvalue to the trace of Λ (the sum of all diagonal entries). Remarkably, in spectroscopic experiments the
first components usually represent most of the variance (information) in data, compared to hundreds to thousands of PCs
available, depending on the spectral resolution.
In the second step, the projection of the input data onto the new principal component space is done as follows:
𝐓 = 𝐖𝐓𝐗. (2)
The columns of matrix 𝐓 = [𝐭𝟏 𝐭𝟐 ⋯ 𝐭𝐍] are called the principal component scores (PCm) for each measured sample
i = 1…N. Intuitively, they can be understood as the mixing coefficients of the corresponding principal components –
loadings. This is because we can fully restore the original data in a similar way as the weighted average of the extracted
‘base ingredients’ spectra and their ‘concentration’ is calculated. If we select the first r out of the m available principal
component scores and the corresponding loading vectors, by computing their weighted-sum-like matrix product we can
restore the compressed spectral shape. As a result we compress the input information rejecting the non-informative parts
of the 𝐓 matrix. Finally, the scatter plot of examined samples in the reduced principal component space (for instance the
first versus the second component) provides a graphical representation of similarity – points close to each other are
mutually related.
A priori similarity analysis
A set of molecular descriptors, provided before the samples were measured, was analyzed in order to characterize
the relative similarity of drug candidates. Initially, their choice was based on the well-known Lipinski's rule of five (Ro5)
[13] to describe the drug-likeliness – the potential of pharmacological or biological activity. The rule states, that an orally
active drug should violate no more than one of the following criteria: molecular mass Mr below 500, octanol-water partition
coefficient (AlogP) not greater than 5, no more than 5 hydrogen bond donors (HBD), no more than 10 hydrogen bond
acceptors (HBA). Noticeably, in this rule of thumb each number is a multiple of five. Nonetheless, this approach has been
criticized in a recent work in Nature Chemistry [14], where the authors stressed that there were many exceptions to this
principle. Instead, they have proposed a new concept of chemical beauty measure called the quantitative estimate of drug-
likeness (QED). This new measure is based on the molecular descriptors’ distribution of the marketed drugs - the
underlying assumption in their model is that a drug candidate follows the same histogram of the parameters as the existing
ones. The authors extend the Lipinski's descriptors base by introducing a number of rotatable bonds (ROTB) and a number
of aromatic rings in the structural formula (AROMs). Consequently, in our pre-spectroscopic research each compound was
characterized by a set of 8 parameters. Additionally, a natural and instinctive similarity criterion - the identity of the
fragment structures, denoted here by ‘p’ and ‘o’, was also taken into account.
To measure the similarity of compounds’ molecular properties we employed the previously introduced multivariate
analysis tool – the PCA. In the first step we computed the pairwise correlation matrix, as shown in Table 1. It shows how
the descriptors are mutually correlated. We have easily found that the AROMs and HBD parameters are highly correlated
(bold frame) within the provided samples, with a single exception – 1p+22o and with the base Piroxicam used only as a

reference. All the samples had three aromatic rings in their structural formula and one hydrogen bond donor. The high
values of the pairwise correlation coefficients in the table indicate the feasibility of an efficient data dimensionality
reduction by means of the PCA.
Table 1. Pairwise correlation matrix for the 8 molecular descriptors of the investigated Piroxicam derivatives
MP PSA AlogP HBD HBA Mr ROTB AROMs
MP 1 0.4641 -0.4179 0.5336 -0.0205 -0.0247 -0.1615 0.5336
PSA 1 -0.7403 0.2785 0.0393 0,0857 -0.6237 0.2785
AlogP 1 -0.3562 0.2459 0.4720 0.4498 -0.3562
HBD 1 -0.1961 -0.1682 -0.3550 1
HBA 1 0.6450 0.3861 -0.1961
Mr 1 0.1812 -0.1682
ROTB 1 -0.3550
AROMs Note: in all the cases the hydrogen donor counts are equal to 1 1
MP – Melting point, PSA – polar surface area, AlogP – octanol-water partition coefficient, HBD – number of hydrogen bond donors, HBA – number of hydrogen bond acceptors, Mr – molecular mass, ROTB – number of
rotatable bonds, AROMs – number of aromatic rings.
The molecular descriptors data were projected onto a two-dimensional space. We visualize the importance of each
variable (MP, PSA etc.) in the principal component space on a biplot in Figure 3, showing the sign and the magnitude of
each descriptor (blue line vectors), or equivalently its importance. Indeed, within the provided dataset two factors were
dominant to explain the variance: the melting point (MP) and the molecular mass (Mr) with comparable magnitudes. The
third most important parameter, the polar surface area descriptor (PSA) was highly correlated with the melting point, thus
followed the same direction. The same was true for AlogP and ROTB, but their contribution in explaining the diversity of
data is low, as illustrated in Figure 3b. Consequently, the two dimensional similarity map in the a priori analysis explains
95.7% of the total variance with two mutually orthogonal (uncorrelated) variables.
a) b)
Figure 3. a) Biplot of molecular descriptors showing the domination of three descriptors to describe the variance in a priori data:
melting point (MP), molecular mass (Mr), and polar surface area (PSA); b) Zoom of the plot center to illustrate the contribution of
the non-dominant variables. Note the mutual correlation of selected vectors.
The biplot provides a straightforward way to directly link the position of the samples (scattered points) on the
map to the numerical values of the dominant descriptors. The growth direction of each variable on a PCA map follows that
pointed by the descriptor vector (loading). For instance, the samples with the highest values of the melting point will be
located in the second quadrant with a diagonal growth direction (from South-East to North-West). For the molecular mass
descriptor the orthogonal case applies – the growth follows the South-West to North-East direction with the highest-valued
samples in the first quadrant. Figure 4 shows the PCA score plot coupled with the contour plot of the descriptors’ numerical

values. The efficient compression of the descriptor data enabled us to study the a priori chemical similarity by measuring
the neighborhood on a 2D map.
a) b)
Figure 4. The PCA score plot coupled with the contour plot of two dominant molecular descriptors in the a priori analysis: a) the
melting point (MP) and b) the molecular mass (Mr). Notably, their growth direction follows the vectors orientation in the biplot –
South-East to North-West for the melting point and orthogonal for the molecular mass. Sample 19 (8p+1o) was not measured in the
spectroscopic experiment.
A posteriori similarity analysis
Having performed the a priori analysis, we pre-processed the spectroscopic data, as described in the data
preparation subsection (sect. II). The key point was to select the normalization method appropriate for the statistical
analysis. In order to ensure an equal contribution of the investigated samples to the PCA model we considered two well-
known normalization scenarios, as shown in Figure 5.
a) b)
Figure 5. Comparison of the pre-processed spectra of 1,2-benzothiazines: a) standard normal variate (SNV), and b) area under curve
(AUC). The vertical axis spans from the minimal to maximal value in the spectral dataset. The negative absorbance values are caused
by the normalization procedure.
Since the standard normal variate (SNV) corrects the spectra with respect to their variance, the slowly varying,
spectrally ‘poorer’ ones will be amplified. The PCA score maps in the area-under-curve and zero-to-one case are not
uniform and tend to exhibit the outlier-like character, thus the choice of SNV seemed optimal. Our observations are
consistent with those in the infrared chemometric studies.
The measured spectra were tested for similarity using the agglomerative hierarchical cluster tree building
algorithm, which generated a dendrogram – a tree diagram showing how samples can be grouped into clusters of similar
features. The organization of the graph is hierarchical – there are several levels of generalization leading from the low-
scale similarity to a global data cluster. In our analysis, for the spectra with the same importance and to ensure that there
was no a priori information bias on their processing, we used the unweighted average distance (UPGMA) method. The
results of the spectral clusterization are shown in Figure 6.
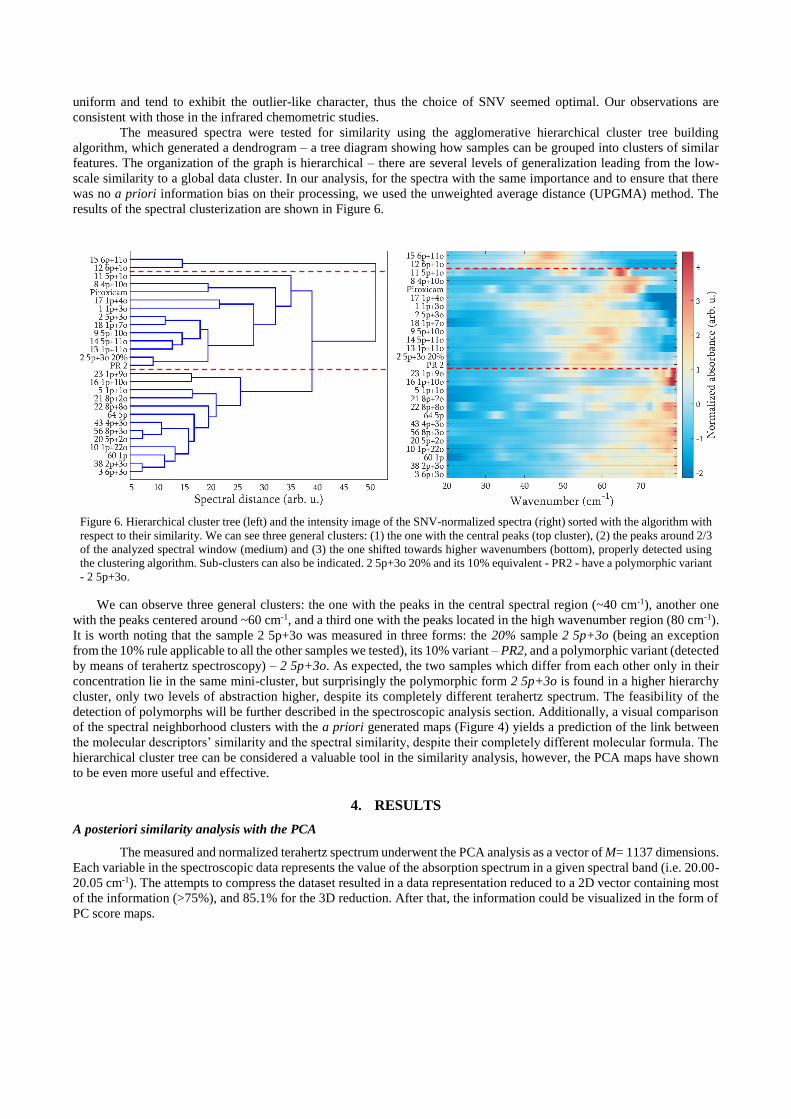
Figure 6. Hierarchical cluster tree (left) and the intensity image of the SNV-normalized spectra (right) sorted with the algorithm with
respect to their similarity. We can see three general clusters: (1) the one with the central peaks (top cluster), (2) the peaks around 2/3
of the analyzed spectral window (medium) and (3) the one shifted towards higher wavenumbers (bottom), properly detected using
the clustering algorithm. Sub-clusters can also be indicated. 2 5p+3o 20% and its 10% equivalent - PR2 - have a polymorphic variant
- 2 5p+3o.
We can observe three general clusters: the one with the peaks in the central spectral region (~40 cm-1), another one
with the peaks centered around ~60 cm-1, and a third one with the peaks located in the high wavenumber region (80 cm-1).
It is worth noting that the sample 2 5p+3o was measured in three forms: the 20% sample 2 5p+3o (being an exception
from the 10% rule applicable to all the other samples we tested), its 10% variant – PR2, and a polymorphic variant (detected
by means of terahertz spectroscopy) – 2 5p+3o. As expected, the two samples which differ from each other only in their
concentration lie in the same mini-cluster, but surprisingly the polymorphic form 2 5p+3o is found in a higher hierarchy
cluster, only two levels of abstraction higher, despite its completely different terahertz spectrum. The feasibility of the
detection of polymorphs will be further described in the spectroscopic analysis section. Additionally, a visual comparison
of the spectral neighborhood clusters with the a priori generated maps (Figure 4) yields a prediction of the link between
the molecular descriptors’ similarity and the spectral similarity, despite their completely different molecular formula. The
hierarchical cluster tree can be considered a valuable tool in the similarity analysis, however, the PCA maps have shown
to be even more useful and effective.
4. RESULTS
A posteriori similarity analysis with the PCA
The measured and normalized terahertz spectrum underwent the PCA analysis as a vector of M= 1137 dimensions.
Each variable in the spectroscopic data represents the value of the absorption spectrum in a given spectral band (i.e. 20.00-
20.05 cm-1). The attempts to compress the dataset resulted in a data representation reduced to a 2D vector containing most
of the information (>75%), and 85.1% for the 3D reduction. After that, the information could be visualized in the form of
PC score maps.

New variables in the new coordinates set (after compression) are a linear combination of the eigenvectors and
therefore contain information from the entire spectrum. The new data space is chosen so as to maximize the variance. We
have estimated the PC loadings – the vectors extracted from the original spectrum through the decomposition. These
‘virtual’ components mixed linearly reproduce the spectra in the data set. The accuracy of this reproduction depends on
the number of PC loadings taken into account in the calculation. We show this effect in Figure 7. Despite the large diversity
of the spectral shapes in our dataset, the first three PC loadings, extracted from the spectra, can reproduce the input data
with a good accuracy.
The 2D principal component score plots for the first three dimensions are shown in Figure 8. We marked with a
star three spectra of the same chemical compound but in two polymorphic forms (the same one for 2 5p+3o 20% and PR2),
and in two concentrations (10% for the 2 5p+3o and PR2, and 20% for 2 5p+3p 20%). The polymorphs lie in the
neighborhood on the spectral map of PC2 versus PC1, marked with a dashed line for visibility. A careful analysis of the
coordinates leads us to believe that they share a similar contribution of the second eigenvector (a span of ~5 units), whereas
the first and the third component change by about 20 and 15, respectively.
a) b)
Figure 8. PC score map: a) second versus first and b) third versus first. Colors on the scatter plot are generated by the k-means
algorithm measuring the cluster similarity of the samples in the principal component space. The number of clusters was arbitrary.
To justify the usefulness of the statistical similarity measurement for the detection of polymorphs we will show
in Figure 9 the spectra of the aforementioned sample 2 in three variants. Although the spectral shapes were completely
different, the algorithm was capable of finding a common feature that determined their similarity.
a) b)
Figure 7. a) Loadings (eigenvectors) understood as the building components of the spectra, which ‘mixed’ according to the PC scores
reproduce the original data. b) The SNV-normalized spectrum (dashed bright line) is corrected for the mean value in each spectral
band (dotted line). This is how the PCA sees the data. Two reproduced spectra of an arbitrary sample (2 5p+3o) are shown: with 3
dimensions and 5 dimensions from the input 1137. Notably, no significant improvement is observed by introducing two additional
components.

a) b)
c) d)
Figure 9. Three variants of the same sample with a varying concentration: a) 20% and c) 10%; b) a polymorphic form with a
completely different spectrum. The algorithm has nonetheless found a feature that makes them similar – they are in a neighborhood
on the PCA map. d) shows the spectrum of another sample to illustrate the effectiveness of the PCA data compression. The dashed
line is a plot of the reconstruction of spectra from the PC loadings with the row-wise mean added.
An analysis of the high-order principal component maps may also lead to interesting conclusions. Figure 10a
shows the PCA scores of the second and third component. Groups of spectra with the same fragment structure element
marked here as ‘p’ share a relatively narrow bounded region on either the PC2 or the PC3 axis. For instance, the samples
with the ’5p’ element tend to lie on the PC2 axis between -10 and 8 whereas the ‘1p’ group spans more orthogonally –
ranges from -5 to 10 on the PC3 axis, as shown in Figure 10b.
a) b)
Figure 10. a) The plot of high order (2nd vs 3rd) PCA scores; b) clusters sharing one common structural element, marked here as ‘p’,
seem to be located in a relatively narrow range on one of the principal component axes.
Linking the a priori and a posteriori maps
The key point in our data processing path was to link the spectral similarity in the terahertz regime to that predicted
based solely on a set of molecular properties. Undoubtedly, such a link would be useful in the drug discovery path and

would enable the selection of the most promising drug candidates for clinical trials. Our attempt to associate the two maps
is shown in Figure 11.
Figure 11. The correspondence between the a priori generated molecular descriptor similarity map (left) and the a posteriori
generated spectral similarity map (right). Groups of the samples characterized by a similar set of descriptors lie in a close
neighborhood on a spectral map despite their completely different chemical formulas. However, there are four samples which do not
obey this rule (~15% of the total). The sample marked as 64 5p was a low molecular weight (~315 g/mol) Piroxicam analogue with
the ‘o’ structural element removed. Pure Piroxicam is also added to the spectral similarity map as a reference.
We have observed that, notwithstanding the completely different molecular structure, the groups of 1,2-
benzothiazines lying in a close neighborhood on the molecular descriptors map were located next to each other on the
spectral similarity map. About 85% of the investigated Piroxicam analogues obey this rule. This visual correlation proves
that the terahertz spectrum corresponds to the physical rather than chemical parameters – the left a priori map is based
mainly on the melting point and molecular mass. Indeed, for a solid state drug the terahertz spectrum reveals a physical
phenomenon – the vibrations in the crystal lattice.
Figure 12. The plot of PCA scores with physical parameters of investigated samples: molecular mass (right) and melting point (left).
In addition to the evaluation of similarity based on the accumulation-defined clusters, we analyzed the
spectroscopic principal component maps coupled with the contour plots of the previously introduced dominant physical

parameters: the melting point (the mean value of the melting phase transition temperature range, to be exact) and the
molecular mass (Figure 12). They visualize the molecular descriptor value in relation to the spectral composition. These
maps can guide a researcher to determine the possible positions on the spectral map without any spectral measurements,
if carefully coupled with the a priori analysis. Nevertheless, the underlying oversimplified linearity assumption in the PCA
decomposition may be insufficient for proper modeling of the complex relation between these parameters and the spectral
shapes. To introduce the predictability feature, a nonlinear dimensionality reduction technique should be used instead.
Still, in some cases the simplicity of the PCA approach may suffice.
Application to chemistry and pharmacology
In order to show the usability of our method in chemical and pharmacological sciences, we introduced two
additional PCA maps: one showing the position of the drug candidates in the second and third component coordinates with
a chemical parameter - number of rotatable bonds (ROTB), and one showing the pharmacological parameter of the
uttermost importance – the effective dose ED50, as shown in Figure 13.
Figure 13. PCA maps of the chemical and pharmacological parameters: ROTB, and ED50, respectively. The latter parameter is based
on mice trials, thus determines the actual drug effectiveness.
The plot of PC3 versus PC2 (Figure 13, left) may seem to explain only 30% of the variance, but it illustrates an
interesting distribution of the samples with a varying number of rotatable bonds (ROTB) – a parameter evaluated by
analyzing the molecular formula, which plays an important role in the selection of orally active drugs. We can observe a
valley-like distribution, where the ROTB parameter is lowest in the central part of the plot (0, 0) and grows in the
surrounding areas. Any compounds sharing the same value of ROTB, even those with completely different fragment
structures, group into easily identifiable clusters. Similar to the previous cases, the knowledge of the numerical value of
ROTB can be used to predict the position on the spectral neighborhood map, or even more, the spectrum itself, if the
sample belongs to the same class of samples being analyzed.
The effective dose parameter – ED50 (Dosis Efectiva) – reflects the actual effectiveness of a drug candidate. Namely,
it is a dose shortening the nociceptive response by 50%, thus is considered a valuable benchmark in a drug evaluation. It
can be estimated in the formalin test in mice, which involves an injection of a 1% formaldehyde solution in saline under
the skin near the paw to stimulate a source of pain from an injured tissue. Next, the drug candidate is tested in vivo to stop
mice from licking the injected paw. Although only selected samples were tested, we plotted the map of the principal
component scores with the effective dose marked for those, for which it was available (Figure 13, right plot). Notably, the
characteristic concentric zone distribution can be observed. There is a possibility, that a set of molecular descriptors
combined with the spectral map could be used to predict the effective dose which is otherwise estimated conventionally in
a time-consuming, difficult and costly research.

5. CONCLUSION
In this paper we measured using terahertz pulsed spectroscopy (TPS) a set of 27 new candidates for a non-steroidal
anti-inflammatory drug. We harnessed the Principal Component Analysis to evaluate the existence of a connection between
the measured spectra and the molecular descriptors of chemically similar drugs. The solid state Piroxicam analogues – the
1,2-benzothiazines – were analyzed in two stages: the a priori evaluation of the similarity of molecular descriptors and the
a posteriori measurement of spectral similarity. Within the provided sample set, the spatial neighborhood in the molecular
descriptor space corresponded to the spectral similarity in the spectral similarity map for 85% of the samples. The results
presented could be applied in drug development to select the derivatives with desirable chemical and implied
pharmacological properties, thus supporting the choice of drug candidates for clinical trials.
REFERENCES
[1] D. H. Rouvray, “Similarity studies. 1. The necessity of analogies in the development of science,” J. Chem. Inf.
Comput. Sci., vol. 34, no. 2, pp. 446–452, 1994.
[2] K. Varmuza, M. Karlovits, and W. Demuth, “Spectral similarity versus structural similarity: infrared
spectroscopy,” Anal. Chim. Acta, vol. 490, no. 1–2, pp. 313–324, Aug. 2003.
[3] Bodis, Lorant, “Quantification of spectral similarity, towards automatic spectra verification,” 2007.
[4] K. Nowak, E. F. Plinski, B. Karolewicz, P. P. Jarzab, S. Plinska, B. Fuglewicz, M. J. Walczakowski, L. Augustyn,
L. A. Sterczewski, M. P. Grzelczak, M. Hruszowiec, G. Beziuk, M. Mikulic, N. Palka, and M. Szustakowski,
“Selected aspects of terahertz spectroscopy in pharmaceutical sciences,” Acta Pol. Pharm., vol. 72, no. 5, p. 851—
866, 2015.
[5] J. Chen, Y. Chen, H. Zhao, G. J. Bastiaans, and X.-C. Zhang, “Absorption coefficients of selected explosives and
related compounds in the range of 0.1-2.8 THz,” Opt. Express, vol. 15, no. 19, pp. 12060–12067, 2007.
[6] Y.-S. Jin, G.-J. Kim, and S.-G. Jeon, “Terahertz dielectric properties of polymers,” J. Korean Phys. Soc., vol. 49,
no. 2, pp. 513–517, 2006.
[7] S. H. Baek, H. B. Lim, and H. S. Chun, “Detection of Melamine in Foods Using Terahertz Time-Domain
Spectroscopy,” J. Agric. Food Chem., vol. 62, no. 24, pp. 5403–5407, Jun. 2014.
[8] W. Fan, “Investigation on the Terahertz Absorption Spectra of the Molecules with Similar Molecular Structure,”
in Laser and Tera-Hertz Science and Technology, 2012, p. SF3A–1.
[9] Z.-P. Zheng, W.-H. Fan, Y.-Q. Liang, and H. Yan, “Application of terahertz spectroscopy and molecular modeling
in isomers investigation: Glucose and fructose,” Opt. Commun., vol. 285, no. 7, pp. 1868–1871, Apr. 2012.
[10] Z.-P. Zheng, W.-H. Fan, and H. Yan, “Terahertz absorption spectra of benzene-1,2-diol, benzene-1,3-diol and
benzene-1,4-diol,” Chem. Phys. Lett., vol. 525–526, pp. 140–143, Feb. 2012.
[11] J. El Haddad, F. de Miollis, J. Bou Sleiman, L. Canioni, P. Mounaix, and B. Bousquet, “Chemometrics Applied
to Quantitative Analysis of Ternary Mixtures by Terahertz Spectroscopy,” Anal. Chem., vol. 86, no. 10, pp. 4927–
4933, May 2014.
[12] Yi Wen, Sun, Zhong, Jun-Lan, Jian, Zuo, Cun-Lin, Zhang, and Guo, Dan, “Principal component analysis of
terahertz spectrum on hemagglutinin protein and its antibody,” Acta Phys. Sin., vol. 64, no. 16, pp. 168701–
168701, 2015.
[13] C. A. Lipinski, F. Lombardo, B. W. Dominy, and P. J. Feeney, “Experimental and computational approaches to
estimate solubility and permeability in drug discovery and development settings,” Adv. Drug Deliv. Rev., vol. 23,
no. 1–3, pp. 3–25, Jan. 1997.
[14] G. R. Bickerton, G. V. Paolini, J. Besnard, S. Muresan, and A. L. Hopkins, “Quantifying the chemical beauty of
drugs,” Nat. Chem., vol. 4, no. 2, pp. 90–98, Feb. 2012.