piramal enterprises limited q1 fy2018 results...
TRANSCRIPT
Piramal Enterprises Limited Q1 FY2018 Results Presentation 1 August 2017

Key Financial Highlights
Piramal Enterprises Limited – Q1 FY2018 Results Presentation Page 2
27%
growth during Q1 FY2018
31%
growth during Q1 FY2018
1,776
2,254
Q1 FY17 Q1 FY18
Revenues Net Profit
231
302
Q1 FY17 Q1 FY18
(In Rs. Crores)
Note: 1. Q1 FY2018 and Q1 FY2017 results have been prepared based on IND AS
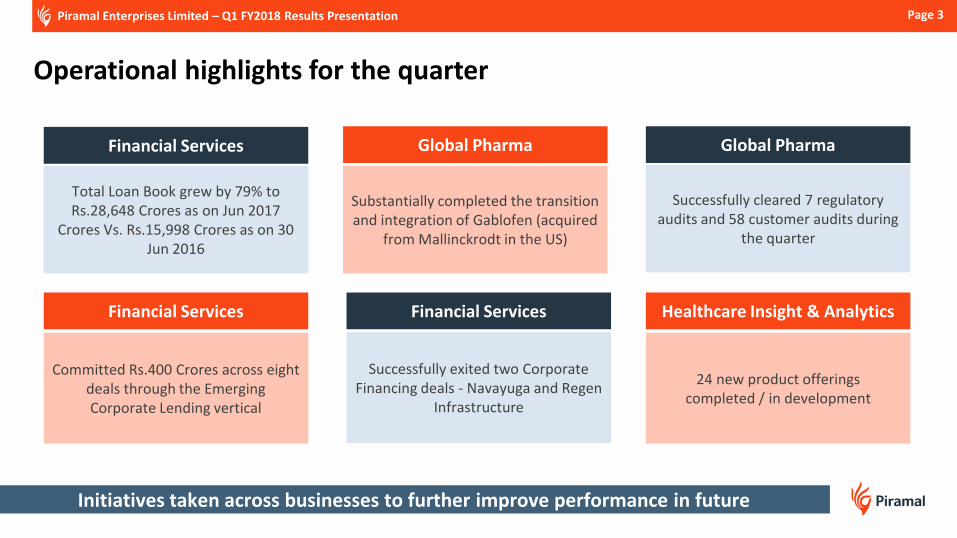
Operational highlights for the quarter
Total Loan Book grew by 79% to Rs.28,648 Crores as on Jun 2017
Crores Vs. Rs.15,998 Crores as on 30 Jun 2016
Successfully cleared 7 regulatory audits and 58 customer audits during
the quarter
24 new product offerings completed / in development
Committed Rs.400 Crores across eight deals through the Emerging Corporate Lending vertical
Substantially completed the transition and integration of Gablofen (acquired
from Mallinckrodt in the US)
Successfully exited two Corporate Financing deals - Navayuga and Regen
Infrastructure
Healthcare Insight & Analytics Financial Services Financial Services
Global Pharma Financial Services Global Pharma
Initiatives taken across businesses to further improve performance in future
Page 3 Piramal Enterprises Limited – Q1 FY2018 Results Presentation
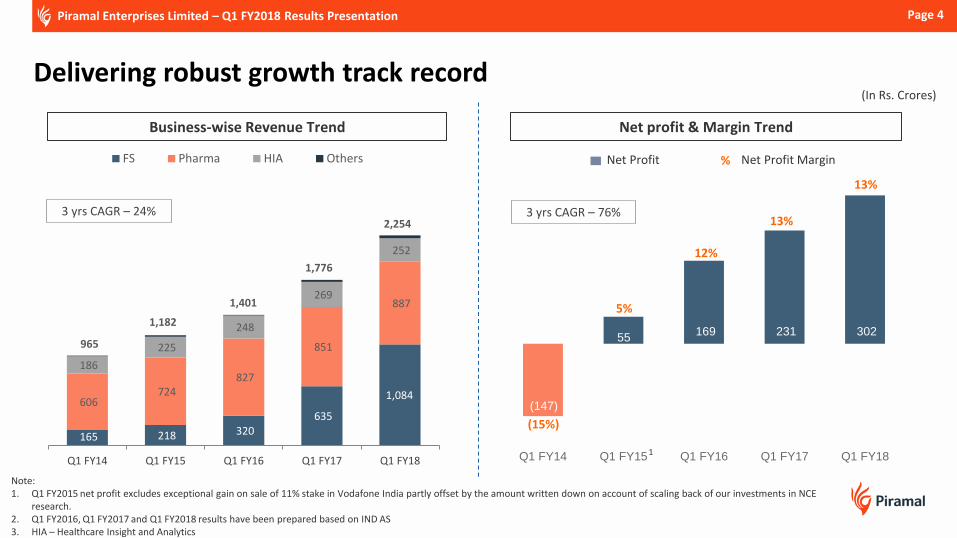
165 218 320 635
1,084 606
724 827
851
887
186
225
248
269
252
Q1 FY14 Q1 FY15 Q1 FY16 Q1 FY17 Q1 FY18
FS Pharma HIA Others
Delivering robust growth track record
(147)
55 169 231 302
Q1 FY14 Q1 FY15 Q1 FY16 Q1 FY17 Q1 FY18
(15%)
13%
12%
13%
Business-wise Revenue Trend Net profit & Margin Trend
Net Profit % Net Profit Margin
1
Note: 1. Q1 FY2015 net profit excludes exceptional gain on sale of 11% stake in Vodafone India partly offset by the amount written down on account of scaling back of our investments in NCE
research. 2. Q1 FY2016, Q1 FY2017 and Q1 FY2018 results have been prepared based on IND AS 3. HIA – Healthcare Insight and Analytics
5%
Page 4
965
1,182
1,401
1,776
2,254
(In Rs. Crores)
Piramal Enterprises Limited – Q1 FY2018 Results Presentation
3 yrs CAGR – 24% 3 yrs CAGR – 76%
Page 5
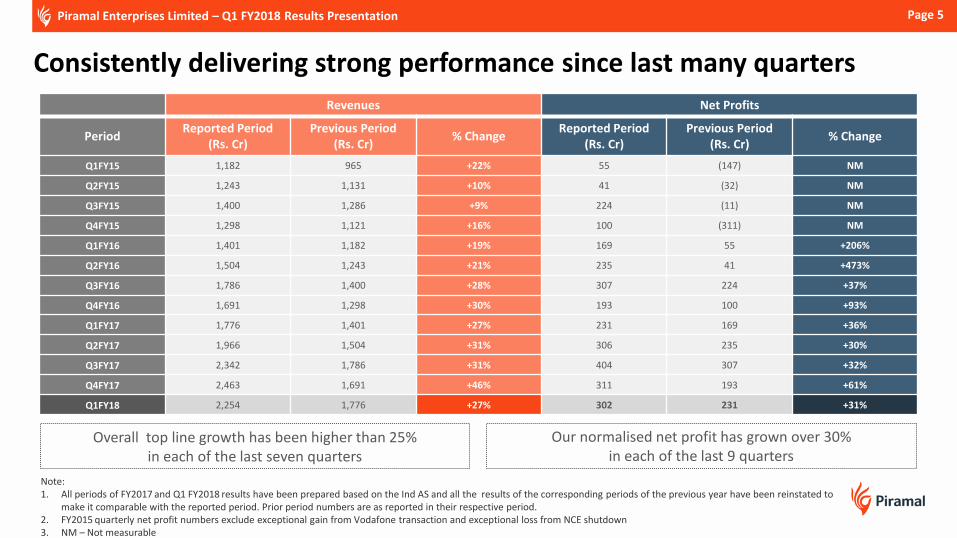
Revenues Net Profits
Period Reported Period
(Rs. Cr) Previous Period
(Rs. Cr) % Change
Reported Period (Rs. Cr)
Previous Period (Rs. Cr)
% Change
Q1FY15 1,182 965 +22% 55 (147) NM
Q2FY15 1,243 1,131 +10% 41 (32) NM
Q3FY15 1,400 1,286 +9% 224 (11) NM
Q4FY15 1,298 1,121 +16% 100 (311) NM
Q1FY16 1,401 1,182 +19% 169 55 +206%
Q2FY16 1,504 1,243 +21% 235 41 +473%
Q3FY16 1,786 1,400 +28% 307 224 +37%
Q4FY16 1,691 1,298 +30% 193 100 +93%
Q1FY17 1,776 1,401 +27% 231 169 +36%
Q2FY17 1,966 1,504 +31% 306 235 +30%
Q3FY17 2,342 1,786 +31% 404 307 +32%
Q4FY17 2,463 1,691 +46% 311 193 +61%
Q1FY18 2,254 1,776 +27% 302 231 +31%
Note: 1. All periods of FY2017 and Q1 FY2018 results have been prepared based on the Ind AS and all the results of the corresponding periods of the previous year have been reinstated to
make it comparable with the reported period. Prior period numbers are as reported in their respective period. 2. FY2015 quarterly net profit numbers exclude exceptional gain from Vodafone transaction and exceptional loss from NCE shutdown 3. NM – Not measurable
Consistently delivering strong performance since last many quarters
Piramal Enterprises Limited – Q1 FY2018 Results Presentation
Overall top line growth has been higher than 25% in each of the last seven quarters
Our normalised net profit has grown over 30% in each of the last 9 quarters
Page 6 Piramal Enterprises Limited – Q1 FY2018 Results Presentation
Quartile 1
Top 25 companies
Quartile 2
26-50 companies
Quartile 3
51-75 companies
Quartile 4
76-100 companies
BSE-100 3Yr Revenue CAGR 3Yr Net Profit CAGR
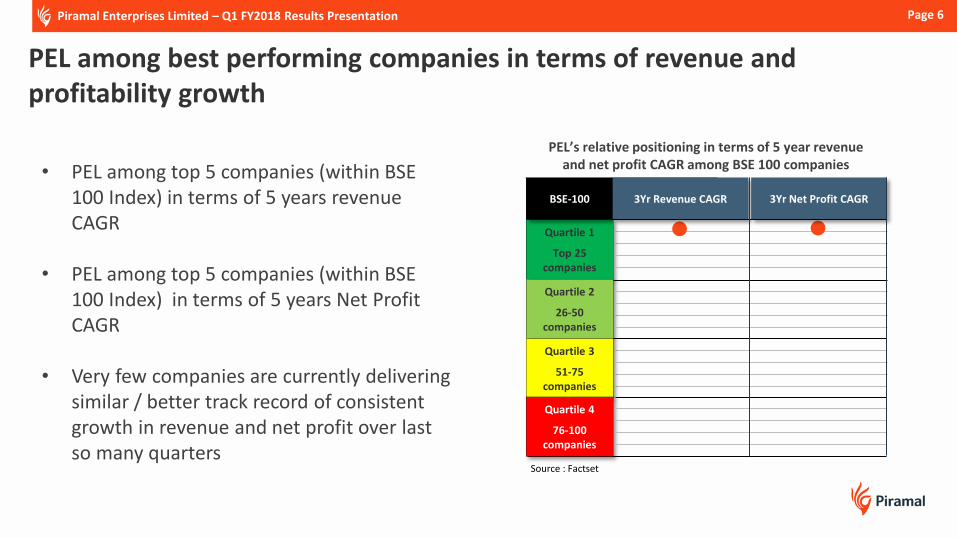
PEL among best performing companies in terms of revenue and profitability growth
Source : Factset
• PEL among top 5 companies (within BSE 100 Index) in terms of 5 years revenue CAGR
• PEL among top 5 companies (within BSE 100 Index) in terms of 5 years Net Profit CAGR
• Very few companies are currently delivering similar / better track record of consistent growth in revenue and net profit over last so many quarters
PEL’s relative positioning in terms of 5 year revenue and net profit CAGR among BSE 100 companies

Financial Services
Piramal Enterprises Limited – Q1 FY2018 Results Presentation Page 7
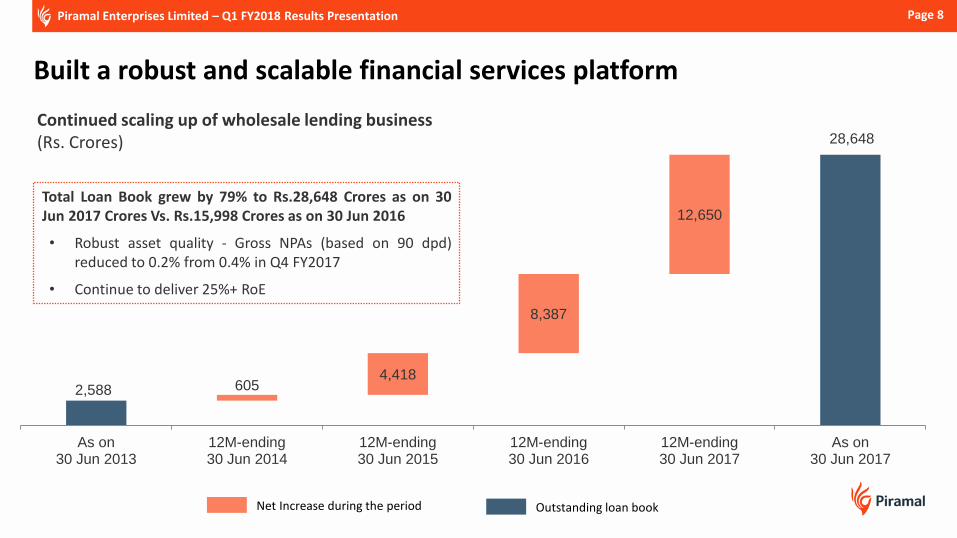
2,588
28,648
605 4,418
8,387
12,650
As on30 Jun 2013
12M-ending30 Jun 2014
12M-ending30 Jun 2015
12M-ending30 Jun 2016
12M-ending30 Jun 2017
As on30 Jun 2017
Total Loan Book grew by 79% to Rs.28,648 Crores as on 30 Jun 2017 Crores Vs. Rs.15,998 Crores as on 30 Jun 2016
• Robust asset quality - Gross NPAs (based on 90 dpd) reduced to 0.2% from 0.4% in Q4 FY2017
• Continue to deliver 25%+ RoE
Continued scaling up of wholesale lending business (Rs. Crores)
Built a robust and scalable financial services platform
Page 8 Piramal Enterprises Limited – Q1 FY2018 Results Presentation
Net Increase during the period Outstanding loan book
Page 9
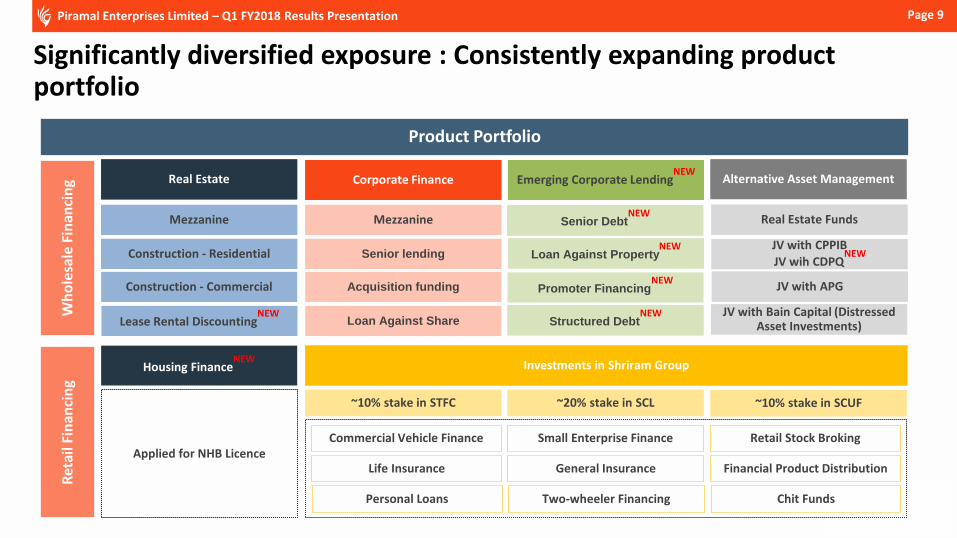
Product Portfolio
Wh
ole
sale
Fin
anci
ng Real Estate Corporate Finance Alternative Asset Management
Housing FinanceNEW
Mezzanine
Construction - Residential
Mezzanine
Lease Rental DiscountingNEW
Senior lending
Acquisition funding
Loan Against Share
Emerging Corporate LendingNEW
Construction - Commercial
JV with CPPIB
JV wih CDPQNEW
Real Estate Funds
Loan Against PropertyNEW
Promoter FinancingNEW
Structured DebtNEW
Significantly diversified exposure : Consistently expanding product portfolio
Ret
ail F
inan
cin
g
Investments in Shriram Group
~10% stake in STFC ~20% stake in SCL ~10% stake in SCUF
Applied for NHB Licence Corporate Finance
Commercial Vehicle Finance Small Enterprise Finance Retail Stock Broking
Life Insurance General Insurance Financial Product Distribution
Personal Loans Two-wheeler Financing Chit Funds
JV with APG
JV with Bain Capital (Distressed
Asset Investments)
Piramal Enterprises Limited – Q1 FY2018 Results Presentation
Senior DebtNEW
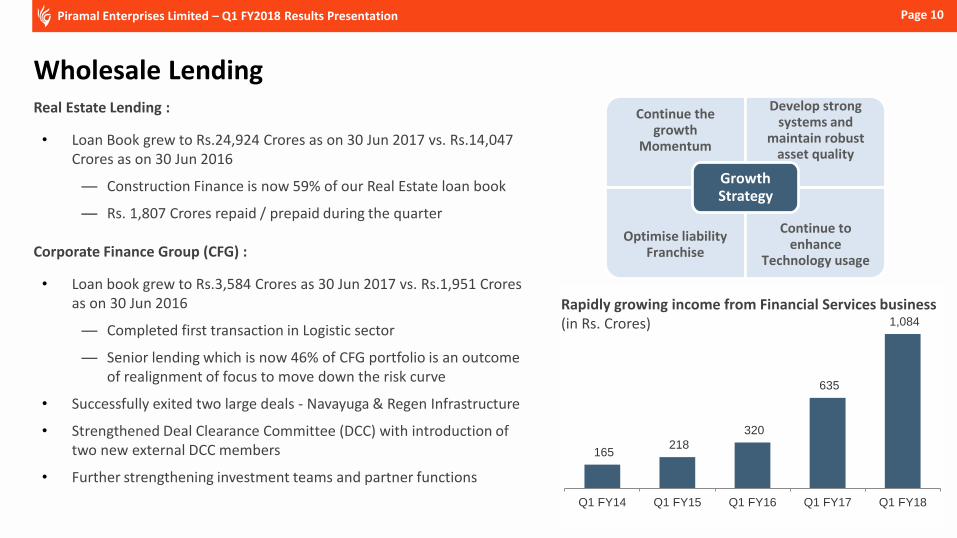
Wholesale Lending
Page 10 Piramal Enterprises Limited – Q1 FY2018 Results Presentation
Real Estate Lending :
• Loan Book grew to Rs.24,924 Crores as on 30 Jun 2017 vs. Rs.14,047 Crores as on 30 Jun 2016
— Construction Finance is now 59% of our Real Estate loan book
— Rs. 1,807 Crores repaid / prepaid during the quarter Corporate Finance Group (CFG) :
• Loan book grew to Rs.3,584 Crores as 30 Jun 2017 vs. Rs.1,951 Crores as on 30 Jun 2016
— Completed first transaction in Logistic sector
— Senior lending which is now 46% of CFG portfolio is an outcome of realignment of focus to move down the risk curve
• Successfully exited two large deals - Navayuga & Regen Infrastructure
• Strengthened Deal Clearance Committee (DCC) with introduction of two new external DCC members
• Further strengthening investment teams and partner functions
165 218
320
635
1,084
Q1 FY14 Q1 FY15 Q1 FY16 Q1 FY17 Q1 FY18
Rapidly growing income from Financial Services business (in Rs. Crores)
Continue the growth
Momentum
Develop strong systems and
maintain robust asset quality
Optimise liability Franchise
Continue to enhance
Technology usage
Growth Strategy
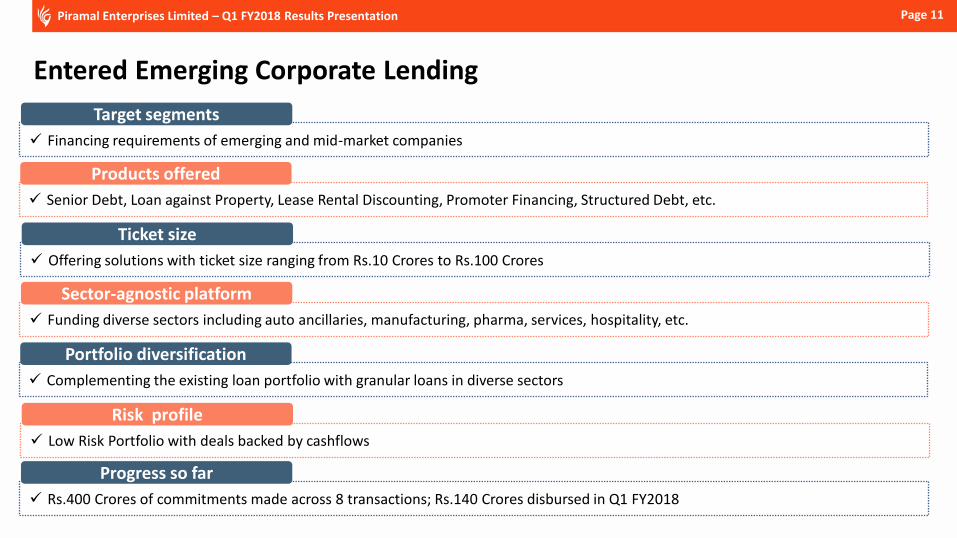
Financing requirements of emerging and mid-market companies
Page 11
Entered Emerging Corporate Lending
Target segments
Senior Debt, Loan against Property, Lease Rental Discounting, Promoter Financing, Structured Debt, etc.
Products offered
Offering solutions with ticket size ranging from Rs.10 Crores to Rs.100 Crores
Ticket size
Funding diverse sectors including auto ancillaries, manufacturing, pharma, services, hospitality, etc.
Sector-agnostic platform
Complementing the existing loan portfolio with granular loans in diverse sectors
Portfolio diversification
Low Risk Portfolio with deals backed by cashflows
Risk profile
Rs.400 Crores of commitments made across 8 transactions; Rs.140 Crores disbursed in Q1 FY2018
Progress so far
Piramal Enterprises Limited – Q1 FY2018 Results Presentation
Page 12
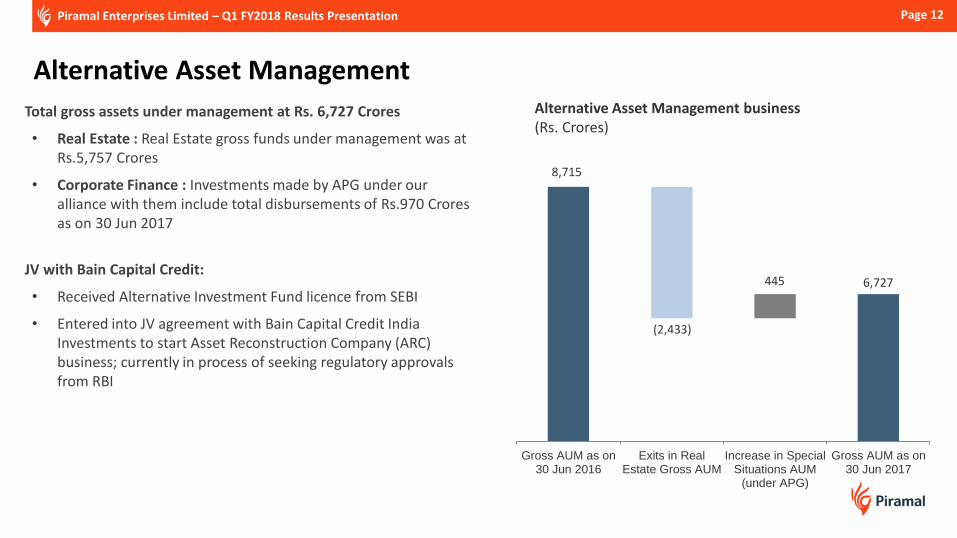
Alternative Asset Management business (Rs. Crores)
Gross AUM as on30 Jun 2016
Exits in RealEstate Gross AUM
Increase in SpecialSituations AUM
(under APG)
Gross AUM as on30 Jun 2017
8,715
(2,433)
445 6,727
Total gross assets under management at Rs. 6,727 Crores
• Real Estate : Real Estate gross funds under management was at Rs.5,757 Crores
• Corporate Finance : Investments made by APG under our alliance with them include total disbursements of Rs.970 Crores as on 30 Jun 2017
JV with Bain Capital Credit:
• Received Alternative Investment Fund licence from SEBI
• Entered into JV agreement with Bain Capital Credit India Investments to start Asset Reconstruction Company (ARC) business; currently in process of seeking regulatory approvals from RBI
Alternative Asset Management
Piramal Enterprises Limited – Q1 FY2018 Results Presentation
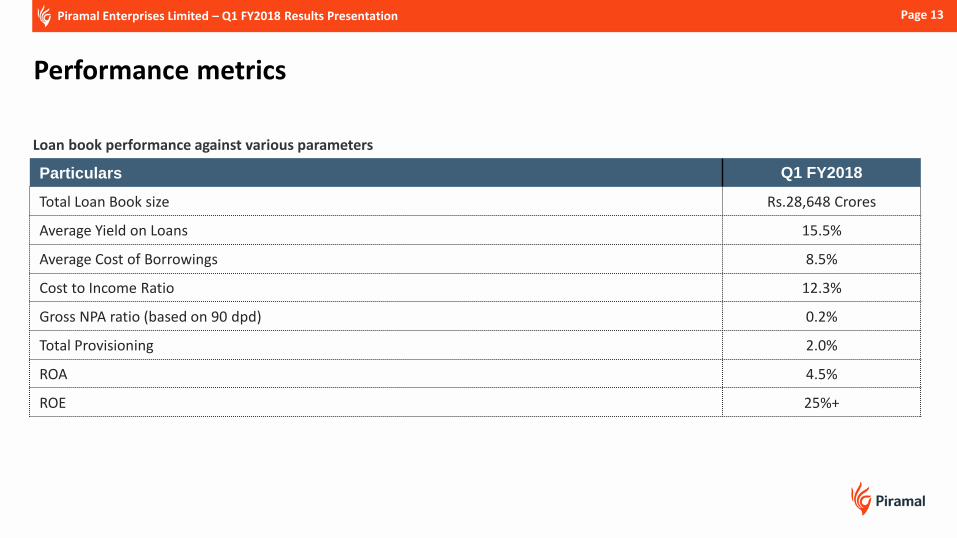
Loan book performance against various parameters
Particulars Q1 FY2018
Total Loan Book size Rs.28,648 Crores
Average Yield on Loans 15.5%
Average Cost of Borrowings 8.5%
Cost to Income Ratio 12.3%
Gross NPA ratio (based on 90 dpd) 0.2%
Total Provisioning 2.0%
ROA 4.5%
ROE 25%+
Performance metrics
Page 13 Piramal Enterprises Limited – Q1 FY2018 Results Presentation
Page 14
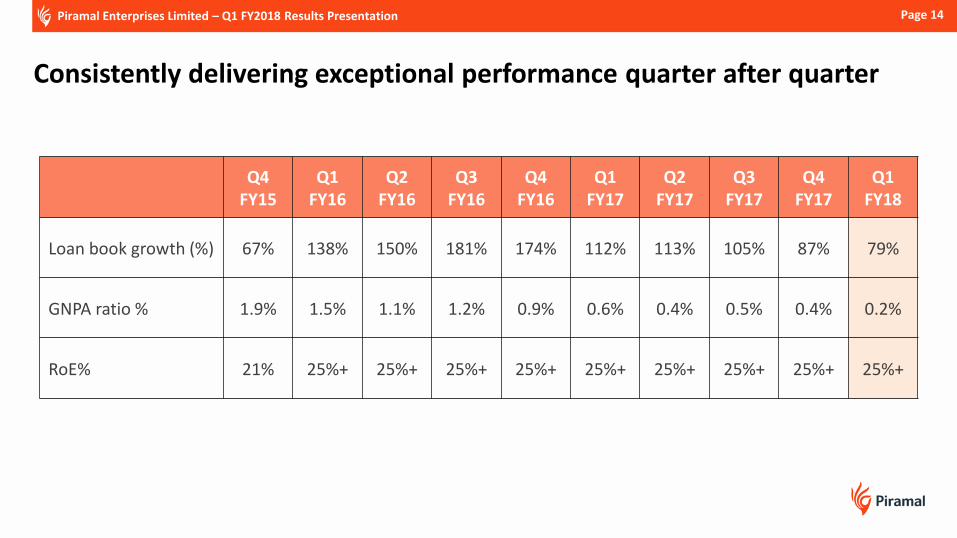
Q4 FY15
Q1 FY16
Q2 FY16
Q3 FY16
Q4 FY16
Q1 FY17
Q2 FY17
Q3 FY17
Q4 FY17
Q1 FY18
Loan book growth (%) 67% 138% 150% 181% 174% 112% 113% 105% 87% 79%
GNPA ratio % 1.9% 1.5% 1.1% 1.2% 0.9% 0.6% 0.4% 0.5% 0.4% 0.2%
RoE% 21% 25%+ 25%+ 25%+ 25%+ 25%+ 25%+ 25%+ 25%+ 25%+
Consistently delivering exceptional performance quarter after quarter
Piramal Enterprises Limited – Q1 FY2018 Results Presentation
Page 15 Piramal Enterprises Limited – Q1 FY2018 Results Presentation
FY2
01
7 R
oE
(%
)
FY2017 Gross NPA ratio (%)
12%
15%
18%
21%
24%
27%
30%
0.0%0.5%1.0%1.5%2.0%2.5%
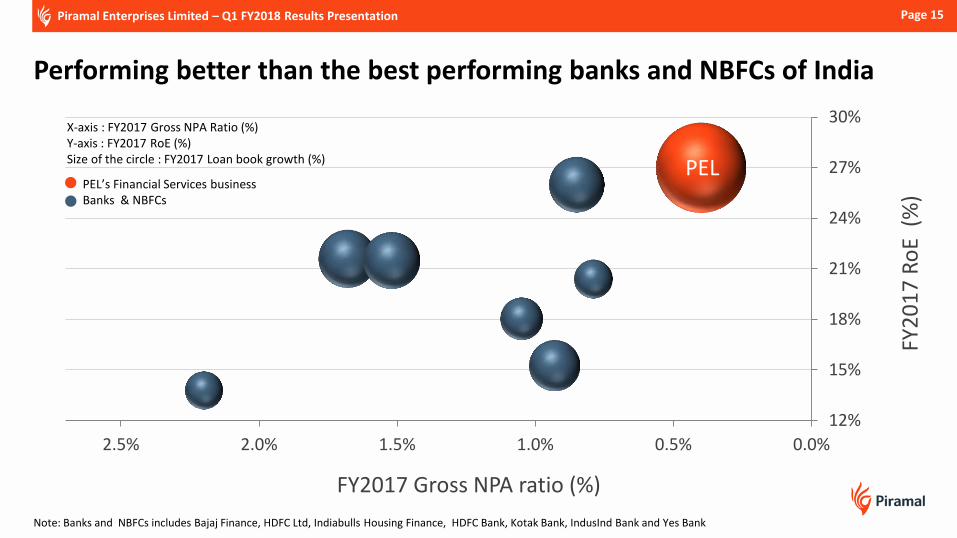
Performing better than the best performing banks and NBFCs of India
Note: Banks and NBFCs includes Bajaj Finance, HDFC Ltd, Indiabulls Housing Finance, HDFC Bank, Kotak Bank, IndusInd Bank and Yes Bank
X-axis : FY2017 Gross NPA Ratio (%) Y-axis : FY2017 RoE (%) Size of the circle : FY2017 Loan book growth (%) PEL
PEL’s Financial Services business Banks & NBFCs
Pharma
Piramal Enterprises Limited – Q1 FY2018 Results Presentation Page 16

Page 17
• Revenue Performance : Q1 FY2018 Revenues grew at 10% to Rs.845 Crores. The growth in pharma business was primarily on account of strong performance in the product business largely due to ongoing integration of acquired products partly offset by global currency fluctuations and higher offtake during last quarter (lumpy nature of business). The Global Pharma business had delivered 29% growth during Q4 FY2017.
• Transition and integration of Gablofen® acquired from Mallinckrodt: We substantially competed the transition of demand generation, procurement and ordering processes for Gablofen® in the US to Piramal. The business has performed in-line with our expectations during the first full quarter of our ownership.
• Continued high focus on quality : During the quarter, PEL successfully cleared 7 regulatory audits and 58 customer audits.
• Capacity Expansion : Capex for expansion at Digwal and Lexington is progressing well.
• Integrated offerings : Enquiries for Integrated projects at our services business continue to surge with many new projects in various stages of discussion.
• Acquiring new customers: Overall 20 new customers (including 7 large orders) were added in Q1FY2018 in our services business.
316 381 536 520 639 765 771 845
Q1
FY11
Q1
FY12
Q1
FY13
Q1
FY14
Q1
FY15
Q1
FY16
Q1
FY17
Q1
FY18
Revenue Performance (Rs in Crores)
Global Pharma : Successfully integrating acquisitions; maintaining high focus on quality
Growth Strategy
Continue to move up the value chain
Strong Focus on Quality
Leverage end to end manufacturing
capabilities
Leverage large global distribution
network
Piramal Enterprises Limited – Q1 FY2018 Results Presentation
5% 14%
15% 13%
13%
13% 16% 23% EBITDA Margin %

Page 18
Significantly strengthened product portfolio in last 1 year; performance yet to reflect in numbers
Injectable Anaesthesia / Pain Management
Product Portfolio
Vitamins & Premixes
Rapifen*
Dipidolor*
Hypnomidate
Acquired from Mallinckrodt in Mar 2017
* Controlled substances
To be launched in FY18
Sublimaze*
Sufenta*
Acquired from Janssen
Pharmaceutica in Oct 2016
Intrathecal Severe Spasticity / Pain Management
Gablofen®
Products under development
Niche products added in last one year
Inhalation Anaesthesia
Desflurane
Halothane
Generic APIs
Other Products
Sevoflurane
Isoflurane
Post acquisitions, addressable market expanded from USD 1.1 bn to USD 20 bn
Differentiated branded hospital generics
Piramal Enterprises Limited – Q1 FY2018 Results Presentation
Page 19
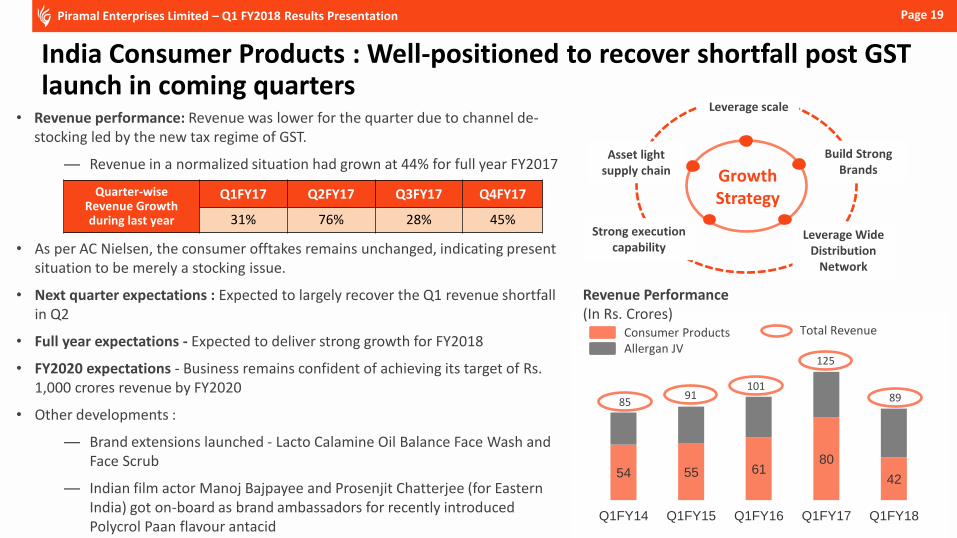
India Consumer Products : Well-positioned to recover shortfall post GST launch in coming quarters
54 55 61 80
42
Q1FY14 Q1FY15 Q1FY16 Q1FY17 Q1FY18
Revenue Performance (In Rs. Crores)
Growth Strategy
Consumer Products Allergan JV
Total Revenue
125
89 101
91 85
Asset light supply chain
Build Strong Brands
Leverage Wide Distribution
Network
Leverage scale
Strong execution capability
• Revenue performance: Revenue was lower for the quarter due to channel de-stocking led by the new tax regime of GST.
— Revenue in a normalized situation had grown at 44% for full year FY2017
• As per AC Nielsen, the consumer offtakes remains unchanged, indicating present situation to be merely a stocking issue.
• Next quarter expectations : Expected to largely recover the Q1 revenue shortfall in Q2
• Full year expectations - Expected to deliver strong growth for FY2018
• FY2020 expectations - Business remains confident of achieving its target of Rs. 1,000 crores revenue by FY2020
• Other developments :
— Brand extensions launched - Lacto Calamine Oil Balance Face Wash and Face Scrub
— Indian film actor Manoj Bajpayee and Prosenjit Chatterjee (for Eastern India) got on-board as brand ambassadors for recently introduced Polycrol Paan flavour antacid
Quarter-wise Revenue Growth during last year
Q1FY17 Q2FY17 Q3FY17 Q4FY17
31% 76% 28% 45%
Piramal Enterprises Limited – Q1 FY2018 Results Presentation
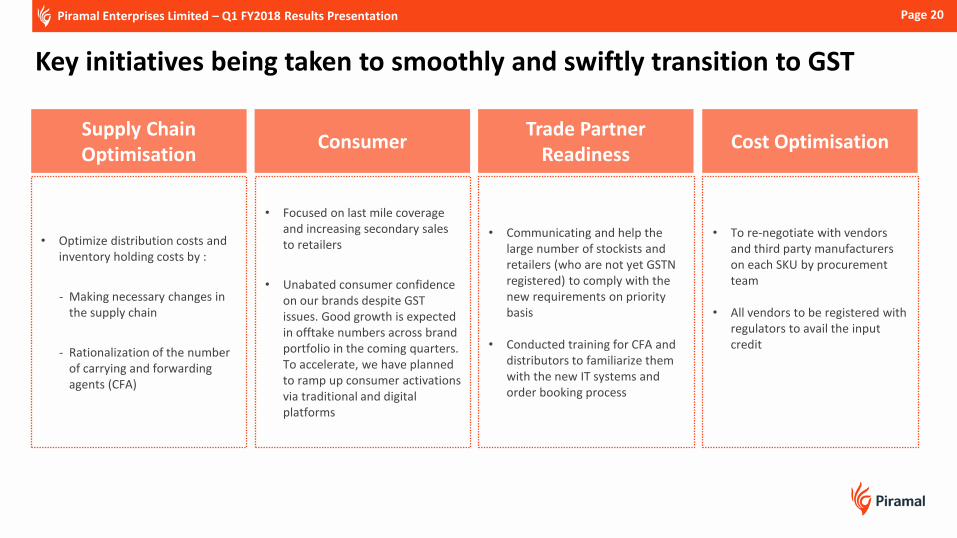
• Optimize distribution costs and inventory holding costs by :
- Making necessary changes in the supply chain
- Rationalization of the number of carrying and forwarding agents (CFA)
Supply Chain Optimisation
• To re-negotiate with vendors and third party manufacturers on each SKU by procurement team
• All vendors to be registered with regulators to avail the input credit
Cost Optimisation
• Communicating and help the large number of stockists and retailers (who are not yet GSTN registered) to comply with the new requirements on priority basis
• Conducted training for CFA and distributors to familiarize them with the new IT systems and order booking process
Trade Partner Readiness
• Focused on last mile coverage and increasing secondary sales to retailers
• Unabated consumer confidence on our brands despite GST issues. Good growth is expected in offtake numbers across brand portfolio in the coming quarters. To accelerate, we have planned to ramp up consumer activations via traditional and digital platforms
Consumer
Piramal Enterprises Limited – Q1 FY2018 Results Presentation Page 20
Key initiatives being taken to smoothly and swiftly transition to GST
Healthcare Insight and Analytics
Page 21 Piramal Enterprises Limited – Q1 FY2018 Results Presentation
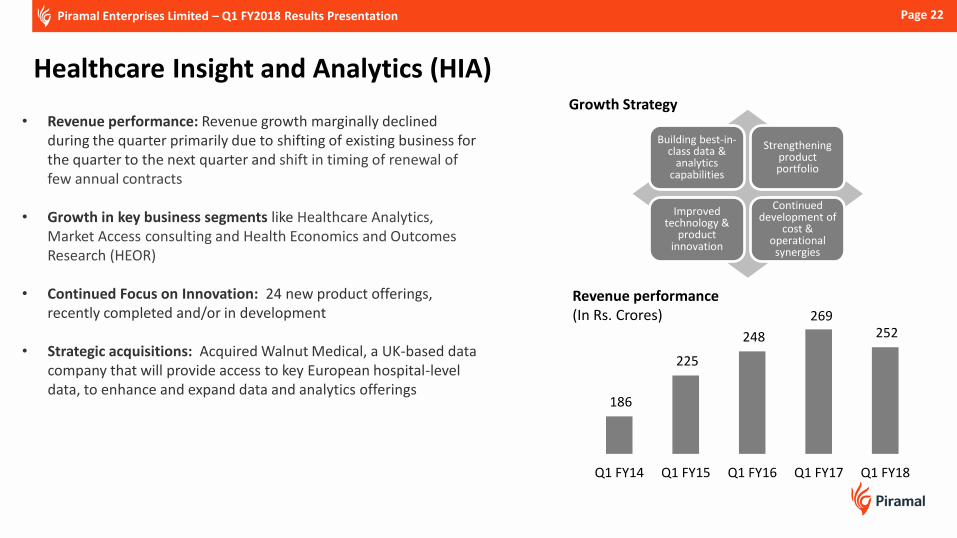
Healthcare Insight and Analytics (HIA)
Page 22
• Revenue performance: Revenue growth marginally declined during the quarter primarily due to shifting of existing business for the quarter to the next quarter and shift in timing of renewal of few annual contracts
• Growth in key business segments like Healthcare Analytics,
Market Access consulting and Health Economics and Outcomes Research (HEOR)
• Continued Focus on Innovation: 24 new product offerings, recently completed and/or in development
• Strategic acquisitions: Acquired Walnut Medical, a UK-based data company that will provide access to key European hospital-level data, to enhance and expand data and analytics offerings
Revenue performance (In Rs. Crores)
186
225
248
269 252
Q1 FY14 Q1 FY15 Q1 FY16 Q1 FY17 Q1 FY18
Growth Strategy
Building best-in-class data &
analytics capabilities
Strengthening product portfolio
Improved technology &
product innovation
Continued development of
cost & operational
synergies
Piramal Enterprises Limited – Q1 FY2018 Results Presentation

Financials
Page 23 Piramal Enterprises Limited – Q1 FY2018 Results Presentation
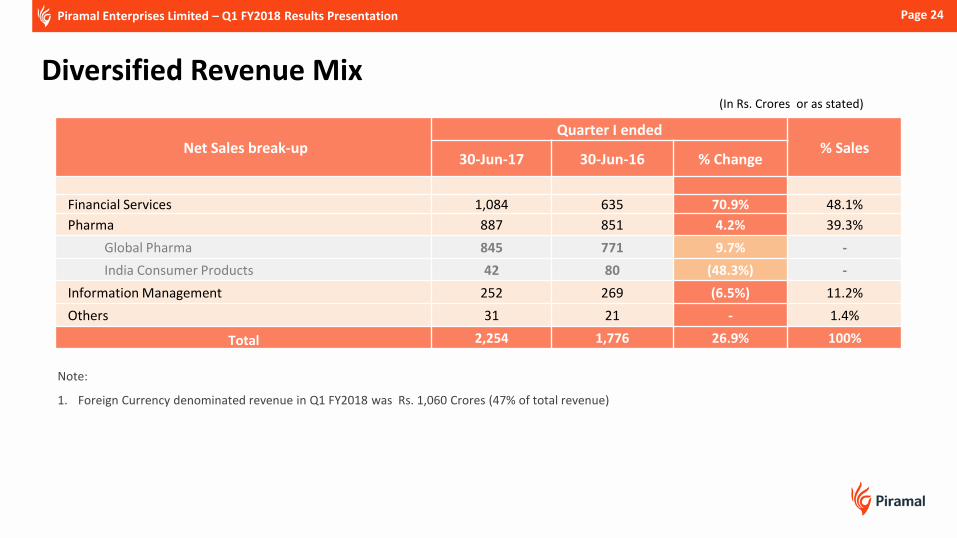
Diversified Revenue Mix
Page 24
Note:
1. Foreign Currency denominated revenue in Q1 FY2018 was Rs. 1,060 Crores (47% of total revenue)
(In Rs. Crores or as stated)
Net Sales break-up Quarter I ended
% Sales 30-Jun-17 30-Jun-16 % Change
Financial Services 1,084 635 70.9% 48.1%
Pharma 887 851 4.2% 39.3%
Global Pharma 845 771 9.7% -
India Consumer Products 42 80 (48.3%) -
Information Management 252 269 (6.5%) 11.2%
Others 31 21 - 1.4%
Total 2,254 1,776 26.9% 100%
Piramal Enterprises Limited – Q1 FY2018 Results Presentation

Consolidated P&L
Piramal Enterprises Limited – Q1 FY2018 Results Presentation Page 25
Particulars Quarter I Ended
31-Jun-17 31-Jun-16 % Change
Net Sales 2,254 1,776 27%
Non-operating other income 84 53 58%
Total income 2,338 1,829 28%
Other Operating Expenses 1,192 1,138 5%
OPBIDTA 1,146 691 66%
OPM % 49% 38% -
Interest Expenses 673 395 70%
Depreciation 123 77 60%
Profit before tax & exceptional items 350 219 60%
Exceptional items (Expenses)/Income - - -
Income tax 102 46 122%
Profit after tax (before MI & Prior Period items) 247 173 43%
Minority interest - - -
Share of Associates 55 58 (6%)
Net Profit after Tax 302 231 31%
EPS (Rs./share) 17.5 13.4 31%
Notes: 1. Income under share of associates primarily includes our share of profits at Shriram Capital and profit under JV with Allergan, as per the new accounting
standards.
(In Rs. Crores or as stated)

For Investors : Hitesh Dhaddha Email : [email protected] Phone : +91 22 3046 6444 Bhavna Sinyal Email : [email protected] Phone : +91 22 3046 6570
Page 26 Piramal Enterprises Limited – Q1 FY2018 Results Presentation