piper jaffray companies annual report · piper jaffray companies annual report. to our fellow...
TRANSCRIPT

2018 We connect capital with opportunity
to create value and build a better future
PIPER JAFFRAY COMPANIES ANNUAL REPORT

To our fellow shareholders:
In 2018, we recorded the firm’s second-highest adjusted net revenues and EPS on record, producing $780.8 million and $6.13 for the year, respectively. Piper Jaffray experienced market share gains and strong results across several of our businesses.
Our 2018 results reflect the groundwork we have laid in recent years, with a strategy focused on growing leadership in our core sectors, shifting to more capital-light, variable cost model, and maintaining product diversity that provides counterbalance in varying market conditions.
Throughout the course of Piper Jaffray’s 123-year history, we have weathered many storms. It is hard to believe that just a decade ago, we experienced one of the worst economic downturns of all time. In 2008, we stated that Piper Jaffray had a tremendous opportunity to strengthen our market position. A decade later, we built a much stronger firm, our revenues have more than doubled, and our fundamental purpose continues to be serving our clients. For the past five years alone, our share price has grown 76%, significantly outperforming the KBW Capital Markets Index return of 38% and the S&P 500 Index return of 46% over the same period.
We take great pride in this progress – but we have only just begun. 2018 marked our first full year under new firm leadership with Chad Abraham serving as CEO and Deb Schoneman
serving as president. We also welcomed Deb, along with former chairman of Nuveen Asset Management, Thomas Schreier Jr., to Piper Jaffray’s board of directors. In February 2019, we announced that Andrew Duff will retire as chairman of the board and will be succeeded by Chad Abraham in May. We sincerely thank Andrew for his 16 years of leadership on our board.
In November, we named James Baker as the firm’s global co-head of investment banking and capital markets, effective at the beginning of 2019. James, who joined Piper Jaffray through our acquisition of Simmons EnergySM, will now lead our firm’s largest business line alongside Scott LaRue.
It would be difficult to overstate the importance of attracting and retaining high-quality people in our human capital-centered businesses. Christine Esckilsen, who leads this area, was named the mid-sized company “Chief Human Resources Officer of the Year” by national publication, HRO Today, for the critical role she plays in shaping our firm’s differentiated culture.
This letter includes non-GAAP or adjusted financial measures. The non-GAAP measures are not meant to be considered in isolation or as a substitute for the corresponding U.S. GAAP measures. Please refer to pages A1-A3 at the back of this report for a reconciliation of these non-GAAP financial measures to the most directly comparable U.S. GAAP measure.

Leadership has been a central theme across everything we do – whether in the markets where we compete or in the talent we foster. This will continue to be critical as we execute the next phase of our growth. We have many passionate people leading the firm today, and we made efforts this year to invest in developing our next generation of leaders. Across all of our business areas, we are taking steps that position us for a successful future.
We also launched a new mission, vision and guiding principles, reaffirming that serving clients is our fundamental purpose. Each employee was provided with a copy to foster a shared sense of purpose as we look to our future together. For our shareholders, we have worked hard to deliver value and strengthen our capital position. Since initiating our dividend program in 2017, we have returned $182.3 million to shareholders in the form of quarterly and special dividends and stock buybacks. For the year, our adjusted return-on-equity was 13.6%, and we remain focused on generating a return-on-equity well in excess of our cost of capital. We intend to continue to return capital to our shareholders, as we balance distributions to shareholders with deploying capital for growth and future acquisitions.
An example of deploying capital to strengthen our platform is the recently announced acquisition of Weeden & Co., L.P., one of the industry’s most highly ranked institutional equities trading firms. The transaction, expected to close in June of 2019, will position Piper Jaffray with one of the largest distribution footprints of any mid-tier broker. The increased scale and capabilities in equities execution expands our value proposition to clients and enables us to be a market leader in research, capital markets and trading. This combination also strengthens our equity capital markets capabilities and our ability to raise capital for corporate clients.
In terms of organic growth, we continue to focus on strengthening our sector penetration and product capabilities. We recruited a number of senior professionals to grow our managing director headcount to 90 in equity investment banking – a 7% increase for the year. Through these additions, we expanded our banking coverage into new sub-verticals in healthcare and industrials, as well as bolstering our energy and consumer practices. Additionally, in our public finance business, we recruited a Phoenix-based team to serve state and local issuers in this market.
Early in the year, we formed Piper Jaffray Finance, LLC, a middle-market debt underwriting platform that has proven to be advantageous for our clients. The team has already achieved early success across healthcare, consumer, energy, industrials and technology, and is experiencing continued momentum in 2019.
As we look ahead, we intend to actively pursue talent, product capabilities and sector coverage where we see meaningful demand and opportunities for growth.
As we look ahead, we intend to actively pursue talent, product capabilities and sector coverage where we see meaningful demand and opportunities for growth.

Our 2018 results reflect the groundwork we have laid in recent years, with a strategy focused on growing leadership in our core sectors, shifting to more capital-light, variable cost model, and maintaining product diversity that provides counterbalance in varying market conditions.
$781M2018 ADJUSTED NET REVENUES
+9%ADJUSTED NET REVENUE FIVE-YEAR CAGR
$6.13 2018 ADJUSTED DILUTED EPS
+11%ADJUSTED DILUTED EPS FIVE-YEAR CAGR
$94M
2018 ADJUSTED NET INCOME
13.6% 2018 ADJUSTED ROE (VS. 8.2% FIVE YEARS AGO)
$394M2018 ADVISORY REVENUE
+40%ADVISORY REVENUE FIVE-YEAR CAGR
50% 2018 ADVISORY REVENUE AS A PERCENT OF TOTAL ADJUSTED NET REVENUES (VS. 14% FIVE YEARS AGO)
$118M2018 CAPITAL RETURNED THROUGH DIVIDENDS AND SHARE REPURCHASES

Investment Banking
Investment banking enjoyed another banner year with broad contributions from across the platform, led largely by healthcare, energy, consumer and industrials. One of our key strategies has been to drive growth and increase the contribution of our advisory business – which generated $394.1 million in revenue in 2018. For the second year in a row, advisory services contributed more than 50% to firm revenues. To further illustrate our progress, our advisory revenues averaged $418.7 million for 2017 and 2018 – when just five years ago, this area generated only $74.4 million.
Healthcare continues to be the firm’s leading franchise, completing some of the industry’s most significant transactions across M&A and capital markets. Over the past couple of years, our industrials team in particular has made meaningful headway, nearly doubling its managing director headcount to 11 and increasing revenue by 71% year-over-year. The successful augmentation of both our industrials and consumer sectors demonstrates our ability to build market-leading franchises across our coverage areas, and makes our overall platform more durable and diversified. We continue to make significant investments in growth and new hires in our financial services and technology sectors. For 2018, we executed 170 advisory transactions – our highest volume to-date and a 4% increase from our 2017 record.
A few years ago, we set our sights on achieving a $500 million equity investment banking business and we exceeded that goal in both 2017 and 2018. We now have ambitions of reaching $750 million in banking revenue. We are taking intentional steps to achieve this revenue goal over the next several years by adding senior talent, driving higher productivity and pursuing highly strategic corporate development opportunities and team hires. The successful acquisition of Simmons EnergySM in 2016 exemplifies our ability to integrate new businesses onto our platform that produce immediate value.
Equity Financing
Our equity financing business provides important diversification alongside the advisory franchise. We made significant strides in our equity financing business with revenues of $122.2 million for the year. Our steady progress in bookrunning transactions – which represented 75% of equity capital-raising revenue for 2018 – helped to make it one of our most active years. Consistent with the market, deal activity was heavily concentrated in healthcare, our most active industry sector. Looking ahead, we are well-positioned to capitalize on our successful track record to drive market share across many of our sectors.
Equity Institutional Brokerage
Equity institutional brokerage operates as an essential counterpart to our equity financing business. For 2018, we recorded $77.5 million of revenue, down 5% from 2017. We are encouraged that, despite the industry trend to unbundle payments for execution and investment research, clients continue to turn to us for our research and corporate access offerings. With our announced acquisition of Weeden & Co., L.P. in February 2019, we believe that our expanded trading capabilities will position us to gain market share while better meeting the needs of our clients.
In equity research, we meaningfully expanded our biotechnology coverage – one of the most active sectors in the market – by adding three senior research analysts. This group now represents one of the broadest biopharma platforms on the Street with six research teams and the capacity to cover more than 125 stocks. In the energy space, we hired two senior analysts, strengthening our research in exploration and production and refining and integrated oil. In total, our research platform now consists of 37 senior analysts covering 650 stocks.

Public Finance Services
Federal tax reform legislation adversely impacted municipal underwriting and trading businesses in 2018. In spite of a down market, our public finance group gained market share – both by volume and par amount. For total number of negotiated deals, Piper Jaffray ranked as the No. 2 underwriter in the U.S. Based on total par amount, we moved up to No. 8, ranking at the very top of our peer group and representing our highest-ever market share.
Complementing the governmental business, we are encouraged by the progress and growth prospects of our specialty practices. The senior living group in particular is able to leverage the firm’s distribution and institutional resources to offer highly competitive financing solutions in this growing space.
Our public finance strategy is to continue making selective investments as opportunities arise, including building out specialty sectors, expanding state and local presence for our governmental practice and enhancing product offerings. With a national footprint and an industry-leading practice, our goal is to advance our leadership position in every geographical market where we compete.
Fixed Income Institutional Brokerage
Fixed income services was impacted in 2018 by very challenging market conditions, including interest rate volatility, a flat yield curve and broader macroeconomic concerns – and our exposure to the municipal markets particularly hurt results. Despite the difficult operating environment, we continued to focus on managing the variables within our control and reducing the company’s risk profile. We proactively decreased inventory balances by more than 50% for the year, which we believe strengthens our position going forward. More importantly, this reflects a shift in strategy to lead with expertise and intellectual capital, where we can be most impactful to clients, instead of relying on our balance sheet.
Asset Management
Market depreciation and outflows adversely affected our product offerings in asset management, ending 2018 with $5.8 billion in assets under management. While there remains room for improvement in this business, we are encouraged by our value-oriented approach and compelling yield prospects in our MLP products. Our mutual fund complex has generated solid performance, and we believe clients increasingly see the benefit of active management.

As we embark upon a new year, we also reflect on Piper Jaffray’s sources of continuity and stability. We know that in order for our business to succeed, we need bright, hard-working people committed to staying ahead of our clients’ needs. We are intentional about fostering a differentiated culture, where leadership, collaboration, integrity, and diversity and inclusion are top priorities. As a firm, we succeed when our clients succeed – but our clients succeed only when our employees do. We have long believed that the DNA of our culture sets us apart when it comes to serving clients.
Looking ahead, volatility and economic fears will inevitably confront the industry. During unpredictable times, our clients rely on us even more for advice and expertise they can trust. Despite uncertain markets, we largely believe that conditions remain conducive for many of our business, driven by CEO confidence levels, reasonable valuations, a fundamentally sound U.S. economy and ample financing availability. As always, we will position our business for durability against volatility in the market.
As we think about what the future holds, we have confidence in our balanced business model and the strength of our people and platform. We will concentrate efforts and increase scale where we see growth potential across our industry sectors, product offerings and geographies. We are confident that our robust performance will help us to attract and execute on more significant opportunities. Our ongoing dividend and buyback programs will help to leverage upside potential for our shareholders. Finally, our mission, vision and guiding principles will ground us as we capitalize on opportunities and win in the marketplace.
In closing, we would like to express gratitude to our colleagues whose hard work and efforts move the firm forward every day. As always, we sincerely thank our shareholders and clients for the trust you place in us.
Andrew S. Duff Chad R. Abraham Debbra L. SchonemanChairman of the Board Chief Executive Officer President

BOARD OF DIRECTORS
Andrew S. DuffChairman and Former Chief Executive OfficerPiper Jaffray Companies
Philip E. Soran (Lead Independent Director)Former PresidentDell Compellent Inc.
Chad R. AbrahamChief Executive OfficerPiper Jaffray Companies
William R. FitzgeraldChairman and Chief Executive OfficerAscent Capital Group, Inc.
B. Kristine JohnsonPresidentAffinity Capital Management
Addison (Tad) L. PiperFormer Chairman and Chief Executive OfficerPiper Jaffray Companies Inc.
Debbra L. SchonemanPresidentPiper Jaffray Companies
Thomas S. Schreier Jr.Former Vice ChairmanNuveen Investments, Inc.Former Chairman Nuveen Asset Management
Sherry M. SmithFormer Executive Vice President, Chief Financial OfficerSUPERVALU INC.
Scott C. TaylorExecutive Vice President, General Counsel and SecretarySymantec Corp.
Michele VolpiFormer Chief Executive OfficerPRÆSIDIAD and H.B. Fuller Company
LEADERSHIP TEAM
Chad R. AbrahamChief Executive Officer
Debbra L. SchonemanPresident
James P. BakerGlobal Co-Head of Investment Banking and Capital Markets
Timothy L. CarterChief Financial Officer
Christine N. EsckilsenChief Human Capital Officer
Frank E. FairmanHead of Public Finance Services
John W. GeelanGeneral Counsel and Secretary
R. Scott LaRueGlobal Co-Head of Investment Banking and Capital Markets
Shawn C. QuantChief Information Officer
Thomas P. SchnettlerVice Chairman
In memoriam of Michael Frazier (1949-2018), former chairman & CEO of Simmons EnergySM and Piper Jaffray board member.

OUR MISSION
We connect capital with opportunity to create value and build a better future.
OUR VISION
A leading financial advisory and capital markets firm that wins through deep sector expertise, candid advice and a differentiated, highly productive culture – enabling growth and success for our clients as well as rewarding careers for our employees.
GUIDING PRINCIPLES
We create and implement superior financial solutions for our clients. Serving clients is our fundamental purpose.
We earn our clients’ trust by delivering the best guidance and service. Great people working together as a team are our competitive advantage.
As we serve, we are committed to these core values:
• Always place our clients’ interests first
• Conduct ourselves with integrity and treat others with respect
• Work in partnership with our clients and each other
• Attract, retain and develop a diverse group of the best people in a high-quality, inclusive environment
• Contribute our talents and resources to serve the communities in which we live and work

UNITED STATES SECURITIES AND EXCHANGE COMMISSIONWashington, D.C. 20549
FORM 10-KANNUAL REPORT PURSUANT TO SECTION 13 OR 15(d) OF THE
SECURITIES EXCHANGE ACT OF 1934For the Fiscal Year Ended December 31, 2018
Commission File No. 001-31720
PIPER JAFFRAY COMPANIES(Exact Name of Registrant as specified in its Charter)
DELAWARE 30-0168701(State or Other Jurisdiction of Incorporation or Organization) (IRS Employer Identification No.)
800 Nicollet Mall, Suite 1000Minneapolis, Minnesota 55402
(Address of Principal Executive Offices) (Zip Code)(612) 303-6000
(Registrant's Telephone Number, Including Area Code)
Securities registered pursuant to Section 12(b) of the Act:Title of Each Class Name of Each Exchange On Which Registered
Common Stock, par value $0.01 per share The New York Stock Exchange
Securities registered pursuant to Section 12(g) of the Act:None
Indicate by check mark if the registrant is a well-known seasoned issuer, as defined in Rule 405 of the Securities Act. Yes No
Indicate by check mark if the registrant is not required to file reports pursuant to Section 13 or Section 15(d) of the Exchange Act. Yes No
Indicate by check mark whether the registrant: (1) has filed all reports required to be filed by Section 13 or 15(d) of the Securities Exchange Act of 1934 during the preceding 12 months (or for such shorter period that the registrant was required to file such reports), and (2) has been subject to such filing requirements for the past 90 days. Yes No
Indicate by check mark whether the registrant has submitted electronically every Interactive Data File required to be submitted pursuant to Rule 405 of Regulation S-T (§232.405 of this chapter) during the preceding 12 months (or for such shorter period that the registrant was required to submit such files). Yes No
Indicate by check mark if disclosure of delinquent filers pursuant to Item 405 of Regulation S-K (§229.405 of this chapter) is not contained herein, and will not be contained, to the best of registrant's knowledge, in definitive proxy or information statements incorporated by reference in Part III of this Form 10-K or any amendment to this Form 10-K.
Indicate by check mark whether the registrant is a large accelerated filer, an accelerated filer, a non-accelerated filer, a smaller reporting company, or an emerging growth company. See the definitions of "large accelerated filer," "accelerated filer," "smaller reporting company, " and "emerging growth company" in Rule 12b-2 of the Exchange Act.
Large accelerated filer Accelerated filerNon-accelerated filer Smaller reporting company
Emerging growth company
If an emerging growth company, indicate by check mark if the registrant has elected not to use the extended transition period for complying with any new or revised financial accounting standards provided pursuant to Section 13(a) of the Exchange Act.
Indicate by check mark whether the registrant is a shell company (as defined in Rule 12b-2 of the Exchange Act). Yes No
The aggregate market value of the 14,717,742 shares of the Registrant's Common Stock, par value $0.01 per share, held by non-affiliates based upon the last sale price, as reported on the New York Stock Exchange, of the Common Stock on June 30, 2018 was approximately $1.1 billion.
As of February 20, 2019, the registrant had 14,638,496 shares of Common Stock outstanding.
DOCUMENTS INCORPORATED BY REFERENCE Part III of this Annual Report on Form 10-K incorporates by reference information (to the extent specific sections are referred to
herein) from the Registrant's Proxy Statement for its 2019 Annual Meeting of Shareholders to be held on May 17, 2019.

2
TABLE OF CONTENTS
PART IITEM 1. BUSINESS...................................................................................................................................... 3ITEM 1A. RISK FACTORS............................................................................................................................. 8ITEM 1B. UNRESOLVED STAFF COMMENTS.......................................................................................... 22ITEM 2. PROPERTIES ................................................................................................................................. 22ITEM 3. LEGAL PROCEEDINGS ............................................................................................................... 22ITEM 4. MINE SAFETY DISCLOSURES................................................................................................... 22
PART IIITEM 5. MARKET FOR REGISTRANT'S COMMON EQUITY, RELATED SHAREHOLDER
MATTERS AND ISSUER PURCHASES OF EQUITY SECURITIES....................................... 22ITEM 6. SELECTED FINANCIAL DATA................................................................................................... 25ITEM 7. MANAGEMENT'S DISCUSSION AND ANALYSIS OF FINANCIAL CONDITION AND
RESULTS OF OPERATIONS ...................................................................................................... 26ITEM 7A. QUANTITATIVE AND QUALITATIVE DISCLOSURES ABOUT MARKET RISK................. 60ITEM 8. FINANCIAL STATEMENTS AND SUPPLEMENTARY DATA.................................................. 61ITEM 9. CHANGES IN AND DISAGREEMENTS WITH ACCOUNTANTS ON ACCOUNTING AND
FINANCIAL DISCLOSURE........................................................................................................ 114ITEM 9A. CONTROLS AND PROCEDURES ............................................................................................... 114ITEM 9B. OTHER INFORMATION............................................................................................................... 114
PART IIIITEM 10. DIRECTORS, EXECUTIVE OFFICERS AND CORPORATE GOVERNANCE........................ 114ITEM 11. EXECUTIVE COMPENSATION .................................................................................................. 114ITEM 12. SECURITY OWNERSHIP OF CERTAIN BENEFICIAL OWNERS AND MANAGEMENT
AND RELATED SHAREHOLDER MATTERS.......................................................................... 115ITEM 13. CERTAIN RELATIONSHIPS AND RELATED TRANSACTIONS, AND DIRECTOR
INDEPENDENCE ........................................................................................................................ 115ITEM 14. PRINCIPAL ACCOUNTANT FEES AND SERVICES ................................................................. 115
PART IVITEM 15. EXHIBITS AND FINANCIAL STATEMENT SCHEDULES....................................................... 115ITEM 16. FORM 10-K SUMMARY............................................................................................................... 119
SIGNATURES ................................................................................................................................ 120

3
PART I
CAUTIONARY NOTE REGARDING FORWARD-LOOKING STATEMENTS
This Annual Report on Form 10-K for the year ended December 31, 2018 (this "Form 10-K") contains forward-looking statements. Statements that are not historical or current facts, including statements about beliefs and expectations, are forward-looking statements. These forward-looking statements include, among other things, statements other than historical information or statements of current conditions and may relate to our future plans and objectives and results, and also may include our belief regarding the effect of various legal proceedings, as set forth under "Legal Proceedings" in Part I, Item 3 of this Form 10-K and in our subsequent reports filed with the Securities and Exchange Commission ("SEC"). Forward-looking statements involve inherent risks and uncertainties, and important factors could cause actual results to differ materially from those anticipated, including those factors discussed below under "Risk Factors" in Part I, Item 1A of this Form 10-K, as well as those factors discussed under "External Factors Impacting Our Business" included in "Management's Discussion and Analysis of Financial Condition and Results of Operations" in Part II, Item 7 of this Form 10-K and in our subsequent reports filed with the SEC. Our SEC reports are available at our Web site at www.piperjaffray.com and at the SEC's Web site at www.sec.gov. Forward-looking statements speak only as of the date they are made, and we undertake no obligation to update them in light of new information or future events.
ITEM 1. BUSINESS.
Overview
Piper Jaffray Companies ("Piper Jaffray") is an investment bank and asset management firm, serving the needs of corporations, private equity groups, public entities, non-profit entities and institutional investors in the U.S. and internationally. Founded in 1895, Piper Jaffray provides a broad set of products and services, including financial advisory services; equity and debt capital markets products; public finance services; equity research and institutional brokerage; fixed income institutional brokerage; and asset management services. Our headquarters are located in Minneapolis, Minnesota and we have offices across the United States and international locations in London, Aberdeen and Hong Kong. We market our investment banking and institutional securities business under Piper Jaffray and Simmons Energy – A Division of Piper Jaffray. Our traditional asset management business is marketed under Advisory Research, Inc.
Our Businesses
We operate through two reportable business segments, Capital Markets and Asset Management. We believe that the mix of activities across our business segments helps to provide diversification in our business model.
Capital Markets
The Capital Markets segment provides investment banking and institutional sales, trading and research services for various equity and fixed income products. This segment also includes the results from our alternative asset management funds and our principal investments.
• Investment Banking – For our corporate clients, we provide advisory services, primarily relating to mergers and acquisitions, equity private placements, and debt and restructuring advisory. We also help raise capital through equity and debt financings. We operate in the following focus sectors: healthcare; energy; consumer; diversified industrials and services; business services; technology; financial services; and agriculture, clean technologies and renewables, primarily focusing on middle-market clients. For our government and non-profit clients, we underwrite debt issuances, provide municipal financial advisory and loan placement services, and offer various over-the-counter derivative products. Our public finance investment banking capabilities focus on state and local governments, cultural and social service non-profit entities, and the education, healthcare, hospitality, senior living and transportation sectors.

4
• Equity and Fixed Income Institutional Brokerage – We offer both equity and fixed income advisory and trade execution services for institutional investors and government and non-profit entities. Integral to our capital markets efforts, we have equity sales and trading relationships with institutional investors in North America and Europe that invest in our core sectors. Our research analysts provide investment ideas and support to our trading clients on approximately 650 companies. Our fixed income sales and trading professionals have expertise in municipal, corporate, mortgage, agency, treasury and structured product securities and cover a range of institutional investors. We principally engage in trading activities to facilitate customer needs. Our strategic trading activities (i.e., proprietary trading) are dedicated solely to investing firm capital, and focus principally on proprietary investments in municipal bonds and U.S. government agency securities.
• Principal Investments – We engage in merchant banking activities, which involve equity investments in late stage private companies. Additionally, we have investments in private equity funds and other firm investments.
• Alternative Asset Management Funds – We have created alternative asset management funds in merchant banking, energy, and senior living in order to invest firm capital and to manage capital from outside investors.
Asset Management
The Asset Management segment includes our traditional asset management business and our investments in registered funds and private funds or partnerships that we manage. Our traditional asset management business offers specialized investment management solutions for institutions, private clients and investment advisors. We manage MLP and energy infrastructure strategies, as well as domestic and global equity strategies. We offer customized solutions to our clients in both diversified and more concentrated versions of our products, generally through separately managed accounts, and open-end and closed-end funds.
• Master Limited Partnerships ("MLPs") and Energy Infrastructure – We manage MLPs, energy infrastructure, and related operating entity assets focused on the energy sector. These strategies focus on growth, yet seek to limit exposure to riskier securities by placing greater importance on characteristics which support stable distributions and are representative of higher quality MLPs, including less volatile businesses, strategic assets, cleaner balance sheets and proven management teams. In addition to our MLP-focused funds, we manage other private funds focused on energy sector securities.
• Equity – Our equity product offerings include both value and growth-driven strategies in the domestic and global equity markets. These strategies have investment philosophies built on a foundation of core principles, which have been tested in various market conditions and remained consistent over time. Our investment strategies seek to create portfolios that deliver long-term, positive returns while minimizing risk.
As of December 31, 2018, total assets under management ("AUM") were $5.8 billion, of which approximately 53 percentwas invested in MLPs and energy infrastructure securities and 47 percent in equities. As of the same date, approximately 79 percent of our AUM was invested in domestic investment strategies and 21 percent was invested in global investment strategies. Approximately 50 percent of our AUM as of December 31, 2018 was managed on behalf of institutional clients, including pension funds, corporations, foundations and endowments, and through mutual fund sponsors and registered advisors. Approximately 31 percent of our AUM was managed through sub-advisory relationships on closed-end funds, and approximately 19 percent of our AUM was managed on behalf of individual client relationships, which are principally high net worth individuals.
Financial Information about Geographic Areas
As of December 31, 2018, the substantial majority of our net revenues and long-lived assets were located in the U.S.

5
Competition
Our business is subject to intense competition driven by large Wall Street and international firms operating independently or as part of a large commercial banking institution. We also compete with regional broker dealers, boutique and niche-specialty firms, asset management firms and alternative trading systems that effect securities transactions through various electronic venues. Competition is based on a variety of factors, including price, quality of advice and service, reputation, product selection, transaction execution, financial resources and investment performance. Many of our large competitors have greater financial resources than we have and may have more flexibility to offer a broader set of products and services than we can.
In addition, there is significant competition within the securities industry for obtaining and retaining the services of qualified employees. Our business is a human capital business and the performance of our business is dependent upon the skills, expertise and performance of our employees. Therefore, our ability to compete effectively is dependent upon attracting and retaining qualified individuals who are motivated to serve the best interests of our clients, thereby serving the best interests of our company. Attracting and retaining employees depends, among other things, on our company's culture, management, work environment, geographic locations and compensation.
Employees
As of February 20, 2019, we had approximately 1,262 employees, of whom approximately 762 were registered with the Financial Industry Regulatory Authority, Inc. ("FINRA").
Regulation
As a participant in the financial services industry, our business is regulated by U.S. federal and state regulatory agencies, self-regulatory organizations ("SROs") and securities exchanges, and by foreign governmental agencies, financial regulatory bodies and securities exchanges. We are subject to complex and extensive regulation of most aspects of our business, including the manner in which securities transactions are effected, net capital requirements, recordkeeping and reporting procedures, relationships and conflicts with customers, the handling of cash and margin accounts, conduct, experience and training requirements for certain employees, and the manner in which we prevent and detect money-laundering and bribery activities. The regulatory framework of the financial services industry is designed primarily to safeguard the integrity of the capital markets and to protect customers, not creditors or shareholders.
The laws, rules and regulations comprising this regulatory framework can (and do) change frequently, as can the interpretation and enforcement of existing laws, rules and regulations. Conditions in the global financial markets and economy, including the 2008 financial crisis, caused legislators and regulators to increase the examination, enforcement and rule-making activity directed toward the financial services industry. The intensity of the regulatory environment may correlate with the level and nature of our legal proceedings for a given period, and increased intensity could have an adverse effect on our business, financial condition, and results of operations.
Our U.S. broker dealer subsidiary (Piper Jaffray & Co.) is registered as a securities broker dealer with the SEC and is a member of various SROs and securities exchanges. In July 2007, the National Association of Securities Dealers and the member regulation, enforcement and arbitration functions of the New York Stock Exchange ("NYSE") consolidated to form FINRA, which now serves as the primary SRO of Piper Jaffray & Co., although the NYSE continues to have oversight over NYSE-related market activities. FINRA regulates many aspects of our U.S. broker dealer business, including registration, education and conduct of our broker dealer employees, examinations, rulemaking, enforcement of these rules and the federal securities laws, trade reporting and the administration of dispute resolution between investors and registered firms. We have agreed to abide by the rules of FINRA (as well as those of the NYSE and other SROs), and FINRA has the power to expel, fine and otherwise discipline Piper Jaffray & Co. and its officers, directors and employees. Among the rules that apply to Piper Jaffray & Co. are the uniform net capital rule of the SEC (Rule 15c3-1) and the net capital rule of FINRA. Both rules set a minimum level of net capital a broker dealer must maintain and also require that a portion of the broker dealer's assets be relatively liquid. Under the applicable FINRA rule, FINRA may prohibit a member firm from expanding its business or paying cash dividends if resulting net capital falls below FINRA requirements. In addition, Piper Jaffray & Co. is subject to certain notification requirements related to withdrawals of excess net capital. As a result of these rules, our ability to make withdrawals of capital from Piper Jaffray & Co. may be limited. In addition, Piper Jaffray & Co. is licensed as a broker dealer in each of the 50 states, requiring

6
us to comply with applicable laws, rules and regulations of each state. Any state may revoke a license to conduct a securities business and fine or otherwise discipline broker dealers and their officers, directors and employees.
We also operate one entity that is authorized, licensed and regulated by the U.K. Financial Conduct Authority and registered under the laws of England and Wales, as well as an entity that is authorized, licensed and regulated by the Hong Kong Securities and Futures Commission and registered under the laws of Hong Kong. The U.K. Financial Conduct Authority and the Hong Kong Securities and Futures Commission regulate these entities (in their respective jurisdictions) in areas of capital adequacy, customer protection and business conduct, among others. We also have a subsidiary organized in Guernsey and regulated by the Guernsey Financial Services Commission ("GFSC").
Entities in the jurisdictions identified above are also subject to anti-money laundering regulations. Piper Jaffray & Co. is subject to the USA PATRIOT Act of 2001, which contains anti-money laundering and financial transparency laws and mandates the implementation of various regulations requiring us to implement standards for verifying client identification at the time the client relationship is initiated, monitoring client transactions and reporting suspicious activity. Our entities in Hong Kong, the United Kingdom and Guernsey are subject to similar anti-money laundering laws and regulations. We are also subject to the U.S. Foreign Corrupt Practices Act as well as other anti-bribery laws in the jurisdictions in which we operate. These laws generally prohibit companies and their intermediaries from engaging in bribery or making other improper payments to foreign officials for the purpose of obtaining or retaining business or gaining an unfair business advantage.
We maintain subsidiaries that are registered as investment advisors with the SEC and subject to regulation and oversight by the SEC. Advisory Research, Inc. ("ARI"), Piper Jaffray Investment Management LLC ("PJIM"), and PJC Capital Partners LLC are asset management subsidiaries and registered investment advisors. As registered investment advisors, these entities are subject to requirements that relate to, among other things, fiduciary duties to clients, maintaining an effective compliance program, solicitation agreements, conflicts of interest, recordkeeping and reporting requirements, disclosure requirements, limitations on agency cross and principal transactions between advisor and advisory clients, as well as general anti-fraud prohibitions. Piper Jaffray & Co. is also a registered investment advisor and subject to these requirements. Also, certain investment funds that we manage are registered investment companies under the Investment Company Act of 1940, as amended (the "Investment Company Act"). Those funds and entities that serve as the funds' investment advisors are subject to the Investment Company Act and the rules and regulations of the SEC, which regulate the relationship between a registered investment company and its investment advisor and prohibit or severely restrict principal transactions or joint transactions, among other requirements. ARI is also authorized by the Irish Financial Services Regulatory Authority as an investment advisor in Ireland and cleared by the Luxembourg Commission de Surviellance du Secteur Financier as a manager to Luxembourg funds. ARI was the investment advisor for Advisory Research Global Funds PLC, an open-ended investment company with variable capital authorized and regulated by the Central Bank of Ireland pursuant to the European Communities Regulations (Undertakings for Collective Investments in Transferable Securities or "UCITS"). Advisory Research Global Funds PLC closed in 2017 and liquidated in 2018. PJIM is registered with the Commodity Futures Trading Commission ("CFTC") and the National Futures Association ("NFA") as a commodities pool operator. The registrations with the CFTC and NFA allow PJIM to enter into derivative instruments (e.g., interest rate swaps and credit default swap index contracts) to hedge risks associated with certain security positions of funds managed by PJIM. Parallel General Partners Limited is the general partner of several private equity limited partnerships; it and the limited partnerships are registered and regulated by the GFSC.
Certain of our businesses also are subject to compliance with laws and regulations of U.S. federal and state governments, non-U.S. governments, their respective agencies and/or various SROs or exchanges governing the privacy of client information. Any failure with respect to our practices, procedures and controls in any of these areas could subject us to regulatory consequences, including fines, and potentially other significant liabilities.

7
Executive Officers
Information regarding our executive officers and their ages as of February 20, 2019, are as follows:
Name Age Position(s)Chad R. Abraham...................................... 50 Chief Executive OfficerDebbra L. Schoneman............................... 50 PresidentTimothy L. Carter...................................... 51 Chief Financial OfficerJames P. Baker........................................... 51 Global Co-Head of Investment Banking and Capital MarketsR. Scott LaRue .......................................... 58 Global Co-Head of Investment Banking and Capital MarketsJohn W. Geelan ......................................... 43 General Counsel and Secretary
Chad R. Abraham is our chief executive officer, a position he has held since January 2018. He previously served as co-head of global investment banking and capital markets from October 2010 to December 2017. Prior to that, he served as head of equity capital markets since November 2005. Mr. Abraham joined Piper Jaffray in 1991.
Debbra L. Schoneman is our president, a position she has held since January 2018. She previously served as chief financial officer from May 2008 to December 2017, and global head of equities from June 2017 to December 2017. Prior to that, she served as treasurer from August 2006 until May 2008; and as finance director of our corporate and institutional services business from July 2002 until July 2004 when the role was expanded to include our public finance services division. Ms. Schoneman joined Piper Jaffray in 1990.
Timothy L. Carter is our chief financial officer, a position he has held since January 2018. He previously served as senior vice president of finance from May 2017 to December 2017. Prior to that, he served as treasurer from May 2008 to May 2017, chief accounting officer from 2006 to May 2008, and controller from 1999 to 2006. Mr. Carter joined Piper Jaffray in 1995.
James P. Baker is our global co-head of investment banking and capital markets, a position he has held since January 2019. Prior to that, he served as our co-head of energy investment banking from February 2016 to December 2018. Mr. Baker joined Piper Jaffray in February 2016 in connection with our acquisition of Simmons & Company International, where Mr. Baker was a managing director and leader of its midstream/downstream investment banking group.
R. Scott LaRue is our global co-head of investment banking and capital markets, a position he has held since October 2010. Prior to that, he served as global co-head of consumer investment banking from February 2010 to September 2010 and co-head of consumer investment banking from August 2004 to January 2010. Mr. LaRue joined Piper Jaffray in 2003.
John W. Geelan is our general counsel and secretary. He served as assistant general counsel and assistant secretary from November 2007 until becoming general counsel in January 2013. Mr. Geelan joined Piper Jaffray in 2005.
Additional Information
Our principal executive offices are located at 800 Nicollet Mall, Suite 1000, Minneapolis, Minnesota 55402, and our general telephone number is (612) 303-6000. We maintain an Internet Web site at http://www.piperjaffray.com. The information contained on and connected to our Web site is not incorporated into this report. We make available free of charge on or through our Web site our annual reports on Form 10-K, quarterly reports on Form 10-Q, current reports on Form 8-K, amendments to those reports filed or furnished pursuant to Section 13(a) or 15(d) of the Securities Exchange Act of 1934, as amended, and all other reports we file with the SEC, as soon as reasonably practicable after we electronically file these reports with, or furnish them to, the SEC. Such reports are also available on the SEC's Web site at http://www.sec.gov. "Piper Jaffray," the "Company," "registrant," "we," "us" and "our" refer to Piper Jaffray Companies and our subsidiaries. The Piper Jaffray logo and the other trademarks, tradenames and service marks of Piper Jaffray mentioned in this report or elsewhere, including, but not limited to, PIPER JAFFRAY®, REALIZE THE POWER OF PARTNERSHIP®, ADVISORY RESEARCH®, SIMMONS ENERGY – A DIVISON OF PIPER JAFFRAYSM, SIMMONS & COMPANY INTERNATIONAL® ENERGY SPECIALISTS OF PIPER JAFFRAY®, PIPER JAFFRAY FINANCESM, PIPER JAFFRAY BIOINSIGHTSSM, BIOINSIGHTSSM, TAKING STOCK WITH TEENS®, HEALTHY ACTIVE AND SUSTAINABLE LIVING®, and GUIDES FOR THE JOURNEY® are the property of Piper Jaffray.

8
ITEM 1A. RISK FACTORS.
In the normal course of our business activities, we are exposed to a variety of risks. The principal risks we face in operating our business include: strategic risks, market risks, human capital risks, liquidity risks, credit risks, operational risks, and legal and regulatory risks. A full description of each of these principal areas of risk, as well as the primary risk management processes that we use to mitigate our risk exposure in each, is discussed below under the caption "Risk Management" included in "Management's Discussion and Analysis of Financial Condition and Results of Operations" in Part II, Item 7 of this Form 10-K.
The following discussion sets forth the risk factors that we have identified in each area of principal risk as being the most significant to our business, future financial condition, and results of operations. Although we discuss these risk factors primarily in the context of their potential effects on our business, financial condition or results of operations, you should understand that these effects can have further negative implications such as: reducing the price of our common stock; reducing our capital, which can have regulatory and other consequences; affecting the confidence that our clients and other counterparties have in us, with a resulting negative effect on our ability to conduct and grow our business; and reducing the attractiveness of our securities to potential purchasers, which may adversely affect our ability to raise capital and secure other funding or the prices at which we are able to do so. Further, additional risks beyond those discussed below and elsewhere in this Form 10-K or in other of our reports filed with, or furnished to, the SEC could adversely affect us. We cannot assure you that the risk factors herein or elsewhere in our other reports address all potential risks that we may face.
These risk factors also serve to describe factors which may cause our results to differ materially from those described in forward-looking statements included in this Form 10-K or in other documents or statements that make reference to this Form 10-K. Forward-looking statements and other factors that may affect future results are discussed below under "Management's Discussion and Analysis of Financial Condition and Results of Operations" in Part II, Item 7 of this Form 10-K.
Strategic and Market Risk
Our business success depends in large part upon the strategic decisions made by our executive management, the alignment of business plans developed to act upon those decisions, and the quality of implementation of these business plans. Strategic risk represents the risk associated with our executive management failing to develop and execute on the appropriate strategic vision which demonstrates a commitment to our culture, leverages our core competencies, appropriately responds to external factors in the marketplace, and is in the best interests of our company. In setting out and executing upon a strategic vision for our business, we are faced with a number of inherent risks, including risks relating to external events and market and economic conditions, competition, and business performance that could all negatively affect our ability to execute on our strategic decisions and, therefore, our future financial condition or results of operations. The risks related to external events and overall market and/or economic conditions are referred to as market, or systemic, risk. The following are those risk factors that we have identified as being most significant to our strategic vision, and the market risks that may impact execution of our strategy.
Developments in market and economic conditions have in the past adversely affected, and may in the future adversely affect, our business and profitability and cause volatility in our results of operations.
Economic and market conditions have had, and will continue to have, a direct and material impact on our results of operations and financial condition because performance in the financial services industry is heavily influenced by the overall strength of economic conditions and financial market activity. For example:
• Our equities investment banking revenue in the form of advisory (i.e., M&A), underwriting, and placement fees, is directly related to macroeconomic conditions and corresponding financial market activity. When the outlook for macroeconomic conditions is uncertain or negative, financial market activity generally tends to decrease, which can reduce our equities investment banking revenues. As an example, a significant portion of our investment banking revenues in recent years have been derived from advisory engagements in our focus sectors, and activity in this area is highly correlated to the macroeconomic environment and market conditions. Reduced expectations of U.S. economic growth or a decline in the global macroeconomic outlook could cause financial market activity to decrease and negatively affect our advisory revenues. In addition, U.S. financial markets remain vulnerable to the potential risks posed by exogenous shocks, which could include, among other things, political and financial uncertainty in the United States and the European Union, renewed concern about China's economy, complications involving global trade, and terrorism and armed conflicts around the world. More generally, because our business is closely correlated to the macroeconomic outlook, a significant deterioration in that outlook or an

9
exogenous shock would likely have an immediate and significant negative impact on our equities investment banking business and our overall results of operations.
• Interest rates can have a significant impact on macroeconomic activity and economic growth, and they also meaningfully affect multiple components of our business, including fixed income inventory on our balance sheet. Rising interest rates, volatility in interest rates, changes in the slope of the yield curve, and changes in credit spreads all impact our business. During 2018, the U.S. Federal Reserve increased short-term rates four times in response to stronger economic growth, but long-term rates did not correspondingly rise, causing the yield curve to flatten, which muted our fixed income institutional results for the year. The U.S. Federal Reserve has indicated that it will be taking into consideration U.S. and global economic and financial conditions as it evaluates additional increases in short-term rates in 2019. If the U.S. Federal Reserve continues to raise rates, or longer-term rates rise across the yield curve, we could see increased fixed income activity, but the rising interest rates could be perceived as moderating macroeconomic growth, which might cause equity market volatility and a corresponding decrease in transaction volumes for our advisory and equity capital markets businesses. With respect to our inventory, a large percentage of our positions on our balance sheet consists of fixed income securities, and increases in interest rates (especially if rapid) may decrease the value of these inventories, sometimes significantly. To reduce interest rate risk and volatility, we use interest rate hedging strategies, but we generally do not hedge all of our interest rate risk, and volatility may reduce the correlation (i.e., effectiveness) between certain hedging vehicles and the securities inventory we are attempting to hedge. Lastly, increased interest rates may also negatively impact the volume of debt refinancing issuances underwritten by our public finance investment banking business, as well as our assets under management focused on master limited partnerships ("MLPs"), which may underperform compared to other asset classes in a rising interest rate environment.
• U.S. equity markets saw significant volatility in 2018 in response to a number of factors, including concerns about the number and pace of future interest rate increases by the U.S. Federal Reserve, a slowdown in the rate of U.S. or global economic growth, particularly in China, and trade disputes and retaliatory tariffs. Companies were generally able to continue to access U.S. equity markets in initial public offerings and other listings during most of 2018 outside of the periods of more pronounced volatility, which contributed positively to our operating results for the year. However, if volatility in the U.S. equity markets were to return or increase in 2019, whether due to the aforementioned factors or other concerns about U.S. or global economic conditions or political and financial uncertainty in the U.S., European, or other major global economies, or due to some other exogenous shock, companies may find it more difficult to conduct initial public offerings or raise additional capital from public equity markets, which could have a negative impact on our equity capital markets business and our overall results of operations. In addition, the U.S. federal government shutdown at the beginning of 2019 disrupted companies' ability to access U.S. equity markets. Any similar prolonged shutdown could have a negative impact on our equity capital markets business and our overall results of operations.
It is difficult to predict the economic and market conditions for 2019, which are dependent upon the pace of global and U.S. economic growth and geopolitical events globally. The fourth quarter of 2018 experienced significant levels of volatility in global and U.S. markets, reflecting some uncertainty around the outlook for global and U.S. economic growth and the potential likelihood and impact of significant or protracted trade disputes and retaliatory tariffs. Since we have a smaller scale compared to many of our competitors, the cyclical nature of the economy and the financial services industry leads to volatility in our financial results, including our operating margins, compensation ratios, business mix, and revenue and expense levels. Our financial performance may be limited by the fixed nature of certain expenses, the impact from unanticipated losses or expenses during the year, our business mix, and the inability to scale back costs in a timeframe to match decreases in revenue-related changes in market and economic conditions. As a result, our financial results may vary significantly from quarter-to-quarter and year-to-year.
Developments in specific business sectors and markets in which we conduct our business, have in the past adversely affected, and may in the future adversely affect, our business and profitability.
Our results for a particular period may be disproportionately impacted by declines in specific sectors of the U.S. or global economy, or for certain products within the financial services industry, due to our business mix and focus areas. For example:
• Our equities investment banking business focuses on specific sectors, including healthcare, energy, consumer, diversified industrials and services, business services, technology, financial services, and agriculture, clean technologies and renewables. Volatility, uncertainty, or slowdowns in any of these sectors may adversely affect our business, sometimes disproportionately, and may cause volatility in the net revenues we receive from our corporate advisory and capital markets activities. In recent

10
years, the healthcare and energy sectors have been a significant contributor to our overall results, and negative developments in either of these sectors would materially and disproportionately impact us, even if general economic conditions were strong. In addition, we may not participate, or may participate to a lesser degree than other firms, in sectors that experience significant activity, such as real estate, and our operating results may not correlate with the results of other firms that participate in these sectors.
• Our public finance investment banking business depends heavily upon conditions in the municipal market. It focuses on investment banking activity in sectors that include state and local government, education, senior living, healthcare, transportation, and hospitality sectors, with an emphasis on transactions with a par value of $500 million or less. Concerns about a slowdown in U.S. economic growth could have a disproportionate impact on high-yield sectors, which makes up a significant portion of our public finance business and could have a negative impact on our results of operations. Further, the enactment, or the threat of enactment, of any legislation that alters the financing alternatives available to local or state governments or tax-exempt organizations through the elimination or reduction of tax-exempt bonds could have a negative impact on our results of operations in these businesses. For example, the Tax Cuts and Jobs Act of 2017 ("Tax Cuts and Jobs Act") eliminated tax-exempt advance refunding bonds, which are bonds issued by a local or state government to refinance outstanding bonds before the original bonds mature or are callable in order to take advantage of lower borrowing costs. The elimination of tax-exempt advance refunding bonds led to a reduction in the total amount of refunding issuances made by issuers during 2018, which impacted our public finance business.
• Our fixed income institutional business derives its revenue from sales and trading activity in the municipal market and from products within the taxable market, hybrid preferreds, and government agency products. Our operating results for our fixed income institutional business may not correlate with the results of other firms or the fixed income market generally because a significant portion of our business focuses on the municipal market and we do not participate in significant segments of the fixed income markets such as credit default swaps, corporate high-yield bonds, currencies or commodities. In addition, the Tax Cuts and Jobs Act reduced the federal corporate income tax rate from 35 percent to 21 percent. We believe that this change in corporate tax rate reduced demand from some institutional investors, including banks and insurance companies, for tax-exempt municipal bonds, which negatively impacted our fixed income institutional business and results of operations in 2018.
Financing and advisory services engagements are transactional in nature and do not generally provide for subsequent engagements.
Even though we work to represent our clients at every stage of their lifecycle, we are typically retained on a short-term, engagement-by-engagement basis in connection with specific capital markets or mergers and acquisitions transactions. As a consequence, the timing of when fees are earned varies, and, therefore, our financial results from capital markets and corporate advisory activities may experience volatility quarter to quarter based on equity market conditions as well as the macroeconomic business cycle more broadly. In particular, our revenues related to acquisition and disposition transactions tend to be more unpredictable from quarter to quarter due to the one-time nature of the transaction and the size of the fee. In addition, in recent years, we have received a greater portion of our revenues from fees paid to us for our role in advising on larger transactions. As a result, high levels of revenue in one quarter will not necessarily be predictive of continued high levels of revenue in any subsequent period. If we are unable to generate a substantial number of new engagements and generate fees from the successful completion of those transactions, our business and results of operations could be adversely affected.
The number of anticipated investment banking transactions may differ from actual results.
The completion of anticipated investment banking transactions in our pipeline is uncertain and partially beyond our control, and our investment banking revenue is typically earned only upon the successful completion of a transaction. In most cases, we receive little or no payment for investment banking engagements that do not result in the successful completion of a transaction. For example, a client's acquisition transaction may be delayed or terminated because of a failure to agree upon final terms with the counterparty, failure to obtain necessary regulatory consents or director or stockholder approvals, failure to secure necessary financing, adverse market conditions or unexpected financial or other issues in the client's or counterparty's business. If parties fail to complete a transaction on which we are advising or an offering in which we are participating, we earn little or no revenue from the transaction and may have incurred significant expenses (e.g., travel and legal expenses) associated with the transaction. Accordingly, our business is highly dependent on market conditions as well as the decisions and actions of our clients and interested third parties, and the number of engagements we have at any given time (and any characterization or description of our deal pipelines) is subject to change and may not necessarily result in future revenues.

11
We may make strategic acquisitions, enter into new business opportunities, engage in joint ventures, or divest existing businesses, which could cause us to incur unforeseen expenses and have disruptive effects on our business and may not yield the benefits we expect.
We may grow in part through corporate development or similar activities that could include acquisitions, joint ventures and minority investment stakes, and entering into new lines of business. There are a number of risks associated with these activities. Costs or difficulties relating to a transaction, including integration of products, employees, technology systems, accounting systems and management controls, or entry into a new business line, may be difficult to predict accurately and be greater than expected causing our estimates to differ from actual results. Importantly, we may be unable to retain key personnel after a transaction, including personnel who are critical to the success of the ongoing business. We may incur unforeseen liabilities of an acquired company or from entry into a new business line, that could impose significant and unanticipated legal costs on us. For example, we recently initiated research coverage of cannabis stocks and are evaluating other opportunities in this market, which present unique risks and exposure. Also, our stock price could decline after we announce or complete a transaction if investors view the transaction as too costly or unlikely to improve our competitive position.
Longer-term, these activities may require increased costs in the form of management personnel, financial and management systems and controls and facilities, which, in the absence of continued revenue growth, could cause our operating margins to decline. In addition, when we acquire a business, a substantial portion of the purchase price is often allocated to goodwill and other identifiable intangible assets. Our goodwill and intangible assets are tested at least annually for impairment. If, in connection with that test, we determine that a reporting unit's fair value is less than its carrying value, we would be required to recognize an impairment to the goodwill associated with that reporting unit. More generally, any difficulties that we experience could disrupt our ongoing business, increase our expenses and adversely affect our operating results and financial condition. We also may be unable to achieve anticipated benefits and synergies from a transaction as fully as expected or within the expected time frame. Divestitures or elimination of existing businesses or products could have similar effects.
We may not be able to compete successfully with other companies in the financial services industry who often have significantly greater resources than we do.
The financial services industry remains highly competitive, and our revenues and profitability will suffer if we are unable to compete effectively. We generally compete on the basis of such factors as quality of advice and service, reputation, price, product selection, transaction execution and financial resources. Pricing and other competitive pressures in investment banking, including the use of multiple book runners, co-managers, and multiple financial advisors handling transactions, have and could continue to adversely affect our revenues.
We remain at a competitive disadvantage given our relatively small size compared to some of our competitors. Large financial services firms generally have a larger capital base, greater access to capital, and greater technology resources, affording them greater capacity for risk and potential for innovation, an extended geographic reach and flexibility to offer a broader set of products. For example, some of these firms are able to use their larger capital base to offer additional products or services to their investment banking clients, which can be a competitive advantage. With respect to our fixed income institutional and public finance investment banking businesses, it is more difficult for us to diversify and differentiate our product set, and our fixed income business mix currently is concentrated in the municipal market and to a lesser extent corporate credits, potentially with less opportunity for growth than other firms which have grown their fixed income businesses by investing in, developing and offering non-traditional products (e.g., credit default swaps, interest rate products and currencies and commodities).
Our inability to identify and address actual, potential, or perceived conflicts of interest may negatively impact our reputation and have a material adverse effect on our business.
We regularly address actual, potential or perceived conflicts of interest in our business, including situations where our services to a particular client or our own investments or other interests conflict, or are perceived to conflict, with the interests of another client. Appropriately identifying and dealing with conflicts of interest is complex and difficult, and we face the risk that our current policies, controls and procedures do not timely identify or appropriately manage such conflicts of interest. It is possible that actual, potential or perceived conflicts could give rise to client dissatisfaction, litigation or regulatory enforcement actions. Our reputation could be damaged if we fail, or appear to fail, to deal appropriately with potential or actual conflicts of interest. Client dissatisfaction, litigation, or regulatory enforcement actions arising from a failure to adequately deal with conflicts of interest, and the reputational harm suffered as a consequence, could have a material adverse effect on our business.

12
Damage to our reputation could harm our business.
Maintaining our reputation is critical to attracting and maintaining clients, customers, investors, and employees. If we fail to deal with, or appear to fail to deal with, issues that may give rise to reputational risk, such failure or appearance of failure could have a material adverse effect on our business and stock price. These issues include, but are not limited to, appropriately dealing with potential conflicts of interest, legal and regulatory requirements, ethical issues, money laundering, cybersecurity, and the proper identification of the strategic, market, human capital, liquidity, credit, operational, legal and regulatory risks inherent in our business and products.
Asset management revenue may vary based on investment performance and market and economic factors.
The success of our asset management business is largely dependent on the level of assets under management, as revenues are primarily derived from management fees paid on the assets under management. Our ability to maintain or increase assets under management is subject to a number of factors, including investors' perception of our past performance, market or economic conditions, competition from other fund managers and our ability to negotiate terms with major investors. Investment performance is one of the most important factors in retaining existing clients and competing for new asset management business. Even when market conditions are generally favorable, our investment performance may be adversely affected by our investment style and the particular investments that we make, and to the extent our investment performance is perceived to be poor in either relative or absolute terms, our asset management revenues will likely be reduced, existing clients may withdraw funds in favor of better performing products or a different investment style or focus, our ability to attract new funds could be impaired, and our key employees in the business may depart, whether to join a competitor or otherwise. For example, certain of our investment strategies have experienced investment performance below comparable benchmarks for an extended period of time, which we believe has previously contributed to net asset outflows and could negatively impact our future results of operations.
A significant portion of our asset management revenues are derived from management fees that we earn on assets invested by institutions and individuals focused on MLPs and other investments related to the energy infrastructure sector. Return on investment in the energy infrastructure sector is dependent to a meaningful degree on the prices of energy commodities such as natural gas, natural gas liquids, crude oil, refined petroleum products or coal. Persistently depressed prices for any of these products will likely lead to a deterioration of market conditions for companies in the energy infrastructure sector and poorer returns in this sector, and, consequently, a reduction in the management and performance fees we receive.
We also earn asset management revenues from actively managed equity strategies, and this type of investment product has experienced asset outflows in recent years in favor of passively managed equity strategies, which offer lower management fees than actively managed strategies. To the extent that the trend in investors moving assets to passive strategies continues and passively managed strategies continue to gain market share at the expense of actively managed strategies, it is possible that we may continue to experience asset outflows, find it increasingly difficult to attract new assets under management, or be unable to maintain our current fee structures given price competition, any of which could negatively impact our results of operations.
Human Capital Risk
Our business is a human capital business, and, therefore, our future financial condition and results of operations are significantly dependent upon our employees and their actions. Our success depends on the skills, expertise, and performance of our employees. Human capital risks represent the risks posed if we fail to attract and retain qualified individuals who are motivated to serve the best interests of our clients, thereby serving the best interests of our company, as well as the risks posed if our culture fails to encourage such behavior. Human capital risk is also present where we fail to detect and prevent employees from acting contrary to our policies and procedures, including when these failures might lead to reputational damage for our firm. The following are those human capital risk factors that we have identified as posing the most significant risks to us.
Our ability to attract, develop and retain highly skilled and productive employees, develop the next generation of our business leadership, and instill and maintain a culture of ethics is critical to the success of our business.
Historically, the market for qualified employees within the financial services industry has been marked by intense competition, and the performance of our business may suffer to the extent we are unable to attract, retain, and develop productive employees, given the relatively small size of our company and our employee base compared to some of our competitors and the geographic locations in which we operate. The primary sources of revenue in each of our business lines are commissions

13
and fees earned on advisory and underwriting transactions and customer accounts managed by our employees, who have historically been recruited by other firms and in certain cases are able to take their client relationships with them when they change firms. Some specialized areas of our business are operated by a relatively small number of employees, the loss of any of whom could jeopardize the continuation of that business following the employee's departure, which could adversely affect our results of operations.
Further, recruiting and retention success often depends on the ability to deliver competitive compensation, and we may be at a disadvantage to some competitors given our size and financial resources. Our inability or unwillingness to meet compensation needs or demands may result in the loss of some of our professionals or the inability to recruit additional professionals at compensation levels that are within our target range for compensation and benefits expense. Our ability to retain and recruit also may be hindered if we limit our aggregate annual compensation and benefits expense as a percentage of annual net revenues.
A vibrant and ethical corporate culture is critical to ensuring that our employees put our clients' interests first and are able to identify and manage potential conflicts of interest, while also creating an environment in which each of our employees feel empowered to develop and pursue their full potential. Our expectations for our corporate culture and ethics are instilled and maintained by the "tone at the top" set by our management and board of directors. Lapses in our corporate culture could lead to reputational damage or employee loss, either of which could adversely affect our results of operations.
Our business success depends in large part on the strategic decisions made by our leadership team, and the business plans developed and implemented by our senior business leaders. Our ability to identify, develop, and retain future senior business leaders, and our ability to develop and implement successful succession plans for our leadership team and other senior business leaders, is critical to our future success and results of operations.
Our inability to effectively integrate and retain personnel in connection with our acquisitions may adversely affect our financial condition and results of operations.
We invest time and resources in carefully assessing opportunities for acquisitions, and we have made acquisitions in the past several years to broaden the scope and depth of our human capital in various businesses. Despite diligence and integration planning, acquisitions still present certain risks, including the difficulties in integrating and bringing together different work cultures and employees, and retaining those employees for the period of time necessary to realize the anticipated benefits of the acquisition. Difficulties in integrating our acquisitions, including attracting and retaining talent to realize the expected benefits of these acquisitions, may adversely affect our financial condition and results of operations.
Liquidity and Credit Risk
Two of our principal categories of risk as a broker dealer and asset management firm are liquidity and credit risk, each of which can have a material impact on our results of operations and viability as a business. We believe that the effective management of liquidity and credit is fundamental to the financial health of the Company. With respect to liquidity risk, it impacts our ability to timely access necessary funding sources in order to operate our business and our ability to timely divest securities that we hold in connection with our market-making, sales and trading, and proprietary trading activities. Credit risk, as distinguished from liquidity risk, is the potential for loss due to the default or deterioration in credit quality of a counterparty, customer, client, borrower, or issuer of securities we hold in our trading inventory. The nature and amount of credit risk depends on the type of transaction, the structure and duration of that transaction and the parties involved. The following are the liquidity and credit risk factors that we have identified as posing the most significant risks to us.
An inability to access capital readily or on terms favorable to us could impair our ability to fund operations and could jeopardize our financial condition and results of operations.
Liquidity, or ready access to funds, is essential to our business. Several large financial institutions failed or merged with others during the credit crisis following significant declines in asset values in securities held by these institutions, with Lehman Brothers being the most prominent example. To fund our business, we rely on financing provided by Pershing LLC ("Pershing") under our fully disclosed clearing agreement, as well as bank financing, commercial paper, and other funding sources. The financing provided by Pershing is at Pershing's discretion and could be denied without prior notice. Our bank financing includes an uncommitted credit line, which could become unavailable to us on relatively short notice. In an effort to mitigate our funding risks, we renewed a $175 million committed credit facility in December 2018 for an additional twelve months.

14
Our access to funding sources, particularly uncommitted funding sources, is dependent on factors we cannot control, such as economic downturns, the disruption of financial markets, the failure or consolidation of other financial institutions, negative news about the financial industry generally or us specifically. We could experience disruptions with our credit facilities in the future, including the loss of liquidity sources and/or increased borrowing costs, if lenders or investors develop a negative perception of our short- or long-term financial prospects, which could result from decreased business activity. Our liquidity also could be impacted by the activities resulting in concentration of risk, including proprietary activities from long-term investments and/or investments in specific markets or products without liquidity. Our access to funds also may be impaired if regulatory authorities take significant action against us, or if we discover that one of our employees has engaged in serious unauthorized or illegal activity.
In the future, we may need to incur debt or issue equity in order to fund our working capital requirements, as well as to execute our growth initiatives that may include acquisitions and other investments. Similarly, our access to funding sources may be contingent upon terms and conditions that may limit or restrict our business activities and growth initiatives. In addition, we currently do not have a credit rating, which could adversely affect our liquidity and competitive position by increasing our borrowing costs and limiting access to sources of liquidity that require a credit rating as a condition to providing funds.
If we are unable to obtain necessary funding, or if the funding we obtain is on terms and conditions unfavorable to us, it could negatively affect our business activities and operations, and our ability to pursue certain growth initiatives and make certain capital decisions, including the decision whether to pay future dividends to our shareholders, as well as our future financial condition or results of operations.
Concentration of risk increases the potential for significant losses.
Concentration of risk increases the potential for significant losses in our sales and trading, proprietary trading, alternative asset management, merchant banking, credit underwriting and syndication platform, and underwriting businesses. We have committed capital to these businesses, and we may take substantial positions in particular types of securities and/or issuers. This concentration of risk may cause us to suffer losses even when economic and market conditions are generally favorable for our competitors. Further, disruptions in the credit markets can make it difficult to hedge exposures effectively and economically.
Our businesses, profitability and liquidity may be adversely affected by deterioration in the credit quality of, or defaults by, third parties who owe us money, securities or other assets.
The nature of our businesses exposes us to credit risk, or the risk that third parties who owe us money, securities or other assets will not perform their obligations. These parties may default on their obligations to us due to bankruptcy, lack of liquidity, operational failure or other reasons. Deterioration in the credit quality of securities or obligations we hold could result in losses and adversely affect our ability to rehypothecate or otherwise use those securities or obligations for liquidity purposes. A significant downgrade in the credit ratings of our counterparties could also have a negative impact on our results. Default rates, downgrades and disputes with counterparties as to the valuation of collateral tend to increase in times of market stress and illiquidity. Although we review credit exposures to specific clients and counterparties and to specific industries that we believe may present credit concerns, default risk may arise from events or circumstances that are difficult to detect or foresee. Also, concerns about, or a default by, one institution generally leads to losses, significant liquidity problems, or defaults by other institutions, which in turn could adversely affect our business.
Particular activities or products within our business expose us to increased credit risk, including inventory positions, interest rate swap contracts with customer credit exposure, counterparty risk with one major financial institution related to customer interest rate swap contracts without customer credit exposure, investment banking and advisory fee receivables, liquidity providers on variable rate demand notes we remarket, and similar activities. With respect to interest rate swap contracts with customer credit exposure, we have retained the credit exposure with five non-publicly rated counterparties totaling $15.9 millionat December 31, 2018 as part of our matched-book interest rate swap program. In the event of a termination of the contract, the counterparty would owe us the applicable amount of the credit exposure. If our counterparty is unable to make its payment to us, we would still be obligated to pay our hedging counterparty, resulting in credit losses. Non-performance by our counterparties, clients and others, including with respect to our inventory positions and interest rate swap contracts with customer credit exposures, could result in losses, potentially material, and thus have a significant adverse effect on our business and results of operations.

15
In addition, reliance on revenues from hedge funds and hedge fund advisors, which are less regulated than many investment company and investment advisor clients, may expose us to greater risk of financial loss from unsettled trades than is the case with other types of institutional investors. Concentration of risk may result in losses to us even when economic and market conditions are generally favorable for others in our industry.
An inability to readily divest trading positions may result in financial losses to our business.
Timely divestiture of our trading positions, including equity, fixed income and other securities positions, can be impaired by decreased trading volume, increased price volatility, rapid changes in interest rates, concentrated trading positions, limitations on the ability to divest positions in highly specialized or structured transactions and changes in industry and government regulations. This is true both for customer transactions that we facilitate as well as proprietary trading positions that we maintain. While we hold a security, we are vulnerable to valuation fluctuations and may experience financial losses to the extent the value of the security decreases and we are unable to timely divest or hedge our trading position in that security. The value may decline as a result of many factors, including issuer-specific, market or geopolitical events. In addition, in times of market uncertainty, the inability to divest inventory positions may have an impact on our liquidity as funding sources generally become more restrictive, which could limit our ability to pledge the underlying security as collateral. Our liquidity may also be impacted if we choose to facilitate liquidity for specific products and voluntarily increase our inventory positions in order to do so, exposing ourselves to greater market risk and potential financial losses from the reduction in value of illiquid positions.
Our underwriting, proprietary trading, and principal investments expose us to risk of loss.
We engage in a variety of activities in which we commit or invest our own capital, including underwriting, lending, proprietary trading, and principal investing. In our role as underwriter for equity and fixed income securities, we commit to purchase securities from the issuer or one or more holders of the issuer's securities, and then sell those securities to other investors or into the public markets, as applicable. Our underwriting activities, including bought deal transactions and equity block trading activities, expose us to the risk of loss if the price of the security falls below the price we purchased the security before we are able to sell all of the securities that we purchased. For example, as an underwriter, or, with respect to equity securities, a block positioner, we may commit to purchasing securities from an issuer or one or more holders of the issuer's securities without having found purchasers for some or all of the securities. In those instances, we may find that we are unable to sell the securities at a price equal to or above the price at which we purchased the securities, or with respect to certain securities, at a price sufficient to cover our hedges.
We engage in principal investing, having established alternative asset management funds for merchant banking (focused on investments in the equity and debt instruments of private companies), senior living construction projects, and joint venture entities that underwrite and syndicate client debt. We have invested firm capital in these funds alongside capital raised from outside investors, and our investments comprise a majority of our Level III assets. Level III assets have little or no pricing observability, and may be less liquid than other securities that we hold in our securities inventory. Additionally, we make principal investments in funds managed by ARI, our asset management subsidiary, which are generally invested in publicly traded equities.
Our results from these activities may vary from quarter to quarter. We may incur significant losses from our underwriting, proprietary trading, and principal investments due to equity or fixed income market fluctuations and volatility from quarter to quarter, or from a deterioration in specific business subsectors or the economy more generally. In addition, we may engage in hedging transactions that, if not successful, could result in losses; and the hedges we purchase to counterbalance market rate changes in certain inventory positions are not perfectly matched to the positions being hedged, which could result in losses. With respect to principal investing, there often is not an established liquid trading market for these investments or our investments may be otherwise subject to restrictions on sale or hedging, and our ability to withdraw our capital from these investments may be limited, increasing our risk of losses. Also, our merchant banking activity involves investments in late stage private companies, and we may be unable to realize our investment objectives by sale or other disposition at attractive prices. Our joint venture entities that underwrite and syndicate client debt hold a portion of such debt after syndication, and our invested capital is exposed to a risk of loss to the extent that the debt is ultimately not repaid.
Use of derivative instruments as part of our financial risk management techniques may not effectively hedge the risks associated with activities in certain of our businesses.
We use interest rate swaps, interest rate locks, credit default swap index contracts, U.S. Treasury bond futures, and equity option contracts as a means to manage risk in certain inventory positions and to facilitate customer transactions. With respect to risk management, we enter into derivative contracts to hedge interest rate and market value risks associated with our security

16
positions, including fixed income inventory positions we hold both for facilitating client activity as well as for our own proprietary trading operations. The instruments use interest rates based upon the Municipal Market Data ("MMD"), LIBOR or SIFMA index. We also enter into credit default swap index contracts to hedge risks associated with our taxable fixed income securities, and option contracts to hedge market value risk associated with convertible securities. Generally, we do not hedge all of our interest rate risk. In addition, these hedging strategies may not work in all market environments and as a result may not be effective in mitigating interest rate and market value risk, especially when market volatility reduces the correlation between a hedging vehicle and the securities inventory being hedged.
There are risks inherent in our use of these products, including counterparty exposure and basis risk. Counterparty exposure refers to the risk that the amount of collateral in our possession on any given day may not be sufficient to fully cover the current value of the swaps if a counterparty were to suddenly default. Basis risk refers to risks associated with swaps where changes in the value of the swaps may not exactly mirror changes in the value of the cash flows they are hedging. We may incur losses from our exposure to derivative interest rate products and the increased use of these products in the future.
The use of estimates and valuations in measuring fair value involve significant estimation and judgment by management.
We make various estimates that affect reported amounts and disclosures. Broadly, those estimates are used in measuring fair value of certain financial instruments, investments in private companies, accounting for goodwill and intangible assets, establishing provisions for potential losses that may arise from litigation, and regulatory proceedings and tax examinations. Estimates are based on available information and judgment. Therefore, actual results could differ from our estimates and that difference could have a material effect on our consolidated financial statements. With respect to accounting for goodwill, we complete our annual goodwill and intangible asset impairment testing in the fourth quarter of each year or earlier if impairment indicators are present. Impairment charges resulting from this valuation analysis could materially adversely affect our results of operations.
Financial instruments and other inventory positions owned, and financial instruments and other inventory positions sold but not yet purchased, are recorded at fair value, and unrealized gains and losses related to these financial instruments are reflected on our consolidated statements of operations. The fair value of a financial instrument is the amount at which the instrument could be exchanged in a transaction between market participants at the measurement date. Where available, fair value is based on observable market prices or parameters or derived from such prices or parameters. Where observable prices or inputs are not available, valuation models are applied. These valuation techniques involve management estimation and judgment, the degree of which is dependent on the price transparency for the instruments or market and the instruments' complexity. Difficult market environments may cause financial instruments to become substantially more illiquid and difficult to value, increasing the use of valuation models. Our future results of operations and financial condition may be adversely affected by the valuation adjustments that we apply to these financial instruments.
Investments in private companies are valued based on an assessment of each underlying security, considering rounds of financing, third party transactions and market-based information, including comparable company transactions, trading multiples (e.g., multiples of revenue and earnings before interest, taxes, depreciation, and amortization ("EBITDA")) and changes in market outlook, among other factors. These valuation techniques require significant management estimation and judgment.
Operational Risk
Operational risk is the risk of loss, or damage to our reputation, resulting from inadequate or failed processes, people and systems or from external events. Such loss or reputational damage could negatively impact our future financial condition and results of operations. The following are those operational risk factors that we have identified as posing the most significant risks to us.
Our information and technology systems, including outsourced systems, are critical components of our operations, and failure of those systems or other aspects of our operations infrastructure may disrupt our business, cause financial loss and constrain our growth.
We typically transact thousands of securities trades on a daily basis across multiple markets. Our data and transaction processing, financial, accounting and other technology and operating systems are essential to this task. A system malfunction (due to hardware failure, capacity overload, security incident, data corruption, etc.) or mistake made relating to the processing

17
of transactions could result in financial loss, liability to clients, regulatory intervention, reputational damage and constraints on our ability to grow.
In 2017, we made the strategic decision to move to a fully disclosed model for all of our previously self clearing broker dealer operations. In a fully disclosed model, we act as an introducing broker for most customer transactions and rely on a clearing broker dealer to handle clearance and settlement of our customers' securities transactions. Upon converting to a fully disclosed clearing model, the clearing services provided by the clearing broker dealer, Pershing, are critical to our business operations, and similar to other important outsourced operations, any failure by the clearing agent with respect to the services we rely on it to provide could significantly disrupt and negatively impact our operations and financial results. We also contract with third parties for market data services, which constantly broadcast news, quotes, analytics and other relevant information to our employees, as well as other critical data processing activities. In the event that any of these service providers fails to adequately perform such services or the relationship between that service provider and us is terminated, we may experience a significant disruption in our operations, including our ability to timely and accurately process transactions or maintain complete and accurate records of those transactions.
Adapting or developing our technology systems to meet new regulatory requirements, client needs, geographic expansion and industry demands also is critical for our business. Introduction of new technologies present new challenges on a regular basis. We have an ongoing need to upgrade and improve our various technology systems, including our data and transaction processing, financial, accounting, risk management, compliance, and trading systems. This need could present operational issues or require significant capital spending. It also may require us to make additional investments in technology systems and may require us to reevaluate the current value and/or expected useful lives of our technology systems, which could negatively impact our results of operations.
A disruption in the infrastructure that supports our business due to fire, natural disaster, health emergency (e.g., a disease pandemic), power or communication failure, act of terrorism or war may affect our ability to service and interact with our clients. If we are not able to implement contingency plans effectively, any such disruption could harm our results of operations.
Protection of our sensitive and confidential information is critical to our operations, and failure of those systems may disrupt our business, damage our reputation, and cause financial losses.
Our clients routinely provide us with sensitive and confidential information. Secure processing, storage and transmission of confidential and other information in our internal and outsourced computer systems and networks is critically important to our business. We take protective measures and endeavor to modify them as circumstances warrant. However, our computer systems, software and networks, and those of our clients, vendors, service providers, counterparties and other third parties, may be vulnerable to unauthorized access, cyberattacks, security breaches, computer viruses or other malicious code, inadvertent, erroneous or intercepted transmission of information (including by e-mail), human error, and other events that could have an information security impact. We work with our employees, clients, vendors, service providers, counterparties and other third parties to develop and implement measures designed to protect against such an event, but we may not be able to fully protect against such an event, and do not have, and may be unable to put in place, secure capabilities with all of these third parties and we may not be able to ensure that these third parties have appropriate controls in place to protect the confidentiality of the information. If one or more of such events occur, this potentially could jeopardize our or our clients' or counterparties' confidential and other information processed and stored in, and transmitted through, our computer systems and networks, or those of third parties, or otherwise cause interruptions or malfunctions in our, our clients', our counterparties' or third parties' operations. We may be required to expend significant additional resources to modify our protective measures or to investigate and remediate vulnerabilities or other exposures, and we may be subject to reputational harm as well as litigation, regulatory penalties, and financial losses that are either not insured against or not fully covered through any insurance maintained by us.
A failure to protect our computer systems, networks and information, and our clients' information, against cyber attacks, data breaches, and similar threats could impair our ability to conduct our businesses, result in the disclosure, theft or destruction of confidential information, damage our reputation and cause significant financial and legal exposure.
Our operations rely on the secure processing, storage and transmission of confidential and other information in our computer systems and networks. There have been several highly publicized cases involving financial services companies, consumer-based companies and other companies, as well as governmental and political organizations, reporting breaches in the security of their websites, networks or other systems. We have not been immune from such events. Some of the publicized breaches have involved sophisticated and targeted attacks intended to obtain unauthorized access to confidential information, destroy data, disrupt or

18
degrade service, sabotage systems or cause other damage, including through the introduction of computer viruses or malware, cyberattacks and other means. There have also been several highly publicized cases where hackers have requested "ransom" payments in exchange for not disclosing customer information.
A successful penetration or circumvention of the security of our systems could cause serious negative consequences for us, including significant disruption of our operations and those of our clients, customers and counterparties; misappropriation of our confidential information or that of our clients, customers, counterparties or employees; or damage to our computers or systems and those of our clients, customers and counterparties; and could result in violations of applicable privacy and other laws, financial loss to us or to our customers, loss of confidence in our security measures, customer dissatisfaction, significant litigation exposure and reputational harm, all of which could have a material adverse effect on us.
We must continuously monitor and develop our systems to protect our technology infrastructure and data from misappropriation or corruption. Despite our efforts to ensure the integrity of our systems and information, we have not been and may not be able to anticipate, detect or implement effective preventive measures against all cyber threats, especially because the techniques used are increasingly sophisticated, change frequently, and are often not recognized until months after the attack. Cyber attacks can originate from a variety of sources, including third parties who are affiliated with foreign governments or employees acting negligently or in a manner adverse to our interests. Third parties may seek to gain access to our systems either directly or using equipment or security passwords belonging to employees, customers, third party service providers or other users of our systems. In addition, due to our interconnectivity with third party vendors, central agents, exchanges, clearing houses and other financial institutions, we could be adversely impacted if any of them is subject to a successful cyber attack or other information security event.
Although we take protective measures and endeavor to modify them as circumstances warrant, our computer systems, software and networks have been and may be vulnerable to unauthorized access, misuse, computer viruses or other malicious code and other events that could have a security impact. We may be required to expend significant additional resources to modify our protective measures or to investigate and remediate vulnerabilities, exposures, or information security events. Due to the complexity and interconnectedness of our systems, the process of enhancing our protective measures can itself create a risk of systems disruptions and security issues.
The increased use of cloud technologies can heighten these and other operational risks. Certain aspects of the security of such technologies are unpredictable or beyond our control, and this lack of transparency may inhibit our ability to discover a failure by cloud service providers to adequately safeguard their systems and prevent cyber attacks that could disrupt our operations and result in misappropriation, corruption or loss of confidential and other information. In addition, there is a risk that encryption and other protective measures, despite their sophistication, may be defeated, particularly to the extent that new computing technologies vastly increase the speed and computing power available.
Risk management processes may not fully mitigate exposure to the various risks that we face.
We refine our risk management techniques, strategies and assessment methods on an ongoing basis. However, risk management techniques and strategies, both ours and those available to the market generally, may not be fully effective in identifying and mitigating our risk exposure in all economic market environments or against all types of risk. For example, we may fail to identify or anticipate particular risks that our systems are capable of identifying, or the systems that we use, and that are used within the industry generally, may not be capable of identifying certain risk, or every economic and financial outcome, or the specifics and timing of such outcomes. In addition, our risk management techniques and strategies seek to balance our ability to profit from our market-making and investing positions with our exposure to potential losses. Some of our strategies for managing risk are based upon our use of observed historical market behavior. We apply statistical and other tools to these observations to quantify our risk exposure. Any failures in our risk management techniques and strategies to accurately quantify our risk exposure could limit our ability to manage risks. In addition, any risk management failures could cause our losses to be significantly greater than the historical measures indicate. Further, our quantified modeling does not take all risks into account. Our more qualitative approach to managing those risks could prove insufficient, exposing us to material unanticipated losses.
The financial services industry and the markets in which we operate are subject to systemic risk that could adversely affect our business and results.
Participants in the financial services industry and markets increasingly are closely interrelated as a result of credit, trading, clearing, technology and other relationships between them. A significant adverse development with one participant (such as a

19
bankruptcy or default) may spread to others and lead to significant concentrated or market-wide problems (such as defaults, liquidity problems or losses) for other industry participants, including us. Further, the control and risk management infrastructure of the markets in which we operate often is outpaced by financial innovation and growth in new types of securities, transactions and markets. Systemic risk is inherently difficult to assess and quantify, and its form and magnitude can remain unknown for significant periods of time.
Failure to maintain effective internal controls in accordance with Section 404 of the Sarbanes-Oxley Act could materially affect our business.
We have documented and tested our internal control procedures in order to satisfy the requirements of Section 404 of the Sarbanes-Oxley Act of 2002 (the "Sarbanes-Oxley Act"), which requires annual management assessments of the effectiveness of our internal controls over financial reporting and a report by our independent auditors regarding our internal control over financial reporting. We are in compliance with Section 404 of the Sarbanes-Oxley Act as of December 31, 2018. However, if we fail to maintain the adequacy of our internal controls, as such standards are modified, supplemented or amended from time to time, we may not be able to ensure that we can conclude on an ongoing basis that we have effective internal controls over financial reporting in accordance with Section 404 of the Sarbanes-Oxley Act. Failure to maintain an effective internal control environment could materially adversely affect our business. Legal and Regulatory Risk
Legal and regulatory risk includes the risk of non-compliance with applicable legal and regulatory requirements and the loss to our reputation we may suffer as a result of failure to comply with laws, regulations, rules, related self-regulatory organization standards and codes of conduct applicable to our business activities. It also includes the risk that legislation could reduce or eliminate certain business activities that we are currently engaged in, which could negatively impact our future financial condition or results of operation. The following are those legal and regulatory risk factors that we have identified as posing the most significant risks to us.
Our industry is exposed to significant legal liability, which could lead to substantial damages.
We face significant legal risks in our businesses. These risks include potential liability under securities laws and regulations in connection with our capital markets, asset management and other businesses. The volume and amount of damages claimed in litigation, arbitrations, regulatory enforcement actions and other adversarial proceedings against financial services firms has historically been intense. Our experience has been that adversarial proceedings against financial services firms typically increase during and following a market downturn. We also are subject to claims from disputes with our employees and our former employees under various circumstances. Risks associated with legal liability often are difficult to assess or quantify and their existence and magnitude can remain unknown for significant periods of time, making the amount of legal reserves related to these legal liabilities difficult to determine and subject to future revision. Legal or regulatory matters involving our directors, officers or employees in their individual capacities also may create exposure for us because we may be obligated or may choose to indemnify the affected individuals against liabilities and expenses they incur in connection with such matters to the extent permitted under applicable law. In addition, like other financial services companies, we may face the possibility of employee fraud or misconduct. The precautions we take to prevent and detect this activity may not be effective in all cases and there can be no assurance that we will be able to deter or prevent fraud or misconduct. Exposures from and expenses incurred related to any of the foregoing actions or proceedings could have a negative impact on our results of operations and financial condition. In addition, future results of operations could be adversely affected if reserves relating to these legal liabilities are required to be increased or legal proceedings are resolved in excess of established reserves.
Our business is subject to extensive regulation in the jurisdictions in which we operate, and a significant regulatory action against our company may have a material adverse financial effect on, cause significant reputational harm to, or result in other collateral consequences for our company.
As a participant in the financial services industry, we are subject to complex and extensive regulation of many aspects of our business by U.S. federal and state regulatory agencies, self-regulatory organizations (including securities exchanges) and by foreign governmental agencies, regulatory bodies and securities exchanges. Specifically, our operating subsidiaries include broker dealer and related securities entities organized in the United States, the United Kingdom, and Hong Kong. Each of these entities is registered or licensed with the applicable local regulator and is subject to all of the applicable rules and regulations promulgated by those authorities. In addition, our asset management subsidiaries, ARI, PJIM, and PJC Capital Partners LLC,

20
as well as Piper Jaffray & Co., are registered as investment advisors with the SEC and subject to the regulation and oversight by the SEC, and we have an additional asset management subsidiary subject to regulation in Guernsey.
Generally, the requirements imposed by our regulators are designed to ensure the integrity of the financial markets and to protect customers and other third parties who deal with us. These requirements are not designed to protect our shareholders. Consequently, broker dealer regulations often serve to limit our activities, through net capital, customer protection and market conduct requirements and restrictions on the businesses in which we may operate or invest. We also must comply with asset management regulations, including requirements related to fiduciary duties to clients, record-keeping and reporting and customer disclosures. Compliance with many of these regulations entails a number of risks, particularly in areas where applicable regulations may be newer or unclear. In addition, regulatory authorities in all jurisdictions in which we conduct business may intervene in our business and we and our employees could be fined or otherwise disciplined for violations or prohibited from engaging in some of our business activities.
Our business also subjects us to the complex income and payroll tax laws of the national and local jurisdictions in which we have business operations, and these tax laws may be subject to different interpretations by the taxpayer and the relevant governmental taxing authorities. We must make judgments and interpretations about the application of these inherently complex tax laws when determining the provision for income and other taxes. We are subject to contingent tax risk that could adversely affect our results of operations, to the extent that our interpretations of tax laws are disputed upon examination or audit, and are settled in amounts in excess of established reserves for such contingencies.
The effort to combat money laundering also has become a high priority in governmental policy with respect to financial institutions. The obligation of financial institutions, including ourselves, to identify their customers, watch for and report suspicious transactions, respond to requests for information by regulatory authorities and law enforcement agencies, and share information with other financial institutions, has required the implementation and maintenance of internal practices, procedures and controls which have increased, and may continue to increase, our costs. Any failure with respect to our programs in this area could subject us to serious regulatory consequences, including substantial fines, and potentially other liabilities. In addition, our international operations require compliance with anti-bribery laws, including the Foreign Corrupt Practices Act and the U.K. Bribery Act 2010. These laws generally prohibit companies and their intermediaries from engaging in bribery or making other improper payments to foreign officials for the purpose of obtaining or retaining business or gaining an unfair business advantage. While our employees and agents are required to comply with these laws, we cannot ensure that our internal control policies and procedures will always protect us from intentional, reckless or negligent acts committed by our employees or agents, which acts could subject our company to fines or other regulatory consequences that could disrupt our operations and negatively impact our results of operations.
Legislative and regulatory proposals could significantly curtail the revenue from certain products that we currently provide or otherwise have a material adverse effect on our results of operations.
Proposed changes in laws or regulations relating to our business could decrease, perhaps significantly, the revenue that we receive from certain products or services that we provide, or otherwise have a material adverse effect on our results of operations. For example, the Tax Cuts and Jobs Act eliminated the tax-exemption for advance refunding bonds, which are bonds issued by local or state governments to refinance outstanding bonds before the original bonds are callable in order to take advantage of lower borrowing costs. To the extent that this elimination of tax-exemption, or any other component of legislation that may be enacted in the future (whether at the local, state, or federal level), reduces the total amount of issuances or other financing activities for which we compete, our results of operations could be adversely affected. The business operations that we conduct outside of the United States subject us to unique risks.
To the extent that we conduct business outside the United States, for example in Asia and Europe, we are subject to risks, including, without limitation, the risk that we will be unable to provide effective operational support to these business activities, the risk of noncompliance with foreign laws and regulations, and the general economic and political conditions in countries where we conduct business, which may differ significantly from those in the United States. In January 2018, new regulations adopted in the European Union required the unbundling of equity trading and research fees, among other requirements, which has impacted the way that our equity institutional business receives fees from our European clients and may have an impact on our U.S. business over time. Also, the effect of Brexit is uncertain and could require us to obtain additional regulatory licenses or impose new restrictions on our ability to conduct business in Europe.

21
Regulatory capital requirements may limit our ability to expand or maintain our present levels of business or impair our ability to meet our financial obligations.
We are subject to the SEC's uniform net capital rule (Rule 15c3-1) and the net capital rule of FINRA, which may limit our ability to make withdrawals of capital from Piper Jaffray & Co., our U.S. broker dealer subsidiary. The uniform net capital rule sets the minimum level of net capital a broker dealer must maintain and also requires that a portion of its assets be relatively liquid. FINRA may prohibit a member firm from expanding its business or paying cash dividends if resulting net capital falls below its requirements. Underwriting commitments require a charge against net capital and, accordingly, our ability to make underwriting commitments may be limited by the requirement that we must at all times be in compliance with the applicable net capital regulations.
As Piper Jaffray Companies is a holding company, it depends on dividends, distributions and other payments from our subsidiaries to fund its obligations. The regulatory restrictions described above may impede access to funds our holding company needs to make payments on any such obligations.
Other Risks to Our Shareholders
We may change our dividend policy at any time and there can be no assurance that we will continue to declare cash dividends.
Beginning in fiscal year 2017, we have paid quarterly and annual cash dividends to our shareholders in order to return between 30 percent and 50 percent of our adjusted net income from each fiscal year to shareholders. Although we expect to pay dividends to our shareholders in accordance with our dividend policy, we have no obligation to pay any dividend, and our dividend policy may change at any time without notice. The declaration and payment of dividends is at the discretion of our board of directors in accordance with applicable law after taking into account various factors, including our financial condition, operating results, current and anticipated cash needs, limitations imposed by our indebtedness, legal requirements and other factors that our board of directors deems relevant. As a result, we may not pay dividends at any rate or at all.
Our stock price may fluctuate as a result of several factors, including but not limited to, changes in our revenues, operating results, and return on equity.
We have experienced, and expect to experience in the future, fluctuations in the market price of our common stock due to factors that relate to the nature of our business, including but not limited to changes in our revenues, operating results, earnings per share, and return on equity. Our business, by its nature, does not produce steady and predictable earnings on a quarterly basis, which may cause fluctuations in our stock price that may be significant. Other factors that have affected, and may further affect, our stock price include changes in or news related to economic, political, or market events or conditions, changes in market conditions in the financial services industry, including developments in regulation affecting our business, a predominantly passive or quantitative shareholder base among the company's top twenty shareholders, failure to meet the expectations of market analysts, changes in recommendations or outlooks by market analysts, and aggressive short selling.
Provisions in our amended and restated certificate of incorporation and amended and restated bylaws and of Delaware law may prevent or delay an acquisition of our company, which could decrease the market value of our common stock.
Our amended and restated certificate of incorporation and amended and restated bylaws and Delaware law contain provisions that are intended to deter abusive takeover tactics by making them unacceptably expensive to the raider and to encourage prospective acquirors to negotiate with our board of directors rather than to attempt a hostile takeover. These provisions include limitations on our shareholders' ability to act by written consent and to call special meetings. Delaware law also imposes some restrictions on mergers and other business combinations between us and any holder of 15 percent or more of our outstanding common stock. We believe these provisions protect our shareholders from coercive or otherwise unfair takeover tactics by requiring potential acquirors to negotiate with our board of directors and by providing our board of directors with more time to assess any acquisition proposal, and are not intended to make our company immune from takeovers. However, these provisions apply even if the offer may be considered beneficial by some shareholders and could delay or prevent an acquisition that our board of directors determines is not in the best interests of our company and our shareholders.

22
ITEM 1B. UNRESOLVED STAFF COMMENTS.
None.
ITEM 2. PROPERTIES.
As of February 20, 2019, we conducted our operations through 51 principal offices in 29 states, and the District of Columbia, and in London, Aberdeen and Hong Kong. All of our offices are leased. Our principal executive office is located at 800 Nicollet Mall, Suite 1000, Minneapolis, Minnesota 55402 and, as of February 20, 2019, comprises approximately 124,000 square feet of space under a lease which expires November 30, 2025, with an early termination option effective January 31, 2022.
ITEM 3. LEGAL PROCEEDINGS.
Due to the nature of our business, we are involved in a variety of legal proceedings. These proceedings include litigation, arbitration and regulatory proceedings, which may arise from, among other things, underwriting or other transactional activity, client account activity, employment matters, regulatory examinations of our businesses and investigations of securities industry practices by governmental agencies and self-regulatory organizations. The securities industry is highly regulated, and the regulatory scrutiny applied to securities firms is intense, resulting in a significant number of regulatory investigations and enforcement actions and uncertainty regarding the likely outcome of these matters.
Litigation-related expenses include amounts we reserve and/or pay out as legal and regulatory settlements, awards or judgments, and fines. Parties who initiate litigation and arbitration proceedings against us may seek substantial or indeterminate damages, and regulatory investigations can result in substantial fines being imposed on us. We reserve for contingencies related to legal proceedings at the time and to the extent we determine the amount to be probable and reasonably estimable. However, it is inherently difficult to predict accurately the timing and outcome of legal proceedings, including the amounts of any settlements, judgments or fines. We assess each proceeding based on its particular facts, our outside advisors' assessment and our past experience with similar matters, and expectations regarding the current legal and regulatory environment and other external developments that might affect the outcome of a particular proceeding or type of proceeding. Subject to the foregoing, we believe, based on our current knowledge, after appropriate consultation with outside legal counsel and taking into account our established reserves, that pending legal actions, investigations and regulatory proceedings, will be resolved with no material adverse effect on our consolidated financial condition, results of operations or cash flows. However, there can be no assurance that our assessments will reflect the ultimate outcome of pending proceedings, and the outcome of any particular matter may be material to our operating results for any particular period, depending, in part, on the operating results for that period and the amount of established reserves. Reasonably possible losses in excess of amounts accrued at December 31, 2018 are not material. We generally have denied, or believe that we have meritorious defenses and will deny, liability in all significant cases currently pending against us, and we intend to vigorously defend such actions.
ITEM 4. MINE SAFETY DISCLOSURES.
Not applicable.
PART II
ITEM 5. MARKET FOR REGISTRANT'S COMMON EQUITY, RELATED SHAREHOLDER MATTERS AND ISSUER PURCHASES OF EQUITY SECURITIES.
Market Information
Our common stock is listed on the New York Stock Exchange under the symbol "PJC."
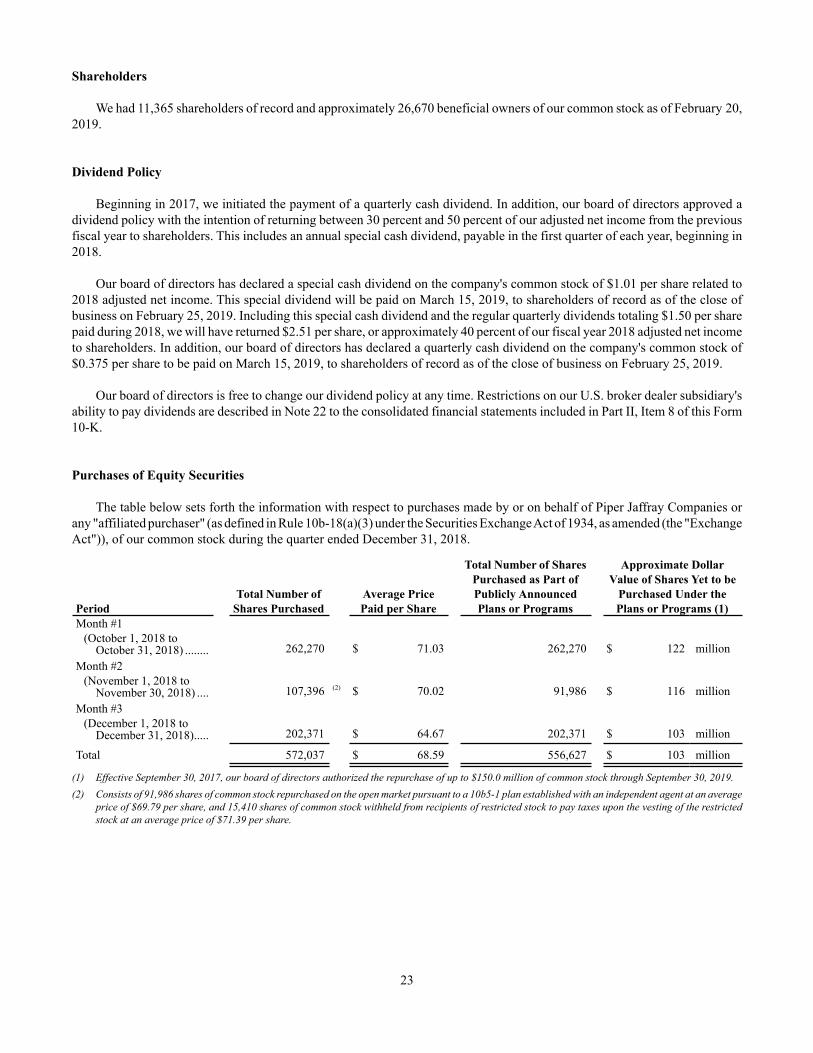
23
Shareholders
We had 11,365 shareholders of record and approximately 26,670 beneficial owners of our common stock as of February 20, 2019.
Dividend Policy
Beginning in 2017, we initiated the payment of a quarterly cash dividend. In addition, our board of directors approved a dividend policy with the intention of returning between 30 percent and 50 percent of our adjusted net income from the previous fiscal year to shareholders. This includes an annual special cash dividend, payable in the first quarter of each year, beginning in 2018.
Our board of directors has declared a special cash dividend on the company's common stock of $1.01 per share related to 2018 adjusted net income. This special dividend will be paid on March 15, 2019, to shareholders of record as of the close of business on February 25, 2019. Including this special cash dividend and the regular quarterly dividends totaling $1.50 per share paid during 2018, we will have returned $2.51 per share, or approximately 40 percent of our fiscal year 2018 adjusted net income to shareholders. In addition, our board of directors has declared a quarterly cash dividend on the company's common stock of $0.375 per share to be paid on March 15, 2019, to shareholders of record as of the close of business on February 25, 2019.
Our board of directors is free to change our dividend policy at any time. Restrictions on our U.S. broker dealer subsidiary's ability to pay dividends are described in Note 22 to the consolidated financial statements included in Part II, Item 8 of this Form 10-K.
Purchases of Equity Securities
The table below sets forth the information with respect to purchases made by or on behalf of Piper Jaffray Companies or any "affiliated purchaser" (as defined in Rule 10b-18(a)(3) under the Securities Exchange Act of 1934, as amended (the "Exchange Act")), of our common stock during the quarter ended December 31, 2018.
Total Number of Shares Approximate DollarPurchased as Part of Value of Shares Yet to be
Total Number of Average Price Publicly Announced Purchased Under thePeriod Shares Purchased Paid per Share Plans or Programs Plans or Programs (1)Month #1
(October 1, 2018 toOctober 31, 2018) ........ 262,270 $ 71.03 262,270 $ 122 million
Month #2(November 1, 2018 to
November 30, 2018) .... 107,396 (2) $ 70.02 91,986 $ 116 millionMonth #3
(December 1, 2018 toDecember 31, 2018)..... 202,371 $ 64.67 202,371 $ 103 million
Total 572,037 $ 68.59 556,627 $ 103 million
(1) Effective September 30, 2017, our board of directors authorized the repurchase of up to $150.0 million of common stock through September 30, 2019.(2) Consists of 91,986 shares of common stock repurchased on the open market pursuant to a 10b5-1 plan established with an independent agent at an average
price of $69.79 per share, and 15,410 shares of common stock withheld from recipients of restricted stock to pay taxes upon the vesting of the restricted stock at an average price of $71.39 per share.

24
Stock Performance Graph
This performance graph shall not be deemed "soliciting material" or to be "filed" with the SEC for purposes of Section 18 of the Exchange Act or otherwise subject to the liabilities under that Section, and shall not be deemed to be incorporated by reference into any filing of the Company under the Securities Act of 1933, as amended, or the Exchange Act.
The following graph compares the performance of an investment in our common stock from December 31, 2013 through December 31, 2018, with the S&P 500 Index and the S&P 500 Diversified Financials Index. The graph assumes $100 was invested on December 31, 2013, in each of our common stock, the S&P 500 Index and the S&P 500 Diversified Financials Index and that all dividends were reinvested on the date of payment without payment of any commissions. The performance shown in the graph represents past performance and should not be considered an indication of future performance.
FIVE YEAR TOTAL RETURN FOR PIPER JAFFRAY COMPANIES COMMON STOCK, THE S&P 500 INDEX AND THE S&P DIVERSIFIED FINANCIALS INDEX
Company/Index 12/31/2013 12/31/2014 12/31/2015 12/31/2016 12/31/2017 12/31/2018Piper Jaffray Companies.................. 100 146.88 102.15 183.31 222.33 176.42S&P 500 Index................................. 100 113.69 115.26 129.05 157.22 150.33S&P 500 Diversified Financials ...... 100 116.56 105.96 127.73 159.53 143.70

25
ITEM 6. SELECTED FINANCIAL DATA.
The following table presents our selected consolidated financial data in accordance with U.S. generally accepted accounting principles for the periods and dates indicated. The information set forth below should be read in conjunction with "Management's Discussion and Analysis of Financial Condition and Results of Operations" and our consolidated financial statements and notes thereto.
For the year ended December 31,(Dollars and shares in thousands, except per share data) 2018 2017 (1) 2016 (1) 2015 (1) 2014 (1)
Revenues:Investment banking .................................................... $ 588,978 $ 633,837 $ 490,340 $ 414,118 $ 369,811Institutional brokerage................................................ 124,517 154,563 161,186 154,889 156,809Asset management...................................................... 49,803 56,835 60,672 75,017 85,062Interest ........................................................................ 32,749 31,954 33,074 41,557 48,716Investment income ..................................................... 4,946 18,002 24,602 10,736 12,813
Total revenues.......................................................... 800,993 895,191 769,874 696,317 673,211Interest expense .......................................................... 16,551 20,268 22,525 23,399 25,073
Net revenues ............................................................ 784,442 874,923 747,349 672,918 648,138Non-interest expenses:
Compensation and benefits ........................................ 512,847 617,635 510,612 421,733 394,510Restructuring and integration costs ............................ 3,770 — 10,206 10,652 —Goodwill impairment ................................................. — 114,363 82,900 — —Other........................................................................... 192,948 172,248 174,505 154,110 143,317
Total non-interest expenses...................................... 709,565 904,246 778,223 586,495 537,827Income/(loss) before income tax expense/(benefit)... 74,877 (29,323) (30,874) 86,423 110,311
Income tax expense/(benefit) ..................................... 19,047 30,229 (17,128) 27,941 35,986Net income/(loss) ......................................................... 55,830 (59,552) (13,746) 58,482 74,325
Net income/(loss) applicable to noncontrollinginterests..................................................................... (1,206) 2,387 8,206 6,407 11,153
Net income/(loss) applicable to Piper JaffrayCompanies ................................................................. $ 57,036 $ (61,939) $ (21,952) $ 52,075 $ 63,172
Net income/(loss) applicable to Piper JaffrayCompanies' common shareholders.......................... $ 49,993 $ (64,875) (2) $ (21,952) (2) $ 48,060 $ 58,141
Earnings/(loss) per common shareBasic ........................................................................... 3.78 (5.07) (1.73) 3.34 3.88Diluted ........................................................................ 3.72 (5.07)
(3)(1.73)
(3)3.34 3.87
Dividends declared per common share ..................... $ 3.12 $ 1.25 $ — $ — $ —Weighted average number of common shares
Basic ........................................................................... 13,234 12,807 12,674 14,368 14,971Diluted ........................................................................ 13,425 12,978
(3)12,779
(3)14,389 15,025
Other dataTotal assets ................................................................. $ 1,345,269 $ 2,024,683 $ 2,125,503 $ 2,138,518 $ 2,623,917Long-term debt ........................................................... $ — $ 125,000 $ 175,000 $ 175,000 $ 125,000Total common shareholders' equity............................ $ 677,444 $ 693,332 $ 759,250 $ 783,659 $ 819,912Total shareholders' equity........................................... $ 730,416 $ 741,235 $ 816,266 $ 832,820 $ 969,460Total employees.......................................................... 1,256 1,266 1,297 1,152 1,026
(1) We adopted new revenue recognition guidance effective as of January 1, 2018 under the modified retrospective method. The new guidance is applied prospectively in our consolidated financial statements from January 1, 2018 and reported financial information for periods prior to the year ended December 31, 2018 have not been revised. For a full description of our revenue recognition accounting policies and adoption of new accounting standards, see Notes 2 and 3 to our consolidated financial statements in this Form 10-K.
(2) No allocation of undistributed income was made due to loss position. See Note 20 to our consolidated financial statements in this Form 10-K.
(3) Earnings per diluted common share is calculated using the basic weighted average number of common shares outstanding for periods in which a loss is incurred.

26
ITEM 7. MANAGEMENT'S DISCUSSION AND ANALYSIS OF FINANCIAL CONDITION AND RESULTS OF OPERATIONS.
The following information should be read in conjunction with the accompanying audited consolidated financial statements and related notes and exhibits included elsewhere in this Form 10-K. Certain statements in this Form 10-K may be considered forward-looking. Statements that are not historical or current facts, including statements about beliefs and expectations, are forward-looking statements. These forward-looking statements include, among other things, statements other than historical information or statements of current condition and may relate to our future plans and objectives and results, and also may include our belief regarding the effect of various legal proceedings, as set forth under "Legal Proceedings" in Part I, Item 3 of this Form 10-K and in our subsequent reports filed with the SEC. Forward-looking statements involve inherent risks and uncertainties, and important factors could cause actual results to differ materially from those anticipated, including those factors discussed below under "External Factors Impacting Our Business" as well as the factors identified under "Risk Factors" in Part I, Item 1A of this Form 10-K, as updated in our subsequent reports filed with the SEC. These reports are available at our Web site at www.piperjaffray.com and at the SEC Web site at www.sec.gov. Forward-looking statements speak only as of the date they are made, and we undertake no obligation to update them in light of new information or future events.
Explanation of Non-GAAP Financial Measures
We have included financial measures that are not prepared in accordance with U.S. generally accepted accounting principles ("GAAP"). These non-GAAP financial measures include adjustments to exclude (1) revenues and expenses related to noncontrolling interests, (2) amortization of intangible assets related to acquisitions, (3) compensation and non-compensation expenses from acquisition-related agreements, (4) acquisition-related restructuring and integration costs, (5) goodwill impairment charges, (6) the impact from remeasuring deferred tax assets resulting from changes to the U.S. federal tax code and (7) the impact of a deferred tax asset valuation allowance. These adjustments affect the following financial measures: net revenues, compensation expenses, non-compensation expenses, income tax expense/(benefit), net income/(loss) applicable to Piper Jaffray Companies, earnings/(loss) per diluted common share, return on average common shareholders' equity, segment net revenues, segment operating expenses, segment pre-tax operating income/(loss) and segment pre-tax operating margin. Management believes that presenting these results and measures on an adjusted basis in conjunction with the corresponding U.S. GAAP measures provides the most meaningful basis for comparison of its operating results across periods, and enhances the overall understanding of our current financial performance by excluding certain items that may not be indicative of our core operating results. The non-GAAP financial measures should be considered in addition to, not as a substitute for, measures of financial performance prepared in accordance with U.S. GAAP.
Executive Overview
Our Business Strategy – We continue to execute on our business strategy to drive shareholder value through revenue growth and profitability. In order to do this, we are focused on increasing revenues through market share gains, continued sector and geographic expansion, new product offerings, and increased alignment between investment banking and institutional brokerage. Revenue growth, combined with enhanced scale and operating discipline, will drive increased margins and enhanced profitability. Over the past few years, solid execution on our strategy has produced a substantial increase in net revenues and remixed the business to higher quality earnings. Additional information on the execution of our business strategy is discussed below.
Overview of Operations – Our operations are engaged in providing investment banking, institutional brokerage, asset management and related financial services to corporations, private equity groups, public entities, non-profit entities and institutional investors in the United States and Europe. We operate through two reportable business segments:
Capital Markets – The Capital Markets segment provides investment banking services and institutional sales, trading and research services. Investment banking services include financial advisory services, management of and participation in underwritings and public finance activities. Revenues are generated through the receipt of advisory and financing fees. Institutional sales, trading and research services focus on the trading of equity and fixed income products with institutions, government and non-profit entities. Revenues are generated through commissions and sales credits earned on equity and fixed income institutional sales activities, net interest revenues on trading securities held in inventory, profits and losses from trading these securities, and research checks as clients pay us for research services and corporate access offerings. Also, we generate revenue through strategic trading and investing activities, which focus on investments in municipal bonds and U.S. government agency securities. In order

27
to invest firm capital and to manage capital from outside investors, we have created alternative asset management funds in merchant banking that involve equity investments in late stage private companies; senior living, which provides financing to U.S. senior living facilities; and energy, whose principal activity is to invest in oil and gas services companies headquartered in Europe. We receive management and performance fees for managing these funds.
We have executed on our business strategy through organic growth as well as acquisitions and investments in the business, which includes new advisory product offerings, expanding our industry sub-sectors and adding enhanced trading capabilities. The following is a summary of these activities.
• As part of our strategy to expand our equity investment banking business into the energy sector and grow our advisorybusiness, on February 26, 2016, we completed the acquisition of Simmons & Company International ("Simmons"). For more information on our acquisition of Simmons, see Note 4 of our consolidated financial statements.
• On February 25, 2019, we entered into a definitive agreement to acquire Weeden & Co., L.P. ("Weeden & Co."). Weeden & Co. is a broker dealer focused on providing institutional clients with premier global trading solutions, specializing in best execution through the use of high-touch and program trading capabilities. The transaction is expected to close in the second quarter of 2019, subject to regulatory approvals and customary closing conditions.
• We completed the formation of Piper Jaffray Finance, a middle-market debt financing platform, funded with $1.0 billion of investment commitments from outside investors and us in related entities which make direct or indirect debt investments in companies. The addition of Piper Jaffray Finance allows us to leverage our investment banking franchise and expands the breadth of debt solutions we can provide to our advisory clients.
• A key element of our strategy has been to hire productive managing directors. During 2018, we grew our equity investment banking managing director headcount by 7 percent and broadened our sub-sectors across our industry groups. In public finance, we continued to grow our market share and expand geographically. In equity institutional brokerage, we expanded our research coverage in biotechnology, further broadening our biopharma platform.
Asset Management – The Asset Management segment, which provides traditional asset management services, manages investments in master limited partnerships ("MLPs") and energy infrastructure securities focused on the energy sector, and manages assets in domestic and global equity markets. Revenues are generated in the form of management and performance fees. Revenues are also generated through investments in the partnerships and funds that we manage.
In 2017, our Asset Management segment experienced declining profitability due to decreases in revenues from reduced assets under management ("AUM") and higher operating expenses from the addition of new investment teams. In the third quarter of 2017, we identified goodwill impairment indicators necessitating a full impairment testing of goodwill. The interim impairment testing related to our Asset Management segment goodwill resulted in a pre-tax non-cash impairment charge of $114.4 million.
In 2016, an extended cycle of investors favoring passive investment vehicles over active management, combined with certain products having investment performance below their benchmarks, reduced management fees for the asset management business and caused a corresponding decline in profitability. Lower average AUM for our MLP strategies, driven by a decline in MLP valuations, also resulted in decreased management fees and profitability. In the fourth quarter of 2016, we conducted our annual goodwill impairment testing, including the goodwill associated with our Asset Management segment, which resulted in a pre-tax non-cash impairment charge of $82.9 million.

28
Financial Highlights
Twelve Months Ended Percent Inc/(Dec)
(Amounts in thousands, except per share data)
Dec. 31, Dec. 31, 20182018 2017 vs. 2017
U.S. GAAPNet revenues ................................................................................ $ 784,442 $ 874,923 (10.3)%Compensation and benefits .......................................................... 512,847 617,635 (17.0)Non-compensation expenses ....................................................... 196,718 286,611 (31.4)Net income/(loss) applicable to Piper Jaffray Companies ........... 57,036 (61,939) N/MEarnings/(loss) per diluted common share ................................... $ 3.72 $ (5.07) N/M
Non-GAAP (1)
Adjusted net revenues .................................................................. $ 780,821 $ 869,604 (10.2)%Adjusted compensation and benefits ........................................... 483,601 562,636 (14.0)Adjusted non-compensation expenses ......................................... 180,748 153,316 17.9Adjusted net income applicable to Piper Jaffray Companies....... 93,661 108,902 (14.0)Adjusted earnings per diluted common share .............................. $ 6.13 $ 7.12 (13.9)
N/M — Not meaningful
For the year ended December 31, 2018
• Net revenues decreased 10.3 percent compared to 2017 as increased equity financing revenues were more than offset by decreased revenues in our other businesses, as well as lower investment income.
• Compensation and benefits expenses were down 17.0 percent compared to the year-ago period due primarily to lower compensation expenses resulting from decreased revenues. We also recorded lower acquisition-related compensation costs, which were driven by a decline in compensation expenses related to a performance award plan implemented in conjunction with our acquisition of Simmons. In 2018, we recorded $8.9 million of compensation expense related to this plan, compared to $27.0 million in 2017. Compensation costs were higher in the prior year due to outperformance of the Simmons business in 2017.
• Non-compensation expenses decreased 31.4 percent compared to 2017, which included a $114.4 million non-cash goodwill impairment charge. Partially offsetting this decrease were $25.1 million of client reimbursed deal-related expenses in the current year stemming from a change in accounting guidance. The new accounting guidance, effective in 2018, requires investment banking client reimbursed deal-related expenses to be presented on a gross basis on the consolidated statements of operations, rather than the previous presentation of netting deal expenses within revenues. This change in presentation of reimbursed deal-related expenses had no impact on pre-tax income. See further discussion on the accounting change related to deal expenses within the "Results of Operations" section below.
• The enactment of the Tax Cuts and Jobs Act, which reduced the federal corporate tax rate from 35 percent to 21 percent, required a remeasurement of our deferred tax assets resulting in a $54.2 million non-cash write-off in the fourth quarter of 2017.
• For the years ended December 31, 2018 and 2017, we recorded a tax benefit of $7.1 million and $9.2 million, respectively, related to stock-based compensation awards vesting at values greater than the grant price. The tax benefit increased earnings per diluted common share by $0.46 and $0.72 in 2018 and 2017, respectively.
• In 2018, our return on average common shareholders' equity was 8.3 percent, compared with a negative 8.1 percent for 2017. On an adjusted basis, we generated a return on average common shareholders' equity of 13.6 percent(2) in 2018, compared with 14.2 percent(2) for 2017.

29
(1) Reconciliation of U.S. GAAP to adjusted non-GAAP financial information
Twelve Months Ended December 31,(Amounts in thousands, except per share data) 2018 2017 Net revenues:
Net revenues – U.S. GAAP basis ............................................................................................................. $ 784,442 $ 874,923Adjustments:
Revenue related to noncontrolling interests ......................................................................................... (3,621) (5,319)Adjusted net revenues .............................................................................................................................. $ 780,821 $ 869,604
Compensation and benefits:Compensation and benefits – U.S. GAAP basis ...................................................................................... $ 512,847 $ 617,635Adjustments:
Compensation from acquisition-related agreements ............................................................................ (29,246) (54,999)Adjusted compensation and benefits ....................................................................................................... $ 483,601 $ 562,636
Non-compensation expenses:Non-compensation expenses – U.S. GAAP basis .................................................................................... $ 196,718 $ 286,611Adjustments:
Non-compensation expenses related to noncontrolling interests ......................................................... (4,827) (2,932)Goodwill impairment............................................................................................................................ — (114,363)Amortization of intangible assets related to acquisitions..................................................................... (10,460) (15,400)Non-compensation expenses from acquisition-related agreements...................................................... (683) (600)
Adjusted non-compensation expenses ..................................................................................................... $ 180,748 $ 153,316
Net income/(loss) applicable to Piper Jaffray Companies:Net income/(loss) applicable to Piper Jaffray Companies – U.S. GAAP basis ...................................... $ 57,036 $ (61,939) Adjustments:
Compensation from acquisition-related agreements ............................................................................ 21,992 35,755Goodwill impairment............................................................................................................................ — 70,791Amortization of intangible assets related to acquisitions..................................................................... 7,868 9,534Non-compensation expenses from acquisition-related agreements...................................................... 514 607Impact of the Tax Cuts and Jobs Act legislation .................................................................................. 952 54,154Impact of deferred tax asset valuation allowance ................................................................................ 5,299 —
Adjusted net income applicable to Piper Jaffray Companies ................................................................. $ 93,661 $ 108,902
Earnings/(loss) per diluted common share: Earnings/(loss) per diluted common share – U.S. GAAP basis ............................................................. $ 3.72 $ (5.07)Adjustment for undistributed loss allocated to participating shares (3) ................................................. — 1.04
3.72 (4.03) Adjustments:
Compensation from acquisition-related agreements ............................................................................ 1.44 2.33Goodwill impairment............................................................................................................................ — 4.62Amortization of intangible assets related to acquisitions..................................................................... 0.52 0.62Non-compensation expenses from acquisition-related agreements...................................................... 0.04 0.04Impact of the Tax Cuts and Jobs Act legislation .................................................................................. 0.06 3.54Impact of deferred tax asset valuation allowance ................................................................................ 0.35 —
Adjusted earnings per diluted common share ........................................................................................ $ 6.13 $ 7.12
(2) Adjusted return on average common shareholders' equity, a non-GAAP measure, is computed by dividing adjusted net income applicable to Piper Jaffray Companies for the last 12 months by average monthly common shareholders' equity. For a detailed explanation of the components of adjusted net income, see "Reconciliation of U.S. GAAP to adjusted non-GAAP financial information" in footnote (1).
(3) Piper Jaffray Companies calculates earnings per common share using the two-class method, which requires the allocation of consolidated adjusted net income between common shareholders and participating security holders, which in the case of Piper Jaffray Companies, represents unvested stock with dividend rights. No allocation of undistributed earnings is made for periods in which a loss is incurred, or for periods in which the special cash dividend exceeds adjusted net income resulting in an undistributed loss.

30
Market Data
The following table provides a summary of relevant market data over the past three years.
2018 2017Year Ended 2018 2017 2016 v2017 v2016S&P 500 (a)............................................................................. 2,507 2,677 2,239 (6.4)% 19.6 %NASDAQ (a) .......................................................................... 6,635 6,950 5,383 (4.5)% 29.1 %Mergers and Acquisitions - Middle Market
(number of transactions in U.S.) (b) ..................................... 2,933 2,727 2,620 7.6 % 4.1 %Public Equity Offerings
(number of transactions in U.S.) (c) (f)................................. 979 961 735 1.9 % 30.7 %Initial Public Offerings
(number of transactions in U.S.) (c) ..................................... 226 182 106 24.2 % 71.7 %Equity Capital Markets Fee Pool - Sub $2 billion
(value of transactions in millions in U.S.) (d) ...................... $ 3,452 $ 3,492 $ 2,120 (1.1)% 64.7 %Municipal Negotiated Issuances
(number of transactions in U.S.) (e) ..................................... 5,828 8,041 8,915 (27.5)% (9.8)%Municipal Negotiated Issuances
(value of transactions in billions in U.S.) (e)........................ $ 263.1 $ 350.4 $ 353.0 (24.9)% (0.7)%Average CBOE Volatility Index (VIX)................................... 17 11 16 54.5 % (31.3)%NYSE Average Daily Number of Shares Traded
(millions of shares) ............................................................... 1,670 1,480 1,781 12.8 % (16.9)%NASDAQ Average Daily Number of Shares Traded
(millions of shares) ............................................................... 1,428 1,179 1,276 21.1 % (7.6)%10-Year Treasuries Average Rate ............................................ 2.91% 2.33% 1.84% 24.9 % 26.6 %3-Month Treasuries Average Rate........................................... 1.97% 0.95% 0.32% 107.4 % 196.9 %Average 10-Year Municipal-Treasury Ratio (g)...................... 0.85 0.89 0.93 (4.5)% (4.3)%
(a) Data provided is at period end.(b) Source: Thomson Reuters (transactions with reported deal value between $100 million and $1 billion and transactions with an undisclosed deal value that
had a financial advisor).(c) Source: Dealogic (offerings with reported market value greater than $20 million).(d) Source: Dealogic, PlacementTracker, public filings with the SEC and Piper Jaffray Equity Capital Markets (includes IPO, follow-on offerings and convertible
offerings with deal values greater than $10 million and PIPEs/RDs greater than $5 million for issuers with post-deal market caps greater than $2 billion).(e) Source: Thomson Reuters.(f) Number of transactions includes convertible offerings.(g) Calculated based on the 10-year Municipal Market Data (MMD) index rate divided by the 10-year treasury rate.
External Factors Impacting Our Business
Performance in the financial services industry in which we operate is highly correlated to the overall strength of economic conditions and financial market activity. Overall market conditions are a product of many factors, which are beyond our control, often unpredictable and at times inherently volatile. These factors may affect the financial decisions made by investors, including their level of participation in the financial markets. In turn, these decisions may affect our business results. With respect to financial market activity, our profitability is sensitive to a variety of factors, including the demand for investment banking services as reflected by the number and size of advisory transactions and equity and debt financings, the relative level of volatility of the equity and fixed income markets, changes in interest rates and credit spreads (especially rapid and extreme changes), overall market liquidity, the level and shape of various yield curves, the volume and value of trading in securities (although becoming less so for equity securities due to the unbundling of research services from trade execution), overall equity valuations, and the demand for active asset management services.

31
Factors that differentiate our business within the financial services industry also may affect our financial results. For example, our capital markets business focuses on specific industry sectors while serving principally middle-market clientele. If the business environment for our focus sectors is impacted adversely, our business and results of operations could reflect these impacts. In addition, our business, with its specific areas of focus and investment, may not track overall market trends. Given the variability of the capital markets and securities businesses, our earnings may fluctuate significantly from period to period, and results for any individual period should not be considered indicative of future results.
Outlook for 2019
We believe that the U.S. economy will continue to grow at a moderate pace in 2019. Benefits spurred by federal tax reform and deregulation, as well as a good labor market and recently falling energy prices, should provide a solid fundamental footing for U.S. economic growth. However, there are geopolitical and macroeconomic risks to this outlook, including U.S. federal government gridlock, uncertainties surrounding trade policy, global economic deceleration, increased recession fears and the unpredictability related to Brexit negotiations. These risks and uncertainties may pose consequences for the global economy and inject periods of heightened volatility into the U.S. equity and debt markets.
U.S. monetary policy will continue to be a critical factor impacting the economy and financial markets. The U.S. Federal Reserve increased short-term interest rates four times in 2018 on the basis of strong economic growth and higher inflation expectations. Long-term interest rates, however, have not moved in step with increases in short-term interest rates resulting in a flattening of the yield curve. The slope of the yield curve could eventually be a constraining factor for future interest rate increases. The U.S. Federal Reserve has stated that it is not on a preset course to continue raising short-term interest rates in 2019. Rather, the U.S. Federal Reserve will be flexible regarding future rate increases, balancing inflation readings and economic data against the array of risks.
Despite the market volatility at the end of 2018, market conditions generally remain conducive to advisory engagements, driven by CEO confidence, reasonable valuations, a strong U.S. economy and ample financing availability. We expect that our advisory services business will continue to perform well heading into 2019 based on our pipeline of deals and our generally constructive outlook for the U.S. economy. Advisory services revenues for any given quarter are impacted by the timing and size of the deals closing, which can result in fluctuations in revenues period over period. Strong valuations and stable market conditions for most of 2018 created conducive market conditions for equity capital raising; however, volatility and an equity sell-off at the end of the year created disruptions, particularly in the IPO market. In 2019, execution of our pipeline for equity capital raising transactions will be dependent on conducive market conditions, including sector-specific conditions. If we experience sustained bouts of higher volatility or a material market correction, our advisory services and equity capital raising businesses may suffer.
Our equity brokerage business experienced secular changes in 2018 as the manner in which many market participants pay for trade execution and research services began to transition at a time when the overall fee pool is shrinking. Increasingly, market participants are executing trades through low-touch execution providers and paying separately for research services. This dynamic, which we expect to continue in 2019, has resulted in more disparity in our equity institutional brokerage revenues period over period.
Even after recent increases, interest rates remain relatively low by historical standards, and the yield curve has flattened. Also, at the end of 2018, macroeconomic concerns caused yields to move swiftly lower and credit spreads widened. These conditions subdued customer flow activity and trading spreads for our fixed income institutional brokerage business. We believe that many of these challenging market dynamics will continue to persist into 2019. In our public finance business, the higher interest rates and tax law changes have diminished refunding activity. While new money issuance increased in 2018, it did not increase sufficiently to offset the decline in refundings. We expect municipal market issuance levels to increase in 2019 as volumes return to more normalized levels.
Asset management revenues will continue to be affected by valuations and investment performance, as well as broad market trends. Market valuations can be negatively impacted by significant declines and volatility in the financial markets, as experienced with equity market sell-off at the end of 2018. Industry-wide, active management has been depressed during the long bull market, however, we believe clients increasingly see the benefit of active management in more volatile markets. We expect that active asset managers, ourselves included, will remain under pressure to create alpha for their clients and to maintain or grow AUM.

32
Results of Operations
Financial Summary
The following table provides a summary of the results of our operations on a U.S. GAAP basis and the results of our operations as a percentage of net revenues for the periods indicated.
As a Percentage ofNet Revenues for the
Year Ended December 31, Year Ended December 31,2018 2017
(Dollars in thousands) 2018 2017 2016 v2017 v2016 2018 2017 2016Revenues:
Investment banking .......................... $ 588,978 $ 633,837 $ 490,340 (7.1)% 29.3% 75.1% 72.4 % 65.6 %Institutional brokerage ..................... 124,517 154,563 161,186 (19.4) (4.1) 15.9 17.7 21.6Asset management ........................... 49,803 56,835 60,672 (12.4) (6.3) 6.3 6.5 8.1Interest.............................................. 32,749 31,954 33,074 2.5 (3.4) 4.2 3.7 4.4Investment income ........................... 4,946 18,002 24,602 (72.5) (26.8) 0.6 2.1 3.3
Total revenues................................ 800,993 895,191 769,874 (10.5) 16.3 102.1 102.3 103.0
Interest expense................................ 16,551 20,268 22,525 (18.3) (10.0) 2.1 2.3 3.0
Net revenues .................................. 784,442 874,923 747,349 (10.3) 17.1 100.0 100.0 100.0
Non-interest expenses:Compensation and benefits .............. 512,847 617,635 510,612 (17.0) 21.0 65.4 70.6 68.3Outside services ............................... 39,957 38,012 39,289 5.1 (3.3) 5.1 4.3 5.3Occupancy and equipment ............... 35,721 33,462 34,813 6.8 (3.9) 4.6 3.8 4.7Communications .............................. 31,621 29,891 29,626 5.8 0.9 4.0 3.4 4.0Marketing and businessdevelopment ................................... 29,377 31,293 30,404 (6.1) 2.9 3.7 3.6 4.1
Deal-related expenses....................... 25,120 — — N/M N/M 3.2 — —Trade execution and clearance ......... 8,014 8,166 7,651 (1.9) 6.7 1.0 0.9 1.0Restructuring and integration costs.. 3,770 — 10,206 N/M N/M 0.5 — 1.4Goodwill impairment ....................... — 114,363 82,900 N/M 38.0 — 13.1 11.1Intangible asset amortization............ 10,460 15,400 21,214 (32.1) (27.4) 1.3 1.8 2.8Back office conversion costs............ — 3,927 561 N/M 600.0 — 0.4 0.1Other operating expenses ................. 12,678 12,097 10,947 4.8 10.5 1.6 1.4 1.5
Total non-interest expenses ........... 709,565 904,246 778,223 (21.5) 16.2 90.5 103.4 104.1
Income/(loss) before income taxexpense/(benefit).............................. 74,877 (29,323) (30,874) N/M N/M 9.5 (3.4) (4.1)
Income tax expense/(benefit) ........... 19,047 30,229 (17,128) (37.0) N/M 2.4 3.5 (2.3)
Net income/(loss) ............................... 55,830 (59,552) (13,746) N/M N/M 7.1 (6.8) (1.8)
Net income/(loss) applicable tononcontrolling interests.................. (1,206) 2,387 8,206 N/M (70.9) (0.2) 0.3 1.1
Net income/(loss) applicable toPiper Jaffray Companies................ $ 57,036 $ (61,939) $ (21,952) N/M N/M 7.3% (7.1)% (2.9)%
N/M — Not meaningful

33
For the year ended December 31, 2018, we recorded net income applicable to Piper Jaffray Companies of $57.0 million. Net revenues for the year ended December 31, 2018 were $784.4 million, a 10.3 percent decrease compared to $874.9 millionin the year-ago period. In 2018, investment banking revenues decreased 7.1 percent to $589.0 million, compared with $633.8 million in 2017, as higher equity financing revenues were more than offset by lower advisory services and debt financing revenues. For the year ended December 31, 2018, institutional brokerage revenues were $124.5 million, down 19.4 percentcompared with $154.6 million in 2017, due to lower equity and fixed income institutional brokerage revenues. Asset management fees were $49.8 million in 2018, down 12.4 percent compared with $56.8 million in 2017, due to lower management fees from our MLP and equity product offerings. For the year ended December 31, 2018, net interest income increased to $16.2 million, compared with $11.7 million in 2017. The increase was driven by lower long-term financing expenses. We repaid $50 million of Class A senior notes upon maturity on May 31, 2017. In addition, we repaid $125 million of Class C senior notes upon maturity on October 9, 2018. In 2018, investment income was $4.9 million, compared with $18.0 million in 2017. The decrease was due to lower gains on our investment and the noncontrolling interests in the merchant banking funds that we manage, as well as lower gains on our other firm investments. Non-interest expenses were $709.6 million for the year ended December 31, 2018, a decrease of 21.5 percent compared to $904.2 million in the prior year, primarily due to a $114.4 million non-cash goodwill impairment charge recorded in 2017. In addition, lower compensation expenses from decreased revenues and lower acquisition-related costs were partially offset by the impact of presenting deal-related expenses on a gross basis on the consolidated statements of operations. Beginning in 2018, new accounting guidance requires the gross presentation of client reimbursed deal expenses.
For the year ended December 31, 2017, we recorded a net loss applicable to Piper Jaffray Companies of $61.9 million, driven by a $70.8 million, net of tax, goodwill impairment charge and a $54.2 million tax charge for the remeasurement of our deferred tax assets as a result of the lower enacted federal corporate tax rate. Net revenues for the year ended December 31, 2017 were $874.9 million, a 17.1 percent increase compared to $747.3 million in 2016. In 2017, investment banking revenues increased 29.3 percent to $633.8 million, compared with $490.3 million in 2016, driven by strong advisory services revenues. The advisory services business has been a strategic focus for us, and these results reflected significant market share gains. Also, equity financing revenues increased as the market environment for equity capital raising improved significantly after challenging market conditions in 2016. These increases were partially offset by lower debt financing revenues, which declined compared to a strong 2016. For the year ended December 31, 2017, institutional brokerage revenues were $154.6 million, down 4.1 percentcompared with $161.2 million in 2016, due to lower equity and fixed income institutional brokerage revenues. Asset management fees were $56.8 million in 2017, down 6.3 percent compared with $60.7 million in 2016, as higher management fees from our MLP product offerings were more than offset by lower management fees from our equity product offerings. For the year ended December 31, 2017, net interest income increased to $11.7 million, compared with $10.5 million in 2016. In 2017, investment income was $18.0 million, compared with $24.6 million in 2016, due to lower gains on our investment and the noncontrolling interests in the merchant banking fund that we manage. Non-interest expenses were $904.2 million for the year ended December 31, 2017, an increase of 16.2 percent compared to $778.2 million in 2016. The increase was driven by higher compensation expenses from increased revenues, as well as higher acquisition-related compensation costs. Also, we incurred a $114.4 million non-cash goodwill impairment charge in 2017, compared to a $82.9 million non-cash goodwill impairment charge in 2016. Incremental back office conversion costs in 2017 were more than offset by lower restructuring costs.
New Revenue Recognition Guidance
As discussed in Note 3 to our consolidated financial statements, we adopted new revenue recognition guidance effective as of January 1, 2018. The previous broker dealer industry treatment of netting deal expenses with investment banking revenues was superseded under the new guidance. As a result of adopting the new guidance, we now present investment banking revenues gross of related client reimbursed deal expenses and deal-related expenses as non-interest expenses on the consolidated statements of operations, rather than the previous presentation of netting deal expenses incurred for completed investment banking deals within revenues. This change did not impact net income, however the financial measures for the year ended December 31, 2018 were impacted as follows:
• Higher net revenues,• Decreased compensation ratio,• Higher non-compensation expenses,• Higher non-compensation ratio, and• Lower pre-tax operating margin.

34
Deal-related expenses are deferred until completion of an investment banking transaction and beginning in 2018 are reported separately on the consolidated statements of operations. For the year ended December 31, 2018, we reported higher investment banking revenues and higher non-compensation expenses of $25.1 million, respectively, as a result of this change.
In addition, beginning in 2018, we defer the recognition of performance fees on our merchant banking, energy and senior living alternative asset management funds until such fees are no longer subject to reversal, which will cause a delay in the recognition of these fees as revenue. With the exception of the above, our previous methods of recognizing investment banking revenues were not significantly impacted by the new guidance.
Consolidated Non-Interest Expenses
Compensation and Benefits – Compensation and benefits expenses, which are the largest component of our expenses, include salaries, incentive compensation, benefits, stock-based compensation, employment taxes, income associated with the forfeiture of stock-based compensation and other employee-related costs. A portion of compensation expense is comprised of variable incentive arrangements, including discretionary incentive compensation, the amount of which fluctuates in proportion to the level of business activity, increasing with higher revenues and operating profits. Other compensation costs, primarily base salaries and benefits, are more fixed in nature. The timing of incentive compensation payments, which generally occur in February, has a greater impact on our cash position and liquidity than is reflected on our consolidated statements of operations.We have granted restricted stock with service conditions as a component of our acquisition deal consideration, which is amortized to compensation expense over the service period.
For the year ended December 31, 2018, compensation and benefits expenses decreased 17.0 percent to $512.8 million from $617.6 million in 2017. Compensation expenses decreased due to lower revenues as well as lower acquisition-related compensation costs, which were driven by a decline in compensation expenses related to a Simmons performance award plan implemented at the time of acquisition. Our compensation costs related to this performance plan decreased to $8.9 million in 2018, compared to $27.0 million in 2017. Compensation costs were higher in the prior year due to outperformance of the Simmons business in 2017. Compensation and benefits expenses as a percentage of net revenues was 65.4 percent in 2018, compared with 70.6 percent in 2017. The lower compensation expense ratio reflects decreased acquisition-related compensation and the impact of presenting investment banking revenues gross of related client reimbursed deal expenses, as required by new accounting guidance. This change resulted in a 210 basis point decrease to the compensation ratio in the current year. The requisite service period for our acquisition-related compensation arrangements ends in the first half of 2019.
For the year ended December 31, 2017, compensation and benefits expenses increased 21.0 percent to $617.6 million from $510.6 million in 2016, due to higher revenues as well as higher acquisition-related compensation costs, which were driven by incremental compensation expenses related to a Simmons performance award plan implemented at the time of acquisition. Our compensation costs related to this performance plan increased to $27.0 million in 2017, compared to $4.3 million in 2016, as the Simmons business outperformed our projections in 2017 due to a recovery in the energy markets and strong execution of investment banking transactions. As a result, we refined our future projections related to this business and the performance award plan. Compensation and benefits expenses as a percentage of net revenues was 70.6 percent in 2017, compared with 68.3 percentin 2016. The higher compensation expense ratio was attributable to increased acquisition-related compensation, and the impact of defined retirement provisions for performance share units granted in February 2018, which resulted in recognition of additional compensation expense.
Outside Services – Outside services expenses include securities processing expenses, outsourced technology functions,
outside legal fees, fund expenses associated with our consolidated alternative asset management funds and other professional fees. Outside services expenses increased 5.1 percent to $40.0 million in 2018, compared with $38.0 million in the corresponding period of 2017. Excluding the portion of expenses from non-controlled equity interests in our consolidated alternative asset management funds, outside services expenses increased 3.6 percent due to an increase in professional fees partially offset by a reduction in securities processing costs as there are services we no longer use following our migration to a fully disclosed clearing model in the third quarter of 2017.
Outside services expenses decreased 3.3 percent to $38.0 million in 2017, compared with $39.3 million in 2016. Excluding the portion of expenses from non-controlled equity interests in our consolidated alternative asset management funds, outside services expenses were essentially flat.

35
Occupancy and Equipment – For the year ended December 31, 2018, occupancy and equipment expenses increased 6.8 percent to $35.7 million, compared with $33.5 million in 2017. The increase was primarily due to incremental occupancy costs related to transitioning to new office space in Houston, Texas, along with a few smaller office locations.
For the year ended December 31, 2017, occupancy and equipment expenses decreased 3.9 percent to $33.5 million, compared with $34.8 million in 2016.
Communications – Communication expenses include costs for telecommunication and data communication, primarily consisting of expenses for obtaining third party market data information. For the year ended December 31, 2018, communication expenses increased 5.8 percent to $31.6 million, compared with $29.9 million for the year ended December 31, 2017. The increase was primarily due to higher market data services.
For the year ended December 31, 2017, communication expenses were $29.9 million, up slightly compared with 2016.
Marketing and Business Development – Marketing and business development expenses include travel and entertainment costs, advertising and third party marketing fees. In 2018, marketing and business development expenses decreased 6.1 percentto $29.4 million, compared with $31.3 million for the year ended December 31, 2017. The decline was attributable to lower marketing and travel expenses.
In 2017, marketing and business development expenses were $31.3 million, compared with $30.4 million for the year ended December 31, 2016.
Deal-Related Expenses – Deal-related expenses include costs we incurred over the course of a completed investment banking deal, which primarily consist of legal fees, offering expenses, and travel and entertainment costs. For the year ended December 31, 2018, deal-related expenses were $25.1 million. Effective January 1, 2018, new revenue recognition guidance required us to present reimbursed deal expenses as non-interest expenses on the consolidated statements of operations, rather than netting deal expenses incurred for completed investment banking deals within revenues. The amount of deal-related expenses for the year will principally be dependent on the level of deal activity and may vary from period to period as the recognition of deal-related costs typically coincides with the closing of a transaction.
Trade Execution and Clearance – For the year ended December 31, 2018, trade execution and clearance expenses were $8.0 million, essentially flat compared with the year ended December 31, 2017.
For the year ended December 31, 2017, trade execution and clearance expenses increased to $8.2 million, compared with $7.7 million for the year ended December 31, 2016.
Restructuring and Integration Costs – For the year ended December 31, 2018, we incurred restructuring costs of $3.8 million related to our brokerage and asset management businesses. Restructuring costs included $3.5 million of severance, benefits and outplacement costs, $0.1 million for vacated leased office space, and $0.2 million for contract termination costs.
For the year ended December 31, 2016, we recorded restructuring and acquisition integration costs of $10.2 million, primarily related to our acquisition of Simmons. The expenses consisted of $6.6 million of severance, benefits and outplacement costs, $1.3 million of vacated redundant leased office space, $1.3 million of transaction costs, and $1.0 million of contract termination costs.
Goodwill Impairment – During the third quarter of 2017, we performed an interim goodwill impairment test, which resulted in a non-cash goodwill impairment charge of $114.4 million related to our asset management reporting unit.
During the fourth quarter of 2016, we completed our annual goodwill impairment testing, which resulted in a non-cash goodwill impairment charge of $82.9 million related to our asset management reporting unit.
Intangible Asset Amortization – Intangible asset amortization includes the amortization of definite-lived intangible assets consisting of customer relationships and the Simmons trade name. For the year ended December 31, 2018, intangible asset amortization was $10.5 million, compared with $15.4 million in the corresponding period of 2017.

36
For the year ended December 31, 2017, intangible asset amortization was $15.4 million, compared with $21.2 million in the corresponding period of 2016.
Back Office Conversion Costs – In 2017, we migrated to a fully disclosed clearing model and are no longer self clearing. Back office conversion costs included costs incurred to transition to a fully disclosed clearing model, such as contract termination costs, vendor migration fees, professional fees, and severance benefits for impacted personnel. For the year ended December 31, 2017, we incurred back office conversion costs of $3.9 million, compared with $0.6 million in the year ended December 31, 2016.
Other Operating Expenses – Other operating expenses include insurance costs, license and registration fees, expenses related to our charitable giving program and litigation-related expenses, which consist of the amounts we reserve and/or pay out related to legal and regulatory matters. Other operating expenses were $12.7 million in 2018, up slightly compared with 2017.
Other operating expenses increased to $12.1 million in 2017, compared with $10.9 million in 2016. The increase was primarily due to higher expense related to our charitable giving program driven by our increased profitability on a non-GAAP basis.
Income Taxes – The Tax Cuts and Jobs Act reduced the corporate federal tax rate from 35 percent to 21 percent effective January 1, 2018. SEC Staff Accounting Bulletin No. 118, "Income Tax Accounting Implications of the Tax Cuts and Jobs Act" ("SAB 118") permitted companies to report a provisional amount in the 2017 financial statements if the accounting for income tax effects of the Tax Cuts and Jobs Act was incomplete as of December 31, 2017. This provisional amount would be subject to adjustment in subsequent periods during a defined measurement period, which was limited to one year from the enactment date of December 22, 2017.
For the year ended December 31, 2018, our provision for income taxes was $19.0 million, which included a $7.1 milliontax benefit related to stock-based compensation awards vesting at values greater than the grant price partially offset by $5.3 million of income tax expense for a deferred tax asset valuation allowance primarily related to net operating loss carryforwards for Piper Jaffray Ltd. In addition, pursuant to SAB 118, we recorded an additional $1.0 million of income tax expense for the remeasurement of our deferred tax assets at the lower enacted federal corporate tax rate. Excluding the impact of these items, our effective tax rate was 26.6 percent.
For the year ended December 31, 2017, our provision for income taxes was $30.2 million, which included a non-cash tax charge of $54.2 million for the remeasurement of our deferred tax assets arising from the enactment of the Tax Cuts and Jobs Act and the lower enacted federal corporate tax rate. Excluding this charge, our provision from income taxes in 2017 was a benefit of $23.9 million as a result of pre-tax losses related to the $114.4 million non-cash goodwill impairment charge. In addition, for the year ended December 31, 2017, we recorded a $9.2 million tax benefit related to stock-based compensation awards vesting at values greater than the grant price.
For the year ended December 31, 2016, our benefit for income taxes was $17.1 million, equating to an effective tax rate, excluding noncontrolling interests, of 43.8 percent. The higher effective tax rate was due to the benefit from tax-exempt municipal interest income during a period with pre-tax losses.
37
Segment Performance
We measure financial performance by business segment. Our two reportable segments are Capital Markets and Asset Management. We determined these segments based upon the nature of the financial products and services provided to customers and our management organization. Segment pre-tax operating income/(loss) and segment pre-tax operating margin are used to evaluate and measure segment performance by our chief operating decision maker in deciding how to allocate resources and in assessing performance in relation to our competitors. Revenues and expenses directly associated with each respective segment are included in determining segment operating results. Revenues and expenses that are not directly attributable to a particular segment are allocated based upon our allocation methodologies, generally based on each segment's respective net revenues, use of shared resources, headcount or other relevant measures.
Throughout this section, we have presented segment results on both a U.S. GAAP and non-GAAP basis. Management believes that presenting adjusted segment pre-tax operating income and adjusted segment pre-tax operating margin, each a non-GAAP measure, in conjunction with the U.S. GAAP measures provides a more meaningful basis for comparison of its operating results and underlying trends between periods, and enhances the overall understanding of our current financial performance by excluding certain items that may not be indicative of our core operating results. The non-GAAP segment results should be considered in addition to, not as a substitute for, the segment results prepared in accordance with U.S. GAAP.
Adjusted segment pre-tax operating income and adjusted segment pre-tax operating margin exclude (1) revenues and expenses related to noncontrolling interests, (2) amortization of intangible assets related to acquisitions, (3) compensation and non-compensation expenses from acquisition-related agreements, (4) acquisition-related restructuring and integration costs and (5) goodwill impairment charges. For U.S. GAAP purposes, these items are included in each of their respective line items on the consolidated statements of operations.
Adjusted segment pre-tax operating income and adjusted segment pre-tax operating margin present the segments' results of operations excluding the impact resulting from the consolidation of noncontrolling interests in alternative asset management funds. Consolidation of these funds results in the inclusion of the proportionate share of the income or loss attributable to the equity interests in consolidated funds that are not attributable, either directly or indirectly, to us (i.e., noncontrolling interests). This proportionate share is reflected in net income applicable to noncontrolling interests in the accompanying consolidated statements of operations, and has no effect on the overall financial performance of the segments, as ultimately, this income or loss is not income or loss for the segments themselves. Included in adjusted segment pre-tax operating income and adjusted segment pre-tax operating margin is the actual proportionate share of the income or loss attributable to us as an investor in such funds.
Adjusted segment pre-tax operating income and adjusted segment pre-tax operating margin also exclude amortization of intangible assets and compensation and non-compensation expenses from acquisition-related agreements. These amounts are excluded on a non-GAAP basis as they represent expenses specifically related to acquisitions that will eventually be fully amortized and therefore not part of our on-going operations. The acquisition-related restructuring and integration costs excluded from adjusted segment pre-tax operating income and adjusted segment pre-tax operating margin represent charges that resulted from severance benefits, vacating redundant leased office space and contract termination costs. These restructuring and integration costs are excluded from our non-GAAP financial measures as they generally relate to an acquisition and excluding these amounts provides a better understanding of our core non-compensation expenses. Management believes that presenting adjusted segment pre-tax operating income and adjusted segment pre-tax operating margin excluding the acquisition-related amounts provides clarity on the financial results generated by the core operating components of our business. The non-cash goodwill impairment charges recognized in 2017 and 2016 relate to the asset management reporting unit.

38
Capital Markets
The following table sets forth the Capital Markets adjusted segment financial results and adjustments necessary to reconcile to our consolidated U.S. GAAP pre-tax operating income and pre-tax operating margin for the periods presented:
Year Ended December 31,
2018 2017
Adjustments (1) Adjustments (1)
Total Noncontrolling Other U.S. Total Noncontrolling Other U.S.
(Dollars in thousands) Adjusted Interests Adjustments GAAP Adjusted Interests Adjustments GAAPInvestment banking
Advisory services ..................... $ 394,133 $ — $ — $ 394,133 $ 443,303 $ — $ — $ 443,303Financing
Equities ................................. 122,172 — — 122,172 98,996 — — 98,996Debt....................................... 73,262 — — 73,262 93,434 — — 93,434
Total investment banking ............. 589,567 — — 589,567 635,733 — — 635,733
Institutional sales and trading
Equities..................................... 77,477 — — 77,477 81,717 — — 81,717Fixed income............................ 67,563 — — 67,563 89,455 — — 89,455
Total institutional sales andtrading ....................................... 145,040 — — 145,040 171,172 — — 171,172
Total management andperformance fees ....................... 6,318 — — 6,318 5,566 — — 5,566
Investment income ....................... 2,669 3,621 — 6,290 12,321 5,319 — 17,640
Long-term financing expenses ..... (5,793) — — (5,793) (7,676) — — (7,676)
Net revenues ................................ 737,801 3,621 — 741,422 817,116 5,319 — 822,435
Operating expenses...................... 624,070 4,827 34,787 663,684 669,630 2,932 65,777 738,339
Segment pre-tax operatingincome....................................... $ 113,731 $ (1,206) $ (34,787) $ 77,738 $ 147,486 $ 2,387 $ (65,777) $ 84,096
Segment pre-tax operatingmargin ....................................... 15.4% 10.5% 18.0% 10.2%
(1) The following is a summary of the adjustments needed to reconcile our consolidated U.S. GAAP segment pre-tax operating income and segment pre-tax operating margin to the adjusted segment pre-tax operating income and adjusted segment pre-tax operating margin: Noncontrolling interests – The impacts of consolidating noncontrolling interests in our alternative asset management funds are not included in adjusted segment pre-tax operating income and adjusted segment pre-tax operating margin. Other Adjustments – The following table sets forth the items not included in adjusted segment pre-tax operating income and adjusted segment pre-tax operating margin for the periods presented:
Year Ended December 31,(Dollars in thousands) 2018 2017Compensation from acquisition-related agreements .............................................................................. $ 29,246 $ 54,999Amortization of intangible assets related to acquisitions....................................................................... 4,858 10,178Non-compensation expenses from acquisition-related agreements........................................................ 683 600
$ 34,787 $ 65,777
Capital Markets net revenues on a U.S. GAAP basis decreased 9.9 percent to $741.4 million for the year ended December 31, 2018, compared with $822.4 million in the prior-year period. For the year ended December 31, 2018, Capital Markets adjusted net revenues were $737.8 million compared with $817.1 million for the year ended December 31, 2017. The variance explanations for net revenues and adjusted net revenues are consistent on both a U.S. GAAP and non-GAAP basis.
Investment banking revenues comprise all of the revenues generated through advisory services activities, which includes mergers and acquisitions, equity private placements, debt and restructuring advisory, and municipal financial advisory transactions, as well as equity and debt financing activities. To assess the profitability of investment banking, we aggregate investment banking fees with the net interest income or expense associated with these activities.

39
In 2018, investment banking revenues decreased 7.3 percent to $589.6 million compared with $635.7 million in the corresponding period of the prior year as lower advisory services and debt financing revenues were partially offset by higher equity financing revenues. For the year ended December 31, 2018, advisory services revenues decreased 11.1 percent to $394.1 million, compared with $443.3 million in 2017. The number of completed transactions increased from the prior year, however, revenues declined as 2017 was elevated by several large fees. We completed 170 transactions with an aggregate enterprise value of $28.9 billion in 2018, compared with 163 transactions with an aggregate enterprise value of $34.3 billion in 2017. For the year ended December 31, 2018, equity financing revenues were $122.2 million, up 23.4 percent compared with $99.0 millionin the prior-year period, due to higher revenue per transaction. The number of deals in which we were bookrunner increased approximately seven percent compared to the prior year. Strong valuations and stable markets through the first three quarters of 2018 created optimum IPO conditions in the market. During 2018, we completed 85 equity financings, raising $16.1 billionfor our clients, compared with 84 equity financings, raising $17.1 billion for our clients in the year-ago period. Debt financing revenues for the year ended December 31, 2018 were $73.3 million, a decrease of 21.6 percent compared with $93.4 million in the year-ago period, due to lower public finance revenues as municipal market issuance volume declined meaningfully compared to the prior-year period. The first quarter of 2018 experienced a significant decline in public finance issuance volume due to record issuance volume in the fourth quarter of 2017 as issuers accelerated financings before the implementation of federal tax law changes in 2018. Municipal market issuance volume began to rebound after the first quarter of 2018, but it was still down approximately 24 percent on a year-over-year basis as the increase in new money issuance volume did not offset the significant decrease in refunding activity. During 2018, we completed 436 negotiated municipal issues with a total par value of $11.5 billion, compared with 622 negotiated municipal issues with a total par value of $15.3 billion during the prior-year period.
Institutional sales and trading revenues comprise all of the revenues generated through trading activities, which consist of facilitating customer trades, executing competitive municipal underwritings and our strategic trading activities in municipal bonds and U.S. government agency securities. To assess the profitability of institutional brokerage activities, we aggregate institutional brokerage revenues with the net interest income or expense associated with financing, economically hedging and holding long or short inventory positions. Our results may vary from quarter to quarter as a result of changes in trading margins, trading gains and losses, net interest spreads, trading volumes, the timing of payments for research services, and the timing of transactions based on market opportunities.
For the year ended December 31, 2018, institutional brokerage revenues decreased 15.3 percent to $145.0 million, compared with $171.2 million in the prior-year period, due to lower equity and fixed income institutional brokerage revenues. Equity institutional brokerage revenues were $77.5 million in 2018, down 5.2 percent compared with $81.7 million in 2017, due to changes in how equity market participants pay for equity research and trade execution services at a time when the overall fee pool is shrinking. Global market participants are shifting trade execution to low-touch providers and paying for research services separately, a result of the MiFID II regulation that became effective in the European Union at the beginning of 2018. This dynamic has negatively impacted our equity institutional brokerage revenues and added additional variability to our equity sales and trading business as revenues will fluctuate with the timing of research checks. For the year ended December 31, 2018, fixed income institutional brokerage revenues were $67.6 million, down 24.5 percent compared with $89.5 million in the prior-year period, due primarily to lower trading gains resulting from limited trading opportunities and unfavorable markets, as well as a decline in customer flow activity. Market conditions were challenging as low relative, but rising, interest rates and a flattened yield curve persisted throughout 2018 and resulted in reduced client volumes and limited trading opportunities. Our results were disproportionately impacted by the challenging fixed income markets in 2018 given our meaningful exposure to the municipal market where customer demand was muted due to the impact of federal tax reform on the municipal asset class.
Management and performance fees include the fees generated from our merchant banking, energy and senior living funds with outside investors. For the year ended December 31, 2018, management and performance fees were $6.3 million, compared with $5.6 million in the prior-year period, due to higher assets under management in our merchant banking funds. The increase was partially offset by lower performance fees. Upon adopting new revenue recognition guidance effective as of January 1, 2018, we now defer the recognition of performance fees on our merchant banking, energy and senior living funds until such fees are no longer subject to reversal, which will cause a delay in the recognition of these fees as revenue.
Investment income includes realized and unrealized gains and losses on investments, including amounts attributable to noncontrolling interests, in our merchant banking, energy and senior living funds. For the year ended December 31, 2018, investment income was $6.3 million, compared to $17.6 million in 2017. In 2018, we recorded lower gains in our merchant banking funds and on our other firm investments. Excluding the impact of noncontrolling interests, adjusted investment income was $2.7 million in 2018 and $12.3 million in 2017.
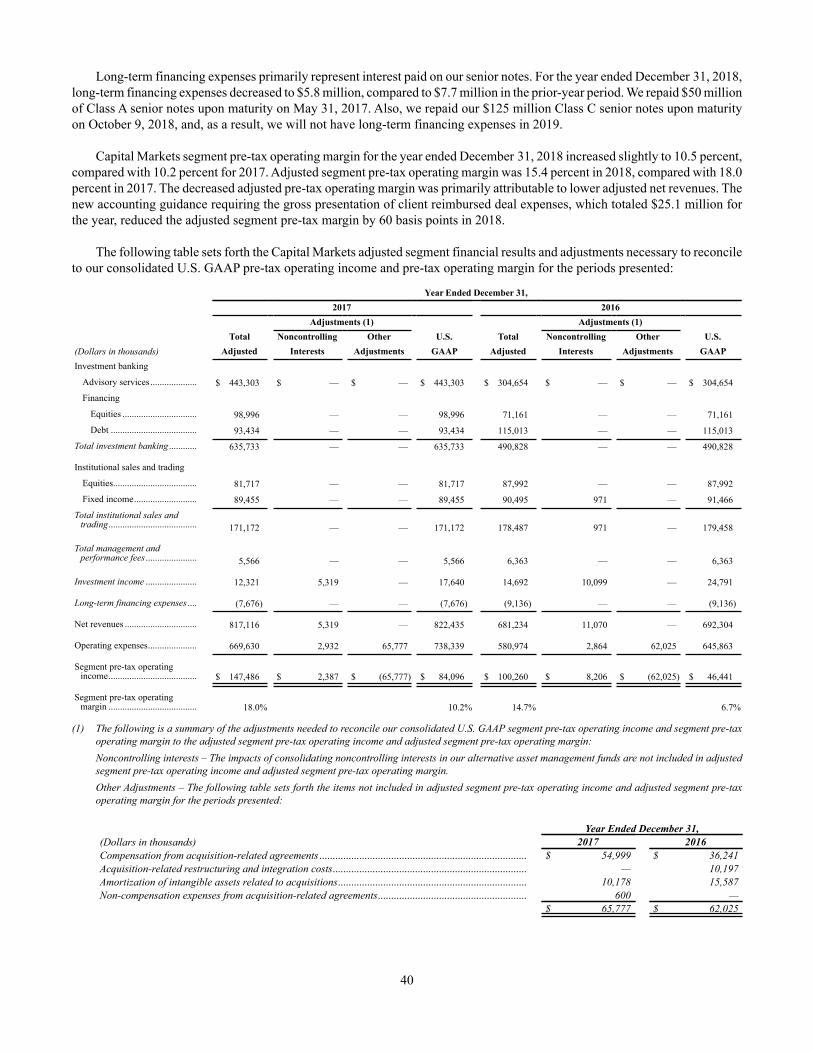
40
Long-term financing expenses primarily represent interest paid on our senior notes. For the year ended December 31, 2018, long-term financing expenses decreased to $5.8 million, compared to $7.7 million in the prior-year period. We repaid $50 million of Class A senior notes upon maturity on May 31, 2017. Also, we repaid our $125 million Class C senior notes upon maturity on October 9, 2018, and, as a result, we will not have long-term financing expenses in 2019.
Capital Markets segment pre-tax operating margin for the year ended December 31, 2018 increased slightly to 10.5 percent, compared with 10.2 percent for 2017. Adjusted segment pre-tax operating margin was 15.4 percent in 2018, compared with 18.0 percent in 2017. The decreased adjusted pre-tax operating margin was primarily attributable to lower adjusted net revenues. The new accounting guidance requiring the gross presentation of client reimbursed deal expenses, which totaled $25.1 million for the year, reduced the adjusted segment pre-tax margin by 60 basis points in 2018.
The following table sets forth the Capital Markets adjusted segment financial results and adjustments necessary to reconcile to our consolidated U.S. GAAP pre-tax operating income and pre-tax operating margin for the periods presented:
Year Ended December 31,2017 2016
Adjustments (1) Adjustments (1)Total Noncontrolling Other U.S. Total Noncontrolling Other U.S.
(Dollars in thousands) Adjusted Interests Adjustments GAAP Adjusted Interests Adjustments GAAPInvestment banking
Advisory services.................... $ 443,303 $ — $ — $ 443,303 $ 304,654 $ — $ — $ 304,654Financing
Equities ................................ 98,996 — — 98,996 71,161 — — 71,161Debt ..................................... 93,434 — — 93,434 115,013 — — 115,013
Total investment banking ............ 635,733 — — 635,733 490,828 — — 490,828
Institutional sales and trading
Equities.................................... 81,717 — — 81,717 87,992 — — 87,992Fixed income........................... 89,455 — — 89,455 90,495 971 — 91,466
Total institutional sales andtrading...................................... 171,172 — — 171,172 178,487 971 — 179,458
Total management andperformance fees ...................... 5,566 — — 5,566 6,363 — — 6,363
Investment income ...................... 12,321 5,319 — 17,640 14,692 10,099 — 24,791
Long-term financing expenses .... (7,676) — — (7,676) (9,136) — — (9,136)
Net revenues ............................... 817,116 5,319 — 822,435 681,234 11,070 — 692,304
Operating expenses..................... 669,630 2,932 65,777 738,339 580,974 2,864 62,025 645,863
Segment pre-tax operatingincome...................................... $ 147,486 $ 2,387 $ (65,777) $ 84,096 $ 100,260 $ 8,206 $ (62,025) $ 46,441
Segment pre-tax operatingmargin ...................................... 18.0% 10.2% 14.7% 6.7%
(1) The following is a summary of the adjustments needed to reconcile our consolidated U.S. GAAP segment pre-tax operating income and segment pre-tax operating margin to the adjusted segment pre-tax operating income and adjusted segment pre-tax operating margin: Noncontrolling interests – The impacts of consolidating noncontrolling interests in our alternative asset management funds are not included in adjusted segment pre-tax operating income and adjusted segment pre-tax operating margin.
Other Adjustments – The following table sets forth the items not included in adjusted segment pre-tax operating income and adjusted segment pre-tax operating margin for the periods presented:
Year Ended December 31,(Dollars in thousands) 2017 2016Compensation from acquisition-related agreements .............................................................................. $ 54,999 $ 36,241Acquisition-related restructuring and integration costs......................................................................... — 10,197Amortization of intangible assets related to acquisitions....................................................................... 10,178 15,587Non-compensation expenses from acquisition-related agreements........................................................ 600 —
$ 65,777 $ 62,025

41
Capital Markets net revenues on a U.S. GAAP basis increased 18.8 percent to $822.4 million for the year ended December 31, 2017, compared with $692.3 million for the year ended December 31, 2016. For the year ended December 31, 2017, Capital Markets adjusted net revenues were $817.1 million compared with $681.2 million in the prior year. The variance explanations for net revenues and adjusted net revenues are consistent on both a U.S. GAAP and non-GAAP basis.
In 2017, investment banking revenues increased 29.5 percent to $635.7 million compared with $490.8 million in the prior year, as strong advisory services and equity financing revenues were partially offset by lower debt financing revenues. For the year ended December 31, 2017, advisory services revenues increased 45.5 percent to $443.3 million, compared with $304.7 million in 2016. The increase reflects our long-term efforts to invest in and grow the advisory services business and the breadth of our platform. Revenue growth in advisory services also reflects market share gains, supplemented by constructive markets. We completed 163 transactions with an aggregate enterprise value of $34.3 billion during 2017, compared with 150 transactions with an aggregate enterprise value of $22.3 billion in 2016. For the year ended December 31, 2017, equity financing revenues were $99.0 million, up 39.1 percent compared with $71.2 million in 2016, due to more completed transactions and higher revenue per transaction in an improved market environment. Market conditions, driven by increased valuations and low volatility, were conducive for equity capital raising in 2017. During 2017, we completed 84 equity financings, raising $17.1 billion for our clients, compared with 68 equity financings, raising $13.7 billion for our clients in 2016. Debt financing revenues for the year ended December 31, 2017 were $93.4 million, a decrease of 18.8 percent compared with $115.0 million in the prior year. Despite an increase in municipal issuance volume at the end of 2017 as issuers accelerated financings before the implementation of federal tax law changes in 2018, public finance revenues declined compared to a very strong 2016. Refunding activity decreased compared to 2016, and was only partially offset by an increase in new money issuance volumes in 2017. During 2017, we completed 622 negotiated municipal issues with a total par value of $15.3 billion, compared with 718 negotiated municipal issues with a total par value of $16.7 billion during 2016.
For the year ended December 31, 2017, institutional brokerage revenues decreased 4.6 percent to $171.2 million, compared with $179.5 million in 2016, due to lower equity and fixed income institutional brokerage revenues. Equity institutional brokerage revenues were $81.7 million in 2017, down 7.1 percent compared with $88.0 million in 2016, as historically low levels of volatility reduced client trading volumes during the year. For the year ended December 31, 2017, fixed income institutional brokerage revenues were $89.5 million, down 2.2 percent compared with $91.5 million in the prior year. Customer flow activity remained light for most of 2017 due to the low interest rates and flat yield curve.
For the year ended December 31, 2017, management and performance fees were $5.6 million, compared with $6.4 millionin 2016, due primarily to lower performance fees from our merchant banking fund.
For the year ended December 31, 2017, investment income was $17.6 million, compared to $24.8 million in 2016. In 2017, we recorded lower gains in our merchant banking and senior living funds, which were partially offset by higher gains on our other firm investments. Excluding the impact of noncontrolling interests, adjusted investment income was $12.3 million in 2017.
In 2017, long-term financing expenses decreased to $7.7 million, compared to $9.1 million in the prior year. We repaid $50 million of Class A senior notes upon maturity on May 31, 2017.
Capital Markets segment pre-tax operating margin for 2017 increased to 10.2 percent, compared with 6.7 percent for 2016. The increased pre-tax operating margin was due to a lower non-compensation ratio driven by higher revenues and lower levels of restructuring costs, which was partially offset by higher acquisition-related costs. In 2016, we recorded $10.2 million of restructuring and integration costs primarily related to the acquisition of Simmons. Adjusted segment pre-tax operating margin of 18.0 percent in 2017 was an increase from the 14.7 percent operating margin recorded in 2016 due to operating leverage as a result of higher revenues. Adjusted net revenues increased 19.9 percent in 2017 and adjusted operating expenses increased 15.3 percent compared to 2016, reflecting operating leverage in the business.

42
Asset Management
The following table sets forth the Asset Management segment financial results and adjustments necessary to reconcile to our consolidated U.S. GAAP pre-tax operating income/(loss) and pre-tax operating margin for the periods presented:
Year Ended December 31,2018 2017
Adjustments (1) Adjustments (1)Total Noncontrolling Other U.S. Total Noncontrolling Other U.S.
(Dollars in thousands) Adjusted Interests Adjustments GAAP Adjusted Interests Adjustments GAAPManagement fees
MLP............................................... $ 25,235 $ — $ — $ 25,235 $ 27,630 $ — $ — $ 27,630Equity ............................................ 18,226 — — 18,226 23,639 — — 23,639
Total management fees...................... 43,461 — — 43,461 51,269 — — 51,269
Performance feesMLP............................................... — — — — — — — —Equity ............................................ 24 — — 24 — — — —
Total performance fees...................... 24 — — 24 — — — —
Total management and performancefees.................................................. 43,485 — — 43,485 51,269 — — 51,269
Investment income/(loss) .................. (465) — — (465) 1,219 — — 1,219
Total net revenues ............................. 43,020 — — 43,020 52,488 — — 52,488
Operating expenses ........................... 40,279 — 5,602 45,881 46,322 — 119,585 165,907
Segment pre-tax operating income/(loss) ............................................... $ 2,741 $ — $ (5,602) $ (2,861) $ 6,166 $ — $ (119,585) $ (113,419)
Segment pre-tax operating margin.... 6.4% (6.7)% 11.7% (216.1)%
(1) Other Adjustments – The following table sets forth the items not included in adjusted segment pre-tax operating income and adjusted segment pre-tax operating margin for the periods presented:
Year Ended December 31,(Dollars in thousands) 2018 2017Goodwill impairment ............................................................................................................................... $ — $ 114,363Amortization of intangible assets related to acquisitions ........................................................................ 5,602 5,222
$ 5,602 $ 119,585
Management and performance fee revenues comprise the revenues generated from management and investment advisory services performed for separately managed accounts, registered funds and partnerships. Client asset inflows and outflows and investment performance have a direct effect on management and performance fee revenues. Management fees are generally based on the level of AUM measured monthly or quarterly, and an increase or reduction in AUM, due to market price fluctuations or net client asset flows, will result in a corresponding increase or decrease in management fees. Fees vary with the type of assets managed and the vehicle in which they are managed. Performance fees are earned when the investment return on AUM exceeds certain benchmark targets or other performance targets over a specified measurement period. These performance fees are typically annual performance hurdles and recognized in the fourth quarter of the applicable year, or upon withdrawal of client assets. The level of performance fees earned can vary significantly from period to period and these fees may not necessarily be correlated to changes in total AUM. At December 31, 2018, approximately five percent of our AUM was eligible to earn performance fees.
For the year ended December 31, 2018, management fees were $43.5 million, a decrease of 15.2 percent compared with $51.3 million in the prior-year period, due to lower management fees from both our MLP and equity product offerings. Management fees from our MLP strategies decreased 8.7 percent in 2018 to $25.2 million compared with $27.6 million in 2017due to lower average AUM driven primarily by net market depreciation. In 2018, management fees related to our equity strategies were $18.2 million, down 22.9 percent compared to $23.6 million in 2017, due to lower average AUM and a lower average effective revenue yield. The average effective yield (total management fees as a percentage of our average month-end AUM) for our equity strategies was 55 basis points for the year ended December 31, 2018, compared with 62 basis points for the prior-year period.
Investment income/(loss) includes gains and losses from our investments in registered funds and private funds or partnerships that we manage. In 2018, we recorded an investment loss of $0.5 million, compared with investment income of $1.2 million for the year ended December 31, 2017.

43
Segment pre-tax operating margin in 2018 was a negative 6.7 percent due to declining profitability in the business. The negative segment pre-tax operating margin in 2017 was driven by the $114.4 million non-cash goodwill impairment charge. Adjusted segment operating margin declined from 11.7 percent in 2017 to 6.4 percent in 2018.
The following table sets forth the Asset Management segment financial results and adjustments necessary to reconcile to our consolidated U.S. GAAP pre-tax operating income/(loss) and pre-tax operating margin for the periods presented:
Year Ended December 31,
2017 2016
Adjustments (1) Adjustments (1)
Total Noncontrolling Other U.S. Total Noncontrolling Other U.S.
(Dollars in thousands) Adjusted Interests Adjustments GAAP Adjusted Interests Adjustments GAAPManagement fees
MLP............................................... $ 27,630 $ — $ — $ 27,630 $ 25,561 $ — $ — $ 25,561Equity ............................................ 23,639 — — 23,639 28,164 — — 28,164
Total management fees...................... 51,269 — — 51,269 53,725 — — 53,725
Performance fees
MLP............................................... — — — — — — — —Equity ............................................ — — — — 584 — — 584
Total performance fees...................... — — — — 584 — — 584
Total management and performancefees.................................................. 51,269 — — 51,269 54,309 — — 54,309
Investment income ............................ 1,219 — — 1,219 736 — — 736
Total net revenues ............................. 52,488 — — 52,488 55,045 — — 55,045
Operating expenses ........................... 46,322 — 119,585 165,907 43,824 — 88,536 132,360
Segment pre-tax operating income/(loss) ............................................... $ 6,166 $ — $ (119,585) $(113,419) $ 11,221 $ — $ (88,536) $ (77,315)
Segment pre-tax operating margin.... 11.7% (216.1)% 20.4% (140.5)%
(1) Other Adjustments – The following table sets forth the items not included in adjusted segment pre-tax operating income and adjusted segment pre-tax operating margin for the periods presented:
Year Ended December 31,(Dollars in thousands) 2017 2016Restructuring and integration costs......................................................................................................... $ — $ 9Goodwill impairment ............................................................................................................................... 114,363 82,900Amortization of intangible assets related to acquisitions ........................................................................ 5,222 5,627
$ 119,585 $ 88,536
For the year ended December 31, 2017, management fees were $51.3 million, a decrease of 4.6 percent, compared with $53.7 million in 2016, as higher management fees from our MLP product offerings were more than offset by lower management fees from our equity product offerings. Management fees from our MLP strategies increased 8.1 percent in 2017 to $27.6 million, compared with $25.6 million in 2016, due to a higher average effective revenue yield and a slightly higher average AUM. The average effective yield for our MLP strategies was 65 basis points for the year ended December 31, 2017, compared with 62 basis points for the year ended December 31, 2016. In 2017, management fees related to our equity strategies were $23.6 million, down 16.1 percent compared to $28.2 million in 2016. The decrease was driven by a lower average effective revenue yield which resulted from changes in our product mix, as well as lower average AUM due to net client outflows. The average effective yield for our equity strategies was 62 basis points for the year ended December 31, 2017, compared with 71 basis points for the year ended December 31, 2016.
The performance fees of $0.6 million recorded in 2016 resulted from certain funds exceeding their performance targets over a specified measurement period.

44
The negative pre-tax operating margin in 2017 and 2016 was driven by non-cash goodwill impairment charges of $114.4 million and $82.9 million, respectively. Adjusted segment pre-tax operating margin declined from 20.4 percent in 2016 to 11.7 percent in 2017. The decrease was due to negative operating leverage in the business.
The following table summarizes the changes in our AUM for the periods presented:
Twelve Months EndedDecember 31,
(Dollars in millions) 2018 2017 2016MLP
Beginning of period....................................................... $ 3,790 $ 4,616 $ 3,924Net outflows ................................................................. (194) (424) (286)Net market appreciation/(depreciation)........................ (542) (402) 978
End of period................................................................. $ 3,054 $ 3,790 $ 4,616
EquityBeginning of period....................................................... $ 3,556 $ 4,115 $ 4,954
Net outflows ................................................................. (520) (1,003) (1,331)Net market appreciation/(depreciation)........................ (335) 444 492
End of period................................................................. $ 2,701 $ 3,556 $ 4,115
TotalBeginning of period....................................................... $ 7,346 $ 8,731 $ 8,878
Net outflows ................................................................. (714) (1,427) (1,617)Net market appreciation/(depreciation)........................ (877) 42 1,470
End of period................................................................. $ 5,755 $ 7,346 $ 8,731
Total AUM was $5.8 billion at December 31, 2018, down from $7.3 billion at December 31, 2017. Both our MLP AUM and equity AUM declined in the current year, driven by the equity market sell-off in the fourth quarter of 2018 which resulted in significant market depreciation across all of our product offerings. In addition, equity AUM experienced net client outflows of $0.5 billion during the year, as performance in our small-cap value and small/mid-cap value strategies lagged their respective benchmarks on a three and five year basis, which contributed to client outflows during the year. Also, industry-wide, investors have continued to favor passive investment vehicles over active management during the long bull market.
At December 31, 2017, total AUM was $7.3 billion. MLP AUM decreased to $3.8 billion at December 31, 2017 due to net market depreciation of $0.4 billion and net client outflows of $0.4 billion. The MLP market was challenged during most of the year with valuations declining since the second quarter of 2017. This market dynamic contributed to client outflows in the second half of the year. Equity AUM was $3.6 billion at December 31, 2017, compared to $4.1 billion at December 31, 2016 as net client outflows of $1.0 billion were partially offset by net market appreciation of $0.4 billion. In 2017, the asset management industry continued to be impacted by the trend of investors favoring passive investment vehicles over active management. In addition, performance in our small-cap and small/mid-cap value strategies lagged their respective benchmarks on a three and five year basis, which contributed to client outflows during 2017. Also, in mid-2017, we exited our Japan value product, which reduced AUM by approximately $0.8 billion. The reduction from client outflows in our value equity strategies was partially offset by client inflows into our new global equity strategy in 2017.
Recent Accounting Pronouncements
Recent accounting pronouncements are set forth in Note 3 to our consolidated financial statements included in Part II, Item 8 of this Form 10-K, and are incorporated herein by reference.
45
Critical Accounting Policies
Our accounting and reporting policies comply with U.S. GAAP and conform to practices within the securities industry. The preparation of financial statements in compliance with U.S. GAAP and industry practices requires us to make estimates and assumptions that could materially affect amounts reported in our consolidated financial statements. Critical accounting policies are those policies that we believe to be the most important to the portrayal of our financial condition and results of operations and that require us to make estimates that are difficult, subjective or complex. Most accounting policies are not considered by us to be critical accounting policies. Several factors are considered in determining whether or not a policy is critical, including whether the estimates are significant to the consolidated financial statements taken as a whole, the nature of the estimates, the ability to readily validate the estimates with other information (e.g., third party or independent sources), the sensitivity of the estimates to changes in economic conditions and whether alternative accounting methods may be used under U.S. GAAP.
For a full description of our significant accounting policies, see Note 2 to our consolidated financial statements included in Part II, Item 8 of this Form 10-K. We believe that of our significant accounting policies, the following are our critical accounting policies.
Valuation of Financial Instruments
Financial instruments and other inventory positions owned, financial instruments and other inventory positions sold, but not yet purchased, and certain of our investments recorded in investments on our consolidated statements of financial condition consist of financial instruments recorded at fair value, either as required by accounting guidance or through the fair value election. Unrealized gains and losses related to these financial instruments are reflected on our consolidated statements of operations.
The fair value of a financial instrument is the amount at which the instrument could be exchanged in an orderly transaction between market participants at the measurement date (the exit price). Based on the nature of our business and our role as a "dealer" in the securities industry or as a manager of alternative asset management funds, the fair values of our financial instruments are determined internally. See Note 2 and Note 6 to our consolidated financial statements for additional information on the valuation of our financial instruments and our fair value processes, including specific control processes to determine the reasonableness of the fair value of our financial instruments.
Financial Accounting Standards Board ("FASB") Accounting Standards Codification Topic 820, "Fair Value Measurement," establishes a fair value hierarchy that prioritizes the inputs to valuation techniques used to measure fair value. The hierarchy gives the highest priority to unadjusted quoted prices in active markets for identical assets or liabilities (Level I measurements) and the lowest priority to inputs with little or no pricing observability (Level III measurements). Assets and liabilities are classified in their entirety based on the lowest level of input that is significant to the fair value measurement. See Note 6 to our consolidated financial statements for additional discussion of our assets and liabilities in the fair value hierarchy.
Goodwill and Intangible Assets
We record all assets and liabilities acquired in purchase acquisitions, including goodwill and other intangible assets, at fair value. Determining the fair value of assets and liabilities acquired requires certain management estimates. At December 31, 2018, we had goodwill of $81.9 million, all of which relates to our capital markets segment. At December 31, 2018, we had intangible assets of $12.4 million, of which $4.3 million relates to our capital markets segment and $8.1 million relates to our asset management segment.
We are required to perform impairment tests of our goodwill and indefinite-life intangible assets annually and on an interim basis when circumstances exist that could indicate possible impairment. We have elected to test for goodwill impairment in the fourth quarter of each calendar year. We have the option to first assess qualitative factors to determine whether it is more likely than not that the fair value of a reporting unit is less than its carrying amount. If, after making an assessment, we determine it is not more likely than not that the fair value of a reporting unit is less than its carrying amount, then further analysis is unnecessary. However, if we conclude otherwise, then we are required to perform a quantitative goodwill test, which requires management to make judgments in determining what assumptions to use in the calculation. The quantitative goodwill test compares the fair value of the reporting unit to its carrying value, including allocated goodwill. An impairment is recognized for the excess amount of a reporting unit's carrying value over its fair value. See Note 11 to our consolidated financial statements for additional information on our goodwill impairment testing.

46
The initial recognition of goodwill and other intangible assets and the subsequent quantitative impairment analysis involves significant judgment in determining the estimates of future cash flows, discount rates, economic forecast and other assumptions which are then used in acceptable valuation techniques, such as the market approach (earnings and/or transaction multiples) and/or the income approach (discounted cash flow method). Changes in these estimates and assumptions could have a significant impact on the fair value and any resulting impairment of goodwill. Our estimated cash flows, by their nature, are difficult to determine over an extended time period. Events and factors that may significantly affect the estimates include, among others, competitive forces and changes in revenue growth trends, cost structures, technology, and market conditions. To assess the reasonableness of cash flow estimates and validate assumptions used in our estimates, we review historical performance of the underlying assets or similar assets. In assessing the fair value of our reporting units, the volatile nature of the securities markets and our industry requires us to consider the business and market cycle and assess the stage of the cycle in estimating the timing and extent of future cash flows. In addition to discounted cash flows, we consider earnings multiples of comparable public companies and multiples of recent mergers and acquisitions transactions of similar businesses in our subsequent impairment analysis.
We elected to perform a qualitative assessment to test the goodwill in our capital markets reporting unit for impairment. The following relevant events and circumstances were evaluated in concluding that it was not more likely than not that this goodwill was impaired: macroeconomic conditions, industry and market considerations, and the overall financial performance of the capital markets reporting unit. Our annual goodwill impairment testing, performed as of October 31, 2018, resulted in no impairment associated with the capital markets reporting unit.
We also evaluated intangible assets (indefinite and definite-lived) and concluded there was no impairment in 2018.
Compensation Plans
Stock-Based Compensation Plans
As part of our compensation to employees and directors, we use stock-based compensation, consisting of restricted stock, restricted stock units and stock options. We account for equity awards in accordance with FASB Accounting Standards Codification Topic 718, "Compensation–Stock Compensation," ("ASC 718"), which requires all share-based payments to employees, including grants of employee stock options, to be recognized on the consolidated statements of operations at grant date fair value. Compensation expense related to share-based awards which require future service are amortized over the service period of the award. Forfeitures of awards with service conditions are accounted for when they occur. Share-based awards that do not require future service are recognized in the year in which the awards are deemed to be earned.
See Note 19 to our consolidated financial statements for additional information about our stock-based compensation plans.
Income Taxes
We file a consolidated U.S. federal income tax return, which includes all of our qualifying subsidiaries. We also are subject to income tax in various states and municipalities and those foreign jurisdictions in which we operate. Amounts provided for income taxes are based on income reported for financial statement purposes and do not necessarily represent amounts currently payable. Deferred tax assets and liabilities are recognized for the expected future tax consequences attributable to temporary differences between the financial statement carrying amounts of existing assets and liabilities and their respective tax basis and for tax loss carryforwards. Deferred tax assets and liabilities are measured using enacted tax rates expected to apply to taxable income in the years in which those temporary differences are expected to be recovered or settled. The effect on deferred tax assets and liabilities of a change in tax rates is recognized in income in the period that includes the enactment date. Deferred income taxes are provided for temporary differences in reporting certain items, principally restricted compensation (i.e., restricted stock, restricted stock units, restricted mutual fund shares (MFRS awards), and deferred compensation). The realization of deferred tax assets is assessed and a valuation allowance is recognized to the extent that it is more likely than not that any portion of the deferred tax asset will not be realized. We believe that our future taxable profits will be sufficient to recognize our U.S. deferred tax assets. However, if our projections of future taxable profits do not materialize, we may conclude that a valuation allowance is necessary, which would impact our results of operations in that period. In 2018, we recorded a deferred tax asset valuation allowance of $5.3 million primarily related to net operating loss carryforwards for Piper Jaffray Ltd.
The Tax Cuts and Jobs Act included a corporate federal rate reduction from 35 percent to 21 percent effective in 2018. In addition, certain corporate tax deductions were repealed or amended. For example, corporate tax deductions for certain public

47
company executive compensation in excess of $1 million are no longer allowed. SAB 118 permitted companies to report a provisional amount in the 2017 financial statements if the accounting for income tax effects of the Tax Cuts and Jobs Act was incomplete as of December 31, 2017. This provisional amount would be subject to adjustment in subsequent periods during a defined measurement period, which was limited to one year from the enactment date of December 22, 2017. Pursuant to SAB 118, we recorded an additional $1.0 million of income tax expense in 2018 for the remeasurement of our deferred tax assets at the lower enacted federal corporate tax rate. The accounting for the income tax effects of the Tax Cuts and Jobs Act is complete as of December 31, 2018.
We record deferred tax benefits for future tax deductions expected upon the vesting of stock-based compensation. We recognize the income tax effects of stock-based compensation awards in the income statement when the awards vest. If deductions reported on our tax return for stock-based compensation (i.e., the value of the stock-based compensation at the time of vesting) exceed the cumulative cost of those instruments recognized for financial reporting (i.e., the grant date fair value of the compensation computed in accordance with ASC 718), we record the excess tax benefit as income tax benefit. Conversely, if deductions reported on our tax return for stock-based compensation are less than the cumulative cost of those instruments recognized for financial reporting, the deficiency is recorded as income tax expense. For the year ended December 31, 2018, we recorded a $7.1 million tax benefit for stock awards vesting during the period. In the first quarter of 2019, approximately 418,000 shares vested at share prices greater than the grant date fair value, resulting in $1.7 million of excess tax benefits recorded as income tax benefit in the first quarter of 2019.
We establish reserves for uncertain income tax positions in accordance with FASB Accounting Standards Codification Topic 740, "Income Taxes," when it is not more likely than not that a certain position or component of a position will be ultimately upheld by the relevant taxing authorities. Significant judgment is required in evaluating uncertain tax positions. Our tax provision and related accruals include the impact of estimates for uncertain tax positions and changes to the reserves that are considered appropriate. To the extent the probable tax outcome of these matters changes, such change in estimate will impact the income tax provision in the period of change and, in turn, our results of operations.
Liquidity, Funding and Capital Resources
Liquidity is of critical importance to us given the nature of our business. Insufficient liquidity resulting from adverse circumstances contributes to, and may be the cause of, financial institution failure. Accordingly, we regularly monitor our liquidity position and maintain a liquidity strategy designed to enable our business to continue to operate even under adverse circumstances, although there can be no assurance that our strategy will be successful under all circumstances.
The majority of our tangible assets consist of assets readily convertible into cash. Financial instruments and other inventory positions owned are stated at fair value and are generally readily marketable in most market conditions. Receivables and payables with brokers, dealers and clearing organizations usually settle within a few days. As part of our liquidity strategy, we emphasize diversification of funding sources to the extent possible while considering tenor and cost. Our assets are financed by our cash flows from operations, equity capital, and our funding arrangements. The fluctuations in cash flows from financing activities are directly related to daily operating activities from our various businesses. One of our most important risk management disciplines is our ability to manage the size and composition of our balance sheet. While our asset base changes due to client activity, market fluctuations and business opportunities, the size and composition of our balance sheet reflect our overall risk tolerance, our ability to access stable funding sources and the amount of equity capital we hold.
Certain market conditions can impact the liquidity of our inventory positions, requiring us to hold larger inventory positions for longer than expected or requiring us to take other actions that may adversely impact our results.
A significant component of our employees' compensation is paid in annual discretionary incentive compensation. The timing of these incentive compensation payments, which generally are made in February, has a significant impact on our cash position and liquidity.
Beginning in 2017, we initiated the payment of a quarterly cash dividend to holders of our common stock, which included unvested restricted shares. Our board of directors also approved a dividend policy intended to return between 30 percent and 50 percent of our adjusted net income from the previous fiscal year to shareholders. This includes an annual special cash dividend, payable in the first quarter of each year. Our board of directors determines the declaration and payment of dividends on an annual and quarterly basis, and is free to change our dividend policy at any time.

48
Our board of directors declared the following dividends:
Declaration DateDividend
Per Share Record Date Payment DateFebruary 2, 2017 ..................... $ 0.3125 February 20, 2017 March 13, 2017April 27, 2017 ......................... $ 0.3125 May 26, 2017 June 15, 2017July 27, 2017 ........................... $ 0.3125 August 28, 2017 September 15, 2017October 26, 2017..................... $ 0.3125 November 29, 2017 December 15, 2017February 1, 2018 (1)................ $ 1.6200 February 26, 2018 March 15, 2018February 1, 2018 ..................... $ 0.3750 February 26, 2018 March 15, 2018April 27, 2018 ......................... $ 0.3750 May 25, 2018 June 15, 2018July 27, 2018 ........................... $ 0.3750 August 24, 2018 September 14, 2018October 26, 2018..................... $ 0.3750 November 28, 2018 December 14, 2018February 1, 2019 (2)................ $ 1.0100 February 25, 2019 March 15, 2019February 1, 2019 ..................... $ 0.3750 February 25, 2019 March 15, 2019(1) Represents the annual special cash dividend based on fiscal year 2017 results.(2) Represents the annual special cash dividend based on fiscal year 2018 results.
Our board of directors has declared a special cash dividend on the company's common stock of $1.01 per share related to 2018 adjusted net income. This special dividend will be paid on March 15, 2019, to shareholders of record as of the close of business on February 25, 2019. Including this special cash dividend and the regular quarterly dividends totaling $1.50 per share paid during 2018, we will have returned $2.51 per share, or approximately 40 percent of our fiscal year 2018 adjusted net income to shareholders.
Effective September 30, 2017, our board of directors authorized the repurchase of up to $150.0 million in common shares through September 30, 2019. During 2018, we repurchased 681,233 shares of our common stock at an average price of $69.20per share for an aggregate purchase price of $47.1 million related to this authorization. We have $102.9 million remaining under this authorization.
We also purchase shares of common stock from restricted stock award recipients upon the award vesting as recipients sell shares to meet their employment tax obligations. During 2018, we purchased 279,664 shares or $23.8 million of our common stock for this purpose.
Cash Flows
Cash, cash equivalents and restricted cash at December 31, 2018 were $50.4 million, an increase of $16.6 million from December 31, 2017. Operating activities provided $509.9 million of cash, primarily due to cash generated from earnings as well as reductions in operating assets, most notably a $534.4 million decrease in net financial instruments and other inventory positions owned, as we discontinued certain of our strategic trading activities in municipal securities and reduced inventories to navigate the challenging fixed income market we experienced in 2018. Partially offsetting this decline were increases in our receivables from brokers, dealers and clearing organizations related to Pershing LLC ("Pershing"), our clearing broker dealer. Decreases in operating liabilities was primarily driven by a decrease in accrued compensation of $61.5 million, the result of lower compensation costs in 2018 resulting from decreased revenues. In 2018, investing activities used $15.9 million of cash for the purchase of fixed assets. Cash of $476.8 million was used in financing activities as we reduced amounts due under our short-term financing by $240.0 million, through the closure of our prime brokerage arrangement related to our strategic trading activities in municipal securities. Also, we repurchased $70.9 million of our common stock, paid $47.2 million in dividends, and repaid our $125.0 million Class C fixed rate senior notes in full on the October 9, 2018 maturity date.
Cash, cash equivalents and restricted cash decreased $36.6 million to $33.8 million at December 31, 2017 from December 31, 2016. Operating activities provided $203.1 million of cash, as non-cash charges and decreases in operating assets were partially offset by an increase in operating liabilities. Our $59.6 million net loss in 2017 included non-cash charges of $114.4 million related to goodwill impairment, $54.2 million for the remeasurement of our deferred tax assets arising from the enactment of the Tax Cuts and Jobs Act and the lower federal corporate tax rate of 21 percent, and $15.4 million of intangible asset amortization. In 2017, we migrated to a fully disclosed clearing model and are no longer self clearing. This conversion resulted in a decrease in net operating assets related to the clearing and carrying of customer accounts as Pershing now facilitates our clearing and

49
holds our customer accounts. This decrease was partially offset by an increase in inventory balances, particularly municipal securities, driven by a trading opportunity in the municipal market identified at the end of the year. The increase in operating liabilities was primarily driven by an increase in accrued compensation of $109.1 million, the result of higher compensation costs in 2017 resulting from increased revenues. Investing activities in 2017 used $8.1 million of cash for the purchase of fixed assets. Cash of $233.1 million was used in financing activities as we reduced amounts due under our short-term financing by $128.9 million, primarily by decreasing our commercial paper funding as our clearing relationship with Pershing provided another source of financing. In addition, we repaid our $50.0 million Class A variable rate senior notes in full on the May 31, 2017 maturity date.
Cash, cash equivalents and restricted cash decreased $200.6 million to $70.4 million at December 31, 2016 from December 31, 2015. Operating activities used $3.2 million of cash, as non-cash charges were offset by an increase in operating assets. Our $13.7 million net loss in 2016 included non-cash charges of $82.9 million related to goodwill impairment and $21.2 million of intangible asset amortization. The increase in intangible asset amortization was due to incremental expense related to our acquisitions of Simmons, River Branch Holdings LLC and BMO Capital Markets GKST Inc. The increase in operating assets primarily related to a receivable for unsettled trades, reverse repurchase agreements, which are principally used to make delivery on securities sold short, and additional investments in our senior living fund. Investing activities in 2016 used $83.7 million of which $72.7 million related to the acquisition of Simmons, and $11.0 million for the purchase of fixed assets. In 2016, financing activities used $111.6 million of cash as we repurchased $70.9 million of common stock. In addition, we used excess cash of $27.4 million to reduce amounts due under our short-term financing, primarily related to commercial paper, and also decreased our obligations related to repurchase agreements.
Leverage
The following table presents total assets, adjusted assets, total shareholders' equity and tangible shareholders' equity with the resulting leverage ratios as of:
December 31, December 31,(Dollars in thousands) 2018 2017Total assets.................................................................................................................. $ 1,345,269 $ 2,024,683Deduct: Goodwill and intangible assets ..................................................................... (94,229) (104,689)Deduct: Assets from noncontrolling interests............................................................. (53,558) (54,917)Adjusted assets............................................................................................................ $ 1,197,482 $ 1,865,077
Total shareholders' equity ........................................................................................... $ 730,416 $ 741,235Deduct: Goodwill and intangible assets ..................................................................... (94,229) (104,689)Deduct: Noncontrolling interests................................................................................ (52,972) (47,903)Tangible common shareholders' equity ...................................................................... $ 583,215 $ 588,643
Leverage ratio (1) ....................................................................................................... 1.8 2.7
Adjusted leverage ratio (2) ......................................................................................... 2.1 3.2(1) Leverage ratio equals total assets divided by total shareholders' equity.(2) Adjusted leverage ratio equals adjusted assets divided by tangible common shareholders' equity.
Adjusted assets and tangible common shareholders' equity are non-GAAP financial measures. Goodwill and intangible assets are subtracted from total assets and total shareholders' equity in determining adjusted assets and tangible common shareholders' equity, respectively, as we believe that goodwill and intangible assets do not constitute operating assets which can be deployed in a liquid manner. Amounts attributed to noncontrolling interests are subtracted from total assets and total shareholders' equity in determining adjusted assets and tangible common shareholders' equity, respectively, as they represent assets and equity interests in consolidated entities that are not attributable, either directly or indirectly, to Piper Jaffray Companies. We view the resulting measure of adjusted leverage, also a non-GAAP financial measure, as a more relevant measure of financial risk when comparing financial services companies. Our adjusted leverage ratio decreased from December 31, 2017 due to lower inventory balances. As of December 31, 2018, our inventory balance was $627.2 million, down 54.7 percent from $1.4 billionat the end of 2017. Inventory levels in 2019 will be dependent upon client demand and market opportunities.

50
Funding and Capital Resources
The primary goal of our funding activities is to ensure adequate funding over a wide range of market conditions. Given the mix of our business activities, funding requirements are fulfilled through a diversified range of short-term and long-term financing. We attempt to ensure that the tenor of our borrowing liabilities equals or exceeds the expected holding period of the assets being financed. Our ability to support increases in total assets is largely a function of our ability to obtain funding from external sources. Access to these external sources, as well as the cost of that financing, is dependent upon various factors, including market conditions, the general availability of credit and credit ratings. We currently do not have a credit rating, which could adversely affect our liquidity and competitive position by increasing our financing costs and limiting access to sources of liquidity that require a credit rating as a condition to providing the funds.
In 2017, we migrated to a fully disclosed clearing model and are no longer self clearing. Pershing is our clearing broker dealer. The conversion provided us with a new funding source through Pershing and, as a result, changed our mix of funding sources.
Our day-to-day funding and liquidity is obtained primarily through the use of our clearing arrangement with Pershing, commercial paper issuance, prime broker agreements, and bank lines of credit, and is typically collateralized by our securities inventory. These funding sources are critical to our ability to finance and hold inventory, which is a necessary part of our institutional brokerage business. The majority of our inventory is liquid and is therefore funded by short-term facilities. Certain of these short-term facilities (i.e., committed line and commercial paper) have been established to mitigate changes in the liquidity of our inventory based on changing market conditions. In the case of our committed line, it is available to us regardless of changes in market liquidity conditions through the end of its term, although there may be limitations on the type of securities available to pledge. Our commercial paper program helps mitigate changes in market liquidity conditions given it is not an overnight facility, but provides funding with a term of 27 to 270 days. Our funding sources are also dependent on the types of inventory that our counterparties are willing to accept as collateral and the number of counterparties available. Funding is generally obtained at rates based upon the federal funds rate or the London Interbank Offer Rate.
Pershing Clearing Arrangement – We have established an arrangement to obtain financing from Pershing related to the majority of our trading activities. Under our fully disclosed clearing agreement, the majority of our securities inventories and all of our customer activities are held by or cleared through Pershing. Financing under this arrangement is secured primarily by securities, and collateral limitations could reduce the amount of funding available under this arrangement. Our clearing arrangement activities are recorded net from trading activity and reported within receivables from or payables to brokers, dealers and clearing organizations. The funding is at the discretion of Pershing (i.e., uncommitted) and could be denied without a notice period. Our fully disclosed clearing agreement includes a covenant requiring Piper Jaffray & Co. to maintain excess net capital of $120 million. At December 31, 2018, we had no financing outstanding under this arrangement.
Commercial Paper Program – Our U.S. broker dealer subsidiary, Piper Jaffray & Co., issues secured commercial paper to fund a portion of its securities inventory. This commercial paper is currently issued under two separate programs, CP Series A and CP Series II A, and is secured by different inventory classes, which is reflected in the interest rate paid on the respective program. The programs can issue commercial paper with maturities of 27 to 270 days. CP Series II A includes a covenant that requires Piper Jaffray & Co. to maintain excess net capital of $100 million. The following table provides information about our commercial paper programs at December 31, 2018:
(Dollars in millions) CP Series A CP Series II AMaximum amount that may be issued............................................................... $ 300.0 $ 200.0Amount outstanding .......................................................................................... — 50.0
Weighted average maturity, in days................................................................... — 10Weighted average maturity at issuance, in days ................................................ — 31
Prime Broker Arrangements – We have established an overnight financing arrangement with a broker dealer related to our convertible securities inventories. Financing under this arrangement is secured primarily by convertible securities and collateral limitations could reduce the amount of funding available. The funding is at the discretion of the prime broker and could be denied subject to a notice period. This arrangement is reported within receivables from or payables to brokers, dealers and clearing organizations, net of trading activity. At December 31, 2018, we had $86.0 million of financing outstanding under this prime broker arrangement.

51
Additionally, we previously established an arrangement to obtain overnight financing with another prime broker related to certain strategic trading activities in municipal securities. We completed the liquidation of the municipal securities inventories associated with these strategic trading activities in the third quarter of 2018, and have closed this prime broker arrangement as we no longer have a need for the funding source. Our prime broker financing activities were recorded net of receivables from trading activity.
Committed Line – We elected to decrease our committed line from $200 million to a one-year $175 million revolving secured credit facility in the fourth quarter of 2018. Given our reduced inventory levels, and status as an introducing broker dealer clearing through Pershing, we have reduced liquidity needs. We may use this credit facility in the ordinary course of business to fund a portion of our daily operations. Advances under this facility are secured by certain marketable securities. The facility includes a covenant that requires Piper Jaffray & Co. to maintain minimum net capital of $120 million, and the unpaid principal amount of all advances under the facility will be due on December 13, 2019. This credit facility has been in place since 2008 and we renewed the facility for another one-year term in the fourth quarter of 2018. At December 31, 2018, we had noadvances against this line of credit.
Uncommitted Line – We use this uncommitted line in the ordinary course of business to fund a portion of our daily operations, and the amount borrowed under our uncommitted line varies daily based on our funding needs. Our $85 million uncommitted secured line is dependent on having appropriate collateral, as determined by the bank agreement, to secure an advance under the line. Collateral limitations could reduce the amount of funding available under this secured line. Our uncommitted line is discretionary and is not a commitment by the bank to provide an advance under the line. More specifically, the line is subject to approval by the bank each time an advance is requested and advances may be denied, which may be particularly true during times of market stress or market perceptions of our exposures. We manage our relationship with the bank that provides this uncommitted facility in order to have appropriate levels of funding for our business. At December 31, 2018, we had no advances against this line of credit.
The following tables present the average balances outstanding for our various funding sources by quarter for 2018 and 2017, respectively.
Average Balance for the Three Months Ended(Dollars in millions) Dec. 31, 2018 Sept. 30, 2018 June 30, 2018 Mar. 31, 2018Funding source:Pershing clearing arrangement .......................... $ 79.6 $ 3.0 $ 90.0 $ 47.1Commercial paper ............................................. 50.0 50.0 50.0 50.0Prime broker arrangements................................ 85.2 112.7 218.8 336.5Short-term bank loans........................................ — — — —Total ................................................................... $ 214.8 $ 165.7 $ 358.8 $ 433.6
Average Balance for the Three Months Ended(Dollars in millions) Dec. 31, 2017 Sept. 30, 2017 June 30, 2017 Mar. 31, 2017Funding source:Pershing clearing arrangement .......................... $ 20.6 $ 26.3 $ — $ —Commercial paper ............................................. 49.5 30.3 117.1 137.7Prime broker arrangements................................ 221.1 175.2 192.6 204.9Short-term bank loans........................................ — 6.0 67.1 2.5Total ................................................................... $ 291.2 $ 237.8 $ 376.8 $ 345.1
The average funding in the fourth quarter of 2018 increased to $214.8 million, compared with $165.7 million during the third quarter of 2018, as cash was used for share repurchases and the repayment of the fixed rate Class C senior notes on the October 9, 2018 maturity date. Average funding decreased from $291.2 million in the corresponding period of 2017 due to a decrease in inventory balances. In the fourth quarter of 2017, we increased the average funding of our prime broker arrangements in order to take advantage of a trading opportunity in the municipal market.

52
The following table presents the maximum daily funding amount by quarter for 2018 and 2017, respectively.
(Dollars in millions) 2018 2017First Quarter.................................................................................................................... $ 613.1 $ 543.4Second Quarter ............................................................................................................... $ 505.0 $ 538.3Third Quarter .................................................................................................................. $ 263.5 $ 418.7Fourth Quarter ................................................................................................................ $ 312.3 $ 569.9
Senior Notes
We entered into fixed and variable rate senior notes with certain entities advised by Pacific Investment Management Company. On October 8, 2015, we issued $125 million of Class C Notes. The Class C Notes were repaid in full on the October 9, 2018 maturity date. The $50 million of variable rate Class A Notes issued in 2014 were repaid in full on the May 31, 2017 maturity date.
Given our level of capital and strong cash generation from earnings, we elected not to renew our long-term borrowings in 2018.
Contractual Obligations
In the normal course of business, we enter into various contractual obligations that may require future cash payments. The following table summarizes the contractual amounts at December 31, 2018, in total and by remaining maturity. Excluded from the table are a number of obligations recorded on the consolidated statements of financial condition that generally are short-term in nature, including secured financing transactions, trading liabilities, short-term borrowings and other payables and accrued liabilities. The amounts presented in the table below may not necessarily reflect our actual future cash funding requirements, because the actual timing of the future payments made may vary from the stated contractual obligation.
2020 2022 2024 and(Dollars in millions) 2019 - 2021 - 2023 thereafter TotalOperating lease obligations ........... $ 13.8 $ 23.0 $ 15.1 $ 15.8 $ 67.7Purchase commitments ................. 18.5 11.9 6.3 10.5 47.2Investment commitments (1) ........ — — — — 78.0
(1) The investment commitments have no specified call dates. The timing of capital calls is based on market conditions and investment opportunities.
Purchase commitments include agreements to purchase goods or services that are enforceable and legally binding and that specify all significant terms, including fixed or minimum quantities to be purchased, fixed, minimum or variable price provisions, and the approximate timing of the transaction. Purchase commitments with variable pricing provisions are included in the table based on the minimum contractual amounts. Certain purchase commitments contain termination or renewal provisions. The table reflects the minimum contractual amounts likely to be paid under these agreements assuming the contracts are not terminated.
New Leases Guidance
As discussed in Note 3 to our consolidated financial statements, we will adopt new accounting guidance related to leases effective as of January 1, 2019. The guidance requires lessees to recognize a right-of-use asset and lease liability on the consolidated statements of financial condition for all leases with a term greater than 12 months. Upon adoption, we estimate that we will recognize a right-of-use asset of approximately $44.0 million and a lease liability of approximately $59.0 million. The difference between the right-of-use asset and lease liability is due to lease incentives. The new guidance is not expected to impact Piper Jaffray & Co.'s net capital position.

53
Capital Requirements
As a registered broker dealer and member firm of the Financial Industry Regulatory Authority, Inc. ("FINRA"), Piper Jaffray & Co., our U.S. broker dealer subsidiary, is subject to the uniform net capital rule of the SEC and the net capital rule of FINRA. We have elected to use the alternative method permitted by the uniform net capital rule which requires that we maintain minimum net capital of $1.0 million. Advances to affiliates, repayment of subordinated liabilities, dividend payments and other equity withdrawals are subject to certain approvals, notifications and other provisions of the uniform net capital rules. We expect that these provisions will not impact our ability to meet current and future obligations. At December 31, 2018, our net capital under the SEC's uniform net capital rule was $222.3 million, and exceeded the minimum net capital required under the SEC rule by $221.3 million.
Although we operate with a level of net capital substantially greater than the minimum thresholds established by FINRA and the SEC, a substantial reduction of our capital would curtail many of our Capital Markets revenue producing activities.
Our committed short-term credit facility includes a covenant requiring Piper Jaffray & Co. to maintain minimum net capital of $120 million. Secured commercial paper issued under CP Series II A includes a covenant that requires Piper Jaffray & Co. to maintain excess net capital of $100 million. Our fully disclosed clearing agreement with Pershing also includes a covenant requiring Piper Jaffray & Co. to maintain excess net capital of $120 million.
At December 31, 2018, Piper Jaffray Ltd., our broker dealer subsidiary registered in the United Kingdom, was subject to, and was in compliance with, the capital requirements of the Prudential Regulation Authority and the Financial Conduct Authority pursuant to the Financial Services Act of 2012.
Piper Jaffray Hong Kong Limited is licensed by the Hong Kong Securities and Futures Commission, which is subject to the liquid capital requirements of the Securities and Futures (Financial Resources) Rule promulgated under the Securities and Futures Ordinance. At December 31, 2018, Piper Jaffray Hong Kong Limited was in compliance with the liquid capital requirements of the Hong Kong Securities and Trade Commission.
Off-Balance Sheet Arrangements
In the ordinary course of business we enter into various types of off-balance sheet arrangements. The following table summarizes the notional contract value of our off-balance sheet arrangements for the periods presented:
Expiration Per Period at December 31, Total Contractual Amount2022 2024 December 31, December 31,
(Dollars in thousands) 2019 2020 2021 - 2023 - 2025 Later 2018 2017Customer matched-book
derivative contracts (1) (2) ..... $ 31,050 $ 21,590 $ 10,280 $ 128,630 $ 309,888 $2,031,528 $ 2,532,966 $ 2,819,006
Trading securities derivativecontracts (2)............................ 252,900 — — — — 9,375 262,275 399,450
Equity option derivativecontracts (2)............................ — — — — — — — 9,635
Investment commitments (3).... — — — — — — 77,984 72,467
(1) Consists of interest rate swaps. We have minimal market risk related to these matched-book derivative contracts; however, we do have counterparty risk with one major financial institution, which is mitigated by collateral deposits. In addition, we have a limited number of counterparties (contractual amount of $176.8 million at December 31, 2018) who are not required to post collateral. The uncollateralized amounts, representing the fair value of the derivative contracts, expose us to the credit risk of these counterparties. At December 31, 2018, we had $15.9 million of credit exposure with these counterparties, including $12.5 million of credit exposure with one counterparty.
(2) We believe the fair value of these derivative contracts is a more relevant measure of the obligations because we believe the notional or contract amount overstates the expected payout. At December 31, 2018 and December 31, 2017, the net fair value of these derivative contracts approximated $12.5 millionand $20.5 million, respectively.
(3) The investment commitments have no specified call dates. The timing of capital calls is based on market conditions and investment opportunities.

54
Derivatives
Derivatives' notional or contract amounts are not reflected as assets or liabilities on our consolidated statements of financial condition. Rather, the fair value of the derivative transactions are reported on the consolidated statements of financial condition as assets or liabilities in financial instruments and other inventory positions owned and financial instruments and other inventory positions sold, but not yet purchased, as applicable. For a discussion of our activities related to derivative products, see Note 5, "Financial Instruments and Other Inventory Positions Owned and Financial Instruments and Other Inventory Positions Sold, but Not Yet Purchased," in the notes to our consolidated financial statements.
Investment Commitments
We have investments, including those made as part of our merchant banking activities, in various limited partnerships or limited liability companies that provide financing or make investments in companies. We commit capital and/or act as the managing partner of these entities. For additional information on our activities related to these types of entities, see Note 7, "Variable Interest Entities," in the notes to our consolidated financial statements. We have committed capital of $78.0 millionto certain entities and these commitments generally have no specified call dates.
Risk Management
Risk is an inherent part of our business. The principal risks we face in operating our business include: strategic risk, market risk, liquidity risk, credit risk, operational risk, human capital risk, and legal and regulatory risks. The extent to which we properly identify and effectively manage each of these risks is critical to our financial condition and profitability. We have a formal risk management process to identify, assess and monitor each risk and mitigating controls in accordance with defined policies and procedures. The risk management functions are independent of our business lines. Our management takes an active role in the risk management process, and the results are reported to senior management and the Board of Directors.
The audit committee of the Board of Directors oversees management's processes for identifying and evaluating our major risks, and the policies, procedures and practices employed by management to govern its risk assessment and risk management processes. The nominating and governance committee of the Board of Directors oversees the Board of Directors' committee structures and functions as they relate to the various committees' responsibilities with respect to oversight of our major risk exposures. With respect to these major risk exposures, the audit committee is responsible for overseeing management's monitoring and control of our major risk exposures relating to market risk, credit risk, liquidity risk, legal and regulatory risks, operational risk (including cybersecurity), and human capital risk relating to misconduct, fraud, and legal and compliance matters. Our compensation committee is responsible for overseeing management's monitoring and control of our major risk exposures relating to compensation, organizational structure, and succession. Our Board of Directors is responsible for overseeing management's monitoring and control of our major risk exposures related to our corporate strategy. Our Chief Executive Officer and Chief Financial Officer meet with the audit committee on a quarterly basis to discuss our market, liquidity, and legal and regulatory risks, and provide updates to the Board of Directors, audit committee, and compensation committee concerning the other major risk exposures on a regular basis.
We use internal committees to assist in governing risk and ensure that our business activities are properly assessed, monitored and managed. Our financial risk committee manages our market, liquidity and credit risks, and oversees risk management practices related to these risks, including defining acceptable risk tolerances and approving risk management policies. Membership is comprised of senior leadership. A subset of this group, including but not limited to, our Chief Executive Officer, President, Chief Financial Officer, Treasurer, Head of Market and Credit Risk, and Head of Fixed Income Trading, meets with increased frequency to evaluate the firm's inventory position, and respond to market changes in a dynamic manner. Other committees that help evaluate and monitor risk include underwriting, leadership team and operating committees. These committees help manage risk by ensuring that business activities are properly managed and within a defined scope of activity. Our valuation committee, comprised of members of senior management and risk management, provide oversight and overall responsibility for the internal control processes and procedures related to fair value measurements. Additionally, our operational risk committees address and monitor risk related to information systems and security, legal, regulatory and compliance matters, and third parties such as vendors and service providers.

55
With respect to market risk and credit risk, the cornerstone of our risk management process is daily communication among traders, trading department management and senior management concerning our inventory positions, including those associated with our strategic trading activities, and overall risk profile. Our risk management functions supplement this communication process by providing their independent perspectives on our market and credit risk profile on a daily basis. The broader objectives of our risk management functions are to understand the risk profile of each trading area, to consolidate risk monitoring company-wide, to assist in implementing effective hedging strategies, to articulate large trading or position risks to senior management, and to ensure accurate fair values of our financial instruments.
Risk management techniques, processes and strategies may not be fully effective in mitigating our risk exposure in all market environments or against all types of risk, and any risk management failures could expose us to material unanticipated losses.
Strategic Risk
Strategic risk represents the risk associated with executive management failing to develop and execute on the appropriate strategic vision which demonstrates a commitment to our culture, leverages our core competencies, appropriately responds to external factors in the marketplace, and is in the best interests of our clients, employees and shareholders.
Our leadership team is responsible for managing our strategic risks. The Board of Directors oversees the leadership team in setting and executing our strategic plan.
Market Risk
Market risk represents the risk of losses, or financial volatility, that may result from the change in value of a financial instrument due to fluctuations in its market price. Our exposure to market risk is directly related to our role as a financial intermediary for our clients, to our market-making activities and our strategic trading activities. Market risks are inherent to both cash and derivative financial instruments. The scope of our market risk management policies and procedures includes all market-sensitive financial instruments.
Our different types of market risk include:
Interest Rate Risk — Interest rate risk represents the potential volatility from changes in market interest rates. We are exposed to interest rate risk arising from changes in the level and volatility of interest rates, changes in the slope of the yield curve, changes in credit spreads, and the rate of prepayments on our interest-earning assets (e.g., inventories) and our funding sources (e.g., short-term financing) which finance these assets. Interest rate risk is managed by selling short U.S. government securities, agency securities, corporate debt securities and derivative contracts. See Note 5 of our accompanying consolidated financial statements for additional information on our derivative contracts. Our interest rate hedging strategies may not work in all market environments and as a result may not be effective in mitigating interest rate risk. Also, we establish limits on the notional level of our fixed income securities inventory and manage net positions within those limits.
Equity Price Risk — Equity price risk represents the potential loss in value due to adverse changes in the level or volatility of equity prices. We are exposed to equity price risk through our trading activities in the U.S. market. We attempt to reduce the risk of loss inherent in our market-making and in our inventory of equity securities by establishing limits on the notional level of our inventory and by managing net position levels within those limits.
Foreign Exchange Risk — Foreign exchange risk represents the potential volatility to earnings or capital arising from movement in foreign exchange rates. A modest portion of our business is conducted in currencies other than the U.S. dollar, and changes in foreign exchange rates relative to the U.S. dollar can therefore affect the value of non-U.S. dollar net assets, revenues and expenses. A change in the foreign currency rates could create either a foreign currency transaction gain/loss (recorded in our consolidated statements of operations) or a foreign currency translation adjustment (recorded to accumulated other comprehensive income/(loss) within the shareholders' equity section of our consolidated statements of financial condition and other comprehensive income/(loss) within the consolidated statements of comprehensive income).

56
Value-at-Risk ("VaR")
We use the statistical technique known as VaR to measure, monitor and review the market risk exposures in our trading portfolios. VaR is the potential loss in value of our trading positions, excluding noncontrolling interests, due to adverse market movements over a defined time horizon with a specified confidence level. We perform a daily VaR analysis on substantially all of our trading positions, including fixed income, equities, convertible bonds, mortgage-backed securities and all associated economic hedges. These positions encompass both customer-related and strategic trading activities. A VaR model provides a common metric for assessing market risk across business lines and products. Changes in VaR between reporting periods are generally due to changes in levels of risk exposure, volatilities and/or correlations among asset classes and individual securities.
We use a Monte Carlo simulation methodology for VaR calculations. We believe this methodology provides VaR results that properly reflect the risk profile of all our instruments, including those that contain optionality, and also accurately models correlation movements among all of our asset classes. In addition, it provides improved tail results as there are no assumptions of distribution, and can provide additional insight for scenario shock analysis.
Model-based VaR derived from simulation has inherent limitations including: reliance on historical data to predict future market risk; VaR calculated using a one-day time horizon does not fully capture the market risk of positions that cannot be liquidated or offset with hedges within one day; and published VaR results reflect past trading positions while future risk depends on future positions.
The modeling of the market risk characteristics of our trading positions involves a number of assumptions and approximations. While we believe that these assumptions and approximations are reasonable, different assumptions and approximations could produce materially different VaR estimates. When comparing our VaR numbers to those of other firms, it is important to remember that different methodologies, assumptions and approximations could produce significantly different results.
The following table quantifies the model-based VaR simulated for each component of market risk for the periods presented, which are computed using the past 250 days of historical data. When calculating VaR we use a 95 percent confidence level and a one-day time horizon. This means that, over time, there is a one in 20 chance that daily trading net revenues will fall below the expected daily trading net revenues by an amount at least as large as the reported VaR. Shortfalls on a single day can exceed reported VaR by significant amounts. Shortfalls can also accumulate over a longer time horizon, such as a number of consecutive trading days. Therefore, there can be no assurance that actual losses occurring on any given day arising from changes in market conditions will not exceed the VaR amounts shown below or that such losses will not occur more than once in a 20-day trading period.
December 31, December 31,(Dollars in thousands) 2018 2017Interest Rate Risk............................................................................................................ $ 370 $ 965Equity Price Risk ............................................................................................................ 49 62Diversification Effect (1) ................................................................................................ (40) (40)Total Value-at-Risk ......................................................................................................... $ 379 $ 987(1) Equals the difference between total VaR and the sum of the VaRs for the two risk categories. This effect arises because the two market risk categories are
not perfectly correlated.
The aggregate VaR as of December 31, 2018 was lower than the reported VaR on December 31, 2017. The decrease in VaR was due to lower inventory levels and our mix of inventory compared to the end of 2017.

57
We view average VaR over a period of time as more representative of trends in the business than VaR at any single point in time. The table below illustrates the daily high, low and average VaR calculated for each component of market risk during the years ended December 31, 2018 and 2017, respectively.
(Dollars in thousands) High Low AverageFor the Year Ended December 31, 2018Interest Rate Risk ............................................................................ $ 1,084 $ 268 $ 631Equity Price Risk............................................................................. 91 21 54Diversification Effect (1)................................................................. (40)Total Value-at-Risk .......................................................................... $ 1,101 $ 277 $ 645
(Dollars in thousands) High Low AverageFor the Year Ended December 31, 2017Interest Rate Risk ............................................................................ $ 1,235 $ 480 $ 785Equity Price Risk............................................................................. 178 28 81Diversification Effect (1)................................................................. (57)Total Value-at-Risk .......................................................................... $ 1,244 $ 506 $ 809
(1) Equals the difference between total VaR and the sum of the VaRs for the two risk categories. This effect arises because the two market risk categories are not perfectly correlated. Because high and low VaR numbers for these risk categories may have occurred on different days, high and low numbers for diversification benefit would not be meaningful.
Trading losses exceeded our one-day VaR on four occasions during 2018.
In addition to VaR, we also employ additional measures to monitor and manage market risk exposure including net market position, duration exposure, option sensitivities, and inventory turnover. All metrics are aggregated by asset concentration and are used for monitoring limits and exception approvals. In times of market volatility, we also perform ad hoc stress tests and scenario analysis as market conditions dictate. Unlike our VaR, which measures potential losses within a given confidence level, stress scenarios do not have an associated implied probability. Rather, stress testing is used to estimate the potential loss from market moves outside our VaR confidence levels.
Liquidity Risk
Liquidity risk is the risk that we are unable to timely access necessary funding sources in order to operate our business, as well as the risk that we are unable to timely divest securities that we hold in connection with our market-making, sales and trading, and strategic trading activities. We are exposed to liquidity risk in our day-to-day funding activities, by holding potentially illiquid inventory positions and in our role as a remarketing agent for variable rate demand notes.
See the section entitled "Liquidity, Funding and Capital Resources" for information regarding our liquidity and how we manage liquidity risk.
Our inventory positions, including those associated with strategic trading activities, subject us to potential financial losses from the reduction in value of illiquid positions. Market risk can be exacerbated in times of trading illiquidity when market participants refrain from transacting in normal quantities and/or at normal bid-offer spreads. Depending on the specific security, the structure of the financial product, and/or overall market conditions, we may be forced to hold a security for substantially longer than we had planned or forced to liquidate into a challenging market if funding becomes unavailable.
Credit Risk
Credit risk refers to the potential for loss due to the default or deterioration in credit quality of a counterparty, customer, borrower or issuer of securities we hold in our trading inventory. The nature and amount of credit risk depends on the type of transaction, the structure and duration of that transaction and the parties involved. Credit risk also results from an obligor's failure to meet the terms of any contract with us or otherwise fail to perform as agreed. This may be reflected through issues such as settlement obligations or payment collections.
58
Our different types of credit risk include:
Credit Spread Risk — Credit spread risk arises from the possibility that changes in credit spreads will affect the value of financial instruments. Credit spreads represent the credit risk premiums required by market participants for a given credit quality (e.g., the additional yield that a debt instrument issued by a AA-rated entity must produce over a risk-free alternative). Changes in credit spreads result from potential changes in an issuer's credit rating or the market's perception of the issuer's credit worthiness. We are exposed to credit spread risk with the debt instruments held in our trading inventory, including those held for strategic trading activities. We enter into transactions to hedge our exposure to credit spread risk through the use of derivatives and certain other financial instruments. These hedging strategies may not work in all market environments and as a result may not be effective in mitigating credit spread risk.
Deterioration/Default Risk — Deterioration/default risk represents the risk due to an issuer, counterparty or borrower failing to fulfill its obligations. We are exposed to deterioration/default risk in our role as a trading counterparty to dealers and customers, as a holder of securities, and as a member of exchanges. The risk of default depends on the creditworthiness of the counterparty and/or issuer of the security. We mitigate this risk by establishing and monitoring individual and aggregate position limits for each counterparty relative to potential levels of activity, holding and marking to market collateral on certain transactions. Our risk management functions also evaluate the potential risk associated with institutional counterparties with whom we hold derivatives, TBAs and other documented institutional counterparty agreements that may give rise to credit exposure.
Collections Risk — Collections risk arises from ineffective management and monitoring of collecting outstanding debts and obligations, including those related to our customer trading activities and margin lending. Our client activities involve the execution, settlement and financing of various transactions. Client activities are transacted on a delivery versus payment, cash or margin basis. Our credit exposure to institutional client business is mitigated by the use of industry-standard delivery versus payment through depositories and clearing banks. Credit exposure associated with our customer margin accounts in the U.S. is monitored daily. Our risk management functions have credit risk policies establishing appropriate credit limits and collateralization thresholds for our customers utilizing margin lending.
Concentration Risk — Concentration risk is the risk due to concentrated exposure to a particular product; individual issuer, borrower or counterparty; financial instrument; or geographic area. We are subject to concentration risk if we hold large individual securities positions, execute large transactions with individual counterparties or groups of related counterparties, or make substantial underwriting commitments. Concentration risk can occur by industry, geographic area or type of client. Securities purchased under agreements to resell consist primarily of securities issued by the U.S. government or its agencies. The counterparties to these agreements typically are primary dealers of U.S. government securities and major financial institutions. Inventory and investment positions taken and commitments made, including underwritings, may result in exposure to individual issuers and businesses. Potential concentration risk is carefully monitored through review of counterparties and borrowers and is managed through the use of policies and limits established by senior management.
We have concentrated counterparty credit exposure with five non-publicly rated entities totaling $15.9 million at December 31, 2018. This counterparty credit exposure is part of our matched-book derivative program related to our public finance business, consisting primarily of interest rate swaps. One derivative counterparty represents 78.9 percent, or $12.5 million, of this exposure. Credit exposure associated with our derivative counterparties is driven by uncollateralized market movements in the fair value of the interest rate swap contracts and is monitored regularly by our financial risk committee. We attempt to minimize the credit (or repayment) risk in derivative instruments by entering into transactions with high-quality counterparties that are reviewed periodically by senior management.
Operational Risk
Operational risk is the risk of loss, or damage to our reputation, resulting from inadequate or failed processes, people and systems or from external events. We rely on the ability of our employees and our systems, both internal and at computer centers operated by third parties, to process a large number of transactions. Our systems may fail to operate properly or become disabled as a result of events that are wholly or partially beyond our control. In the event of a breakdown or improper operation of our systems or improper action by our employees or third party vendors, we could suffer financial loss, a disruption of our businesses, regulatory sanctions and damage to our reputation. We also face the risk of operational failure or termination of our relationship with any of the exchanges, fully disclosed clearing firms, or other financial intermediaries we use to facilitate our securities transactions. Any such failure or termination could adversely affect our ability to effect transactions and manage our exposure to risk.
59
Our operations rely on secure processing, storage and transmission of confidential and other information in our internal and outsourced computer systems and networks. Our computer systems, software and networks may be vulnerable to unauthorized access, computer viruses or other malicious code, internal misconduct or inadvertent errors and other events that could have an information security impact. The occurrence of one or more of these events, which we have experienced, could jeopardize our or our clients' or counterparties' confidential and other information processed and stored in, and transmitted through, our computer systems and networks, or otherwise cause interruptions or malfunctions in our, our clients', our counterparties' or third parties' operations. We take protective measures and endeavor to modify them as circumstances warrant.
In order to mitigate and control operational risk, we have developed and continue to enhance policies and procedures that are designed to identify and manage operational risk at appropriate levels throughout the organization. We also have business continuity plans in place that we believe will cover critical processes on a company-wide basis, and redundancies are built into our systems as we have deemed appropriate. These control mechanisms attempt to ensure that operational policies and procedures are being followed and that our various businesses are operating within established corporate policies and limits.
In 2017, we migrated to a fully disclosed clearing model for all of our clearing operations. In a fully disclosed clearing model, we act as an introducing broker for client transactions and rely on Pershing, our clearing broker dealer, to facilitate clearance and settlement of our clients' securities transactions. The clearing services provided by Pershing are critical to our business operations, and similar to other services performed by third party vendors, any failure by Pershing with respect to the services we rely upon Pershing to provide could cause financial loss, significantly disrupt our business, damage our reputation, and adversely affect our ability to serve our clients and manage our exposure to risk.
Human Capital Risk
Our business is a human capital business and our success is dependent upon the skills, expertise and performance of our employees. Human capital risks represent the risks posed if we fail to attract and retain qualified individuals who are motivated to serve the best interests of our clients, thereby serving the best interests of our company. Attracting and retaining employees depends, among other things, on our company's culture, management, work environment, geographic locations and compensation. There are risks associated with the proper recruitment, development and rewards of our employees to ensure quality performance and retention.
Legal and Regulatory Risk
Legal and regulatory risk includes the risk of non-compliance with applicable legal and regulatory requirements and loss to our reputation we may suffer as a result of failure to comply with laws, regulations, rules, related self-regulatory organization standards and codes of conduct applicable to our business activities. We are generally subject to extensive regulation in the various jurisdictions in which we conduct our business. We have established procedures that are designed to ensure compliance with applicable statutory and regulatory requirements, such as public company reporting obligations, regulatory net capital requirements, sales and trading practices, potential conflicts of interest, anti-money laundering, privacy and recordkeeping. We have also established procedures that are designed to require that our policies relating to ethics and business conduct are followed. The legal and regulatory focus on the financial services industry presents a continuing business challenge for us.
Our business also subjects us to the complex income tax laws of the jurisdictions in which we have business operations, and these tax laws may be subject to different interpretations by the taxpayer and the relevant governmental taxing authorities. We must make judgments and interpretations about the application of these inherently complex tax laws when determining the provision for income taxes.

60
Effects of Inflation
Because our assets are liquid and generally short-term in nature, they are not significantly affected by inflation. However, the rate of inflation affects our expenses, such as employee compensation, office space leasing costs and communications charges, which may not be readily recoverable in the price of services we offer to our clients. To the extent inflation results in rising interest rates and has adverse effects upon the securities markets, it may adversely affect our financial position and results of operations.
ITEM 7A. QUANTITATIVE AND QUALITATIVE DISCLOSURES ABOUT MARKET RISK.
The information under the caption "Risk Management" in Part II, Item 7 of this Form 10-K entitled, "Management's Discussion and Analysis of Financial Condition and Results of Operations," is incorporated herein by reference.

61
ITEM 8. FINANCIAL STATEMENTS AND SUPPLEMENTARY DATA.
INDEX TO AUDITED CONSOLIDATED FINANCIAL STATEMENTS
Management's Report on Internal Control Over Financial Reporting................................................................... 62Report of Independent Registered Public Accounting Firm.................................................................................. 63Report of Independent Registered Public Accounting Firm.................................................................................. 64Consolidated Financial Statements:
Consolidated Statements of Financial Condition................................................................................................ 65Consolidated Statements of Operations .............................................................................................................. 66Consolidated Statements of Comprehensive Income.......................................................................................... 67Consolidated Statements of Changes in Shareholders' Equity............................................................................ 68Consolidated Statements of Cash Flows............................................................................................................. 70Notes to the Consolidated Financial Statements
Note 1 Organization and Basis of Presentation ......................................................................................... 71Note 2 Summary of Significant Accounting Policies................................................................................ 72Note 3 Recent Accounting Pronouncements ............................................................................................. 77Note 4 Acquisition of Simmons & Company International ...................................................................... 78Note 5 Financial Instruments and Other Inventory Positions Owned and Financial Instruments and
Other Inventory Positions Sold, but Not Yet Purchased ............................................................ 79Note 6 Fair Value of Financial Instruments............................................................................................... 81Note 7 Variable Interest Entities................................................................................................................ 89Note 8 Receivables from and Payables to Brokers, Dealers and Clearing Organizations......................... 90Note 9 Investments .................................................................................................................................... 90Note 10 Other Assets ................................................................................................................................... 91Note 11 Goodwill and Intangible Assets ..................................................................................................... 91Note 12 Fixed Assets ................................................................................................................................... 92Note 13 Short-Term Financing .................................................................................................................... 92Note 14 Senior Notes................................................................................................................................... 93Note 15 Contingencies, Commitments and Guarantees .............................................................................. 93Note 16 Restructuring.................................................................................................................................. 95Note 17 Shareholders' Equity ...................................................................................................................... 95Note 18 Employee Benefit Plans................................................................................................................. 97Note 19 Compensation Plans....................................................................................................................... 98Note 20 Earnings Per Share......................................................................................................................... 104Note 21 Segment Reporting......................................................................................................................... 105Note 22 Net Capital Requirements and Other Regulatory Matters ............................................................. 107Note 23 Income Taxes ................................................................................................................................. 107Note 24 Piper Jaffray Companies (Parent Company only) ......................................................................... 110Note 25 Subsequent Event........................................................................................................................... 112
Supplementary Data .............................................................................................................................................. 113

62
MANAGEMENT'S REPORT ON INTERNAL CONTROL OVER FINANCIAL REPORTING
Our management is responsible for establishing and maintaining adequate internal control over our financial reporting. Our internal control system is designed to provide reasonable assurance regarding the reliability of financial reporting and the preparation of financial statements for external purposes in accordance with U.S. generally accepted accounting principles. All internal control systems, no matter how well designed, have inherent limitations. Therefore, even those systems determined to be effective can provide only reasonable assurance with respect to financial statement preparation and presentation.
Our management assessed the effectiveness of our internal control over financial reporting as of December 31, 2018. In making this assessment, management used the criteria set forth by the Committee of Sponsoring Organizations of the Treadway Commission (COSO) in Internal Control-Integrated Framework (2013 framework). Based on its assessment and those criteria, management has concluded that we maintained effective internal control over financial reporting as of December 31, 2018.
Ernst & Young LLP, the independent registered public accounting firm that audited the consolidated financial statements of Piper Jaffray Companies included in this Annual Report on Form 10-K, has issued an attestation report on internal control over financial reporting as of December 31, 2018. Their report, which expresses an unqualified opinion on the effectiveness of Piper Jaffray Companies' internal control over financial reporting as of December 31, 2018, is included herein.

63
REPORT OF INDEPENDENT REGISTERED PUBLIC ACCOUNTING FIRM
To the Shareholders and Board of Directors of Piper Jaffray Companies
Opinion on Internal Control over Financial Reporting
We have audited Piper Jaffray Companies' (the Company) internal control over financial reporting as of December 31, 2018, based on criteria established in Internal Control - Integrated Framework issued by the Committee of Sponsoring Organizations of the Treadway Commission (2013 framework) (the COSO criteria). In our opinion, the Company maintained, in all respects, effective internal control over financial reporting as of December 31, 2018, based on the COSO criteria.
We also have audited, in accordance with the standards of the Public Company Accounting Oversight Board (United States) (PCAOB), the consolidated statements of financial condition of the Company as of December 31, 2018 and 2017, and the related consolidated statements of operations, comprehensive income, changes in shareholders' equity and cash flows for each of the three years in the period ended December 31, 2018, and the related notes, and our report dated February 26, 2019 expressed an unqualified opinion thereon.
Basis for Opinion
The Company's management is responsible for maintaining effective internal control over financial reporting and for its assessment of the effectiveness of internal control over financial reporting included in the accompanying Management's Report on Internal Control Over Financial Reporting. Our responsibility is to express an opinion on the Company's internal control over financial reporting based on our audit. We are a public accounting firm registered with the PCAOB and are required to be independent with respect to the Company in accordance with the U.S. federal securities laws and the applicable rules and regulations of the Securities and Exchange Commission and the PCAOB.
We conducted our audit in accordance with the standards of the PCAOB. Those standards require that we plan and perform the audit to obtain reasonable assurance about whether effective internal control over financial reporting was maintained in all material respects.
Our audit included obtaining an understanding of internal control over financial reporting, assessing the risk that a material weakness exists, testing and evaluating the design and operating effectiveness of internal control based on the assessed risk, and performing such other procedures as we considered necessary in the circumstances. We believe that our audit provides a reasonable basis for our opinion.
Definition and Limitations of Internal Control Over Financial Reporting
A company's internal control over financial reporting is a process designed to provide reasonable assurance regarding the reliability of financial reporting and the preparation of financial statements for external purposes in accordance with generally accepted accounting principles. A company's internal control over financial reporting includes those policies and procedures that (1) pertain to the maintenance of records that, in reasonable detail, accurately and fairly reflect the transactions and dispositions of the assets of the company; (2) provide reasonable assurance that transactions are recorded as necessary to permit preparation of financial statements in accordance with generally accepted accounting principles, and that receipts and expenditures of the company are being made only in accordance with authorizations of management and directors of the company; and (3) provide reasonable assurance regarding prevention or timely detection of unauthorized acquisition, use, or disposition of the company's assets that could have a material effect on the financial statements.
Because of its inherent limitations, internal control over financial reporting may not prevent or detect misstatements. Also, projections of any evaluation of effectiveness to future periods are subject to the risk that controls may become inadequate because of changes in conditions, or that the degree of compliance with the policies or procedures may deteriorate.
/s/ Ernst & Young LLP
Minneapolis, MinnesotaFebruary 26, 2019
64
REPORT OF INDEPENDENT REGISTERED PUBLIC ACCOUNTING FIRM
To the Shareholders and Board of Directors of Piper Jaffray Companies
Opinion on the Financial Statements
We have audited the accompanying consolidated statements of financial condition of Piper Jaffray Companies (the Company) as of December 31, 2018 and 2017, the related consolidated statements of operations, comprehensive income, changes in shareholders' equity and cash flows for each of the three years in the period ended December 31, 2018, and the related notes (collectively referred to as the "consolidated financial statements"). In our opinion, the consolidated financial statements present fairly, in all material respects, the financial position of the Company at December 31, 2018 and 2017, and the results of its operations and its cash flows for each of the three years in the period ended December 31, 2018, in conformity with U.S. generally accepted accounting principles.
We also have audited, in accordance with the standards of the Public Company Accounting Oversight Board (United States) (PCAOB), the Company's internal control over financial reporting as of December 31, 2018, based on criteria established in Internal Control - Integrated Framework issued by the Committee of Sponsoring Organizations of the Treadway Commission (2013 framework) and our report dated February 26, 2019 expressed an unqualified opinion thereon.
Basis for Opinion
These financial statements are the responsibility of the Company's management. Our responsibility is to express an opinion on the Company's financial statements based on our audits. We are a public accounting firm registered with the PCAOB and are required to be independent with respect to the Company in accordance with the U.S. federal securities laws and the applicable rules and regulations of the Securities and Exchange Commission and the PCAOB.
We conducted our audits in accordance with the standards of the PCAOB. Those standards require that we plan and perform the audit to obtain reasonable assurance about whether the financial statements are free of material misstatement, whether due to error or fraud. Our audits included performing procedures to assess the risks of material misstatement of the financial statements, whether due to error or fraud, and performing procedures that respond to those risks. Such procedures included examining, on a test basis, evidence regarding the amounts and disclosures in the financial statements. Our audits also included evaluating the accounting principles used and significant estimates made by management, as well as evaluating the overall presentation of the financial statements. We believe that our audits provide a reasonable basis for our opinion.
/s/ Ernst & Young LLP
We have served as the Company's auditor since 2003.
Minneapolis, MinnesotaFebruary 26, 2019

Piper Jaffray Companies
Consolidated Statements of Financial Condition
65
December 31, December 31,(Amounts in thousands, except share data) 2018 2017AssetsCash and cash equivalents.................................................................................................................... $ 50,364 $ 33,793Receivables from brokers, dealers and clearing organizations ............................................................ 235,278 145,394
Financial instruments and other inventory positions owned................................................................ 479,795 663,330Financial instruments and other inventory positions owned and pledged as collateral ....................... 147,427 720,047
Total financial instruments and other inventory positions owned..................................................... 627,222 1,383,377
Fixed assets (net of accumulated depreciation and amortization of $60,555 and $55,944,respectively) ....................................................................................................................................... 32,619 25,179
Goodwill............................................................................................................................................... 81,855 81,855Intangible assets (net of accumulated amortization of $95,877 and $85,417, respectively) ............... 12,374 22,834Investments .......................................................................................................................................... 151,963 176,212Net deferred income tax assets............................................................................................................. 101,857 101,205Other assets .......................................................................................................................................... 51,737 54,834
Total assets......................................................................................................................................... $ 1,345,269 $ 2,024,683
Liabilities and Shareholders' EquityShort-term financing ............................................................................................................................ $ 49,953 $ 289,937Senior notes.......................................................................................................................................... — 125,000Payables to brokers, dealers and clearing organizations...................................................................... 8,657 19,392Financial instruments and other inventory positions sold, but not yet purchased ............................... 177,427 399,227Accrued compensation ......................................................................................................................... 333,522 400,092Other liabilities and accrued expenses ................................................................................................. 45,294 49,800
Total liabilities................................................................................................................................... 614,853 1,283,448
Shareholders' equity:Common stock, $0.01 par value:
Shares authorized: 100,000,000 at December 31, 2018 and December 31, 2017;Shares issued: 19,518,044 at December 31, 2018 and 19,512,914 at December 31, 2017;Shares outstanding: 12,995,397 at December 31, 2018 and 12,911,149 at December 31, 2017.... 195 195
Additional paid-in capital .................................................................................................................. 796,363 791,970Retained earnings (1)......................................................................................................................... 182,552 176,270Less common stock held in treasury, at cost: 6,522,647 shares at December 31, 2018 and6,601,765 shares at December 31, 2017.......................................................................................... (300,268) (273,824)
Accumulated other comprehensive loss ............................................................................................ (1,398) (1,279)Total common shareholders' equity ................................................................................................ 677,444 693,332
Noncontrolling interests.................................................................................................................. 52,972 47,903Total shareholders' equity ............................................................................................................... 730,416 741,235
Total liabilities and shareholders' equity......................................................................................... $ 1,345,269 $ 2,024,683 (1) Includes the cumulative effect adjustment upon adoption of ASU 2014-09, as amended. See Note 3 for further discussion.
See Notes to the Consolidated Financial Statements

Piper Jaffray Companies
Consolidated Statements of Operations
66
Year Ended December 31,(Amounts in thousands, except per share data) 2018 2017 2016Revenues:
Investment banking...................................................................................... $ 588,978 $ 633,837 $ 490,340Institutional brokerage ................................................................................. 124,517 154,563 161,186Asset management ....................................................................................... 49,803 56,835 60,672Interest ......................................................................................................... 32,749 31,954 33,074Investment income....................................................................................... 4,946 18,002 24,602
Total revenues ........................................................................................... 800,993 895,191 769,874
Interest expense ........................................................................................... 16,551 20,268 22,525
Net revenues.............................................................................................. 784,442 874,923 747,349
Non-interest expenses:Compensation and benefits.......................................................................... 512,847 617,635 510,612Outside services ........................................................................................... 39,957 38,012 39,289Occupancy and equipment........................................................................... 35,721 33,462 34,813Communications .......................................................................................... 31,621 29,891 29,626Marketing and business development.......................................................... 29,377 31,293 30,404Deal-related expenses .................................................................................. 25,120 — —Trade execution and clearance..................................................................... 8,014 8,166 7,651Restructuring and integration costs ............................................................. 3,770 — 10,206Goodwill impairment................................................................................... — 114,363 82,900Intangible asset amortization ....................................................................... 10,460 15,400 21,214Back office conversion costs ....................................................................... — 3,927 561Other operating expenses............................................................................. 12,678 12,097 10,947
Total non-interest expenses ....................................................................... 709,565 904,246 778,223
Income/(loss) before income tax expense/(benefit) .................................... 74,877 (29,323) (30,874)
Income tax expense/(benefit)....................................................................... 19,047 30,229 (17,128)
Net income/(loss)........................................................................................... 55,830 (59,552) (13,746)
Net income/(loss) applicable to noncontrolling interests ............................ (1,206) 2,387 8,206
Net income/(loss) applicable to Piper Jaffray Companies ........................ $ 57,036 $ (61,939) $ (21,952)
Net income/(loss) applicable to Piper Jaffray Companies' commonshareholders ................................................................................................ $ 49,993 $ (64,875) (1) $ (21,952) (1)
Earnings/(loss) per common shareBasic ............................................................................................................ $ 3.78 $ (5.07) $ (1.73)Diluted ......................................................................................................... $ 3.72 $ (5.07) (2) $ (1.73) (2)
Dividends declared per common share....................................................... $ 3.12 $ 1.25 $ —
Weighted average number of common shares outstandingBasic ............................................................................................................ 13,234 12,807 12,674Diluted ......................................................................................................... 13,425 12,978 (2) 12,779 (2)
(1) No allocation of undistributed income was made due to loss position. See Note 20.(2) Earnings per diluted common share is calculated using the basic weighted average number of common shares outstanding for periods
in which a loss is incurred.See Notes to the Consolidated Financial Statements

Piper Jaffray Companies
Consolidated Statements of Comprehensive Income
67
Year Ended December 31,(Amounts in thousands) 2018 2017 2016Net income/(loss)....................................................................................... $ 55,830 $ (59,552) $ (13,746)
Other comprehensive income/(loss), net of tax:Foreign currency translation adjustment.................................................. (119) 1,320 (2,410)
Comprehensive income/(loss) .................................................................. 55,711 (58,232) (16,156)
Comprehensive income/(loss) applicable to noncontrolling interests ..... (1,206) 2,387 8,206
Comprehensive income/(loss) applicable to Piper JaffrayCompanies ............................................................................................... $ 56,917 $ (60,619) $ (24,362)
See Notes to the Consolidated Financial Statements
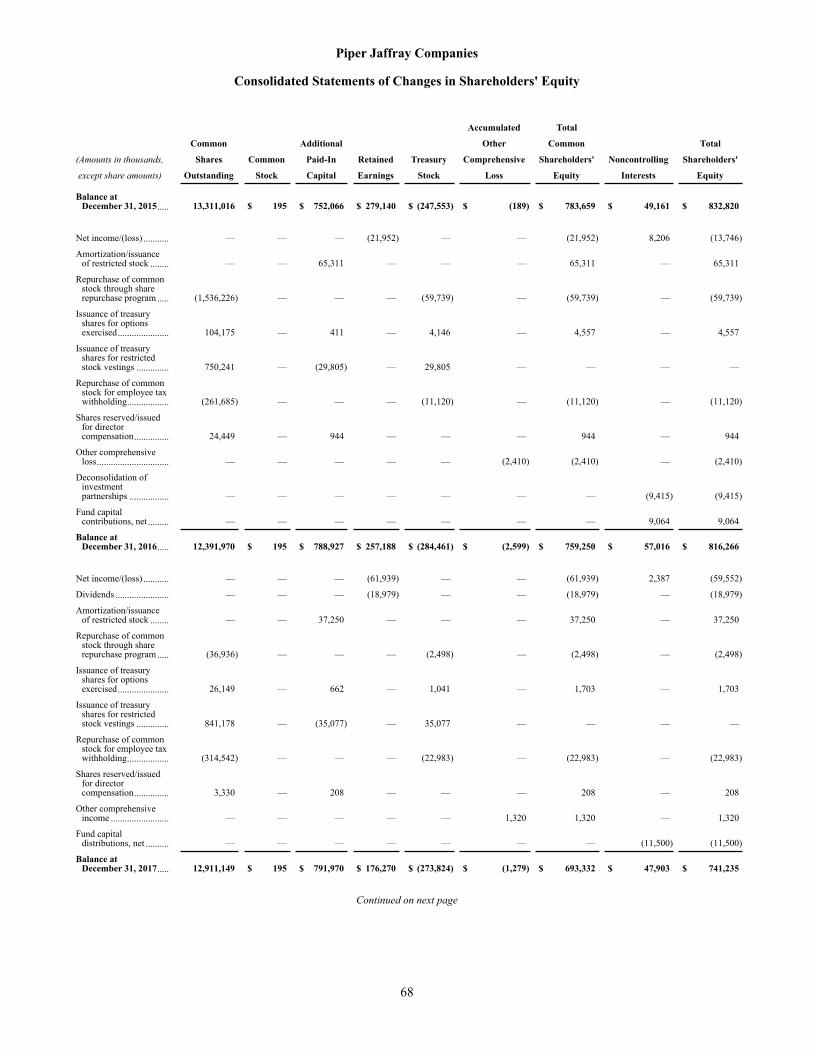
Piper Jaffray Companies
Consolidated Statements of Changes in Shareholders' Equity
68
Accumulated Total
Common Additional Other Common Total
(Amounts in thousands, Shares Common Paid-In Retained Treasury Comprehensive Shareholders' Noncontrolling Shareholders'
except share amounts) Outstanding Stock Capital Earnings Stock Loss Equity Interests Equity
Balance at December 31, 2015..... 13,311,016 $ 195 $ 752,066 $ 279,140 $ (247,553) $ (189) $ 783,659 $ 49,161 $ 832,820
Net income/(loss) ........... — — — (21,952) — — (21,952) 8,206 (13,746)
Amortization/issuanceof restricted stock ........ — — 65,311 — — — 65,311 — 65,311
Repurchase of commonstock through sharerepurchase program ..... (1,536,226) — — — (59,739) — (59,739) — (59,739)
Issuance of treasuryshares for optionsexercised...................... 104,175 — 411 — 4,146 — 4,557 — 4,557
Issuance of treasuryshares for restrictedstock vestings .............. 750,241 — (29,805) — 29,805 — — — —
Repurchase of commonstock for employee taxwithholding.................. (261,685) — — — (11,120) — (11,120) — (11,120)
Shares reserved/issuedfor directorcompensation............... 24,449 — 944 — — — 944 — 944
Other comprehensiveloss............................... — — — — — (2,410) (2,410) — (2,410)
Deconsolidation ofinvestmentpartnerships ................. — — — — — — — (9,415) (9,415)
Fund capitalcontributions, net ......... — — — — — — — 9,064 9,064
Balance at December 31, 2016..... 12,391,970 $ 195 $ 788,927 $ 257,188 $ (284,461) $ (2,599) $ 759,250 $ 57,016 $ 816,266
Net income/(loss) ........... — — — (61,939) — — (61,939) 2,387 (59,552)
Dividends ....................... — — — (18,979) — — (18,979) — (18,979)
Amortization/issuanceof restricted stock ........ — — 37,250 — — — 37,250 — 37,250
Repurchase of commonstock through sharerepurchase program ..... (36,936) — — — (2,498) — (2,498) — (2,498)
Issuance of treasuryshares for optionsexercised...................... 26,149 — 662 — 1,041 — 1,703 — 1,703
Issuance of treasuryshares for restrictedstock vestings .............. 841,178 — (35,077) — 35,077 — — — —
Repurchase of commonstock for employee taxwithholding.................. (314,542) — — — (22,983) — (22,983) — (22,983)
Shares reserved/issuedfor directorcompensation............... 3,330 — 208 — — — 208 — 208
Other comprehensiveincome ......................... — — — — — 1,320 1,320 — 1,320
Fund capitaldistributions, net .......... — — — — — — — (11,500) (11,500)
Balance at December 31, 2017..... 12,911,149 $ 195 $ 791,970 $ 176,270 $ (273,824) $ (1,279) $ 693,332 $ 47,903 $ 741,235
Continued on next page

Piper Jaffray Companies
Consolidated Statements of Changes in Shareholders' Equity – Continued
69
Accumulated Total
Common Additional Other Common Total
(Amounts in thousands, Shares Common Paid-In Retained Treasury Comprehensive Shareholders' Noncontrolling Shareholders'
except share amounts) Outstanding Stock Capital Earnings Stock Loss Equity Interests Equity
Net income/(loss) ........... — $ — $ — $ 57,036 $ — $ — $ 57,036 $ (1,206) $ 55,830
Dividends ....................... — — — (47,157) — — (47,157) — (47,157)
Amortization/issuanceof restricted stock ........ — — 48,448 — — — 48,448 — 48,448
Repurchase of commonstock through sharerepurchase program ..... (681,233) — — — (47,142) — (47,142) — (47,142)
Issuance of treasuryshares for restrictedstock vestings .............. 1,040,015 — (44,459) — 44,459 — — — —
Repurchase of commonstock for employee taxwithholding.................. (279,664) — — — (23,761) — (23,761) — (23,761)
Shares reserved/issuedfor directorcompensation............... 5,130 — 404 — — — 404 — 404
Other comprehensiveloss............................... — — — — — (119) (119) — (119)
Cumulative effect uponadoption of newaccounting standard,net of tax (1) ................ — — — (3,597) — — (3,597) — (3,597)
Fund capitalcontributions, net ......... — — — — — — — 6,275 6,275
Balance at December 31, 2018..... 12,995,397 $ 195 $ 796,363 $ 182,552 $ (300,268) $ (1,398) $ 677,444 $ 52,972 $ 730,416
(1) Cumulative effect adjustment upon adoption of ASU 2014-09, as amended. See Note 3 for further discussion.
See Notes to the Consolidated Financial Statements

Piper Jaffray Companies
Consolidated Statements of Cash Flows
70
Year Ended December 31,(Dollars in thousands) 2018 2017 2016Operating Activities:
Net income/(loss) .................................................................................................................................. $ 55,830 $ (59,552) $ (13,746)Adjustments to reconcile net income/(loss) to net cash provided by/(used in) operating activities:
Depreciation and amortization of fixed assets ................................................................................... 8,358 7,252 6,410Deferred income taxes ....................................................................................................................... (652) (3,372) (31,023)Stock-based compensation................................................................................................................. 44,285 39,831 55,977Goodwill impairment ......................................................................................................................... — 114,363 82,900Amortization of intangible assets....................................................................................................... 10,460 15,400 21,214Amortization of forgivable loans ....................................................................................................... 5,138 6,740 8,785
Decrease/(increase) in operating assets:Receivables:
Customers ....................................................................................................................................... — 31,917 9,272Brokers, dealers and clearing organizations ................................................................................... (89,884) 67,336 (64,781)
Securities purchased under agreements to resell ............................................................................... — 159,697 (24,591)Net financial instruments and other inventory positions owned........................................................ 534,355 (224,536) (7,835)Investments ........................................................................................................................................ 24,249 (8,155) (10,881)Other assets ........................................................................................................................................ (1,961) 6,467 (20,992)
Increase/(decrease) in operating liabilities:Payables:
Customers ....................................................................................................................................... — (29,352) (8,012)Brokers, dealers and clearing organizations ................................................................................... (10,735) (21,450) (7,289)
Securities sold under agreements to repurchase ................................................................................ — (15,046) (1,127)Accrued compensation....................................................................................................................... (61,526) 109,108 30,396Other liabilities and accrued expenses............................................................................................... (8,067) 6,456 (27,902)
Net cash provided by/(used in) operating activities........................................................................... 509,850 203,104 (3,225)
Investing Activities:Business acquisitions, net of cash acquired .......................................................................................... — — (72,709)Purchases of fixed assets, net................................................................................................................ (15,859) (8,097) (11,017)
Net cash used in investing activities .................................................................................................. (15,859) (8,097) (83,726)
Financing Activities:Decrease in short-term financing .......................................................................................................... (239,984) (128,895) (27,358)Repayment of senior notes.................................................................................................................... (125,000) (50,000) —Decrease in securities sold under agreements to repurchase ................................................................ — — (27,269)Payment of cash dividend ..................................................................................................................... (47,157) (18,947) —Increase/(decrease) in noncontrolling interests..................................................................................... 6,275 (11,500) 9,064Repurchase of common stock ............................................................................................................... (70,903) (25,481) (70,859)Excess tax benefit from stock-based compensation.............................................................................. — — 304Proceeds from stock option exercises ................................................................................................... — 1,703 4,557
Net cash used in financing activities.................................................................................................. (476,769) (233,120) (111,561)
Currency adjustment:Effect of exchange rate changes on cash .............................................................................................. (651) 1,532 (2,046)
Net increase/(decrease) in cash, cash equivalents and restricted cash (1) ............................................... 16,571 (36,581) (200,558)
Cash, cash equivalents and restricted cash at beginning of year (1)........................................................ 33,793 70,374 270,932
Cash, cash equivalents and restricted cash at end of year (1).................................................................. $ 50,364 $ 33,793 $ 70,374
Supplemental disclosure of cash flow information –Cash paid during the year for:
Interest................................................................................................................................................ $ 17,129 $ 19,917 $ 23,171Income taxes ...................................................................................................................................... $ 17,134 $ 31,895 $ 27,298
(1) Upon adoption of ASU 2016-18, restricted cash includes cash and cash equivalents previously segregated for regulatory purposes. See Note 3 for
further discussion.
See Notes to the Consolidated Financial Statements

Piper Jaffray Companies
Notes to the Consolidated Financial Statements
71
Note 1 Organization and Basis of Presentation
Organization
Piper Jaffray Companies is the parent company of Piper Jaffray & Co. ("Piper Jaffray"), a securities broker dealer and investment banking firm; Piper Jaffray Ltd., a firm providing securities brokerage and mergers and acquisitions services in Europe; Piper Jaffray Finance LLC, which facilitates corporate debt underwriting in conjunction with affiliated credit vehicles; Advisory Research, Inc. ("ARI"), which provides asset management services to separately managed accounts, closed-end and open-end funds and partnerships; Piper Jaffray Investment Group Inc. and PJC Capital Management LLC, which consist of entities providing alternative asset management services; Piper Jaffray Financial Products Inc. and Piper Jaffray Financial Products II Inc., entities that facilitate derivative transactions; and other immaterial subsidiaries.
Effective August 7, 2017, Piper Jaffray transitioned from a self clearing securities broker dealer to a fully disclosed clearing model. Pershing LLC ("Pershing") is Piper Jaffray's clearing broker dealer responsible for the clearance and settlement of firm and customer cash and security transactions.
Piper Jaffray Companies and its subsidiaries (collectively, the "Company") operate in two reporting segments: Capital Markets and Asset Management. A summary of the activities of each of the Company's business segments is as follows:
Capital Markets
The Capital Markets segment provides investment banking services and institutional sales, trading and research services. Investment banking services include financial advisory services, management of and participation in underwritings and public finance activities. Revenues are generated through the receipt of advisory and financing fees. Institutional sales, trading and research services focus on the trading of equity and fixed income products with institutions, government and non-profit entities. Revenues are generated through commissions and sales credits earned on equity and fixed income institutional sales activities, net interest revenues on trading securities held in inventory, and profits and losses from trading these securities. Also, the Company generates revenue through strategic trading and investing activities, which focus on investments in municipal bonds, U.S. government agency securities, and merchant banking activities involving equity investments in late stage private companies. The Company has created alternative asset management funds in merchant banking, energy and senior living in order to invest firm capital and to manage capital from outside investors. The Company receives management and performance fees for managing these funds.
Asset Management
The Asset Management segment provides traditional asset management services with product offerings in master limited partnerships and equity securities to institutions and individuals. Revenues are generated in the form of management and performance fees. Revenues are also generated through investments in the partnerships and funds that the Company manages.
Basis of Presentation
The accompanying consolidated financial statements have been prepared in accordance with U.S. generally accepted accounting principles ("U.S. GAAP") and include the accounts of Piper Jaffray Companies, its wholly owned subsidiaries, and all other entities in which the Company has a controlling financial interest. Noncontrolling interests represent equity interests in consolidated entities that are not attributable, either directly or indirectly, to Piper Jaffray Companies. Noncontrolling interests include the minority equity holders' proportionate share of the equity in the Company's alternative asset management funds. All material intercompany balances have been eliminated.
The preparation of financial statements and related disclosures in conformity with U.S. GAAP requires management to make estimates and assumptions that affect the reported amounts of assets and liabilities at the date of the financial statements and the reported amounts of revenues and expenses during the reporting period. Although these estimates and assumptions are based on the best information available, actual results could differ from those estimates.

Piper Jaffray Companies
Notes to the Consolidated Financial Statements – Continued
72
Note 2 Summary of Significant Accounting Policies
Principles of Consolidation
The Company consolidates entities in which it has a controlling financial interest. The Company determines whether it has a controlling financial interest in an entity by first evaluating whether the entity is a variable interest entity ("VIE") or a voting interest entity.
VIEs are entities in which (i) the total equity investment at risk is not sufficient to enable the entity to finance its activities independently or (ii) the at-risk equity holders do not have the normal characteristics of a controlling financial interest. A controlling financial interest in a VIE is present when an enterprise has one or more variable interests that have both (i) the power to direct the activities of the VIE that most significantly impact the VIE's economic performance and (ii) the obligation to absorb losses of the VIE or the right to receive benefits from the VIE that could potentially be significant to the VIE. The enterprise with a controlling financial interest is the primary beneficiary and consolidates the VIE.
Voting interest entities lack one or more of the characteristics of a VIE. The usual condition for a controlling financial interest is ownership of a majority voting interest for a corporation or a majority of kick-out or participating rights for a limited partnership.
When the Company does not have a controlling financial interest in an entity but exerts significant influence over the entity's operating and financial policies, the Company's investment is accounted for under the equity method of accounting. If the Company does not have a controlling financial interest in, or exert significant influence over, an entity, the Company accounts for its investment at fair value, if the fair value option was elected, or at cost.
Cash and Cash Equivalents
Cash and cash equivalents consist of cash and highly liquid investments with maturities of 90 days or less at the date of origination.
Customer and Collateralized Securities Transactions
As discussed in Note 1, Piper Jaffray transitioned from a self clearing securities broker dealer to a fully disclosed clearing model in 2017. Pershing is Piper Jaffray's clearing broker dealer responsible for the clearance and settlement of firm and customer cash and security transactions. In addition, subsequent to transitioning to a fully disclosed clearing model, the Company no longer enters into securities purchased under agreements to resell, securities sold under agreements to repurchase, and securities borrowed and loaned transactions.
Fair Value of Financial Instruments
Financial instruments and other inventory positions owned and financial instruments and other inventory positions sold, but not yet purchased on the consolidated statements of financial condition consist of financial instruments (including securities with extended settlements and derivative contracts) recorded at fair value. Unrealized gains and losses related to these financial instruments are reflected on the consolidated statements of operations. Securities (both long and short), including securities with extended settlements, are recognized on a trade-date basis. Additionally, certain of the Company's investments on the consolidated statements of financial condition are recorded at fair value, either as required by accounting guidance or through the fair value election.
Fair Value Measurement – Definition and Hierarchy – Financial Accounting Standards Board ("FASB") Accounting Standards Codification Topic 820, "Fair Value Measurement," ("ASC 820") defines fair value as the amount at which an instrument could be exchanged in an orderly transaction between market participants at the measurement date (the exit price). ASC 820 establishes a fair value hierarchy based on the inputs used to measure fair value. The fair value hierarchy maximizes the use of observable inputs and minimizes the use of unobservable inputs by requiring that the observable inputs be used when available. Observable inputs are inputs that market participants would use in pricing the asset or liability based on market data obtained from independent sources. Unobservable inputs reflect management's assumptions that market participants would use in pricing

Piper Jaffray Companies
Notes to the Consolidated Financial Statements – Continued
73
the asset or liability developed based on the best information available in the circumstances. The hierarchy is broken down into three levels based on the observability of inputs as follows:
Level I – Quoted prices (unadjusted) are available in active markets for identical assets or liabilities as of the report date. A quoted price for an identical asset or liability in an active market provides the most reliable fair value measurement because it is directly observable to the market.
Level II – Pricing inputs are other than quoted prices in active markets, which are either directly or indirectly observable as of the report date. The nature of these financial instruments include instruments for which quoted prices are available but traded less frequently, instruments whose fair value have been derived using a model where inputs to the model are directly observable in the market, or can be derived principally from or corroborated by observable market data, and instruments that are fair valued using other financial instruments, the parameters of which can be directly observed.
Level III – Instruments that have little to no pricing observability as of the report date. These financial instruments are measured using management's best estimate of fair value, where the inputs into the determination of fair value require significant management judgment or estimation.
Valuation of Financial Instruments – Based on the nature of the Company's business and its role as a "dealer" in the securities industry or as a manager of alternative asset management funds, the fair values of its financial instruments are determined internally. When available, the Company values financial instruments at observable market prices, observable market parameters, or broker or dealer prices (bid and ask prices). In the case of financial instruments transacted on recognized exchanges, the observable market prices represent quotations for completed transactions from the exchange on which the financial instrument is principally traded.
A substantial percentage of the fair value of the Company's financial instruments and other inventory positions owned and financial instruments and other inventory positions sold, but not yet purchased, are based on observable market prices, observable market parameters, or derived from broker or dealer prices. The availability of observable market prices and pricing parameters can vary from product to product. Where available, observable market prices and pricing or market parameters in a product may be used to derive a price without requiring significant judgment. In certain markets, observable market prices or market parameters are not available for all products, and fair value is determined using techniques appropriate for each particular product. These techniques involve some degree of judgment. Results from valuation models and other techniques in one period may not be indicative of future period fair value measurement.
For investments in illiquid or privately held securities that do not have readily determinable fair values, the determination of fair value requires the Company to estimate the value of the securities using the best information available. Among the factors considered by the Company in determining the fair value of such financial instruments are the cost, terms and liquidity of the investment, the financial condition and operating results of the issuer, the quoted market price of publicly traded securities with similar quality and yield, and other factors generally pertinent to the valuation of investments. In instances where a security is subject to transfer restrictions, the value of the security is based primarily on the quoted price of a similar security without restriction but may be reduced by an amount estimated to reflect such restrictions. In addition, even where the Company derives the value of a security based on information from an independent source, certain assumptions may be required to determine the security's fair value. For instance, the Company assumes that the size of positions in securities that the Company holds would not be large enough to affect the quoted price of the securities if the firm sells them, and that any such sale would happen in an orderly manner. The actual value realized upon disposition could be different from the currently estimated fair value.
Fixed Assets
Fixed assets include furniture and equipment, software and leasehold improvements. Furniture and equipment and software are depreciated using the straight-line method over estimated useful lives of three to ten years. Leasehold improvements are amortized over ten years or the life of the lease, whichever is shorter.

Piper Jaffray Companies
Notes to the Consolidated Financial Statements – Continued
74
Leases
The Company leases its corporate headquarters and other offices under various non-cancelable leases. The leases require payment of real estate taxes, insurance and common area maintenance, in addition to rent. The terms of the Company's lease agreements generally range up to twelve years. Some of the leases contain renewal options, escalation clauses, rent-free holidays and operating cost adjustments.
For leases that contain escalation clauses or rent-free holidays, the Company recognizes the related rent expense on a straight-line basis from the date the Company takes possession of the property to the end of the initial lease term. The Company records any difference between the straight-line rent amounts and amounts payable under the leases as part of other liabilities and accrued expenses.
Cash or lease incentives received upon entering into certain leases are recognized on a straight-line basis as a reduction of rent expense from the date the Company takes possession of the property or receives the cash to the end of the initial lease term. The Company records the unamortized portion of lease incentives as part of other liabilities and accrued expenses.
Goodwill and Intangible Assets
Goodwill represents the fair value of the consideration transferred in excess of the fair value of identifiable net assets at the acquisition date. The recoverability of goodwill is evaluated annually, at a minimum, or on an interim basis if circumstances indicate a possible inability to realize the carrying amount. See Note 11 for additional information on the Company's goodwill impairment testing.
Intangible assets with determinable lives consist of customer relationships and the Simmons & Company International trade name that are amortized over their original estimated useful lives ranging from one to ten years. The pattern of amortization reflects the timing of the realization of the economic benefits of such intangible assets. Indefinite-life intangible assets consist of the ARI trade name, which is not amortized and is evaluated annually, at a minimum, or on an interim basis if events or circumstances indicate a possible inability to realize the carrying amount.
Investments
The Company's investments include equity investments in private companies and partnerships and investments in registered mutual funds. Equity investments in private companies are accounted for at fair value, as required by accounting guidance or if the fair value option was elected. Investments in partnerships are accounted for under the equity method, which is generally the net asset value. Registered mutual funds are accounted for at fair value.
Other Assets
Other assets include receivables and prepaid expenses. Receivables include fee receivables, accrued interest, and loans made to employees, typically in connection with their recruitment. Employee loans are forgiven based on continued employment and are amortized to compensation and benefits expense using the straight-line method over the respective terms of the loans, which generally range from two to five years.
Revenue Recognition
Investment Banking – Investment banking revenues, which include advisory and underwriting fees, are recorded when the performance obligation for the transaction is satisfied under the terms of each engagement. Expenses associated with such transactions are deferred until the related revenue is recognized or the engagement is otherwise concluded. Investment banking revenues are presented gross of related client reimbursed deal expenses. Expenses for completed deals are reported separately in deal-related expenses on the consolidated statements of operations. Expenses related to investment banking deals not completed are recognized as non-interest expenses in their respective category on the consolidated statements of operations.

Piper Jaffray Companies
Notes to the Consolidated Financial Statements – Continued
75
The Company's advisory fees generally consist of a nonrefundable up-front fee and a success fee. The nonrefundable fee is recorded as deferred revenue upon receipt and recognized at a point in time when the performance obligation is satisfied, or when the transaction is deemed by management to be terminated. Management's judgment is required in determining when a transaction is considered to be terminated.
The substantial majority of the Company's advisory and underwriting fees (i.e., the success related advisory fee) are considered variable consideration and recognized when it is probable that the variable consideration will not be reversed in a future period. The variable consideration is considered to be constrained until satisfaction of the performance obligation. The Company's performance obligation is generally satisfied at a point in time upon the closing of a strategic transaction, completion of a financing or underwriting arrangement, or some other defined outcome (e.g., providing a fairness opinion). At this time, the Company has transferred control of the promised service and the customer obtains control. As these arrangements represent a single performance obligation, allocation of the transaction price is not necessary. The Company has elected to apply the following optional exemptions regarding disclosure of its remaining performance obligations: (i) the Company's performance obligation is part of a contract that has an original expected duration of one year or less and/or (ii) the variable consideration is allocated entirely to a wholly unsatisfied promise to transfer a distinct service that forms part of a single performance obligation.
Institutional Brokerage – Institutional brokerage revenues include (i) commissions received from customers for the execution of brokerage transactions in listed and over-the-counter (OTC) equity, fixed income and convertible debt securities, which are recognized at a point in time on the trade date because the customer has obtained the rights to the underlying security provided by the trade execution service, (ii) trading gains and losses, recorded on changes in the fair value of long and short security positions in the reporting period and (iii) fees received by the Company for equity research. The Company permits institutional customers to allocate a portion of their gross commissions to pay for research products and other services provided by third parties. The amounts allocated for those purposes are commonly referred to as commission share agreements or "soft dollar" arrangements. As the Company is not acting as a principal in satisfying the performance obligation for these arrangements, expenses relating to soft dollars are netted against commission revenues and included in other liabilities and accrued expenses on the consolidated statements of financial condition.
Asset Management – Asset management fees include revenues the Company receives in connection with management and investment advisory services performed for separately managed accounts and various funds and partnerships. The performance obligation related to the transfer of these services is satisfied over time and the related fees are recognized under the output method, which reflects the fees that the Company has a right to invoice based on the services provided during the period. Fees are defined in client contracts as a percentage of portfolio assets under management. Amounts related to remaining performance obligations are not disclosed as the Company applies the output method.
Asset management revenues may also include performance fees. Performance fees, if earned, are recognized when it is probable that such revenue will not be reversed in a future period. For the Company's alternative asset management funds, management will consider such factors as the remaining assets and residual life of the fund to conclude whether it is probable that a significant reversal of revenue will not occur in the future. For the Company's traditional asset management funds, performance fees are earned when the investment return on assets under management exceeds certain benchmark targets or other performance targets over a specified measurement period (e.g., monthly, quarterly or annually). These performance fees are typically annual performance hurdles and recognized in the fourth quarter of the applicable year, or upon client liquidation.
Interest Revenue and Expense – The Company nets interest expense within net revenues to mitigate the effects of fluctuations in interest rates on the Company's consolidated statements of operations. The Company recognizes contractual interest on financial instruments owned and financial instruments sold, but not yet purchased (excluding derivative instruments), on an accrual basis as a component of interest revenue and expense. The Company accounts for interest related to its short-term financing and its senior notes on an accrual basis with related interest recorded as interest expense.
Investment Income – Investment income includes realized and unrealized gains and losses from the Company's merchant banking, energy, senior living and other firm investments.
See Note 21 for revenues from contracts with customers disaggregated by major business activity.
Piper Jaffray Companies
Notes to the Consolidated Financial Statements – Continued
76
Stock-Based Compensation
FASB Accounting Standards Codification Topic 718, "Compensation – Stock Compensation," ("ASC 718") requires all stock-based compensation to be expensed on the consolidated statements of operations based on the grant date fair value of the award. Compensation expense related to stock-based awards that do not require future service are recognized in the year in which the awards were deemed to be earned. Stock-based awards that require future service are amortized over the relevant service period. Forfeitures of awards with service conditions are accounted for when they occur. See Note 19 for additional information on the Company's accounting for stock-based compensation.
Income Taxes
The Company files a consolidated U.S. federal income tax return, which includes all of its qualifying subsidiaries. The Company is also subject to income tax in various states and municipalities and those foreign jurisdictions in which we operate. Income taxes are provided for using the asset and liability method. Deferred tax assets and liabilities are recognized for the expected future tax consequences attributable to temporary differences between amounts reported for income tax purposes and financial statement purposes, using enacted tax rates expected to apply to taxable income in the years in which those temporary differences are expected to be recovered or settled. The realization of deferred tax assets is assessed and a valuation allowance is recognized to the extent that it is more likely than not that any portion of a deferred tax asset will not be realized. Tax reserves for uncertain tax positions are recorded in accordance with FASB Accounting Standards Codification Topic 740, "Income Taxes" ("ASC 740").
Earnings Per Share
Basic earnings per common share is computed by dividing net income/(loss) applicable to common shareholders by the weighted average number of common shares outstanding for the period. Net income/(loss) applicable to common shareholders represents net income/(loss) reduced by the allocation of earnings to participating securities. No allocation of undistributed earnings is made for periods in which a loss is incurred, or for periods in which cash dividends exceed net income resulting in an undistributed loss. Distributed earnings (e.g., dividends) are allocated to participating securities. Diluted earnings per common share is calculated by adjusting the weighted average outstanding shares to assume conversion of all potentially dilutive stock options and restricted stock units.
Unvested stock-based payment awards that contain nonforfeitable rights to dividends or dividend equivalents (whether paid or unpaid) are participating securities and are included in the earnings allocation in the earnings per share calculation under the two-class method. The Company grants restricted stock and restricted stock units as part of its stock-based compensation program. Recipients of restricted stock are entitled to receive nonforfeitable dividends during the vesting period, and therefore meet the definition of a participating security. The Company's unvested restricted stock units are not participating securities as recipients are not eligible to receive dividends, or the dividends are forfeitable until vested.
Foreign Currency Translation
The Company consolidates foreign subsidiaries which have designated their local currency as their functional currency. Assets and liabilities of these foreign subsidiaries are translated at period-end rates of exchange. The gains or losses resulting from translating foreign currency financial statements are included in other comprehensive income/(loss). Gains or losses resulting from foreign currency transactions are included in net income/(loss).
Contingencies
The Company is involved in various pending and potential legal proceedings related to its business, including litigation, arbitration and regulatory proceedings. The Company establishes reserves for potential losses to the extent that claims are probable of loss and the amount of the loss can be reasonably estimated. The determination of the outcome and reserve amounts requires significant judgment on the part of the Company's management.

Piper Jaffray Companies
Notes to the Consolidated Financial Statements – Continued
77
Note 3 Recent Accounting Pronouncements
Adoption of New Accounting Standards
Revenue Recognition
In May 2014, the FASB issued Accounting Standards Update ("ASU") No. 2014-09, "Revenue from Contracts with Customers (Topic 606)" ("ASU 2014-09"), which supersedes previous revenue recognition guidance, including most industry-specific guidance. ASU 2014-09, as amended, requires a company to recognize revenue when it transfers promised goods or services to customers in an amount that reflects the consideration to which the company expects to be entitled in exchange for those goods and services, and also requires enhanced disclosures.
The Company adopted this guidance effective as of January 1, 2018 under the modified retrospective method, in which the cumulative effect of applying the standard was recognized at the date of initial application. The cumulative effect adjustment that the Company recognized upon adoption as of January 1, 2018 was a decrease to retained earnings of $3.6 million, net of tax. The Company applied the guidance only to those contracts that were not completed at the date of initial application.
The previous broker dealer industry treatment of netting deal expenses with investment banking revenues was superseded under the new guidance. As a result of adopting ASU 2014-09, the Company now presents investment banking revenues gross of related client reimbursed deal expenses and deal-related expenses as non-interest expenses on the consolidated statements of operations, rather than the previous presentation of netting deal expenses incurred for completed investment banking deals within revenues. For the year ended December 31, 2018, the Company reported higher investment banking revenues and higher non-compensation expenses of $25.1 million. This change did not impact earnings. In addition, the Company now defers the recognition of performance fees on its merchant banking, energy and senior living alternative asset management funds until such fees are no longer subject to reversal, which will cause a delay in the recognition of these fees as revenue. For the year ended December 31, 2018, the amount of asset management revenue from performance fees that the Company would have recognized if not for this change was not material. With the exception of the above, the Company's previous methods of recognizing investment banking revenues were not significantly impacted by the new guidance.
Recognition and Measurement of Financial Assets and Financial Liabilities
In January 2016, the FASB issued ASU No. 2016-01, "Financial Instruments – Overall (Subtopic 825-10): Recognition and Measurement of Financial Assets and Financial Liabilities" ("ASU 2016-01"). The amendments in ASU 2016-01 address certain aspects of the recognition, measurement, presentation and disclosure of financial instruments. ASU 2016-01 became effective for the Company as of January 1, 2018. There was no material impact to the Company's results of operations, financial position or disclosures upon adoption as the Company's financial instruments were already recorded at fair value.
Statement of Cash Flows
In August 2016, the FASB issued ASU No. 2016-15, "Statement of Cash Flows (Topic 230): Classification of Certain Cash Receipts and Cash Payments" ("ASU 2016-15"). ASU 2016-15 clarifies how entities should classify certain cash receipts and cash payments on the statement of cash flows. The amendments in ASU 2016-15 became effective for the Company as of January 1, 2018, with retrospective application. There was no material impact to the Company's presentation of its consolidated statements of cash flows upon adoption of ASU 2016-15.
In November 2016, the FASB issued ASU No. 2016-18, "Statement of Cash Flows (Topic 230): Restricted Cash" ("ASU 2016-18"). Under ASU 2016-18, restricted cash will be included with cash and cash equivalents when reconciling the beginning-of-period and end-of-period amounts shown on the consolidated statements of cash flows. ASU 2016-18 was effective for the Company as of January 1, 2018, with retrospective application. As a registered broker dealer, Piper Jaffray is subject to Rule 15c3-3 of the Securities Exchange Act of 1934, as amended, which requires broker dealers carrying customer accounts to maintain cash or qualified securities in a segregated reserve account for the exclusive benefit of its customers. These accounts were previously classified as cash and cash equivalents segregated for regulatory purposes on the consolidated statements of financial condition. Subsequent to transitioning to a fully disclosed clearing model in 2017, Piper Jaffray no longer carries customer
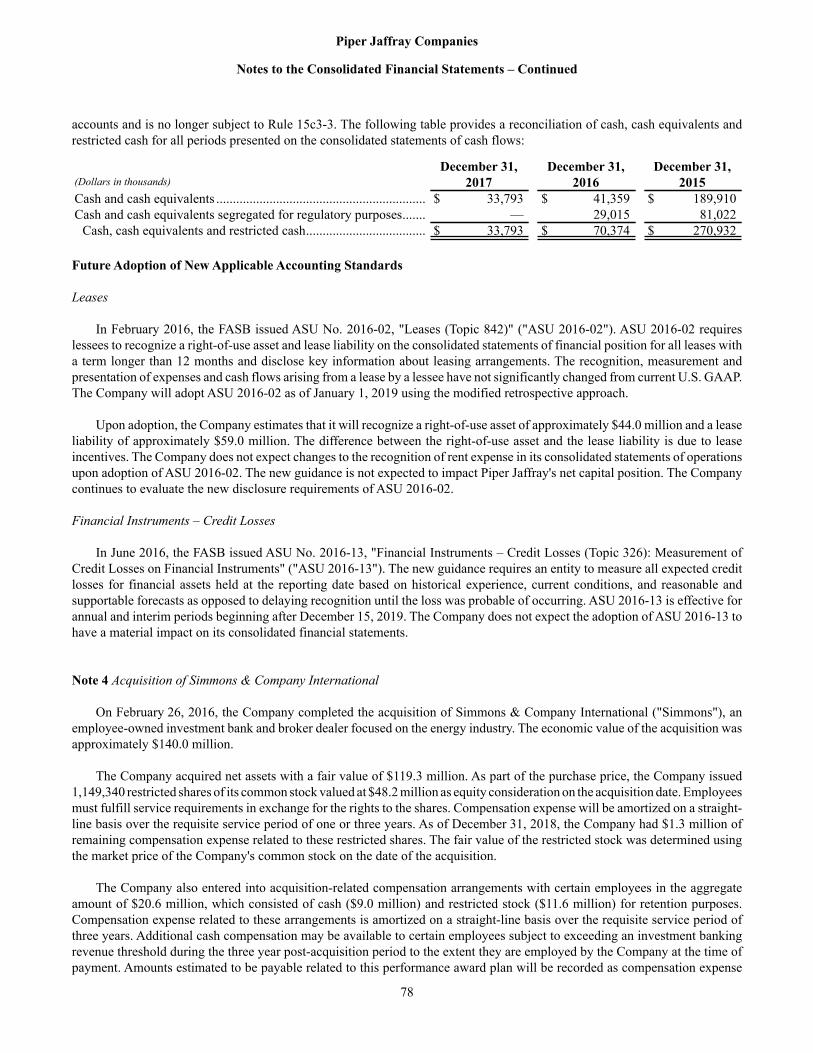
Piper Jaffray Companies
Notes to the Consolidated Financial Statements – Continued
78
accounts and is no longer subject to Rule 15c3-3. The following table provides a reconciliation of cash, cash equivalents and restricted cash for all periods presented on the consolidated statements of cash flows:
December 31, December 31, December 31,(Dollars in thousands) 2017 2016 2015Cash and cash equivalents ............................................................... $ 33,793 $ 41,359 $ 189,910Cash and cash equivalents segregated for regulatory purposes....... — 29,015 81,022
Cash, cash equivalents and restricted cash.................................... $ 33,793 $ 70,374 $ 270,932
Future Adoption of New Applicable Accounting Standards
Leases
In February 2016, the FASB issued ASU No. 2016-02, "Leases (Topic 842)" ("ASU 2016-02"). ASU 2016-02 requires lessees to recognize a right-of-use asset and lease liability on the consolidated statements of financial position for all leases with a term longer than 12 months and disclose key information about leasing arrangements. The recognition, measurement and presentation of expenses and cash flows arising from a lease by a lessee have not significantly changed from current U.S. GAAP. The Company will adopt ASU 2016-02 as of January 1, 2019 using the modified retrospective approach.
Upon adoption, the Company estimates that it will recognize a right-of-use asset of approximately $44.0 million and a lease liability of approximately $59.0 million. The difference between the right-of-use asset and the lease liability is due to lease incentives. The Company does not expect changes to the recognition of rent expense in its consolidated statements of operations upon adoption of ASU 2016-02. The new guidance is not expected to impact Piper Jaffray's net capital position. The Company continues to evaluate the new disclosure requirements of ASU 2016-02.
Financial Instruments – Credit Losses
In June 2016, the FASB issued ASU No. 2016-13, "Financial Instruments – Credit Losses (Topic 326): Measurement of Credit Losses on Financial Instruments" ("ASU 2016-13"). The new guidance requires an entity to measure all expected credit losses for financial assets held at the reporting date based on historical experience, current conditions, and reasonable and supportable forecasts as opposed to delaying recognition until the loss was probable of occurring. ASU 2016-13 is effective for annual and interim periods beginning after December 15, 2019. The Company does not expect the adoption of ASU 2016-13 to have a material impact on its consolidated financial statements.
Note 4 Acquisition of Simmons & Company International
On February 26, 2016, the Company completed the acquisition of Simmons & Company International ("Simmons"), an employee-owned investment bank and broker dealer focused on the energy industry. The economic value of the acquisition was approximately $140.0 million.
The Company acquired net assets with a fair value of $119.3 million. As part of the purchase price, the Company issued 1,149,340 restricted shares of its common stock valued at $48.2 million as equity consideration on the acquisition date. Employees must fulfill service requirements in exchange for the rights to the shares. Compensation expense will be amortized on a straight-line basis over the requisite service period of one or three years. As of December 31, 2018, the Company had $1.3 million of remaining compensation expense related to these restricted shares. The fair value of the restricted stock was determined using the market price of the Company's common stock on the date of the acquisition.
The Company also entered into acquisition-related compensation arrangements with certain employees in the aggregate amount of $20.6 million, which consisted of cash ($9.0 million) and restricted stock ($11.6 million) for retention purposes. Compensation expense related to these arrangements is amortized on a straight-line basis over the requisite service period of three years. Additional cash compensation may be available to certain employees subject to exceeding an investment banking revenue threshold during the three year post-acquisition period to the extent they are employed by the Company at the time of payment. Amounts estimated to be payable related to this performance award plan will be recorded as compensation expense

Piper Jaffray Companies
Notes to the Consolidated Financial Statements – Continued
79
on the consolidated statements of operations over the requisite performance period of three years. As of December 31, 2018, the Company had accrued $39.7 million related to this performance award plan, of which $8.9 million, $27.0 million and $4.3 million was recorded as compensation expense for the years ended December 31, 2018, 2017 and 2016, respectively.
The acquisition was accounted for pursuant to FASB Accounting Standards Codification Topic 805, "Business Combinations." Accordingly, the purchase price was allocated to the acquired assets and liabilities assumed based on their estimated fair values as of the acquisition date. The excess of the purchase price over the net assets acquired was allocated between goodwill and intangible assets within the Capital Markets segment. The Company recorded $60.7 million of goodwill on its consolidated statements of financial condition, of which $59.4 million is expected to be deductible for income tax purposes. In management's opinion, the goodwill represents the reputation and operating expertise of Simmons.
Identifiable intangible assets purchased by the Company consisted of customer relationships and the Simmons trade name with acquisition-date fair values of $17.5 million and $9.1 million, respectively. Transaction costs of $0.9 million were incurred for the year ended December 31, 2016, and are included in restructuring and integration costs on the consolidated statements of operations.
Simmons' results of operations have been included in the Company's consolidated financial statements prospectively beginning on the date of acquisition. The acquisition has been fully integrated with the Company's existing operations. Accordingly, post-acquisition revenues and net income are not discernible.
Note 5 Financial Instruments and Other Inventory Positions Owned and Financial Instruments and Other Inventory Positions Sold, but Not Yet Purchased
December 31, December 31,(Dollars in thousands) 2018 2017Financial instruments and other inventory positions owned:Corporate securities:
Equity securities ........................................................................................................... $ 1,458 $ 51,896Convertible securities ................................................................................................... 92,485 74,456Fixed income securities ................................................................................................ 31,906 30,145
Municipal securities:Taxable securities ......................................................................................................... 38,711 67,699Tax-exempt securities................................................................................................... 268,804 744,241Short-term securities .................................................................................................... 52,472 62,251
Mortgage-backed securities ............................................................................................ 15 481U.S. government agency securities................................................................................. 123,384 317,318U.S. government securities ............................................................................................. 954 9,317Derivative contracts ........................................................................................................ 17,033 25,573Total financial instruments and other inventory positions owned.................................. $ 627,222 $ 1,383,377
Financial instruments and other inventory positions sold, but not yet purchased:Corporate securities:
Equity securities ........................................................................................................... $ 82,082 $ 101,517Fixed income securities ................................................................................................ 20,180 30,292
U.S. government agency securities................................................................................. 10,257 49,077U.S. government securities ............................................................................................. 60,365 213,312Derivative contracts ........................................................................................................ 4,543 5,029Total financial instruments and other inventory positions sold, but not yet purchased.. $ 177,427 $ 399,227
At December 31, 2018 and 2017, financial instruments and other inventory positions owned in the amount of $147.4 million and $720.0 million, respectively, had been pledged as collateral for short-term financings.

Piper Jaffray Companies
Notes to the Consolidated Financial Statements – Continued
80
Financial instruments and other inventory positions sold, but not yet purchased represent obligations of the Company to deliver the specified security at the contracted price, thereby creating a liability to purchase the security in the market at prevailing prices. The Company is obligated to acquire the securities sold short at prevailing market prices, which may exceed the amount reflected on the consolidated statements of financial condition. The Company economically hedges changes in the market value of its financial instruments and other inventory positions owned using inventory positions sold, but not yet purchased, interest rate derivatives, credit default swap index contracts, U.S. treasury bond futures and exchange traded options.
Derivative Contract Financial Instruments
The Company uses interest rate swaps, interest rate locks, credit default swap index contracts, U.S. treasury bond futures and equity option contracts as a means to manage risk in certain inventory positions. The Company also enters into interest rate swaps to facilitate customer transactions. The following describes the Company's derivatives by the type of transaction or security the instruments are economically hedging.
Customer matched-book derivatives: The Company enters into interest rate derivative contracts in a principal capacity as a dealer to satisfy the financial needs of its customers. The Company simultaneously enters into an interest rate derivative contract with a third party for the same notional amount to hedge the interest rate and credit risk of the initial client interest rate derivative contract. In certain limited instances, the Company has only hedged interest rate risk with a third party, and retains uncollateralized credit risk as described below. The instruments use interest rates based upon either the London Interbank Offer Rate ("LIBOR") index or the Securities Industry and Financial Markets Association ("SIFMA") index.
Trading securities derivatives: The Company enters into interest rate derivative contracts and uses U.S. treasury bond futures to hedge interest rate and market value risks associated with its fixed income securities. These instruments use interest rates based upon the Municipal Market Data ("MMD") index, LIBOR or the SIFMA index. The Company also enters into credit default swap index contracts to hedge credit risk associated with its taxable fixed income securities and option contracts to hedge market value risk associated with its convertible securities.
Derivatives are reported on a net basis by counterparty (i.e., the net payable or receivable for derivative assets and liabilities for a given counterparty) when a legal right of offset exists and on a net basis by cross product when applicable provisions are stated in master netting agreements. Cash collateral received or paid is netted on a counterparty basis, provided a legal right of offset exists. The total absolute notional contract amount, representing the absolute value of the sum of gross long and short derivative contracts, provides an indication of the volume of the Company's derivative activity and does not represent gains and losses. The following table presents the gross fair market value and the total absolute notional contract amount of the Company's outstanding derivative instruments, prior to counterparty netting, by asset or liability position:
December 31, 2018 December 31, 2017(Dollars in thousands) Derivative Derivative Notional Derivative Derivative NotionalDerivative Category Assets (1) Liabilities (2) Amount Assets (1) Liabilities (2) AmountInterest rate
Customer matched-book ............ $ 181,199 $ 169,950 $ 2,532,966 $ 239,224 $ 225,890 $ 2,819,006Trading securities....................... 408 4,202 262,275 126 4,459 399,450
Equity optionsTrading securities....................... — — — 6 — 9,635
$ 181,607 $ 174,152 $ 2,795,241 $ 239,356 $ 230,349 $ 3,228,091(1) Derivative assets are included within financial instruments and other inventory positions owned on the consolidated statements of financial condition.(2) Derivative liabilities are included within financial instruments and other inventory positions sold, but not yet purchased on the consolidated statements
of financial condition.

Piper Jaffray Companies
Notes to the Consolidated Financial Statements – Continued
81
The Company's derivative contracts do not qualify for hedge accounting, therefore, unrealized gains and losses are recorded on the consolidated statements of operations. The gains and losses on the related economically hedged inventory positions are not disclosed below as they are not in qualifying hedging relationships. The following table presents the Company's unrealized gains/(losses) on derivative instruments:
(Dollars in thousands) Year Ended December 31,Derivative Category Operations Category 2018 2017 2016Interest rate derivative contract ............... Investment banking $ (1,880) $ (2,608) $ (4,151)Interest rate derivative contract ............... Institutional brokerage 334 (16,772) 19,613Credit default swap index contract.......... Institutional brokerage — 4,482 4,317Futures and equity option derivativecontracts ................................................ Institutional brokerage — (17) 255
$ (1,546) $ (14,915) $ 20,034
Credit risk associated with the Company's derivatives is the risk that a derivative counterparty will not perform in accordance with the terms of the applicable derivative contract. Credit exposure associated with the Company's derivatives is driven by uncollateralized market movements in the fair value of the contracts with counterparties and is monitored regularly by the Company's financial risk committee. The Company considers counterparty credit risk in determining derivative contract fair value. The majority of the Company's derivative contracts are substantially collateralized by its counterparties, who are major financial institutions. The Company has a limited number of counterparties who are not required to post collateral. Based on market movements, the uncollateralized amounts representing the fair value of the derivative contract can become material, exposing the Company to the credit risk of these counterparties. As of December 31, 2018, the Company had $15.9 million of uncollateralized credit exposure with these counterparties (notional contract amount of $176.8 million), including $12.5 million of uncollateralized credit exposure with one counterparty.
Note 6 Fair Value of Financial Instruments
Based on the nature of the Company's business and its role as a "dealer" in the securities industry or as a manager of alternative asset management funds, the fair values of its financial instruments are determined internally. The Company's processes are designed to ensure that the fair values used for financial reporting are based on observable inputs wherever possible. In the event that observable inputs are not available, unobservable inputs are developed based on an evaluation of all relevant empirical market data, including prices evidenced by market transactions, interest rates, credit spreads, volatilities and correlations and other security-specific information. Valuation adjustments related to illiquidity or counterparty credit risk are also considered. In estimating fair value, the Company may utilize information provided by third party pricing vendors to corroborate internally-developed fair value estimates.
The Company employs specific control processes to determine the reasonableness of the fair value of its financial instruments. The Company's processes are designed to ensure that the internally-estimated fair values are accurately recorded and that the data inputs and the valuation techniques used are appropriate, consistently applied, and that the assumptions are reasonable and consistent with the objective of determining fair value. Individuals outside of the trading departments perform independent pricing verification reviews as of each reporting date. The Company has established parameters which set forth when the fair value of securities are independently verified. The selection parameters are generally based upon the type of security, the level of estimation risk of a security, the materiality of the security to the Company's financial statements, changes in fair value from period to period, and other specific facts and circumstances of the Company's securities portfolio. In evaluating the initial internally-estimated fair values made by the Company's traders, the nature and complexity of securities involved (e.g., term, coupon, collateral, and other key drivers of value), level of market activity for securities, and availability of market data are considered. The independent price verification procedures include, but are not limited to, analysis of trade data (both internal and external where available), corroboration to the valuation of positions with similar characteristics, risks and components, or comparison to an alternative pricing source, such as a discounted cash flow model. The Company's valuation committee, comprised of members of senior management and risk management, provides oversight and overall responsibility for the internal control processes and procedures related to fair value measurements.

Piper Jaffray Companies
Notes to the Consolidated Financial Statements – Continued
82
The following is a description of the valuation techniques used to measure fair value.
Cash Equivalents
Cash equivalents include highly liquid investments with original maturities of 90 days or less. Actively traded money market funds are measured at their net asset value and classified as Level I.
Financial Instruments and Other Inventory Positions Owned
The Company records financial instruments and other inventory positions owned and financial instruments and other inventory positions sold, but not yet purchased at fair value on the consolidated statements of financial condition with unrealized gains and losses reflected on the consolidated statements of operations.
Equity securities – Exchange traded equity securities are valued based on quoted prices from the exchange for identical assets or liabilities as of the period-end date. To the extent these securities are actively traded and valuation adjustments are not applied, they are categorized as Level I. Non-exchange traded equity securities (principally hybrid preferred securities) are measured primarily using broker quotations, prices observed for recently executed market transactions and internally-developed fair value estimates based on observable inputs and are categorized within Level II of the fair value hierarchy.
Convertible securities – Convertible securities are valued based on observable trades, when available. Accordingly, these convertible securities are categorized as Level II.
Corporate fixed income securities – Fixed income securities include corporate bonds which are valued based on recently executed market transactions of comparable size, internally-developed fair value estimates based on observable inputs, or broker quotations. Accordingly, these corporate bonds are categorized as Level II.
Taxable municipal securities – Taxable municipal securities are valued using recently executed observable trades or market price quotations and therefore are generally categorized as Level II.
Tax-exempt municipal securities – Tax-exempt municipal securities are valued using recently executed observable trades or market price quotations and therefore are generally categorized as Level II. Certain illiquid tax-exempt municipal securities are valued using market data for comparable securities (e.g., maturity and sector) and management judgment to infer an appropriate current yield or other model-based valuation techniques deemed appropriate by management based on the specific nature of the individual security and are therefore categorized as Level III.
Short-term municipal securities – Short-term municipal securities include auction rate securities, variable rate demand notes, and other short-term municipal securities. Variable rate demand notes and other short-term municipal securities are valued using recently executed observable trades or market price quotations and therefore are generally categorized as Level II. Auction rate securities with limited liquidity are categorized as Level III and are valued using discounted cash flow models with unobservable inputs such as the Company's expected recovery rate on the securities.
Mortgage-backed securities – Mortgage-backed securities are valued using observable trades, when available. Certain mortgage-backed securities are valued using models where inputs to the model are directly observable in the market, or can be derived principally from or corroborated by observable market data. To the extent we hold, these mortgage-backed securities are categorized as Level II. Certain mortgage-backed securities collateralized by residential mortgages are valued using cash flow models that utilize unobservable inputs including credit default rates, prepayment rates, loss severity and valuation yields. As judgment is used to determine the range of these inputs, these mortgage-backed securities are categorized as Level III.
U.S. government agency securities – U.S. government agency securities include agency debt bonds and mortgage bonds. Agency debt bonds are valued by using either direct price quotes or price quotes for comparable bond securities and are categorized as Level II. Mortgage bonds include bonds secured by mortgages, mortgage pass-through securities, agency collateralized mortgage-obligation ("CMO") securities and agency interest-only securities. Mortgage pass-through securities, CMO securities and interest-only securities are valued using recently executed observable trades or other observable inputs, such as prepayment speeds and therefore are generally categorized as Level II. Mortgage bonds are valued using observable market inputs, such as

Piper Jaffray Companies
Notes to the Consolidated Financial Statements – Continued
83
market yields on spreads over U.S. treasury securities, or models based upon prepayment expectations. These securities are categorized as Level II.
U.S. government securities – U.S. government securities include highly liquid U.S. treasury securities which are generally valued using quoted market prices and therefore categorized as Level I. The Company does not transact in securities of countries other than the U.S. government.
Derivatives – Derivative contracts include interest rate swaps, interest rate locks, credit default swap index contracts, U.S. treasury bond futures and equity option contracts. These instruments derive their value from underlying assets, reference rates, indices or a combination of these factors. The Company's equity option derivative contracts are valued based on quoted prices from the exchange for identical assets or liabilities as of the period-end date. To the extent these contracts are actively traded and valuation adjustments are not applied, they are categorized as Level I. The Company's credit default swap index contracts are valued using market price quotations and are classified as Level II. The majority of the Company's interest rate derivative contracts, including both interest rate swaps and interest rate locks, are valued using market standard pricing models based on the net present value of estimated future cash flows. The valuation models used do not involve material subjectivity as the methodologies do not entail significant judgment and the pricing inputs are market observable, including contractual terms, yield curves and measures of volatility. These instruments are classified as Level II within the fair value hierarchy. Certain interest rate locks transact in less active markets and were valued using valuation models that included the previously mentioned observable inputs and certain unobservable inputs that required significant judgment, such as the premium over the MMD curve. These instruments are classified as Level III.
Investments
The Company's investments valued at fair value include equity investments in private companies and partnerships and investments in registered mutual funds. Investments in registered mutual funds are valued based on quoted prices on active markets and classified as Level I. Investments in private companies are valued based on an assessment of each underlying security, considering rounds of financing, third party transactions and market-based information, including comparable company transactions, trading multiples (e.g., multiples of revenue and earnings before interest, taxes, depreciation and amortization ("EBITDA")) and changes in market outlook, among other factors. These securities are generally categorized as Level III.
Fair Value Option – The fair value option permits the irrevocable fair value option election on an instrument-by-instrument basis at initial recognition of an asset or liability or upon an event that gives rise to a new basis of accounting for that instrument. The fair value option was elected for certain merchant banking and other investments at inception to reflect economic events in earnings on a timely basis. Merchant banking and other equity investments of $3.0 million and $14.1 million, included within investments on the consolidated statements of financial condition, are accounted for at fair value and are classified as Level III assets at December 31, 2018 and 2017, respectively. The realized and unrealized net gains from fair value changes included in earnings as a result of electing to apply the fair value option to certain financial assets were $0.6 million, $1.6 million and $1.8 million for the years ended December 31, 2018, 2017 and 2016, respectively.

Piper Jaffray Companies
Notes to the Consolidated Financial Statements – Continued
84
The following table summarizes quantitative information about the significant unobservable inputs used in the fair value measurement of the Company's Level III financial instruments as of December 31, 2018:
Valuation WeightedTechnique Unobservable Input Range Average (1)
Assets:Investments at fair value:
Equity securities in privatecompanies .......................... Market approach Revenue multiple (2) 2 - 5 times 4.4 times
EBITDA multiple (2) 13 - 16 times 14.1 times
Liabilities:Financial instruments andother inventory positionssold, but not yet purchased:
Derivative contracts:
Interest rate locks................. Discounted cash flowPremium over the MMD curvein basis points ("bps") (3) 1 - 8 bps 2.6 bps
Uncertainty of fair value measurements:(1) Unobservable inputs were weighted by the relative fair value of the financial instruments.(2) Significant increase/(decrease) in the unobservable input in isolation would have resulted in a significantly higher/(lower) fair value
measurement.(3) Significant increase/(decrease) in the unobservable input in isolation would have resulted in a significantly lower/(higher) fair value
measurement.

Piper Jaffray Companies
Notes to the Consolidated Financial Statements – Continued
85
The following table summarizes the valuation of the Company's financial instruments by pricing observability levels defined in ASC 820 as of December 31, 2018:
Counterpartyand CashCollateral
(Dollars in thousands) Level I Level II Level III Netting (1) TotalAssets:Financial instruments and otherinventory positions owned:Corporate securities:
Equity securities ............................ $ 331 $ 1,127 $ — $ — $ 1,458Convertible securities .................... — 92,485 — — 92,485Fixed income securities ................. — 31,906 — — 31,906
Municipal securities:Taxable securities .......................... — 38,711 — — 38,711Tax-exempt securities.................... — 268,804 — — 268,804Short-term securities...................... — 52,472 — — 52,472
Mortgage-backed securities ............. — — 15 — 15U.S. government agency securities.. — 123,384 — — 123,384U.S. government securities .............. 954 — — — 954Derivative contracts ......................... — 181,378 229 (164,574) 17,033
Total financial instruments and otherinventory positions owned................ 1,285 790,267 244 (164,574) 627,222
Cash equivalents................................. 20,581 — — — 20,581
Investments at fair value .................... 33,587 2,649 107,792 (2) — 144,028Total assets ......................................... $ 55,453 $ 792,916 $ 108,036 $ (164,574) $ 791,831
Liabilities:Financial instruments and otherinventory positions sold, but not yetpurchased:Corporate securities:
Equity securities ............................ $ 81,575 $ 507 $ — $ — $ 82,082Fixed income securities ................. — 20,180 — — 20,180
U.S. government agency securities.. — 10,257 — — 10,257U.S. government securities .............. 60,365 — — — 60,365Derivative contracts ......................... — 169,950 4,202 (169,609) 4,543
Total financial instruments and otherinventory positions sold, but not yetpurchased.......................................... $ 141,940 $ 200,894 $ 4,202 $ (169,609) $ 177,427
(1) Represents cash collateral and the impact of netting on a counterparty basis. The Company had no securities posted as collateral to its counterparties.
(2) Noncontrolling interests of $53.0 million are attributable to third party ownership in consolidated merchant banking and senior living funds.

Piper Jaffray Companies
Notes to the Consolidated Financial Statements – Continued
86
The following table summarizes the valuation of the Company's financial instruments by pricing observability levels defined in ASC 820 as of December 31, 2017:
Counterpartyand CashCollateral
(Dollars in thousands) Level I Level II Level III Netting (1) TotalAssets:Financial instruments and otherinventory positions owned:Corporate securities:
Equity securities ............................ $ 1,863 $ 50,033 $ — $ — $ 51,896Convertible securities .................... — 74,456 — — 74,456Fixed income securities ................. — 30,145 — — 30,145
Municipal securities:Taxable securities .......................... — 67,699 — — 67,699Tax-exempt securities.................... — 743,541 700 — 744,241Short-term securities...................... — 61,537 714 — 62,251
Mortgage-backed securities ............. — — 481 — 481U.S. government agency securities.. — 317,318 — — 317,318U.S. government securities .............. 9,317 — — — 9,317Derivative contracts ......................... 6 239,224 126 (213,783) 25,573
Total financial instruments and otherinventory positions owned................ 11,186 1,583,953 2,021 (213,783) 1,383,377
Cash equivalents................................. 3,782 — — — 3,782
Investments at fair value .................... 39,504 — 126,060 (2) — 165,564Total assets ......................................... $ 54,472 $ 1,583,953 $ 128,081 $ (213,783) $ 1,552,723
Liabilities:Financial instruments and otherinventory positions sold, but not yetpurchased:Corporate securities:
Equity securities ............................ $ 91,934 $ 9,583 $ — $ — $ 101,517Fixed income securities ................. — 30,292 — — 30,292
U.S. government agency securities.. — 49,077 — — 49,077U.S. government securities .............. 213,312 — — — 213,312Derivative contracts ......................... — 225,916 4,433 (225,320) 5,029
Total financial instruments and otherinventory positions sold, but not yetpurchased.......................................... $ 305,246 $ 314,868 $ 4,433 $ (225,320) $ 399,227
(1) Represents cash collateral and the impact of netting on a counterparty basis. The Company had no securities posted as collateral to its counterparties.
(2) Noncontrolling interests of $44.4 million are attributable to third party ownership in consolidated merchant banking and senior living funds.
The Company's Level III assets were $108.0 million and $128.1 million, or 13.6 percent and 8.2 percent of financial instruments measured at fair value at December 31, 2018 and 2017, respectively. There were $1.2 million of transfers of financial assets out of Level III for the year ended December 31, 2018. There were no other significant transfers between Level I, Level II or Level III for the year ended December 31, 2018.
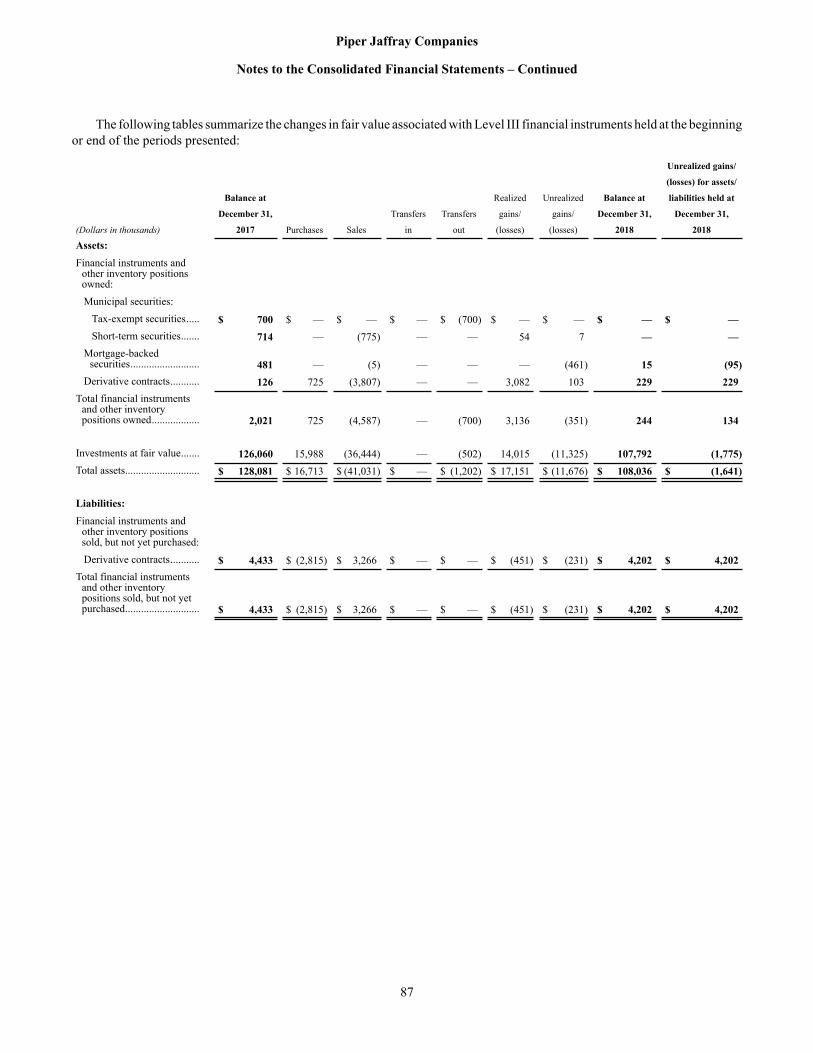
Piper Jaffray Companies
Notes to the Consolidated Financial Statements – Continued
87
The following tables summarize the changes in fair value associated with Level III financial instruments held at the beginning or end of the periods presented:
Unrealized gains/
(losses) for assets/
Balance at Realized Unrealized Balance at liabilities held at
December 31, Transfers Transfers gains/ gains/ December 31, December 31,
(Dollars in thousands) 2017 Purchases Sales in out (losses) (losses) 2018 2018
Assets:Financial instruments and
other inventory positionsowned:Municipal securities:
Tax-exempt securities..... $ 700 $ — $ — $ — $ (700) $ — $ — $ — $ —Short-term securities....... 714 — (775) — — 54 7 — —
Mortgage-backedsecurities.......................... 481 — (5) — — — (461) 15 (95)
Derivative contracts........... 126 725 (3,807) — — 3,082 103 229 229Total financial instruments
and other inventorypositions owned.................. 2,021 725 (4,587) — (700) 3,136 (351) 244 134
Investments at fair value....... 126,060 15,988 (36,444) — (502) 14,015 (11,325) 107,792 (1,775)Total assets............................ $ 128,081 $ 16,713 $ (41,031) $ — $ (1,202) $ 17,151 $ (11,676) $ 108,036 $ (1,641)
Liabilities:Financial instruments and
other inventory positionssold, but not yet purchased:Derivative contracts........... $ 4,433 $ (2,815) $ 3,266 $ — $ — $ (451) $ (231) $ 4,202 $ 4,202
Total financial instrumentsand other inventorypositions sold, but not yetpurchased............................ $ 4,433 $ (2,815) $ 3,266 $ — $ — $ (451) $ (231) $ 4,202 $ 4,202

Piper Jaffray Companies
Notes to the Consolidated Financial Statements – Continued
88
Unrealized gains/
(losses) for assets/
Balance at Realized Unrealized Balance at liabilities held at
December 31, Transfers Transfers gains/ gains/ December 31, December 31,
(Dollars in thousands) 2016 Purchases Sales in out (losses) (losses) 2017 2017
Assets:Financial instruments and
other inventory positionsowned:Municipal securities:
Taxable securities........... $ 2,686 $ — $ (2,703) $ — $ — $ 716 $ (699) $ — $ —Tax-exempt securities .... 1,077 — (267) — — — (110) 700 (110)Short-term securities ...... 744 — (25) — — 2 (7) 714 (7)
Mortgage-backedsecurities ......................... 5,365 996 (5,608) — — 203 (475) 481 (45)
Derivative contracts .......... 13,952 109 (11,469) — — 11,360 (13,826) 126 126Total financial instruments
and other inventorypositions owned ................. 23,824 1,105 (20,072) — — 12,281 (15,117) 2,021 (36)
Investments at fair value ...... 123,319 31,362 (37,004) — (601) (2,585) 11,569 126,060 14,960Total assets ........................... $ 147,143 $ 32,467 $(57,076) $ — $ (601) $ 9,696 $ (3,548) $ 128,081 $ 14,924
Liabilities:Financial instruments and
other inventory positionssold, but not yetpurchased:Derivative contracts .......... $ 1,487 $(17,083) $ 211 $ — $ — $ 16,872 $ 2,946 $ 4,433 $ 4,433
Total financial instrumentsand other inventorypositions sold, but not yetpurchased ........................... $ 1,487 $(17,083) $ 211 $ — $ — $ 16,872 $ 2,946 $ 4,433 $ 4,433
Realized and unrealized gains/(losses) related to financial instruments, with the exception of customer matched-book derivatives, are reported in institutional brokerage on the consolidated statements of operations. Realized and unrealized gains/(losses) related to customer matched-book derivatives are reported in investment banking. Realized and unrealized gains/(losses) related to investments are reported in investment banking revenues or investment income on the consolidated statements of operations.
The carrying values of the Company's cash, receivables and payables either from or to brokers, dealers and clearing organizations and short-term financings approximate fair value due to their liquid or short-term nature.
Non-Recurring Fair Value Measurements
The Company recorded non-cash goodwill impairment charges of $114.4 million and $82.9 million for the years ended December 31, 2017 and 2016, respectively, representing the full value of goodwill attributable to the asset management reporting unit. The fair value measurements used in the analyses were calculated using the income approach (discounted cash flow method) and market approach (earnings multiples of public company comparables). The discounted cash flow models were calculated using unobservable inputs, such as revenue and EBITDA forecasts, which are classified as Level III within the fair value hierarchy. See Note 11 for further discussion.

Piper Jaffray Companies
Notes to the Consolidated Financial Statements – Continued
89
Note 7 Variable Interest Entities ("VIEs")
The Company has investments in and/or acts as the managing partner of various partnerships, limited liability companies, or registered mutual funds. These entities were established for the purpose of investing in securities of public or private companies, or municipal debt obligations, or providing financing to senior living facilities, and were initially financed through the capital commitments or seed investments of the members.
VIEs are entities in which equity investors lack the characteristics of a controlling financial interest or do not have sufficient equity at risk for the entity to finance its activities. The determination as to whether an entity is a VIE is based on the structure and nature of each entity. The Company also considers other characteristics such as the power through voting rights or similar rights to direct the activities of an entity that most significantly impact the entity's economic performance and how the entity is financed.
The Company is required to consolidate all VIEs for which it is considered to be the primary beneficiary. The determination as to whether the Company is considered to be the primary beneficiary is based on whether the Company has both the power to direct the activities of the VIE that most significantly impact the entity's economic performance and the obligation to absorb losses or the right to receive benefits of the VIE that could potentially be significant to the VIE.
Consolidated VIEs
The Company's consolidated VIEs at December 31, 2018 include certain alternative asset management funds in which the Company has an investment and, as the managing partner, is deemed to have both the power to direct the most significant activities of the funds and the right to receive benefits (or the obligation to absorb losses) that could potentially be significant to these funds.
The following table presents information about the carrying value of the assets and liabilities of the VIEs which are consolidated by the Company and included on the consolidated statements of financial condition at December 31, 2018. The assets can only be used to settle the liabilities of the respective VIE, and the creditors of the VIEs do not have recourse to the general credit of the Company. One of these VIEs has $25.0 million of bank line financing available with an interest rate based on prime plus an applicable margin. The assets and liabilities are presented prior to consolidation, and thus a portion of these assets and liabilities are eliminated in consolidation.
Alternative Asset(Dollars in thousands) Management FundsAssets:
Investments........................................................................................................................................ $ 103,884Other assets........................................................................................................................................ 600
Total assets........................................................................................................................................... $ 104,484
Liabilities:Other liabilities and accrued expenses .............................................................................................. $ 1,340
Total liabilities ..................................................................................................................................... $ 1,340
The Company has investments in a grantor trust which was established as part of a nonqualified deferred compensation plan. The Company is the primary beneficiary of the grantor trust. Accordingly, the assets and liabilities of the grantor trust are consolidated by the Company on the consolidated statements of financial condition. See Note 19 for additional information on the nonqualified deferred compensation plan.
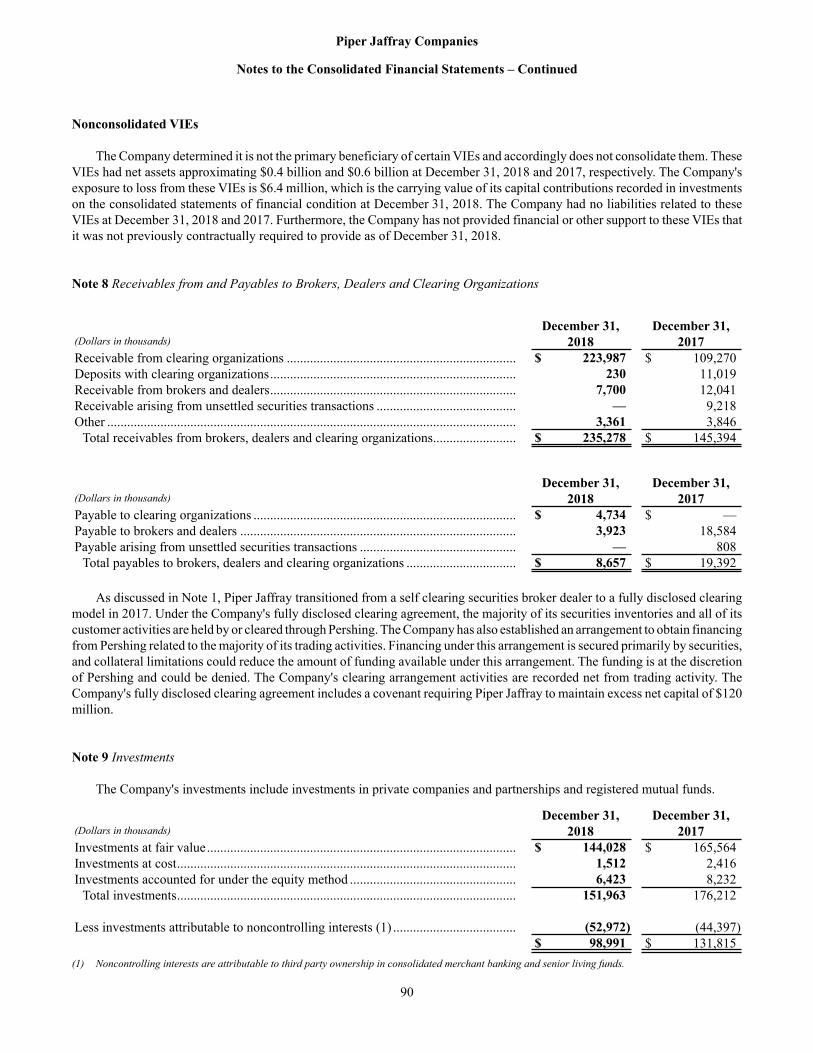
Piper Jaffray Companies
Notes to the Consolidated Financial Statements – Continued
90
Nonconsolidated VIEs
The Company determined it is not the primary beneficiary of certain VIEs and accordingly does not consolidate them. These VIEs had net assets approximating $0.4 billion and $0.6 billion at December 31, 2018 and 2017, respectively. The Company's exposure to loss from these VIEs is $6.4 million, which is the carrying value of its capital contributions recorded in investments on the consolidated statements of financial condition at December 31, 2018. The Company had no liabilities related to these VIEs at December 31, 2018 and 2017. Furthermore, the Company has not provided financial or other support to these VIEs that it was not previously contractually required to provide as of December 31, 2018.
Note 8 Receivables from and Payables to Brokers, Dealers and Clearing Organizations
December 31, December 31,(Dollars in thousands) 2018 2017Receivable from clearing organizations ..................................................................... $ 223,987 $ 109,270Deposits with clearing organizations.......................................................................... 230 11,019Receivable from brokers and dealers.......................................................................... 7,700 12,041Receivable arising from unsettled securities transactions .......................................... — 9,218Other ........................................................................................................................... 3,361 3,846
Total receivables from brokers, dealers and clearing organizations......................... $ 235,278 $ 145,394
December 31, December 31,(Dollars in thousands) 2018 2017Payable to clearing organizations ............................................................................... $ 4,734 $ —Payable to brokers and dealers ................................................................................... 3,923 18,584Payable arising from unsettled securities transactions ............................................... — 808
Total payables to brokers, dealers and clearing organizations ................................. $ 8,657 $ 19,392
As discussed in Note 1, Piper Jaffray transitioned from a self clearing securities broker dealer to a fully disclosed clearing model in 2017. Under the Company's fully disclosed clearing agreement, the majority of its securities inventories and all of its customer activities are held by or cleared through Pershing. The Company has also established an arrangement to obtain financing from Pershing related to the majority of its trading activities. Financing under this arrangement is secured primarily by securities, and collateral limitations could reduce the amount of funding available under this arrangement. The funding is at the discretion of Pershing and could be denied. The Company's clearing arrangement activities are recorded net from trading activity. The Company's fully disclosed clearing agreement includes a covenant requiring Piper Jaffray to maintain excess net capital of $120 million.
Note 9 Investments
The Company's investments include investments in private companies and partnerships and registered mutual funds.
December 31, December 31,(Dollars in thousands) 2018 2017Investments at fair value............................................................................................. $ 144,028 $ 165,564Investments at cost...................................................................................................... 1,512 2,416Investments accounted for under the equity method .................................................. 6,423 8,232
Total investments...................................................................................................... 151,963 176,212
Less investments attributable to noncontrolling interests (1) ..................................... (52,972) (44,397)$ 98,991 $ 131,815
(1) Noncontrolling interests are attributable to third party ownership in consolidated merchant banking and senior living funds.

Piper Jaffray Companies
Notes to the Consolidated Financial Statements – Continued
91
At December 31, 2018, investments carried on a cost basis had an estimated fair market value of $1.5 million. Because valuation estimates were based upon management's judgment, investments carried at cost would be categorized as Level III assets in the fair value hierarchy, if they were carried at fair value.
Investments accounted for under the equity method include general and limited partnership interests. The carrying value of these investments is based on the investment vehicle's net asset value. The net assets of investment partnerships consist of investments in both marketable and non-marketable securities. The underlying investments held by such partnerships are valued based on the estimated fair value determined by management in the Company's capacity as general partner or investor and, in the case of investments in unaffiliated investment partnerships, are based on financial statements prepared by the unaffiliated general partners.
Note 10 Other Assets
December 31, December 31,(Dollars in thousands) 2018 2017Fee receivables............................................................................................................ $ 23,120 $ 20,884Accrued interest receivables ....................................................................................... 4,240 6,981Forgivable loans, net................................................................................................... 7,568 7,452Prepaid expenses......................................................................................................... 9,477 6,769Other ........................................................................................................................... 7,332 12,748
Total other assets ...................................................................................................... $ 51,737 $ 54,834
Note 11 Goodwill and Intangible Assets
Capital Asset(Dollars in thousands) Markets Management TotalGoodwillBalance at December 31, 2016 ................................................. $ 81,855 $ 114,363 $ 196,218Impairment charge ...................................................................... — (114,363) (114,363)Balance at December 31, 2017 ................................................. $ 81,855 $ — $ 81,855Goodwill acquired ...................................................................... — — —Balance at December 31, 2018 ................................................. $ 81,855 $ — $ 81,855
Intangible assetsBalance at December 31, 2016 ................................................. $ 19,320 $ 17,914 $ 37,234Intangible assets acquired ........................................................... — 1,000 1,000Amortization of intangible assets ............................................... (10,178) (5,222) (15,400)Balance at December 31, 2017 ................................................. $ 9,142 $ 13,692 $ 22,834Intangible assets acquired ........................................................... — — —Amortization of intangible assets ............................................... (4,858) (5,602) (10,460)Balance at December 31, 2018 ................................................. $ 4,284 $ 8,090 $ 12,374
The Company tests goodwill and indefinite-life intangible assets for impairment on an annual basis and on an interim basis when circumstances exist that could indicate possible impairment. The Company tests for impairment at the reporting unit level, which is generally one level below its operating segments. The Company has identified two reporting units: capital markets and asset management. When testing for impairment, the Company has the option to first assess qualitative factors to determine whether it is more likely than not that the fair value of a reporting unit is less than its carrying amount. If, after making an assessment, the Company determines it is not more likely than not that the fair value of a reporting unit is less than its carrying amount, then further analysis is unnecessary. However, if the Company concludes otherwise, then the Company is required to perform a quantitative goodwill test, which requires management to make judgments in determining what assumptions to use

Piper Jaffray Companies
Notes to the Consolidated Financial Statements – Continued
92
in the calculation. The quantitative goodwill test compares the fair value of the reporting unit to its carrying value, including allocated goodwill. An impairment is recognized for the excess amount of a reporting unit's carrying value over its fair value. The estimated fair value of the reporting unit is derived based on valuation techniques that a market participant would use. The Company estimates the fair value of the reporting unit using the income approach (discounted cash flow method) and market approach (earnings and/or transaction multiples).
The Company performed its annual goodwill impairment testing for its capital markets reporting unit as of October 31, 2018, which resulted in no impairment. The annual goodwill impairment testing for 2017 and 2016 resulted in no impairment associated with the capital markets reporting unit.
The Company concluded there were $114.4 million and $82.9 million non-cash goodwill impairment charges relating to the asset management reporting unit in 2017 and 2016, respectively.
The Company also evaluated its intangible assets (indefinite and definite-lived) and concluded there was no impairment in 2018, 2017 and 2016, respectively.
Intangible assets with determinable lives consist of customer relationships and the Simmons trade name. The following table summarizes the future aggregate amortization expense of the Company's intangible assets with determinable lives for the years ended:
(Dollars in thousands)
2019.............................................................................................................................................................. $ 8,0012020.............................................................................................................................................................. 1,2562021.............................................................................................................................................................. 258
Total ........................................................................................................................................................... $ 9,515
Note 12 Fixed Assets
December 31, December 31,(Dollars in thousands) 2018 2017Furniture and equipment............................................................................................. $ 44,216 $ 38,506Leasehold improvements ............................................................................................ 37,342 31,290Software...................................................................................................................... 11,616 11,327
Total.......................................................................................................................... 93,174 81,123Accumulated depreciation and amortization .............................................................. (60,555) (55,944)
$ 32,619 $ 25,179
For the years ended December 31, 2018, 2017 and 2016, depreciation and amortization of furniture and equipment, leasehold improvements and software totaled $8.4 million, $7.3 million and $6.4 million, respectively, and are included in occupancy and equipment expense on the consolidated statements of operations.
Note 13 Short-Term Financing
Outstanding Balance Weighted Average Interest RateDecember 31, December 31, December 31, December 31,
(Dollars in thousands) 2018 2017 2018 2017Commercial paper (secured) ............................ $ 49,953 $ 49,974 3.38% 2.32%Prime broker arrangement ................................ — 239,963 N/A 2.23%
Total short-term financing.............................. $ 49,953 $ 289,937

Piper Jaffray Companies
Notes to the Consolidated Financial Statements – Continued
93
The Company issues secured commercial paper to fund a portion of its securities inventory. The commercial paper notes ("CP Notes") can be issued with maturities of 27 days to 270 days from the date of issuance. The CP Notes are currently issued under two separate programs, CP Series A and CP Series II A, and are secured by different inventory classes. As of December 31, 2018, the weighted average maturity of outstanding CP Notes was 10 days. The CP Notes are interest bearing or sold at a discount to par with an interest rate based on LIBOR plus an applicable margin. CP Series II A includes a covenant that requires the Company's U.S. broker dealer subsidiary to maintain excess net capital of $100 million.
The Company had established an arrangement to obtain financing with a prime broker related to its municipal bond fund. Financing under this arrangement was primarily secured by municipal securities and collateral limitations could reduce the amount of funding available. Prime broker financing activities were recorded net of receivables from trading activity. The funding was at the discretion of the prime broker subject to a notice period. In the third quarter of 2018, the Company completed the liquidation of its municipal bond fund, and closed this prime broker arrangement.
The Company has both committed and uncommitted short-term bank line financing available on a secured basis. The Company uses these credit facilities in the ordinary course of business to fund a portion of its daily operations and the amount borrowed under these credit facilities varies daily based on the Company's funding needs.
The Company's committed short-term bank line financing at December 31, 2018 consisted of a one-year $175 millioncommitted revolving credit facility with U.S. Bank, N.A., which was renewed in December 2018. Advances under this facility are secured by certain marketable securities. The facility includes a covenant that requires the Company's U.S. broker dealer subsidiary to maintain minimum net capital of $120 million, and the unpaid principal amount of all advances under this facility will be due on December 13, 2019. The Company pays a nonrefundable commitment fee on the unused portion of the facility on a quarterly basis. At December 31, 2018, the Company had no advances against this line of credit.
The Company's uncommitted secured line at December 31, 2018 was $85 million and is dependent on having appropriate collateral, as determined by the bank agreement, to secure an advance under the line. The availability of the Company's uncommitted line is subject to approval by the bank each time an advance is requested and may be denied. At December 31, 2018, the Company had no advances against this line of credit.
Note 14 Senior Notes
The Company entered into fixed and variable rate senior notes with certain entities advised by Pacific Investment Management Company. On October 8, 2015, the Company issued $125 million of Class C Notes. The Class C Notes were repaid in full on the October 9, 2018 maturity date. The $50 million of variable rate Class A Notes were repaid by the Company upon maturity on May 31, 2017.
Note 15 Contingencies, Commitments and Guarantees
Legal Contingencies
The Company has been named as a defendant in various legal actions, including complaints and litigation and arbitration claims, arising from its business activities. Such actions include claims related to securities brokerage and investment banking activities, and certain class actions that primarily allege violations of securities laws and seek unspecified damages, which could be substantial. Also, the Company is involved from time to time in investigations and proceedings by governmental agencies and self-regulatory organizations ("SROs") which could result in adverse judgments, settlement, penalties, fines or other relief.
The Company has established reserves for potential losses that are probable and reasonably estimable that may result from pending and potential legal actions, investigations and regulatory proceedings. Reasonably possible losses in excess of amounts accrued at December 31, 2018 are not material. In many cases, however, it is inherently difficult to determine whether any loss is probable or even possible or to estimate the amount or range of any potential loss, particularly where proceedings may be in relatively early stages or where plaintiffs are seeking substantial or indeterminate damages. Matters frequently need to be more developed before a loss or range of loss can reasonably be estimated.

Piper Jaffray Companies
Notes to the Consolidated Financial Statements – Continued
94
Given uncertainties regarding the timing, scope, volume and outcome of pending and potential legal actions, investigations and regulatory proceedings and other factors, the amounts of reserves and ranges of reasonably possible losses are difficult to determine and of necessity subject to future revision. Subject to the foregoing, management of the Company believes, based on currently available information, after consultation with outside legal counsel and taking into account its established reserves, that pending legal actions, investigations and regulatory proceedings will be resolved with no material adverse effect on the consolidated statements of financial condition, results of operations or cash flows of the Company. However, if during any period a potential adverse contingency should become probable or resolved for an amount in excess of the established reserves, the results of operations and cash flows in that period and the financial condition as of the end of that period could be materially adversely affected. In addition, there can be no assurance that material losses will not be incurred from claims that have not yet been brought to the Company's attention or are not yet determined to be reasonably possible.
Litigation-related reserve activity included within other operating expenses was immaterial for the years ended December 31, 2018, 2017 and 2016.
Operating Lease Commitments
The Company leases office space throughout the United States and in a limited number of foreign countries where the Company's international operations reside. Aggregate minimum lease commitments under operating leases as of December 31, 2018 are as follows:
(Dollars in thousands)
2019................................................................................................................................................................ $ 13,8122020................................................................................................................................................................ 13,6862021................................................................................................................................................................ 9,3292022................................................................................................................................................................ 7,9842023................................................................................................................................................................ 7,143Thereafter....................................................................................................................................................... 15,771
Total ............................................................................................................................................................. $ 67,725
Total minimum rentals to be received from 2019 through 2021 under noncancelable subleases were $2.9 million at December 31, 2018.
Rental expense, including operating costs and real estate taxes, was $18.2 million, $17.1 million and $17.3 million for the years ended December 31, 2018, 2017 and 2016, respectively.
Investment Commitments
As of December 31, 2018, the Company had commitments to invest approximately $78.0 million in limited partnerships or limited liability companies that make direct or indirect equity or debt investments in companies.
Other Guarantees
The Company is a member of numerous exchanges. Under the membership agreements with these entities, members generally are required to guarantee the performance of other members, and if a member becomes unable to satisfy its obligations to the exchange, other members would be required to meet shortfalls. To mitigate these performance risks, the exchanges often require members to post collateral. In addition, the Company identifies and guarantees certain clearing agents against specified potential losses in connection with providing services to the Company or its affiliates. The Company's maximum potential liability under these arrangements cannot be quantified. However, management believes the likelihood that the Company would be required to make payments under these arrangements is remote. Accordingly, no liability is recorded in the consolidated financial statements for these arrangements.

Piper Jaffray Companies
Notes to the Consolidated Financial Statements – Continued
95
Concentration of Credit Risk
The Company provides investment, capital-raising and related services to a diverse group of domestic and foreign customers, including governments, corporations, and institutional and individual investors. The Company's exposure to credit risk associated with the non-performance of customers in fulfilling their contractual obligations pursuant to securities transactions can be directly impacted by volatile securities markets, credit markets and regulatory changes. This exposure is measured on an individual customer basis and on a group basis for customers that share similar attributes. To alleviate the potential for risk concentrations, counterparty credit limits have been implemented for certain products and are continually monitored in light of changing customer and market conditions.
Note 16 Restructuring
During the year ended December 31, 2018, the Company incurred pre-tax restructuring costs principally related to headcount reductions in both the Capital Markets and Asset Management segments. During the year ended December 31, 2016, the Company incurred charges within the Capital Markets segment primarily in conjunction with its acquisition activities.
Year Ended December 31,(Dollars in thousands) 2018 2017 2016Severance, benefits and outplacement costs .................................... $ 3,455 $ — $ 6,608Vacated leased office space .............................................................. 130 — 1,320Contract termination costs................................................................ 185 — 1,026
Total pre-tax restructuring costs..................................................... $ 3,770 $ — $ 8,954
Note 17 Shareholders' Equity
The amended and restated certificate of incorporation of Piper Jaffray Companies provides for the issuance of up to 100,000,000 shares of common stock with a par value of $0.01 per share and up to 5,000,000 shares of undesignated preferred stock with a par value of $0.01 per share.
Common Stock
The holders of Piper Jaffray Companies common stock are entitled to one vote per share on all matters to be voted upon by the shareholders. Subject to preferences that may be applicable to any outstanding preferred stock of Piper Jaffray Companies, the holders of its common stock are entitled to receive ratably such dividends, if any, as may be declared out of funds legally available for that purpose. There are also restrictions on the payment of dividends as set forth in Note 22. The Company's board of directors determines the declaration and payment of dividends on a quarterly basis, and is free to change the Company's dividend policy at any time. Piper Jaffray Companies did not pay cash dividends on its common stock in 2016.
Dividends
Beginning in 2017, the Company initiated the payment of a quarterly cash dividend to holders of its common stock, which included unvested restricted shares with dividend rights. In addition, the Company's board of directors approved a dividend policy with the intention of returning a metric based on net income from the previous fiscal year. This includes an annual special cash dividend, payable in the first quarter of each year, beginning in 2018.
In 2018, the Company declared and paid quarterly cash dividends on its common stock, aggregating $1.50 per share, and an annual special cash dividend on its common stock related to fiscal 2017 results of $1.62 per share, totaling $47.2 million.
In 2017, the Company declared and paid quarterly cash dividends on its common stock, aggregating $1.25 per share, totaling $19.0 million.

Piper Jaffray Companies
Notes to the Consolidated Financial Statements – Continued
96
On February 1, 2019, the Company's board of directors declared both a quarterly and annual special cash dividend on its common stock of $0.375 and $1.01 per share, respectively, to be paid on March 15, 2019, to shareholders of record as of the close of business on February 25, 2019.
In the event that Piper Jaffray Companies is liquidated or dissolved, the holders of its common stock are entitled to share ratably in all assets remaining after payment of liabilities, subject to any prior distribution rights of Piper Jaffray Companies preferred stock, if any, then outstanding. Currently, there is no outstanding preferred stock. The holders of the common stock have no preemptive or conversion rights or other subscription rights. There are no redemption or sinking fund provisions applicable to Piper Jaffray Companies common stock.
Share Repurchases
Effective September 30, 2017, the Company's board of directors authorized the repurchase of up to $150.0 million in shares of common stock through September 30, 2019. In 2018, the Company repurchased 681,233 shares at an average price of $69.20per share for an aggregate purchase price of $47.1 million related to this authorization. No repurchases were made in conjunction with this authorization during the fourth quarter of 2017. The Company has $102.9 million remaining under this authorization.
Effective August 14, 2015, the Company's board of directors authorized the repurchase of up to $150.0 million in shares of common stock through September 30, 2017. In 2017, the Company repurchased 36,936 shares at an average price of $67.62 per share for an aggregate purchase price of $2.5 million related to this authorization. During the year ended December 31, 2016, the Company repurchased 1,536,226 shares at an average price of $38.89 per share for an aggregate purchase price of $59.7 million related to this authorization.
The Company also purchases shares of common stock from restricted stock award recipients upon the award vesting as recipients sell shares to meet their employment tax obligations. The Company purchased 279,664 shares or $23.8 million; 314,542 shares or $23.0 million; and 261,685 shares or $11.1 million of the Company's common stock for this purpose during the years ended December 31, 2018, 2017 and 2016, respectively.
Issuance of Shares
The Company issues common shares out of treasury stock as a result of employee restricted share vesting and exercise transactions as discussed in Note 19. During the years ended December 31, 2018, 2017 and 2016, the Company issued 1,040,015shares, 867,327 shares and 854,416 shares, respectively, related to these obligations.
Preferred Stock
The Piper Jaffray Companies board of directors has the authority, without action by its shareholders, to designate and issue preferred stock in one or more series and to designate the rights, preferences and privileges of each series, which may be greater than the rights associated with the common stock. It is not possible to state the actual effect of the issuance of any shares of preferred stock upon the rights of holders of common stock until the Piper Jaffray Companies board of directors determines the specific rights of the holders of preferred stock. However, the effects might include, among other things, the following: restricting dividends on its common stock, diluting the voting power of its common stock, impairing the liquidation rights of its common stock and delaying or preventing a change in control of Piper Jaffray Companies without further action by its shareholders.
Noncontrolling Interests
The consolidated financial statements include the accounts of Piper Jaffray Companies, its wholly owned subsidiaries and other entities in which the Company has a controlling financial interest. Noncontrolling interests represent equity interests in consolidated entities that are not attributable, either directly or indirectly, to Piper Jaffray Companies. Noncontrolling interests include the minority equity holders' proportionate share of the equity in merchant banking funds of $50.2 million and a senior living fund aggregating $2.8 million as of December 31, 2018. As of December 31, 2017, noncontrolling interests included the minority equity holders' proportionate share of the equity in merchant banking funds of $42.7 million and a senior living fund aggregating $5.2 million.

Piper Jaffray Companies
Notes to the Consolidated Financial Statements – Continued
97
Ownership interests in entities held by parties other than the Company's common shareholders are presented as noncontrolling interests within shareholders' equity, separate from the Company's own equity. Revenues, expenses and net income or loss are reported on the consolidated statements of operations on a consolidated basis, which includes amounts attributable to both the Company's common shareholders and noncontrolling interests. Net income or loss is then allocated between the Company and noncontrolling interests based upon their relative ownership interests. Net income applicable to noncontrolling interests is deducted from consolidated net income to determine net income applicable to the Company. There was no other comprehensive income or loss attributed to noncontrolling interests for the years ended December 31, 2018, 2017 and 2016.
Note 18 Employee Benefit Plans
The Company has various employee benefit plans, and substantially all employees are covered by at least one plan. The plans include health and welfare plans and a tax-qualified retirement plan (the "Retirement Plan"). During the years ended December 31, 2018, 2017 and 2016, the Company incurred employee benefits expenses of $19.1 million, $19.9 million and $17.6 million, respectively.
Health and Welfare Plans
Company employees who meet certain work schedule and service requirements are eligible to participate in the Company's health and welfare plans. The Company subsidizes the cost of coverage for employees. The health plans contain cost-sharing features such as deductibles and coinsurance.
The Company is self-insured for losses related to health claims, although it obtains third party stop loss insurance coverage on both an individual and a group plan basis. Self-insured liabilities are based on a number of factors, including historical claims experience, an estimate of claims incurred but not reported and valuations provided by third party actuaries. For the years ended December 31, 2018, 2017 and 2016, the Company recognized expense of $11.3 million, $12.0 million and $10.4 million, respectively, in compensation and benefits expense on the consolidated statements of operations related to its health plans.
Retirement Plan
The Retirement Plan consists of a defined contribution retirement savings plan. The defined contribution retirement savings plan allows qualified employees, at their option, to make contributions through salary deductions under Section 401(k) of the Internal Revenue Code. Employee contributions are 100 percent matched by the Company to a maximum of six percent of recognized compensation up to the social security taxable wage base. Although the Company's matching contribution vests immediately, a participant must be employed on December 31 to receive that year's matching contribution.

Piper Jaffray Companies
Notes to the Consolidated Financial Statements – Continued
98
Note 19 Compensation Plans
Stock-Based Compensation Plans
The Company maintains two stock-based compensation plans, the Piper Jaffray Companies Amended and Restated 2003 Annual and Long-Term Incentive Plan (the "Incentive Plan") and the 2016 Employment Inducement Award Plan (the "Inducement Plan"). The Company's equity awards are recognized on the consolidated statements of operations at grant date fair value over the service period of the award, less forfeitures.
The following table provides a summary of the Company's outstanding equity awards (in shares or units) as of December 31, 2018:
Incentive PlanRestricted Stock
Annual grants ............................................................................................................................................ 653,421Sign-on grants ........................................................................................................................................... 50,033
703,454Inducement Plan
Restricted Stock ......................................................................................................................................... 254,058
Total restricted stock related to compensation ....................................................................................... 957,512
Simmons Deal Consideration (1) ................................................................................................................ 612,283
Total restricted stock outstanding .............................................................................................................. 1,569,795
Incentive PlanRestricted Stock Units
Leadership grants ...................................................................................................................................... 194,251
Incentive PlanStock Options ............................................................................................................................................. 81,667
(1) The Company issued restricted stock with service conditions as part of deal consideration for the acquisition of Simmons. See Note 4 for further discussion.
Incentive Plan
The Incentive Plan permits the grant of equity awards, including restricted stock, restricted stock units and non-qualified stock options, to the Company's employees and directors for up to 8.2 million shares of common stock (0.8 million shares remained available for future issuance under the Incentive Plan as of December 31, 2018). The Company believes that such awards help align the interests of employees and directors with those of shareholders and serve as an employee retention tool. The Incentive Plan provides for accelerated vesting of awards if there is a severance event, a change in control of the Company (as defined in the Incentive Plan), in the event of a participant's death, and at the discretion of the compensation committee of the Company's board of directors.
Restricted Stock Awards
Restricted stock grants are valued at the market price of the Company's common stock on the date of grant and are amortized over the requisite service period. The Company grants shares of restricted stock to employees as part of year-end compensation ("Annual Grants") and upon initial hiring or as a retention award ("Sign-on Grants").
The Company's Annual Grants are made each year in February. Annual Grants vest ratably over three years in equal installments. The Annual Grants provide for continued vesting after termination of employment, so long as the employee does not violate certain post-termination restrictions set forth in the award agreement or any agreements entered into upon termination.

Piper Jaffray Companies
Notes to the Consolidated Financial Statements – Continued
99
The Company determined the service inception date precedes the grant date for the Annual Grants, and that the post-termination restrictions do not meet the criteria for an in-substance service condition, as defined by ASC 718. Accordingly, restricted stock granted as part of the Annual Grants is expensed in the one-year period in which those awards are deemed to be earned, which is generally the calendar year preceding the February grant date. For example, the Company recognized compensation expense during fiscal 2018 for its February 2019 Annual Grant. If an equity award related to the Annual Grants is forfeited as a result of violating the post-termination restrictions, the lower of the fair value of the award at grant date or the fair value of the award at the date of forfeiture is recorded within the consolidated statements of operations as a reversal of compensation expense.
Sign-on Grants are used as a recruiting tool for new employees and are issued to current employees as a retention tool. These awards have both cliff and ratable vesting terms, and the employees must fulfill service requirements in exchange for rights to the awards. Compensation expense is amortized on a straight-line basis from the grant date over the requisite service period, generally one to five years. Employees forfeit unvested shares upon termination of employment and a reversal of compensation expense is recorded.
Annually, the Company grants stock to its non-employee directors. The stock-based compensation paid to non-employee directors is fully expensed on the grant date and included within outside services expense on the consolidated statements of operations.
Restricted Stock Units
The Company grants restricted stock units to its leadership team ("Leadership Grants").
2018 and 2017 Leadership Grants
Restricted stock units granted in 2018 and 2017 will vest and convert to shares of common stock at the end of each 36-month performance period only if the Company satisfies predetermined performance and/or market conditions over the performance period. Under the terms of these awards, the number of units that will actually vest and convert to shares will be based on the extent to which the Company achieves specified targets during each performance period. The maximum payout leverage under these grants is 150 percent.
Up to 75 percent of the award can be earned based on the Company achieving certain average adjusted return on equity targets, as defined in the terms of the award agreements. The fair value of this portion of the award was based on the closing price of the Company's common stock on the grant date. If the Company determines that it is probable that the performance condition will be achieved, compensation expense is amortized on a straight-line basis over the 36-month performance period. The probability that the performance condition will be achieved is reevaluated each reporting period with changes in estimated outcomes accounted for using a cumulative effect adjustment to compensation expense. Compensation expense will be recognized only if the performance condition is met. Employees forfeit unvested restricted stock units upon termination of employment with a corresponding reversal of compensation expense. As of December 31, 2018, the Company has determined that the performance condition is probable of achieving 50 percent of the 2018 award and 75 percent of the 2017 award.
Up to 75 percent of the award can be earned based on the Company's total shareholder return relative to members of a predetermined peer group. The market condition must be met for the awards to vest and compensation cost will be recognized regardless if the market condition is satisfied. Compensation expense is amortized on a straight-line basis over the 36-month requisite service period. Employees forfeit unvested restricted stock units upon termination of employment with a corresponding reversal of compensation expense. For this portion of the awards, the fair value on the grant date was determined using a Monte Carlo simulation with the following assumptions:
Risk-free Expected StockGrant Year Interest Rate Price Volatility2018.............................................................................................................................. 2.40% 34.8%2017.............................................................................................................................. 1.62% 35.9%

Piper Jaffray Companies
Notes to the Consolidated Financial Statements – Continued
100
Because the market condition portion of the awards vesting depend on the Company's total shareholder return relative to a peer group, the valuation modeled the performance of the peer group as well as the correlation between the Company and the peer group. The expected stock price volatility assumptions were determined using historical volatility, as correlation coefficients can only be developed through historical volatility. The risk-free interest rates were determined based on three-year U.S. Treasury bond yields.
In the fourth quarter of 2017, the compensation committee of the Company's board of directors included defined retirement provisions in its Leadership Grants, beginning with the February 2018 grant. Certain grantees meeting defined age and service requirements will be fully vested in the awards as long as performance and post-termination obligations are met throughout the performance period. These retirement-eligible grants are expensed in the period in which those awards are deemed to be earned, which is the calendar year preceding the February grant date. For example, the Company recognized compensation expense for retirement-eligible grantees in fiscal 2017 for its February 2018 Leadership Grant.
Leadership Grants Prior to 2017
Restricted stock units granted prior to 2017 contain market condition criteria and will vest and convert to shares of common stock at the end of each 36-month performance period only if the Company's stock performance satisfies predetermined market conditions over the performance period. Under the terms of the grants, the number of units that will vest and convert to shares will be based on the Company's stock performance achieving specified targets during each performance period. Compensation expense is recognized over each 36-month performance period.
Up to 50 percent of these awards can be earned based on the Company's total shareholder return relative to members of a predetermined peer group and up to 50 percent of the awards can be earned based on the Company's total shareholder return. The fair value of the awards on the grant date was determined using a Monte Carlo simulation with the following assumptions pursuant to the methodology above:
Risk-free Expected Stock Grant Year Interest Rate Price Volatility2016.............................................................................................................................. 0.98% 34.9%2015.............................................................................................................................. 0.90% 29.8%
Stock Options
On February 15, 2018, the Company granted options to certain executive officers. These options are expensed on a straight-line basis over the required service period of five years, based on the estimated fair value of the award on the date of grant. The exercise price per share is equal to the closing price on the date of grant plus ten percent. These options are subject to graded vesting, beginning on the third anniversary of the grant date, so long as the employee remains continuously employed by the Company. The maximum term of these stock options is ten years.
The fair value of this stock option award was estimated on the date of grant using the Black-Scholes option-pricing model with the following assumptions:
Risk-free interest rate .................................................................................................................................... 2.82%Dividend yield............................................................................................................................................... 3.22%Expected stock price volatility ...................................................................................................................... 37.20%Expected life of options (in years) ................................................................................................................ 7.0Fair value of options granted (per share) ...................................................................................................... $ 24.49
The risk-free interest rate assumption was based on the U.S. Treasury bond yield with a maturity equal to the expected life of the options. The dividend yield assumption was based on the assumed dividend payout over the expected life of the options. The expected stock price volatility assumption was determined using historical volatility, as correlation coefficients can only be developed through historical volatility.

Piper Jaffray Companies
Notes to the Consolidated Financial Statements – Continued
101
Inducement Plan
The Company established the Inducement Plan in conjunction with the acquisition of Simmons. The Company granted $11.6 million (286,776 shares) in restricted stock under the Inducement Plan on May 16, 2016. These shares cliff vest on May 16, 2019. Inducement Plan awards are amortized as compensation expense on a straight-line basis over the vesting period. Employees forfeit unvested Inducement Plan shares upon termination of employment and a reversal of compensation expense is recorded.
Stock-Based Compensation Activity
The following table summarizes the Company's stock-based compensation expense:
Year Ended December 31,(amounts in millions) 2018 2017 2016Stock-based compensation expense .......................................... $ 43.3 $ 39.1 $ 54.1Forfeitures.................................................................................. 0.9 3.0 1.4Tax benefit related to stock-based compensation expense ........ 7.0 9.7 14.2
The following table summarizes the changes in the Company's unvested restricted stock:
Unvested Weighted AverageRestricted Stock Grant Date
(in Shares) Fair Value December 31, 2015 ............................................................................................. 1,287,915 $ 46.20Granted ................................................................................................................ 2,359,672 41.87Vested .................................................................................................................. (623,961) 44.89Canceled .............................................................................................................. (149,509) 42.49December 31, 2016 ............................................................................................. 2,874,117 $ 43.12Granted ................................................................................................................ 248,749 77.78Vested .................................................................................................................. (717,782) 45.08Canceled .............................................................................................................. (179,467) 42.70December 31, 2017 ............................................................................................. 2,225,617 $ 46.40Granted ................................................................................................................ 310,494 88.18Vested .................................................................................................................. (945,550) 47.65Canceled .............................................................................................................. (20,766) 54.53December 31, 2018 ............................................................................................. 1,569,795 $ 53.80
The fair value of restricted stock that vested during the years ended December 31, 2018, 2017 and 2016 was $45.1 million, $32.4 million and $28.0 million, respectively.

Piper Jaffray Companies
Notes to the Consolidated Financial Statements – Continued
102
The following table summarizes the changes in the Company's unvested restricted stock units:
Unvested Weighted AverageRestricted Grant Date
Stock Units Fair Value December 31, 2015 ............................................................................................. 356,242 $ 22.18Granted ................................................................................................................ 135,483 19.93Vested .................................................................................................................. (117,265) 21.32Canceled .............................................................................................................. — —December 31, 2016 ............................................................................................. 374,460 $ 21.63Granted ................................................................................................................ 35,981 84.10Vested .................................................................................................................. (115,290) 23.42Canceled .............................................................................................................. (50,379) 31.73December 31, 2017 ............................................................................................. 244,772 $ 27.89Granted ................................................................................................................ 53,796 92.93Vested .................................................................................................................. (86,511) 21.83Canceled .............................................................................................................. (17,806) 23.91December 31, 2018 ............................................................................................. 194,251 $ 48.97
As of December 31, 2018, there was $6.4 million of total unrecognized compensation cost related to restricted stock and restricted stock units expected to be recognized over a weighted average period of 1.3 years.
The following table summarizes the changes in the Company's stock options:
Weighted AverageWeighted Remaining
Options Average Contractual Term AggregateOutstanding Exercise Price (in Years) Intrinsic Value
December 31, 2015 ......................................... 157,201 $ 50.35 1.6 $ —Granted ............................................................ — —Exercised ......................................................... (104,175) 43.75Canceled .......................................................... — —Expired ............................................................ (22,413) 59.83December 31, 2016 ......................................... 30,613 $ 65.86 0.3 $ 203,291Granted ............................................................ — —Exercised ......................................................... (26,149) 65.13Canceled .......................................................... — —Expired ............................................................ (4,464) 70.13December 31, 2017 ......................................... — $ — — $ —Granted ............................................................ 81,667 99.00Exercised ......................................................... — —Canceled .......................................................... — —Expired ............................................................ — —December 31, 2018 ......................................... 81,667 $ 99.00 9.1 $ —
Options exercisable at December 31, 2016 .. 30,613 $ 65.86 0.3 $ 203,291Options exercisable at December 31, 2017 .. — $ — — $ —Options exercisable at December 31, 2018 .. — $ — — $ —

Piper Jaffray Companies
Notes to the Consolidated Financial Statements – Continued
103
As of December 31, 2018, there was $1.6 million of unrecognized compensation cost related to stock options expected to be recognized over a weighted average period of 4.1 years. There were no options exercised during the year ended December 31, 2018. For the year ended December 31, 2017, the intrinsic value of options exercised and the resulting tax benefit realized was $0.3 million and $0.1 million, respectively. For the year ended December 31, 2016, the intrinsic value of options exercised and the resulting tax benefit realized was $2.0 million and $0.8 million, respectively.
The Company has a policy of issuing shares out of treasury (to the extent available) to satisfy share option exercises and restricted stock vesting. The Company expects to withhold approximately 0.3 million shares from employee equity awards vesting in 2019, related to employee individual income tax withholding obligations on restricted stock vesting. For accounting purposes, withholding shares to cover employees' tax obligations is deemed to be a repurchase of shares by the Company.
Deferred Compensation Plans
The Company maintains various deferred compensation arrangements for employees.
The Piper Jaffray Companies Mutual Fund Restricted Share Investment Plan is a fully funded deferred compensation plan which allows eligible employees to receive a portion of their incentive compensation in restricted mutual fund shares ("MFRS Awards") of investment funds. MFRS Awards are awarded to qualifying employees in February of each year, and represent a portion of their compensation for performance in the preceding year similar to the Company's Annual Grants. MFRS Awards vest ratably over three years in equal installments and provide for continued vesting after termination of employment so long as the employee does not violate certain post-termination restrictions set forth in the award agreement or any agreement entered into upon termination. Forfeitures are recorded as a reduction of compensation and benefits expense within the consolidated statements of operations. MFRS Awards are owned by employee recipients (subject to the aforementioned vesting restrictions) and as such are not included on the consolidated statements of financial condition.
The Company recorded compensation expense of $50.2 million, $60.2 million and $17.5 million for the years ended December 31, 2018, 2017 and 2016, respectively, related to employee MFRS Awards, less forfeitures. Forfeitures were $1.6 million, $1.3 million and $0.6 million for the years ended December 31, 2018, 2017 and 2016, respectively.
The nonqualified deferred compensation plan is an unfunded plan which allowed certain highly compensated employees, at their election, to defer a portion of their compensation. In 2017, this plan was closed to future deferral elections by participants for performance periods beginning after December 31, 2017. The amounts deferred under this plan are held in a grantor trust. The Company invests, as a principal, in investments to economically hedge its obligation under the nonqualified deferred compensation plan. Investments in the grantor trust, consisting of mutual funds, totaled $31.2 million and $31.5 million as of December 31, 2018 and 2017, respectively, and are included in investments on the consolidated statements of financial condition. The compensation deferred by the employees was expensed in the period earned. The deferred compensation liability was $31.4 million and $31.6 million as of December 31, 2018 and 2017, respectively. Changes in the fair value of the investments made by the Company are reported in investment income and changes in the corresponding deferred compensation liability are reflected as compensation and benefits expense on the consolidated statements of operations.

Piper Jaffray Companies
Notes to the Consolidated Financial Statements – Continued
104
Note 20 Earnings Per Share ("EPS")
The Company calculates earnings per share using the two-class method. Basic earnings per common share is computed by dividing net income/(loss) applicable to Piper Jaffray Companies' common shareholders by the weighted average number of common shares outstanding for the period. Net income/(loss) applicable to Piper Jaffray Companies' common shareholders represents net income/(loss) applicable to Piper Jaffray Companies reduced by the allocation of earnings to participating securities. No allocation of undistributed earnings is made for periods in which a loss is incurred, or for periods in which cash dividends exceed net income resulting in an undistributed loss. Distributed earnings (e.g., dividends) are allocated to participating securities. All of the Company's unvested restricted shares are deemed to be participating securities as they are eligible to share in the profits (e.g., receive dividends) of the Company. The Company's unvested restricted stock units are not participating securities as they are not eligible to receive dividends, or the dividends are forfeitable until vested. Diluted earnings per common share is calculated by adjusting the weighted average outstanding shares to assume conversion of all potentially dilutive stock options and restricted stock units.
The computation of earnings per share is as follows:
Year Ended December 31,(Amounts in thousands, except per share data) 2018 2017 2016Net income/(loss) applicable to Piper Jaffray Companies.................. $ 57,036 $ (61,939) $ (21,952)
Earnings allocated to participating securities (1) ............................. (7,043) (2,936) —Net income/(loss) applicable to Piper Jaffray Companies' commonshareholders (2)................................................................................. $ 49,993 $ (64,875) $ (21,952)
Shares for basic and diluted calculations:Average shares used in basic computation....................................... 13,234 12,807 12,674Stock options .................................................................................... — — 15Restricted stock units ....................................................................... 191 171 90
Average shares used in diluted computation (3)................................. 13,425 12,978 12,779
Earnings/(loss) per common share:Basic ................................................................................................. $ 3.78 $ (5.07) $ (1.73)Diluted (3) ........................................................................................ $ 3.72 $ (5.07) $ (1.73)
(1) Represents the allocation of distributed and undistributed earnings to participating securities. No allocation of undistributed earnings is made for periods in which a loss is incurred, or for periods in which cash dividends exceed net income resulting in an undistributed loss. Distributed earnings (e.g., dividends) are allocated to participating securities. Participating securities include all of the Company's unvested restricted shares. The weighted average participating shares outstanding were 1,868,883; 2,349,476; and 2,691,728 for the years ended December 31, 2018, 2017 and 2016, respectively.
(2) Net income/(loss) applicable to Piper Jaffray Companies' common shareholders for diluted and basic EPS may differ under the two-class method as a result of adding the effect of the assumed exercise of stock options and restricted stock units to dilutive shares outstanding, which alters the ratio used to allocate earnings to Piper Jaffray Companies' common shareholders and participating securities for purposes of calculating diluted and basic EPS.
(3) Earnings per diluted common share is calculated using the basic weighted average number of common shares outstanding for periods in which a loss is incurred, or for periods in which cash dividends exceed net income resulting in an undistributed loss. Common shares of 2,225,617 and 2,874,117 were excluded from diluted EPS at December 31, 2017 and 2016, respectively, as the Company had a net loss for these years.
The anti-dilutive effects from stock options and restricted stock units were immaterial for the years ended December 31, 2018, 2017 and 2016.

Piper Jaffray Companies
Notes to the Consolidated Financial Statements – Continued
105
Note 21 Segment Reporting
Basis for Presentation
The Company structures its segments primarily based upon the nature of the financial products and services provided to customers and the Company's management organization. The Company evaluates performance and allocates resources based on segment pre-tax operating income or loss and segment pre-tax operating margin. Revenues and expenses directly associated with each respective segment are included in determining their operating results. Other revenues and expenses that are not directly attributable to a particular segment are allocated based upon the Company's allocation methodologies, including each segment's respective net revenues, use of shared resources, headcount or other relevant measures. Segment assets are based on those directly associated with each segment, and include an allocation of certain assets based on the most relevant measures applicable, including headcount and other factors. The substantial majority of the Company's net revenues and long-lived assets are located in the U.S.
Reportable segment financial results are as follows:
Year Ended December 31,(Dollars in thousands) 2018 2017 2016Capital Markets
Investment bankingAdvisory services........................................................................ $ 394,133 $ 443,303 $ 304,654Financing
Equities..................................................................................... 122,172 98,996 71,161Debt .......................................................................................... 73,262 93,434 115,013
Total investment banking............................................................... 589,567 635,733 490,828
Institutional sales and tradingEquities ....................................................................................... 77,477 81,717 87,992Fixed income .............................................................................. 67,563 89,455 91,466
Total institutional sales and trading.............................................. 145,040 171,172 179,458
Management and performance fees .............................................. 6,318 5,566 6,363
Investment income ......................................................................... 6,290 17,640 24,791
Long-term financing expenses ...................................................... (5,793) (7,676) (9,136)
Net revenues.................................................................................. 741,422 822,435 692,304
Operating expenses (1).................................................................. 663,684 738,339 645,863
Segment pre-tax operating income ............................................... $ 77,738 $ 84,096 $ 46,441
Segment pre-tax operating margin ................................................ 10.5 % 10.2 % 6.7 %
Continued on next page

Piper Jaffray Companies
Notes to the Consolidated Financial Statements – Continued
106
Year Ended December 31,(Dollars in thousands) 2018 2017 2016Asset Management
Management and performance feesManagement fees ........................................................................ $ 43,461 $ 51,269 $ 53,725Performance fees ........................................................................ 24 — 584
Total management and performance fees...................................... 43,485 51,269 54,309
Investment income/(loss) ............................................................... (465) 1,219 736
Net revenues.................................................................................. 43,020 52,488 55,045
Operating expenses (1).................................................................. 45,881 165,907 132,360
Segment pre-tax operating loss ..................................................... $ (2,861) $ (113,419) $ (77,315)
Segment pre-tax operating margin ................................................ (6.7)% (216.1)% (140.5)%
TotalNet revenues.................................................................................. $ 784,442 $ 874,923 $ 747,349
Operating expenses (1).................................................................. 709,565 904,246 778,223
Pre-tax operating income/(loss) .................................................... $ 74,877 $ (29,323) $ (30,874)
Pre-tax operating margin............................................................... 9.5 % (3.4)% (4.1)%(1) Operating expenses include non-cash goodwill impairment charges of $114.4 million and $82.9 million for the years ended December
31, 2017 and 2016, respectively, related to the Asset Management segment, as well as intangible asset amortization as set forth in the table below:
Year Ended December 31,(Dollars in thousands) 2018 2017 2016Capital Markets ................................................................................... $ 4,858 $ 10,178 $ 15,587Asset Management .............................................................................. 5,602 5,222 5,627
Total intangible asset amortization ................................................... $ 10,460 $ 15,400 $ 21,214
Reportable segment assets are as follows:
December 31, December 31,(Dollars in thousands) 2018 2017
Capital Markets ............................................................................................................ $ 1,273,147 $ 1,933,050Asset Management ....................................................................................................... 72,122 91,633
Total assets ................................................................................................................. $ 1,345,269 $ 2,024,683

Piper Jaffray Companies
Notes to the Consolidated Financial Statements – Continued
107
Note 22 Net Capital Requirements and Other Regulatory Matters
Piper Jaffray is registered as a securities broker dealer with the SEC and is a member of various SROs and securities exchanges. The Financial Industry Regulatory Authority, Inc. ("FINRA"), serves as Piper Jaffray's primary SRO. Piper Jaffray is subject to the uniform net capital rule of the SEC and the net capital rule of FINRA. Piper Jaffray has elected to use the alternative method permitted by the SEC rule which requires that it maintain minimum net capital of $1.0 million. Advances to affiliates, repayment of subordinated debt, dividend payments and other equity withdrawals by Piper Jaffray are subject to certain approvals, notifications and other provisions of SEC and FINRA rules.
At December 31, 2018, net capital calculated under the SEC rule was $222.3 million, and exceeded the minimum net capital required under the SEC rule by $221.3 million.
The Company's committed short-term credit facility includes a covenant requiring Piper Jaffray to maintain minimum net capital of $120 million. CP Notes issued under CP Series II A include a covenant that requires Piper Jaffray to maintain excess net capital of $100 million. The Company's fully disclosed clearing agreement with Pershing also includes a covenant requiring Piper Jaffray to maintain excess net capital of $120 million.
Piper Jaffray Ltd. ("PJL"), a broker dealer subsidiary registered in the United Kingdom, is subject to the capital requirements of the Prudential Regulation Authority and the Financial Conduct Authority. As of December 31, 2018, PJL was in compliance with the capital requirements of the Prudential Regulation Authority and the Financial Conduct Authority.
Piper Jaffray Hong Kong Limited is licensed by the Hong Kong Securities and Futures Commission, which is subject to the liquid capital requirements of the Securities and Futures (Financial Resources) Rule promulgated under the Securities and Futures Ordinance. At December 31, 2018, Piper Jaffray Hong Kong Limited was in compliance with the liquid capital requirements of the Hong Kong Securities and Futures Commission.
Note 23 Income Taxes
Income tax expense/(benefit) is provided using the asset and liability method. Deferred tax assets and liabilities are recognized for the expected future tax consequences attributable to temporary differences between amounts reported for income tax purposes and financial statement purposes, using enacted tax rates expected to apply to taxable income in the years in which those temporary differences are expected to be recovered or settled.
The Tax Cuts and Jobs Act was enacted on December 22, 2017. ASC 740 requires companies to recognize the effect of the tax law changes in the period of enactment even though the effective date for most provisions is for tax years beginning after December 31, 2017. Securities and Exchange Commission Staff Accounting Bulletin No. 118, "Income Tax Accounting Implications of the Tax Cuts and Jobs Act" ("SAB 118") provides guidance on the application of ASC 740 as it pertained to the Tax Cuts and Jobs Act. SAB 118 permitted companies to report a provisional amount in the financial statements if the accounting for income tax effects of the Tax Cuts and Jobs Act was incomplete as of December 31, 2017. This provisional amount would be subject to adjustment during a defined measurement period, which was limited to one year from the enactment date of December 22, 2017. In accordance with SAB 118, the Company made a reasonable estimate of the impact of the Tax Cuts and Jobs Act, and recorded a discrete item in its 2017 provisional income tax expense of $54.2 million. This amount reflects an estimated reduction of deferred tax assets as a result of the statutory federal rate decrease from 35 percent to 21 percent. Pursuant to the defined measurement period in SAB 118, the Company recorded an additional $1.0 million of income tax expense for the year ended December 31, 2018. The accounting for the income tax effects of the Tax Cuts and Jobs Act is complete as of December 31, 2018.

Piper Jaffray Companies
Notes to the Consolidated Financial Statements – Continued
108
The components of income tax expense/(benefit) are as follows:
Year Ended December 31,(Dollars in thousands) 2018 2017 2016Current:
Federal..................................................................................... $ 12,747 $ 27,611 $ 11,704State......................................................................................... 4,783 5,550 2,454Foreign .................................................................................... 276 93 (703)
17,806 33,254 13,455Deferred:
Federal..................................................................................... (4,151) 5,783 (27,764)State......................................................................................... 907 (7,554) (3,758)Foreign .................................................................................... 4,485 (1,254) 939
1,241 (3,025) (30,583)
Total income tax expense/(benefit)............................................ $ 19,047 $ 30,229 $ (17,128)
A reconciliation of federal income taxes at statutory rates to the Company's effective tax rates is as follows:
Year Ended December 31,(Dollars in thousands) 2018 2017 2016Federal income tax expense/(benefit) at statutory rates ............ $ 15,724 $ (10,263) $ (10,806)Increase/(reduction) in taxes resulting from:
Impact of the Tax Cuts and Jobs Act....................................... 952 54,154 —State income taxes, net of federal tax benefit ......................... 3,483 (791) (1,110)Net tax-exempt interest income .............................................. (3,034) (5,040) (4,600)Foreign jurisdictions tax rate differential ................................ 1,067 865 1,860Non-deductible compensation................................................. 1,999 — —Change in valuation allowance ............................................... 5,299 (752) 362Vestings of stock awards......................................................... (7,103) (9,172) —Loss/(income) attributable to noncontrolling interests ........... 253 (835) (2,872)Other, net ................................................................................. 407 2,063 38
Total income tax expense/(benefit)............................................ $ 19,047 $ 30,229 $ (17,128)
In accordance with ASC 740, U.S. income taxes are not provided on undistributed earnings of international subsidiaries that are permanently reinvested. As of December 31, 2018, no deferred taxes have been provided for withholding taxes or other taxes that would result upon repatriation of our foreign earnings to the U.S.

Piper Jaffray Companies
Notes to the Consolidated Financial Statements – Continued
109
Deferred income tax assets and liabilities reflect the tax effect of temporary differences between the carrying amount of assets and liabilities for financial reporting purposes and the amounts used for the same items for income tax reporting purposes. The net deferred income tax assets consisted of the following items:
December 31, December 31,(Dollars in thousands) 2018 2017Deferred tax assets:
Deferred compensation ............................................................................................ $ 67,563 $ 61,555Goodwill tax basis in excess of book basis .............................................................. 35,614 38,592Net operating loss carryforwards ............................................................................. 5,554 4,789Liabilities/accruals not currently deductible ............................................................ 1,117 1,744Other......................................................................................................................... 4,976 3,296
Total deferred tax assets......................................................................................... 114,824 109,976Valuation allowance............................................................................................... (5,458) (159)
Deferred tax assets after valuation allowance ..................................................... 109,366 109,817
Deferred tax liabilities:Unrealized gains on firm investments ...................................................................... 4,464 6,599Fixed assets .............................................................................................................. 2,450 1,813Other......................................................................................................................... 595 200
Total deferred tax liabilities ................................................................................... 7,509 8,612
Net deferred tax assets ................................................................................................ $ 101,857 $ 101,205
The realization of deferred tax assets is assessed and a valuation allowance is recorded to the extent that it is more likely than not that any portion of the deferred tax asset will not be realized. The Company believes that its future tax profits will be sufficient to recognize its deferred tax assets, with the exception of $5.5 million in state and foreign net operating loss carryforwards.
The Company accounts for unrecognized tax benefits in accordance with the provisions of ASC 740, which requires tax reserves to be recorded for uncertain tax positions on the consolidated statements of financial condition. A reconciliation of the beginning and ending amount of unrecognized tax benefits is as follows:
(Dollars in thousands)
Balance at December 31, 2015 .................................................................................................................. $ 123Additions based on tax positions related to the current year ....................................................................... —Additions for tax positions of prior years .................................................................................................... —Reductions for tax positions of prior years .................................................................................................. —Settlements................................................................................................................................................... —Balance at December 31, 2016 .................................................................................................................. $ 123Additions based on tax positions related to the current year ....................................................................... —Additions for tax positions of prior years .................................................................................................... 166Reductions for tax positions of prior years .................................................................................................. —Settlements................................................................................................................................................... (123)Balance at December 31, 2017 .................................................................................................................. $ 166Additions based on tax positions related to the current year ....................................................................... 608Additions for tax positions of prior years .................................................................................................... —Reductions for tax positions of prior years .................................................................................................. —Settlements................................................................................................................................................... —Balance at December 31, 2018 .................................................................................................................. $ 774

Piper Jaffray Companies
Notes to the Consolidated Financial Statements – Continued
110
As of December 31, 2018, approximately $0.8 million of the Company's unrecognized tax benefits would impact the annual effective rate, if recognized.
The Company recognizes interest and penalties accrued related to unrecognized tax benefits as a component of income tax expense. The Company had no accruals related to the payment of interest and penalties at December 31, 2018, 2017 and 2016, respectively. The Company or one of its subsidiaries files income tax returns with the various states and foreign jurisdictions in which the Company operates. The Company is not subject to examination by U.S. federal tax authorities for years before 2015 and is not subject to examination by state and local or non-U.S. tax authorities for taxable years before 2014. The Company does not anticipate its uncertain income tax positions will be resolved within the next twelve months.
Note 24 Piper Jaffray Companies (Parent Company only)
Condensed Statements of Financial Condition
December 31, December 31,(Amounts in thousands) 2018 2017Assets
Cash and cash equivalents........................................................................................ $ 254 $ 2,348Investment in and advances to subsidiaries.............................................................. 676,516 827,158Other assets .............................................................................................................. 27,529 21,120
Total assets............................................................................................................. $ 704,299 $ 850,626
Liabilities and Shareholders' EquitySenior notes .............................................................................................................. $ — $ 125,000Accrued compensation ............................................................................................. 26,081 30,579Other liabilities and accrued expenses ..................................................................... 774 1,715
Total liabilities ....................................................................................................... 26,855 157,294
Shareholders' equity ................................................................................................. 677,444 693,332Total liabilities and shareholders' equity................................................................ $ 704,299 $ 850,626
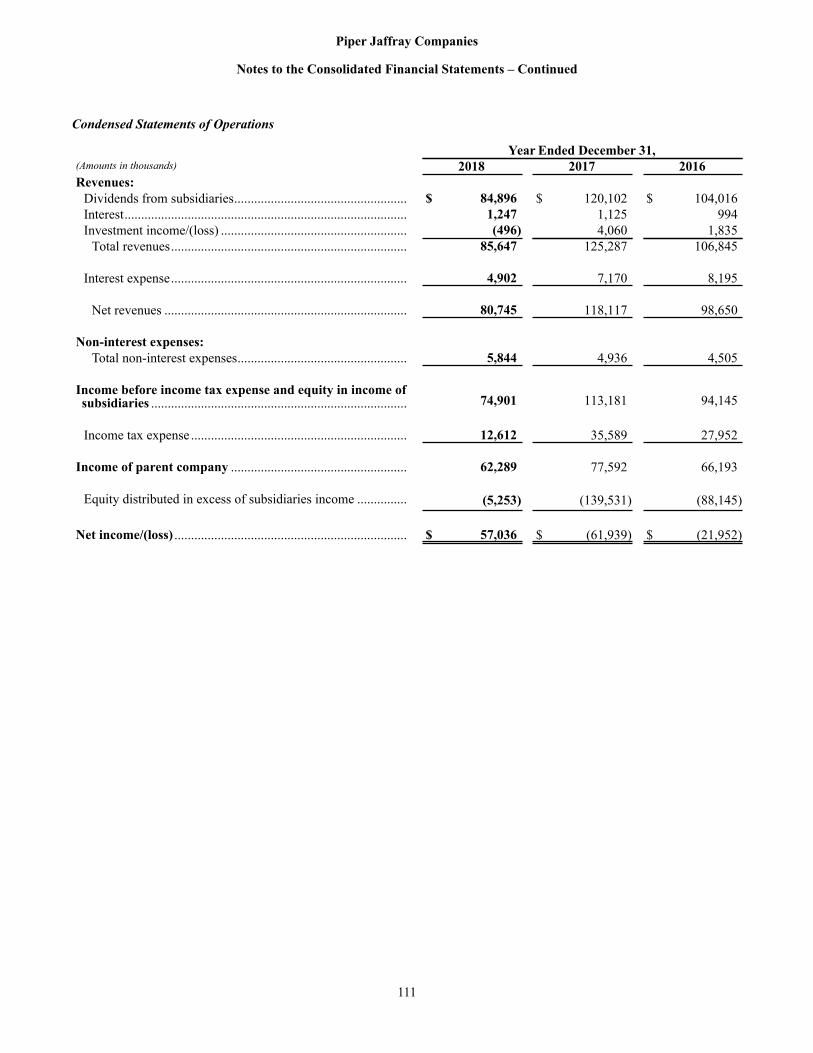
Piper Jaffray Companies
Notes to the Consolidated Financial Statements – Continued
111
Condensed Statements of Operations
Year Ended December 31,(Amounts in thousands) 2018 2017 2016Revenues:
Dividends from subsidiaries.................................................... $ 84,896 $ 120,102 $ 104,016Interest..................................................................................... 1,247 1,125 994Investment income/(loss) ........................................................ (496) 4,060 1,835
Total revenues....................................................................... 85,647 125,287 106,845
Interest expense....................................................................... 4,902 7,170 8,195
Net revenues ......................................................................... 80,745 118,117 98,650
Non-interest expenses:Total non-interest expenses................................................... 5,844 4,936 4,505
Income before income tax expense and equity in income ofsubsidiaries ............................................................................. 74,901 113,181 94,145
Income tax expense ................................................................. 12,612 35,589 27,952
Income of parent company ..................................................... 62,289 77,592 66,193
Equity distributed in excess of subsidiaries income ............... (5,253) (139,531) (88,145)
Net income/(loss) ...................................................................... $ 57,036 $ (61,939) $ (21,952)

Piper Jaffray Companies
Notes to the Consolidated Financial Statements – Continued
112
Condensed Statements of Cash Flows
Year Ended December 31,(Amounts in thousands) 2018 2017 2016Operating Activities:
Net income/(loss) .......................................................................... $ 57,036 $ (61,939) $ (21,952)Adjustments to reconcile net income/(loss) to net cash providedby operating activities:Stock-based and deferred compensation .................................... 404 208 944Equity distributed in excess of subsidiaries income ................... 5,253 139,531 88,145
Net cash provided by operating activities................................... 62,693 77,800 67,137
Financing Activities:Repayment of senior notes ............................................................ (125,000) (50,000) —Advances from/(to) subsidiaries ................................................... 154,512 (5,177) (6,276)Repurchase of common stock ....................................................... (47,142) (2,498) (59,739)Payment of cash dividend ............................................................. (47,157) (18,947) —
Net cash used in financing activities .......................................... (64,787) (76,622) (66,015)
Net increase/(decrease) in cash, cash equivalents and restrictedcash ................................................................................................ (2,094) 1,178 1,122
Cash, cash equivalents and restricted cash at beginning of year ..... 2,348 1,170 48
Cash, cash equivalents and restricted cash at end of year ............... $ 254 $ 2,348 $ 1,170
Note 25 Subsequent Event
On February 25, 2019, the Company signed a definitive agreement to acquire Weeden & Co., L.P., a broker dealer specializing in equity security sales and trading, for total consideration of approximately $42.0 million, consisting of $24.5 million in cash and $17.5 million in restricted cash consideration and retention stock. Additional consideration up to $31.5 million may be earned if certain revenue targets are achieved. The transaction is expected to close in the second quarter of 2019, subject to regulatory approvals and customary closing conditions.

Piper Jaffray Companies
Supplementary Data
113
Quarterly Information (unaudited)
2018 Fiscal Quarter(Amounts in thousands, except per share data) First Second Third FourthTotal revenues....................................................................... $ 174,400 $ 178,580 $ 221,233 $ 226,780Interest expense .................................................................... 5,338 5,099 3,705 2,409Net revenues ......................................................................... 169,062 173,481 217,528 224,371Non-interest expenses .......................................................... 161,024 168,222 187,893 192,426Income before income tax expense/(benefit) ....................... 8,038 5,259 29,635 31,945Income tax expense/(benefit) ............................................... (2,581) 567 7,365 13,696Net income ........................................................................... 10,619 4,692 22,270 18,249Net income/(loss) applicable to noncontrolling interests ..... 16 (1,534) 247 65Net income applicable to Piper Jaffray Companies ............. $ 10,603 $ 6,226 $ 22,023 $ 18,184Net income applicable to Piper Jaffray Companies'common shareholders ......................................................... $ 6,435 $ 5,522 $ 19,377 $ 16,164
Earnings per common shareBasic................................................................................... $ 0.47 $ 0.43 $ 1.45 $ 1.22Diluted................................................................................ $ 0.47 $ 0.43 $ 1.43 $ 1.21
Dividends declared per common share............................. $ 1.995 $ 0.375 $ 0.375 $ 0.375Weighted average number of common shares
Basic................................................................................... 13,096 13,303 13,343 13,191Diluted................................................................................ 13,382 13,438 13,508 13,367
2017 Fiscal Quarter(Amounts in thousands, except per share data) First Second Third FourthTotal revenues....................................................................... $ 205,487 $ 204,007 $ 244,915 $ 240,782Interest expense .................................................................... 4,958 6,262 4,348 4,700Net revenues ......................................................................... 200,529 197,745 240,567 236,082Non-interest expenses .......................................................... 177,720 177,878 322,803 (1) 225,845Income/(loss) before income tax expense/(benefit) ............. 22,809 19,867 (82,236) 10,237Income tax expense/(benefit) ............................................... (395) 4,906 (31,423) 57,141 (4)
Net income/(loss) ................................................................. 23,204 14,961 (50,813) (46,904)Net income/(loss) applicable to noncontrolling interests ..... 2,929 1,388 (1,100) (830)Net income/(loss) applicable to Piper Jaffray Companies ... $ 20,275 $ 13,573 $ (49,713) $ (46,074)Net income/(loss) applicable to Piper Jaffray Companies'common shareholders ......................................................... $ 16,828 $ 11,522 $ (50,415) (2) $ (46,771) (2)
Earnings/(loss) per common shareBasic................................................................................... $ 1.33 $ 0.89 $ (3.91) $ (3.63)Diluted................................................................................ $ 1.31 $ 0.89 $ (3.91) (3) $ (3.63) (3)
Dividends declared per common share............................. $ 0.3125 $ 0.3125 $ 0.3125 $ 0.3125Weighted average number of common shares
Basic................................................................................... 12,594 12,826 12,898 12,906Diluted................................................................................ 12,922 12,937 12,975 (3) 13,075 (3)
(1) Includes a $114.4 million non-cash goodwill impairment charge.(2) No allocation of undistributed income was made due to loss position.(3) Earnings per diluted common share is calculated using the basic weighted average number of common shares outstanding for periods
in which a loss is incurred.(4) Includes a $54.2 million remeasurement of deferred tax assets due to a lower federal corporate rate resulting from the enactment of the
Tax Cuts and Jobs Act.

114
ITEM 9. CHANGES IN AND DISAGREEMENTS WITH ACCOUNTANTS ON ACCOUNTING AND FINANCIAL DISCLOSURE.
None.
ITEM 9A. CONTROLS AND PROCEDURES.
As of the end of the period covered by this report, we conducted an evaluation, under the supervision and with the participation of our principal executive officer and principal financial officer, of our disclosure controls and procedures (as defined in Rules 13a-15(e) and 15d-15(e) under the Securities Exchange Act of 1934). Based on this evaluation, our principal executive officer and principal financial officer concluded that our disclosure controls and procedures are effective to ensure that information required to be disclosed by us in reports that we file or submit under the Securities Exchange Act of 1934 is (a) recorded, processed, summarized and reported within the time periods specified in Securities and Exchange Commission rules and forms and (b) accumulated and communicated to our management, including our principal executive officer and principal financial officer to allow timely decisions regarding disclosure.
During the fourth quarter of our fiscal year ended December 31, 2018, there was no change in our system of internal control over financial reporting (as defined in Rules 13a-15(f) and 15d-15(f) under the Securities Exchange Act of 1934) that has materially affected, or is reasonably likely to materially affect, our internal control over financial reporting.
Management's Report on Internal Control Over Financial Reporting and the attestation report of our independent registered public accounting firm on management's assessment of internal control over financial reporting are included in Part II, Item 8 of this Form 10-K entitled "Financial Statements and Supplementary Data" and are incorporated herein by reference.
ITEM 9B. OTHER INFORMATION.
Not applicable.
PART III
ITEM 10. DIRECTORS, EXECUTIVE OFFICERS AND CORPORATE GOVERNANCE.
The information regarding our executive officers included in Part I, Item 1 of this Form 10-K under the caption "Executive Officers" is incorporated herein by reference. The information in the definitive proxy statement for our 2019 annual meeting of shareholders to be held on May 17, 2019, under the captions "Proposal One — Election of Directors," "Information Regarding the Board of Directors and Corporate Governance — Committees of the Board — Audit Committee," "Information Regarding the Board of Directors and Corporate Governance — Codes of Ethics and Business Conduct" and "Section 16(a) Beneficial Ownership Reporting Compliance" is incorporated herein by reference.
ITEM 11. EXECUTIVE COMPENSATION.
The information in the definitive proxy statement for our 2019 annual meeting of shareholders to be held on May 17, 2019, under the captions "Executive Compensation," "Certain Relationships and Related Transactions — Compensation Committee Interlocks and Insider Participation," "Information Regarding the Board of Directors and Corporate Governance — Compensation Program for Non-Employee Directors" and "Information Regarding the Board of Directors and Corporate Governance — Non-Employee Director Compensation for 2018" is incorporated herein by reference.

115
ITEM 12. SECURITY OWNERSHIP OF CERTAIN BENEFICIAL OWNERS AND MANAGEMENT AND RELATED SHAREHOLDER MATTERS.
The information in the definitive proxy statement for our 2019 annual meeting of shareholders to be held on May 17, 2019, under the captions "Security Ownership — Beneficial Ownership of Directors, Nominees and Executive Officers," "Security Ownership — Beneficial Owners of More than Five Percent of Our Common Stock" and "Executive Compensation — Outstanding Equity Awards at Fiscal Year-End" are incorporated herein by reference.
ITEM 13. CERTAIN RELATIONSHIPS AND RELATED TRANSACTIONS, AND DIRECTOR INDEPENDENCE.
The information in the definitive proxy statement for our 2019 annual meeting of shareholders to be held on May 17, 2019, under the captions "Information Regarding the Board of Directors and Corporate Governance — Director Independence," "Certain Relationships and Related Transactions — Transactions with Related Persons" and "Certain Relationships and Related Transactions — Review and Approval of Transactions with Related Persons" is incorporated herein by reference.
ITEM 14. PRINCIPAL ACCOUNTANT FEES AND SERVICES.
The information in the definitive proxy statement for our 2019 annual meeting of shareholders to be held on May 17, 2019, under the captions "Audit Committee Report and Payment of Fees to Our Independent Auditor — Auditor Fees" and "Audit Committee Report and Payment of Fees to Our Independent Auditor — Auditor Services Pre-Approval Policy" is incorporated herein by reference.
PART IV
ITEM 15. EXHIBITS AND FINANCIAL STATEMENT SCHEDULES.
(a)(1) FINANCIAL STATEMENTS OF THE COMPANY.
The Consolidated Financial Statements are incorporated herein by reference and included in Part II, Item 8 to this Form 10-K.
(a)(2) FINANCIAL STATEMENT SCHEDULES.
All financial statement schedules for the Company have been included in the Consolidated Financial Statements or the related footnotes, or are either inapplicable or not required.
(a)(3) EXHIBITS.
Exhibit IndexExhibitNumber Description
2.1 Separation and Distribution Agreement dated as of December 23, 2003, between U.S. Bancorp and Piper Jaffray Companies (incorporated by reference to Exhibit 2.1 to the Company's Annual Report on Form 10-K for the fiscal year ended December 31, 2003, filed March 8, 2004). #
2.2 Securities Purchase Agreement dated November 16, 2015 among Piper Jaffray Companies, Piper Jaffray & Co., Simmons & Company International, SCI JV LP, SCI GP, LLC, and Simmons & Company International Holdings LLC (incorporated by reference to Exhibit 2.1 to the Company's Current Report on Form 8-K, filed November 17, 2015). #
2.3 First Amendment to Securities Purchase Agreement dated February 25, 2016 among Piper Jaffray Companies, Piper Jaffray & Co., Simmons & Company International, SCI JV LP, SCI GP, LLC, and Simmons & Company International Holdings LLC (incorporated by reference to Exhibit 2.1 to the Company's Quarterly Report on Form 10-Q for the period ended March 31, 2016, filed May 4, 2016). #

116
Exhibit IndexExhibitNumber Description
2.4 Second Amendment to Securities Purchase Agreement dated April 19, 2017 between Piper Jaffray & Co. and SCI JV LP (incorporated by reference to Exhibit 10.2 to the Company's Quarterly Report on Form 10-Q for the period ended March 31, 2017, filed May 9, 2017).
3.1 Amended and Restated Certificate of Incorporation (incorporated by reference to Exhibit 3.1 to the Company's Quarterly Report on Form 10-Q for the period ended June 30, 2007, filed August 3, 2007).
3.2 Amended and Restated Bylaws (as of August 5, 2016) (incorporated by reference to Exhibit 3.1 to the Company's Current Report on Form 8-K, filed August 5, 2016).
4.1 Form of Specimen Certificate for Piper Jaffray Companies Common Stock (incorporated by reference to Exhibit 4.1 to the Company's Annual Report on Form 10-K for the year ended December 31, 2017, filed February 26, 2018).
4.2 Second Amended and Restated Indenture dated as of June 11, 2012 (Secured Commercial Paper Notes), between Piper Jaffray & Co. and the Bank of New York Mellon (incorporated by reference to Exhibit 4.1 to the Company's Quarterly Report on Form 10-Q for the fiscal quarter ended June 30, 2012, filed August 2, 2012).
4.3 First Amendment to Second Amended and Restated Indenture (Secured Commercial Paper Notes - Series I), dated September 29, 2017, between Piper Jaffray & Co. and the Bank of New York Mellon (incorporated by reference to Exhibit 4.1 to the Company's Quarterly Report on Form 10-Q for the fiscal quarter ended September 30, 2017, filed November 8, 2017).
4.4 Amended and Restated Indenture (Secured Commercial Paper Notes - Series II), dated as of April 30, 2015, between Piper Jaffray & Co. and the Bank of New York Mellon (incorporated by reference to Exhibit 4.1 to the Company's Current Report on Form 8-K, filed October 2, 2017).
4.5 First Amendment to Amended and Restated Indenture (Secured Commercial Paper Notes - Series II), dated as of September 29, 2017, between Piper Jaffray & Co. and the Bank of New York Mellon (incorporated by reference to Exhibit 4.2 to the Company's Current Report on Form 8-K, filed October 2, 2017).
4.6 Second Amended and Restated Indenture dated April 21, 2014 (Secured Commercial Paper Notes -- Series III), between Piper Jaffray & Co. and the Bank of New York Mellon (incorporated by reference to Exhibit 10.1 to the Company's Current Report on Form 8-K, filed April 21, 2014).
10.1 Form of director indemnification agreement between Piper Jaffray Companies and its directors (incorporated by reference to Exhibit 10.1 to the Company's Current Report on Form 8-K, filed March 17, 2014). †
10.2 Office Lease Agreement, dated May 30, 2012, by and among Piper Jaffray & Co. and Wells REIT – 800 Nicollett Avenue Owner, LLC (incorporated by reference to Exhibit 10.1 to the Company's Current Report on Form 8-K, filed June 1, 2012).
10.3 U.S. Bancorp Piper Jaffray Inc. Second Century 2000 Deferred Compensation Plan (incorporated by reference to Exhibit 10.10 to the Company's Annual Report on Form 10-K for the fiscal year ended December 31, 2003, filed March 8, 2004). †
10.4 U.S. Bancorp Piper Jaffray Inc. Second Century Growth Deferred Compensation Plan, as amended and restated effective September 30, 1998 (incorporated by reference to Exhibit 10.11 to the Company's Annual Report on Form 10-K for the fiscal year ended December 31, 2003, filed March 8, 2004). †
10.5 Piper Jaffray Companies Amended and Restated 2003 Annual and Long-Term Incentive Plan (as amended May 31, 2015) (incorporated by reference to Exhibit 10.1 to the Company's Current Report on Form 8-K, filed May 14, 2015). †
10.6 Piper Jaffray Companies Deferred Compensation Plan (incorporated by reference to Exhibit 10.2 to the Company's Quarterly Report on Form 10-Q for the period ended June 30, 2013, filed July 31, 2013). †
10.7 Form of Restricted Stock Agreement for Employee Grants in 2014 (related to 2013 performance) under the Piper Jaffray Companies Amended and Restated 2003 Annual and Long-Term Incentive Plan (incorporated by reference to Exhibit 10.8 to the Company's Annual Report on Form 10-K for the year ended December 31, 2013, filed February 28, 2014). †
10.8 Form of Restricted Stock Agreement for California-based Employee Grants in 2015 (related to 2014 performance) under the Piper Jaffray Companies Amended and Restated 2003 Annual and Long-Term Incentive Plan (incorporated by reference to Exhibit 10.10 to the Company's Annual Report on Form 10-K for the year ended December 31, 2014, filed February 26, 2015). †

117
Exhibit IndexExhibitNumber Description
10.9 Form of Performance Share Unit Agreement for 2014 Leadership Team Grants under the Piper Jaffray Companies Amended and Restated 2003 Annual and Long-Term Incentive Plan (incorporated by reference to Exhibit 10.1 to the Company's Quarterly Report on Form 10-Q for the period ended June 30, 2014, filed July 30, 2014). †
10.10 Form of Performance Share Unit Agreement for 2015 Leadership Team Grants under the Piper Jaffray Companies Amended and Restated 2003 Annual and Long-Term Incentive Plan (incorporated by reference to Exhibit 10.3 to the Company's Quarterly Report on Form 10-Q for the period ended June 30, 2015, filed August 5, 2015). †
10.11 Form of Performance Share Unit Agreement for 2016 Leadership Team Grants under the Piper Jaffray Companies Amended and Restated 2003 Annual and Long-Term Incentive Plan (incorporated by reference to Exhibit 10.4 to the Company's Quarterly Report on Form 10-Q for the period ended March 31, 2016, filed May 4, 2016). †
10.12 Form of Performance Share Unit Agreement for 2017 Leadership Team Grants under the Piper Jaffray Companies Amended and Restated 2003 Annual and Long-Term Incentive Plan (incorporated by reference to Exhibit 10.20 to the Company's Annual Report on Form 10-K for the year ended December 31, 2016, filed February 24, 2017). †
10.13 Form of Performance Share Unit Agreement for 2018 Leadership Team Grants under the Piper Jaffray Companies Amended and Restated 2003 Annual and Long-Term Incentive Plan (incorporated by reference to Exhibit 10.13 to the Company’s Annual Report on Form 10-K for the fiscal year ended December 31, 2017, filed February 26, 2018). †
10.14 Form of Performance Share Unit Agreement for 2019 Leadership Team Grants under the Piper Jaffray Companies Amended and Restated 2003 Annual and Long-Term Incentive Plan. †*
10.15 Piper Jaffray Companies Deferred Compensation Plan for Non-Employee Directors, as amended and restated effective May 4, 2016 (incorporated by reference to Exhibit 10.1 to the Company's Quarterly Report on Form 10-Q for the period ended June 30, 2016, filed August 5, 2016). †
10.16 Summary of Non-Employee Director Compensation Program. †*10.17 Form of Notice Period Agreement (incorporated by reference to Exhibit 10.16 to the Company's Annual Report
on Form 10-K for the year ended December 31, 2006, filed March 1, 2007). †10.18 Amended and Restated Loan Agreement dated December 28, 2012, between Piper Jaffray & Co. and U.S.
Bank National Association (incorporated by reference to Exhibit 10.16 to the Company's Annual Report on Form 10-K for the year ended December 31, 2012, filed February 27, 2013).
10.19 First Amendment to Amended and Restated Loan Agreement, dated December 28, 2013, between Piper Jaffray & Co. and U.S. Bank National Association (incorporated by reference to Exhibit 10.18 to the Company's Annual Report on Form 10-K for the year ended December 31, 2013, filed February 28, 2014).
10.20 Second Amendment to Amended and Restated Loan Agreement, dated December 19, 2014, between Piper Jaffray & Co. and U.S. Bank National Association (incorporated by reference to Exhibit 10.23 to the Company's Annual Report on Form 10-K for the year ended December 31, 2014, filed February 26, 2015).
10.21 Third Amendment to Amended and Restated Loan Agreement, dated December 18, 2015, between Piper Jaffray & Co. and U.S. Bank National Association (incorporated by reference to Exhibit 10.25 to the Company's Annual Report on Form 10-K for the fiscal year ended December 31, 2015, filed February 25, 2016).
10.22 Fourth Amendment to Amended and Restated Loan Agreement, dated December 17, 2016, between Piper Jaffray & Co. and U.S. Bank National Association (incorporated by reference to Exhibit 10.1 to the Company's Quarterly Report on Form 10-Q for the period ended March 31, 2017, filed May 9, 2017).
10.23 Fifth Amendment to Amended and Restated Loan Agreement, dated December 16, 2017, between Piper Jaffray & Co. and U.S. Bank National Association (incorporated by reference to Exhibit 10.21 to the Company's Annual Report on Form 10-K for the fiscal year ended December 31, 2017, filed February 26, 2018).
10.24 Sixth Amendment to Amended and Restated Loan Agreement, dated December 14, 2018, between Piper Jaffray & Co. and U.S. Bank National Association. *
10.25 Advisory Research, Inc. Long-Term Incentive Plan (incorporated by reference to Exhibit 10.26 to the Company's Annual Report on Form 10-K for the year ended December 31, 2013, filed February 28, 2014). †
10.26 Piper Jaffray Companies Amended and Restated Mutual Fund Restricted Share Investment Plan, effective as of December 13, 2016 (incorporated by reference to Exhibit 10.34 to the Company's Annual Report on Form 10-K for the fiscal year ended December 31, 2016, filed February 24, 2017). †

118
Exhibit IndexExhibitNumber Description
10.27 Form of Mutual Fund Restricted Share Agreement for Employee Grants in 2014 (related to performance in 2013) (incorporated by reference to Exhibit 10.29 to the Company's Annual Report on Form 10-K for the year ended December 31, 2013, filed February 28, 2014). †
10.28 Form of Mutual Fund Restricted Share Agreement for Employee Grants in 2015 (related to performance in 2014) (incorporated by reference to Exhibit 10.32 to the Company's Annual Report on Form 10-K for the year ended December 31, 2014, filed February 26, 2015). †
10.29 Form of Mutual Fund Restricted Share Agreement for California-based Employee Grants in 2015 (related to performance in 2014) (incorporated by reference to Exhibit 10.33 to the Company's Annual Report on Form 10-K for the year ended December 31, 2014, filed February 26, 2015). †
10.30 Form of Restricted Stock and Mutual Fund Restricted Share Agreement for Employee Grants in 2016 (related to performance in 2015) under the Piper Jaffray Companies Amended and Restated 2003 Annual and Long-Term Incentive Plan and Mutual Fund Restricted Share Investment Plan (incorporated by reference to Exhibit 10.37 to the Company's Annual Report on Form 10-K for the fiscal year ended December 31, 2015, filed February 25, 2016). †
10.31 Form of Restricted Stock and Mutual Fund Restricted Share Agreement for California-based Employee Grants in 2016 (related to performance in 2015) under the Piper Jaffray Companies Amended and Restated 2003 Annual and Long-Term Incentive Plan and Mutual Fund Restricted Share Investment Plan (incorporated by reference to Exhibit 10.38 to the Company's Annual Report on Form 10-K for the fiscal year ended December 31, 2015, filed February 25, 2016). †
10.32 Form of Restricted Stock and Mutual Fund Restricted Share Agreement for Employee Grants in 2017 (related to performance in 2016) under the Piper Jaffray Companies Amended and Restated 2003 Annual and Long-Term Incentive Plan and Mutual Fund Restricted Share Investment Plan (incorporated by reference to Exhibit 10.41 to the Company's Annual Report on Form 10-K for the fiscal year ended December 31, 2016, filed February 24, 2017). †
10.33 Form of Restricted Stock and Mutual Fund Restricted Share Agreement for California-based Employee Grants in 2017 (related to performance in 2016) under the Piper Jaffray Companies Amended and Restated 2003 Annual and Long-Term Incentive Plan and Mutual Fund Restricted Share Investment Plan (incorporated by reference to Exhibit 10.42 to the Company's Annual Report on Form 10-K for the fiscal year ended December 31, 2016, filed February 24, 2017). †
10.34 Form of Restricted Stock and Mutual Fund Restricted Share Agreement for Employee Grants in 2018 (related to performance in 2017) under the Piper Jaffray Companies Amended and Restated 2003 Annual and Long-Term Incentive Plan and Mutual Fund Restricted Share Investment Plan (incorporated by reference to Exhibit 10.34 to the Company's Annual Report on Form 10-K for the fiscal year ended December 31, 2017, filed February 26, 2018). †
10.35 Form of Restricted Stock and Mutual Fund Restricted Share Agreement for California-based Employee Grants in 2018 (related to performance in 2017) under the Piper Jaffray Companies Amended and Restated 2003 Annual and Long-Term Incentive Plan and Mutual Fund Restricted Share Investment Plan (incorporated by reference to Exhibit 10.35 to the Company's Annual Report on Form 10-K for the fiscal year ended December 31, 2017, filed February 26, 2018). †
10.36 Form of Restricted Stock and Mutual Fund Restricted Share Agreement for Andrew S. Duff in 2018 (related to performance in 2017) under the Piper Jaffray Companies Amended and Restated 2003 Annual and Long-Term Incentive Plan and Mutual Fund Restricted Share Investment Plan (incorporated by reference to Exhibit 10.36 to the Company's Annual Report on Form 10-K for the fiscal year ended December 31, 2017, filed February 26, 2018). †
10.37 Form of 2018 Performance Share Unit Agreement for Andrew S. Duff under the Piper Jaffray Companies Amended and Restated 2003 Annual and Long-Term Incentive Plan (incorporated by reference to Exhibit 10.37 to the Company's Annual Report on Form 10-K for the fiscal year ended December 31, 2017, filed February 26, 2018). †
10.38 Form of Non-Qualified Stock Option Agreement for 2018 Promotional Grants under the Piper Jaffray Companies Amended and Restated 2003 Annual and Long-Term Incentive Plan (incorporated by reference to Exhibit 10.1 to the Company's Current Report on Form 8-K, filed February 9, 2018). †
10.39 Form of Restricted Stock and Mutual Fund Restricted Share Agreement for Employee Grants in 2019 (related to performance in 2018) under the Piper Jaffray Companies Amended and Restated 2003 Annual and Long-Term Incentive Plan and Mutual Fund Restricted Share Investment Plan. †*

119
Exhibit IndexExhibitNumber Description
10.40 Separation Agreement and Release, dated December 4, 2017, between Piper Jaffray & Co. and Stuart C. Harvey, Jr. (incorporated by reference to Exhibit 10.40 to the Company's Annual Report on Form 10-K for the fiscal year ended December 31, 2017, filed February 26, 2018). †
10.41 Amendment No.1 to Separation Agreement and Release, dated December 22, 2017, between Piper Jaffray & Co. and Stuart C. Harvey, Jr. (incorporated by reference to Exhibit 10.41 to the Company's Annual Report on Form 10-K for the fiscal year ended December 31, 2017, filed February 26, 2018). †
10.42 Confidential Separation Agreement and Release, dated October 6, 2017, between Advisory Research, Inc. and Christopher D. Crawshaw. (incorporated by reference to Exhibit 10.42 to the Company's Annual Report on Form 10-K for the fiscal year ended December 31, 2017, filed February 26, 2018). †
10.43 Post-Termination Agreement, dated as of January 1, 2018, between Piper Jaffray Companies and Andrew S. Duff (incorporated by reference to Exhibit 10.1 to the Company's Current Report on Form 8-K, filed January 4, 2018). †
10.44 Piper Jaffray Companies 2016 Employment Inducement Award Plan (incorporated by reference to Exhibit 4.4 to the Company's Registration Statement on Form S-8, filed February 25, 2016). †
10.45 Form of Restricted Stock Agreement for Grants under the Piper Jaffray Companies 2016 Employment Inducement Award Plan (incorporated by reference to Exhibit 4.5 to the Company's Registration Statement on Form S-8, filed February 25, 2016). †
10.46 Consulting Agreement for Services of Independent Contractor dated November 16, 2015 by and between Piper Jaffray & Co. and Michael E. Frazier (incorporated by reference to Exhibit 10.1 to the Company's Quarterly Report on Form 10-Q for the period ended March 31, 2016, filed May 4, 2016). †
10.47 Restricted Stock Agreement dated November 16, 2015 by and between Piper Jaffray Companies and Michael E. Frazier (incorporated by reference to Exhibit 10.2 to the Company's Quarterly Report on Form 10-Q for the period ended March 31, 2016, filed May 4, 2016). †
21.1 Subsidiaries of Piper Jaffray Companies *23.1 Consent of Ernst & Young LLP *24.1 Power of Attorney *31.1 Rule 13a-14(a)/15d-14(a) Certification of Chief Executive Officer. 31.2 Rule 13a-14(a)/15d-14(a) Certification of Chief Financial Officer. 32.1 Section 1350 Certifications. 101
Interactive data files pursuant to Rule 405 Registration S-T: (i) the Consolidated Statements of Financial Condition as of December 31, 2018 and December 31, 2017, (ii) the Consolidated Statements of Operations for the years ended December 31, 2018, 2017 and 2016, (iii) the Consolidated Statements of Comprehensive Income for the years ended December 31, 2018, 2017 and 2016, (iv) the Consolidated Statements of Cash Flows for the years ended December 31, 2018, 2017 and 2016 and (v) the notes to the Consolidated Financial Statements.
_______________________# The Company hereby agrees to furnish supplementally to the Commission upon request any omitted exhibit or schedule.† This exhibit is a management contract or compensatory plan or agreement.* Filed herewith** This information is furnished and not filed for purposes of Section 11 and 12 of the Securities Act of 1933 and Section 18
of the Securities Exchange Act of 1934.
ITEM 16. FORM 10-K SUMMARY.
None.

120
SIGNATURES
Pursuant to the requirements of Section 13 or 15(d) of the Securities Exchange Act of 1934, the registrant has duly caused this report to be signed on its behalf by the undersigned, thereunto duly authorized on February 26, 2019.
PIPER JAFFRAY COMPANIES
By /s/ Chad R. AbrahamIts Chief Executive Officer
Pursuant to the requirements of the Securities Exchange Act of 1934, this report has been signed below by the following persons on behalf of the registrant and in the capacities indicated on February 26, 2019.
SIGNATURE TITLE
/s/ Chad R. Abraham Chief Executive Officer and DirectorChad R. Abraham (Principal Executive Officer)
/s/ Timothy L. Carter Chief Financial OfficerTimothy L. Carter (Principal Financial and Accounting Officer)
/s/ Andrew S. Duff ChairmanAndrew S. Duff
/s/ William R. Fitzgerald DirectorWilliam R. Fitzgerald
/s/ B. Kristine Johnson DirectorB. Kristine Johnson
/s/ Addison L. Piper DirectorAddison L. Piper
/s/ Debbra L. Schoneman DirectorDebbra L. Schoneman
/s/ Thomas S. Schreier Jr. DirectorThomas S. Schreier Jr.
/s/ Sherry M. Smith DirectorSherry M. Smith
/s/ Philip E. Soran DirectorPhilip E. Soran
/s/ Scott C. Taylor DirectorScott C. Taylor
/s/ Michele Volpi DirectorMichele Volpi
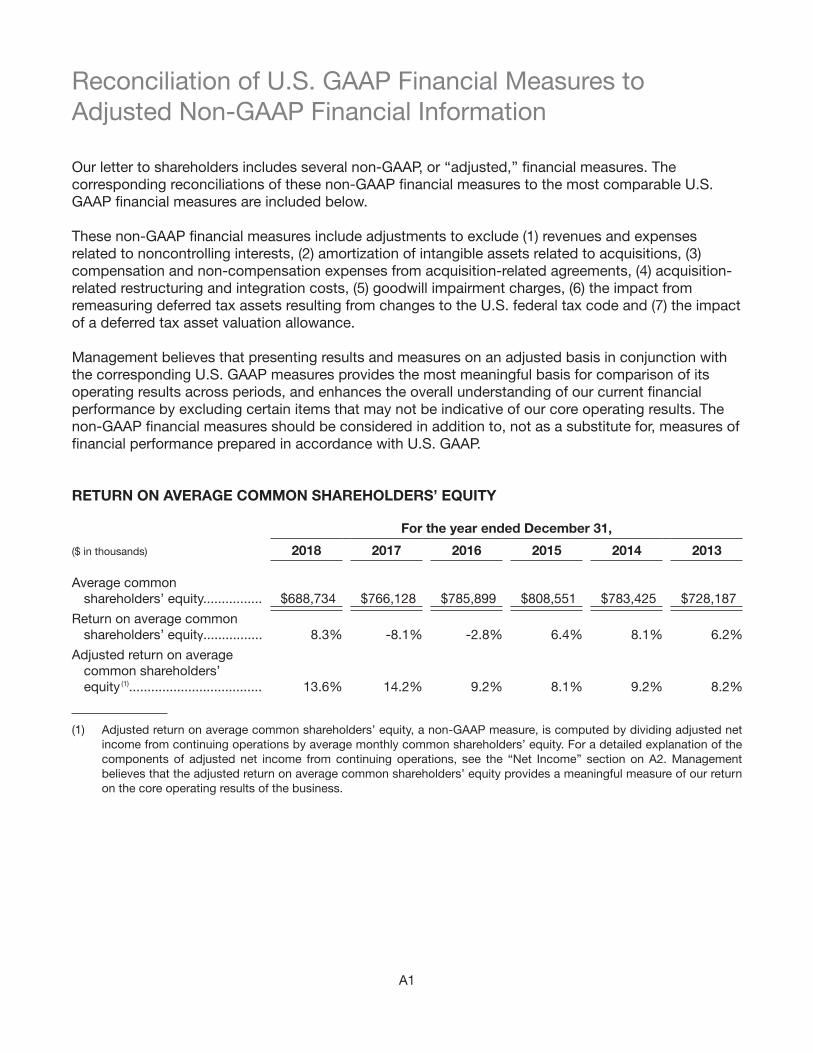
Reconciliation of U.S. GAAP Financial Measures toAdjusted Non-GAAP Financial Information
Our letter to shareholders includes several non-GAAP, or ‘‘adjusted,’’ financial measures. The corresponding reconciliations of these non-GAAP financial measures to the most comparable U.S. GAAP financial measures are included below.
These non-GAAP financial measures include adjustments to exclude (1) revenues and expenses related to noncontrolling interests, (2) amortization of intangible assets related to acquisitions, (3) compensation and non-compensation expenses from acquisition-related agreements, (4) acquisition-related restructuring and integration costs, (5) goodwill impairment charges, (6) the impact from remeasuring deferred tax assets resulting from changes to the U.S. federal tax code and (7) the impact of a deferred tax asset valuation allowance.
Management believes that presenting results and measures on an adjusted basis in conjunction with the corresponding U.S. GAAP measures provides the most meaningful basis for comparison of its operating results across periods, and enhances the overall understanding of our current financial performance by excluding certain items that may not be indicative of our core operating results. The non-GAAP financial measures should be considered in addition to, not as a substitute for, measures of financial performance prepared in accordance with U.S. GAAP.
RETURN ON AVERAGE COMMON SHAREHOLDERS’ EQUITY
For the year ended December 31,
($ in thousands) 2018 2017 2016 2015 2014 2013
Average common shareholders’ equity................ $688,734 $766,128 $785,899 $808,551 $783,425 $728,187
Return on average common shareholders’ equity................ 8.3% -8.1% -2.8% 6.4% 8.1% 6.2%
Adjusted return on average common shareholders’ equity (1).................................... 13.6% 14.2% 9.2% 8.1% 9.2% 8.2%
(1) Adjusted return on average common shareholders’ equity, a non-GAAP measure, is computed by dividing adjusted net income from continuing operations by average monthly common shareholders’ equity. For a detailed explanation of the components of adjusted net income from continuing operations, see the “Net Income” section on A2. Management believes that the adjusted return on average common shareholders’ equity provides a meaningful measure of our return on the core operating results of the business.
A1

NET REVENUES
A reconciliation of adjusted net revenues to U.S. GAAP net revenues:
For the year ended December 31,
($ in thousands) 2018 2017 2016 2015 2014 2013
U.S. GAAP net revenues.............. $784,442 $874,923 $747,349 $672,918 $648,138 $525,195
Adjustments:
Revenue related to noncontrolling interests....... (3,621) (5,319) (11,070) (9,810) (15,699) (8,794)
Adjusted net revenues................. $780,821 $869,604 $736,279 $663,108 $632,439 $516,401
NET INCOME
A reconciliation of adjusted net income from continuing operations applicable to Piper Jaffray Companies to U.S. GAAP net income/(loss) from continuing operations applicable to Piper Jaffray Companies:
For the year ended December 31,
($ in thousands) 2018 2017 2016 2015 2014 2013
U.S. GAAP net income/(loss) from continuing operations applicable to Piper Jaffray Companies............................. $ 57,036 $(61,939) $(21,952) $ 52,075 $ 63,172 $ 49,829
Adjustments:
Compensation from acquisition-related agreements.......................... 21,992 35,755 23,700 2,586 3,195 1,774
Restructuring and integration costs.................. - - 7,014 6,508 - 2,865
Goodwill impairment............... - 70,791 50,901 - - -
Amortization of intangible assets related to acquisitions......................... 7,868 9,534 12,979 4,681 5,747 5,079
Non-compensation expenses from acquisition-related agreements.......................... 514 607 - - - -
Impact of the Tax Cuts and Jobs Act legislation.............. 952 54,154 - - - -
Impact of deferred tax asset valuation allowance............. 5,299 - - - - -
Adjusted net income from continuing operations applicable to Piper Jaffray Companies............................. $ 93,661 $108,902 $ 72,642 $ 65,850 $ 72,114 $ 59,547
A2

EARNINGS PER DILUTED COMMON SHARE
A reconciliation of adjusted earnings per diluted common share from continuing operations to U.S. GAAP earnings/(loss) per diluted common share from continuing operations:
For the year ended December 31,
2018 2017 2016 2015 2014 2013
U.S. GAAP earnings/(loss) per diluted common share from continuing operations............. $ 3.72 $ (5.07) $ (1.73) $ 3.34 $ 3.87 $ 2.98
Adjustment for undistributed loss allocated to participating shares...................................... - 1.04
(1) 0.30
(1) - - -
3.72 (4.03) (1.43) 3.34 3.87 2.98
Adjustments:
Compensation from acquisition-related agreements.......................... 1.44 2.33 1.53 0.17 0.20 0.11
Restructuring and integration costs.................. - - 0.45 0.42 - 0.17
Goodwill impairment............... - 4.62 3.29 - - -
Amortization of intangible assets related to acquisitions......................... 0.52 0.62 0.84 0.30 0.35 0.30
Non-compensation expenses from acquisition-related agreements.......................... 0.04 0.04 - - - -
Impact of the Tax Cuts and Jobs Act legislation.............. 0.06 3.54 - - - -
Impact of deferred tax asset valuation allowance............. 0.35 - - - - -
Adjusted earnings per diluted common share from continuing operations............. $ 6.13 $ 7.12 $ 4.69 $ 4.22 $ 4.42 $ 3.56
(1) Piper Jaffray Companies calculates earnings per common share using the two-class method, which requires the allocation of consolidated adjusted net income between common shareholders and participating security holders, which in the case of Piper Jaffray Companies, represents unvested stock with dividend rights. No allocation of undistributed earnings is made for periods in which a loss in incurred.
A3

Corporate HeadquartersPiper Jaffray CompaniesMail Stop J09SSH800 Nicollet Mall, Suite 1000Minneapolis, MN 55402612 303-6000
Company Websitepiperjaffray.com
Stock Transfer Agent and RegistrarBroadridge acts as transfer agent and registrar for Piper Jaffray Companies and maintains all shareholder records for the company. If you have questions regarding Piper Jaffray Companies stock, transfers, corrections or changes, lost certificates or duplicate mailings, please contact Broadridge:
Onlineshareholder.broadridge.com/pjc
Telephone800 872-4409 Toll-Free720 501-4324 Outside of U.S.Shareowner relations specialists available Monday through Friday 9:00 a.m. to 6:00 p.m. ET
Written correspondenceBroadridge Corporate Issuer Solutions, Inc.P.O. Box 1342Brentwood, NY 11717
Certified and overnight deliveryBroadridge Corporate Issuer Solutions, Inc.ATTN: IWS 1155 Long Island AvenueEdgewood, NY 11717
Independent AccountantsErnst & Young LLP
Common Stock ListingNew York Stock Exchange (symbol: PJC)
Investor InquiriesShareholders, securities analysts and investors seeking more information about the company should contact Tim Carter, chief financial officer, at [email protected], 612 303-5607, or the corporate headquarters address.
Website Access to SEC Reports and Corporate Governance InformationPiper Jaffray Companies makes available free of charge on its website, piperjaffray.com, its annual reports on Form 10-K, quarterly reports on Form 10-Q, current reports on Form 8-K, and amendments to those reports filed or furnished pursuant to Section 13(a) or 15(d) of the Securities Exchange Act of 1934, as amended, as well as all other reports filed by Piper Jaffray Companies with the SEC, as soon as reasonably practicable after it electronically files them with, or furnishes them to, the SEC.
Piper Jaffray Companies also makes available free of charge on its website the company’s codes of ethics and business conduct, its corporate governance principles and the charters of the audit, compensation, and nominating and governance committees of the board of directors. Printed copies of these materials will be mailed upon request.
DividendsPiper Jaffray Companies began paying cash dividends on its common stock in 2017. The decision to pay future dividends is at the discretion of the board of directors.
Forward-Looking StatementsThis annual report and the preceding letter to shareholders contain forward-looking statements. Statements that are not historical or current facts, including statements about beliefs and expectations, are forward-looking statements and are subject to significant risks and uncertainties that are difficult to predict. A number of these risks and uncertainties are described in our SEC reports, including our Annual Report on Form 10-K for the year ended December 31, 2018. Forward-looking statements speak only as of the date they are made, and we undertake no obligation to update them in light of new information or future events.
