pipeline safety excellence performance
TRANSCRIPT
PIPELINE SAFETY EXCELLENCE PERFORMANCE2019 ANNUAL LIQUIDS REPORT
© Copyright 2019, all rights reserved. Digital Media | DM2019-020 |PDF

A M E R I C A N P E T R O L E U M I N S T I T U T E ( A P I )is the only national trade association that represents al l aspects
of America’s oi l and natural gas industry.
A S S O C I A T I O N O F O I L P I P E L I N E S ( A O P L )represents l iquids pipeline owners and operators transporting crude oil , petroleum
products l ike gasoline, diesel , jet fuel , home heating oi l and industrial products l ike
propane and ethane.

P I P E L I N E S A F E T Y E X C E L L E N C E P E R F O R M A N C E R E P O R T
.32 0 1 9 A N N U A L L I Q U I D S P I P E L I N E R E P O R T
MESSAGE FROM THE PIPELINE SAFETY EXCELLENCE STEERING COMMITTEE CHAIR . . . . . . . . . . 4 2018 PERFORMANCE SUMMARY . . . . . . . . . . . . . . . . . . . . . . . . . 5 P IPELINE SAFETY . . . . . . . . . . . . . . . . . . . . . . . . . . . . . . . . . . . . . . . . . . . . . 8 ENVIRONMENTAL PROTECTION . . . . . . . . . . . . . . . . . . . . . . . . . . 10 P IPELINE ECONOMIC & CONSUMER BENEFITS . . . . . . 12 COMMUNITY OUTREACH . . . . . . . . . . . . . . . . . . . . . . . . . . . . . . . . . . . 14
A STRATEGIC PLAN TO IMPROVE PIPELINE SAFETY . . . . . . . . . . . . . . . . . . . . . . . . . . . . . . . . . . . . . . . . . . . . 16
Goal 1 :
P romote Organ i za t iona l Exce l l ence . . . . . . . . . . . . . . . . . . . . . 20
Goal 2 : Improve Sa fe ty th rough Techno logy and
Innova t ion . . . . . . . . . . . . . . . . . . . . . . . . . . . . . . . . . . . . . . . . . . . . . . . . . . . . . 21
Goal 3 :
Enhance Emergency Response Preparedness . . . . . . . . 20
Goal 4 :
I nc rease S takeho lder Awareness & Invo l vement . . . . 22
2018 PERFORMANCE REPORT . . . . . . . . . . . . . . . . . . . . . . . . . . . . 24
DATA APPENDIX . . . . . . . . . . . . . . . . . . . . . . . . . . . . . . . . . . . . . . . . . . . . . . 38
DEFINITIONS & NOTES . . . . . . . . . . . . . . . . . . . . . . . . . . . . . . . . . . . . . 44
T A B L E O F C O N T E N T S
TABL
E O
F C
ON
TEN
TS

4.
P I P E L I N E S A F E T Y E X C E L L E N C E P E R F O R M A N C E R E P O R T
2 0 1 9 A N N U A L L I Q U I D S P I P E L I N E R E P O R T
Safety is at the heart of our business every minute
of every day – and we continue to improve. Over
the past f ive years, pipeline operators have
reduced the number of l iquids pipeline incidents
impacting people or the environment by 20% even
as pipeline miles and barrels delivered have risen.
Pipelines remain one of the safest ways to deliver
the energy we use every day, delivering their
products safely 99.999% of the time.
Our ongoing safety improvement efforts include
implementing enhanced technologies to evaluate
our assets, analyzing data and sharing learnings
and best practices as we drive towards the
industry goal of zero incidents. Summarized on
the fol lowing page, and shown in more detai l later
in this report, is our safety track record over the
last f ive years. In addition to fewer total pipeline
incidents, releases caused by corrosion or pipe
material fai lures are down 35% and incidents
caused by incorrect operation are down 38%
over the last f ive years.
Technology is a main driver of our continuous
improvement. Ongoing industry-wide research
and development init iatives wil l test and validate
the performance of new “smart pig” inspection
tools. Every year, we continue to improve and
apply more advanced technologies. We are using
ultrasonic, electromagnetic acoustic wave, and
magnetic f lux technologies to f ind ever-smaller
issues in pipelines that we can repair long before
they become a problem. We continue to improve
the data modeling and analytics as well , enhancing
our predictive capabil it ies.
Pipeline operators are also innovating in the ways
we manage our organizations and enhance our
safety cultures. In 2019, industry-wide efforts
wil l promote wider adoption of pipeline safety
management systems for companies throughout
our industry, and in specif ic functions such as
construction quality management, inspections and
maintenance, and leak detection programs.
Pipelines benefit consumers and working
Americans. Pipelines and the energy they deliver
powers America and improves our l ives every
day. Delivering energy that fuels our country,
providing jobs that drive our economy, keeping
our employees safe, and protecting our neighbors
and the environment are what motivates us. We
look forward to sharing more about our safety
commitment.
Sincerely,
T O D D D E N T O NP R E S I D E N T, P H I L L I P S 6 6 P I P E L I N E L L CC h a i r , A P I - A O P L P i p e l i n e S a f e t y E x c e l l e n c e S t e e r i n g C o m m i t t e e
“OVER THE PAST FIVE YEARS, PIPELINE OPERATORS HAVE REDUCED THE NUMBER OF LIQUIDS PIPELINE INCIDENTS IMPACTING PEOPLE OR THE ENVIRONMENT BY 20%”

P I P E L I N E S A F E T Y E X C E L L E N C E P E R F O R M A N C E R E P O R T
.52 0 1 9 A N N U A L L I Q U I D S P I P E L I N E R E P O R T
Pipeline incidents impacting people or the environment caused by incorrect operation
Pipeline incidents impacting people or the environment caused by corrosion, cracking or weld failures
TOTAL liquids pipeline incidents impacting people or the environment
-20%
-35%
-38%
Over the last 5 years
I N C I D E N T S
DOWNLIQUIDS PIPELINE INCIDENTS IMPACTING PEOPLE OR THE ENVIRONMENT ARE DOWN 20%
Implementing a Pipeline Safety Management System (Pipeline SMS) is a critical priority for the pipeline industry to effectively improve safety performance. To date, nearly
98% of liquid barrel miles are implementing a Pipeline SMS, making valuable steps along the journey of implementation.
LIQUIDS PIPELINES DELIVER THEIR PRODUCTS SAFELY 99.999% OF THE TIME
E V E N A S P I P E L I N E M I L E A G E A N D B A R R E L S D E L I V E R E D H A V E B O T H I N C R E A S E D O V E R 1 0 % .
6.
P I P E L I N E S A F E T Y E X C E L L E N C E P E R F O R M A N C E R E P O R T
2 0 1 9 A N N U A L L I Q U I D S P I P E L I N E R E P O R T
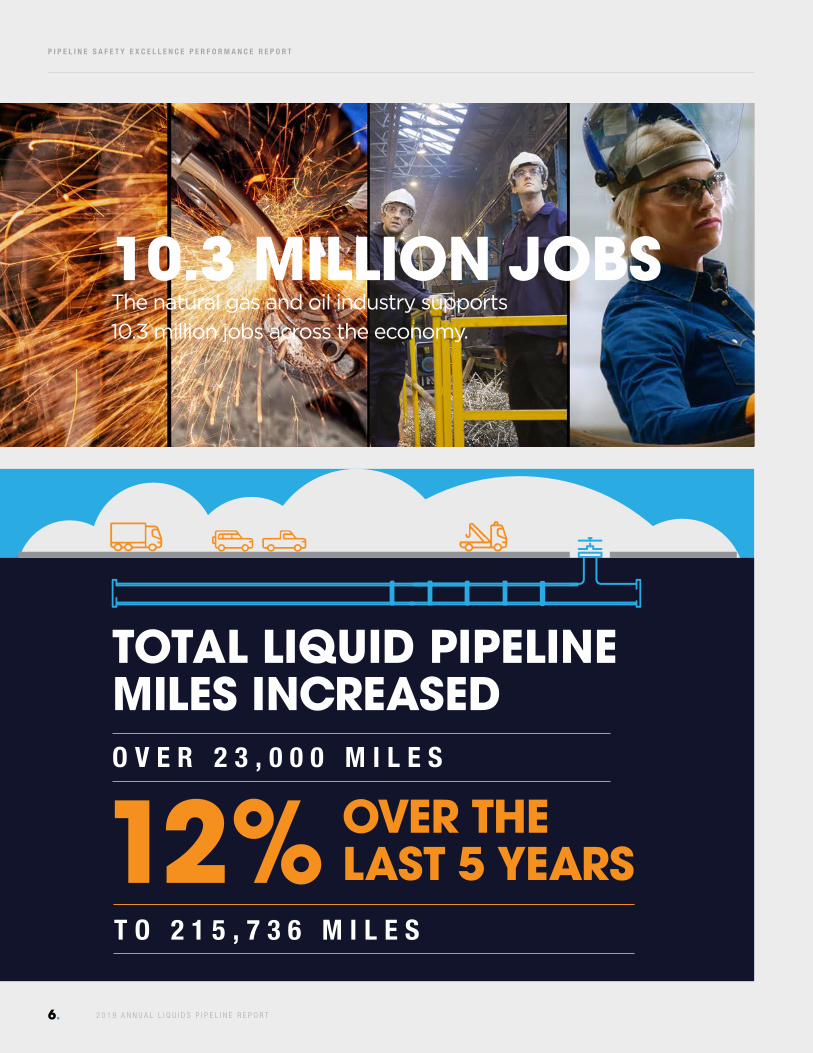
10.3 MILLION JOBS The natural gas and oil industry supports 10.3 million jobs across the economy.

P I P E L I N E S A F E T Y E X C E L L E N C E P E R F O R M A N C E R E P O R T
.72 0 1 9 A N N U A L L I Q U I D S P I P E L I N E R E P O R T
Crude oil pipeline incidents impacting people or the environment
ARE DOWN 21% OVER THE LAST 5 YEARS
74%
of pipeline incidents are contained within operators’ facilities, such as pump stations or tank farms
OVER THE LAST FIVE YEARS total crude oil and petroleum products barrels delivered by pipeline have increased 44%, or 6,563,309,091 barrels.

8.
P I P E L I N E S A F E T Y E X C E L L E N C E P E R F O R M A N C E R E P O R T
2 0 1 9 A N N U A L L I Q U I D S P I P E L I N E R E P O R T
PIPELINE SAFETYJay Burkhart, Pipeline Engineer, shows how pipeline operators are putting into practice the industry-wide goal to Improve Safety through Technology and Innovation.

P I P E L I N E S A F E T Y E X C E L L E N C E P E R F O R M A N C E R E P O R T
.92 0 1 9 A N N U A L L I Q U I D S P I P E L I N E R E P O R T
JAY Burkhart
Jay Burkhart went from being an intern straight
out of college to a ful l-t ime integrity engineer
at Marathon Pipe Line LLC (MPL) and has been
working there for the better part of a decade.
He has witnessed dramatic advances in the
technology used to inspect pipes. Jay and his
MPL colleagues are responsible for inspecting
every square inch of MPL’s 6,000 miles of l iquid
pipelines to maintain public safety and protect
the environment. “Before working for MPL, I didn’t
real ize the size and scope of the work we do and
the importance of it ,” Jay explained.
In September, Jay used a hi-tech inspection tool
with the same kind of technology you might f ind
in an ultrasound machine at your doctor ’s off ice
on a section of pipe in I l l inois. Bouncing sound
waves off the pipe’s walls, the tool, affectionately
cal led a “smart pig” in the pipeline world, gave
him a digital picture of the health of the pipeline
so his team could make sure everything was
operating safely. He and other integrity engineers
use the terabytes of data produced during these
inspections to confirm the pipe’s good condition
or schedule specif ic sections for maintenance
where needed.
He looks at his job as being part engineer and
part pipeline historian. “There’s been a lot of data
gathering over the years to determine the best
methods for managing a pipeline’s mechanical
integrity—what kind of steel it was made out of,
who manufactured it , what coatings have been
used and what products have f lowed through
it . In the past decade, inspection technology
has improved by leaps and bounds. I can stand
anywhere along hundreds of miles of pipeline
and tel l you what is going on at that location
based on the inspection data.”

10.
P I P E L I N E S A F E T Y E X C E L L E N C E P E R F O R M A N C E R E P O R T
2 0 1 9 A N N U A L L I Q U I D S P I P E L I N E R E P O R T
ENVIRONMENTAL PROTECTIONBrian Rosebrock, Environmental Inspector, shows how pipeline operators pursue the industry-wide goal to Promote Organizational Excellence with construction quality management.

P I P E L I N E S A F E T Y E X C E L L E N C E P E R F O R M A N C E R E P O R T
.112 0 1 9 A N N U A L L I Q U I D S P I P E L I N E R E P O R T
Part of Rosebrock’s job as an environmental
inspector includes evaluating the land and water
throughout the pipeline construction process
so that the land is restored to its original state
or left better than it was before the project.
Precautions are taken to guard against soi l
erosion, to faci l itate proper water drainage, and
to protect water quality.
“We use the environmental erosion control devices
to l imit impacts on the right-of-way,” Rosebrock
says. “Throughout the project, the water wil l be
tested according to regulations. We improve the
contours of the land, so it drains well , then we
replant it and re-seed it with native vegetation.”
Prior to working on pipelines, Rosebrock was a
hunting and fishing guide in Montana and Idaho.
“That is who I am. I love being outdoors. It ’s a
better l i festyle for a family man. I ’m proud of what
I do because I can make a difference on these
projects, make sure they are done as cleanly as
possible and having a good reputation within the
community helps get the next project done.”
BRIAN Rosebrock

12.
P I P E L I N E S A F E T Y E X C E L L E N C E P E R F O R M A N C E R E P O R T
2 0 1 9 A N N U A L L I Q U I D S P I P E L I N E R E P O R T
PIPELINE ECONOMIC AND CONSUMER BENEFITSKlint VanWingerden, Oil Movements Engineering Manager, shows how safe pipelines benefit consumers, workers and the local economy.

P I P E L I N E S A F E T Y E X C E L L E N C E P E R F O R M A N C E R E P O R T
.132 0 1 9 A N N U A L L I Q U I D S P I P E L I N E R E P O R T
Klint VanWingerden has l ived in Alaska al l of his
l i fe, graduating from the University of Alaska and
working engineering jobs before taking a position
at Alyeska Pipeline (operator of the Trans Alaska
Pipeline System, also known as TAPS) as an Oil
Movements Engineering Manager.
TAPS has been a central part of Alaskan l ife for
generations, providing one of the main sources
of revenue for the state economy and affordable
energy for Alaskans while also priorit izing the
safety and protection of the pristine Alaskan
environment. Kl int ’s father worked on the pipeline,
as did his brother, and Klint hopes that his
chi ldren wil l someday fol low their path as well –
three generations of the family working on the
Trans Alaska pipeline.
Kl int says of the pipeline, “[it] has real ly enabled
my family to enjoy a quality of l i fe that otherwise
wouldn’t be here. You know, you look at a lot
of infrastructure around Anchorage and Wasil la
and Fairbanks that just wouldn’t be here without
the oi l industry.” Alyeska even sponsors Klint ’s
team for the Iron Dog – a grueling 2,000-mile
snowmobile race through some of the most remote
and rugged landscapes in Alaska – something
he only dreamt of doing as a kid. Now, he has
participated in the race f ive times, something he
says he never would have been able to do without
Alyeska’s support.
KLINT VanWingerden
14.
P I P E L I N E S A F E T Y E X C E L L E N C E P E R F O R M A N C E R E P O R T
2 0 1 9 A N N U A L L I Q U I D S P I P E L I N E R E P O R T
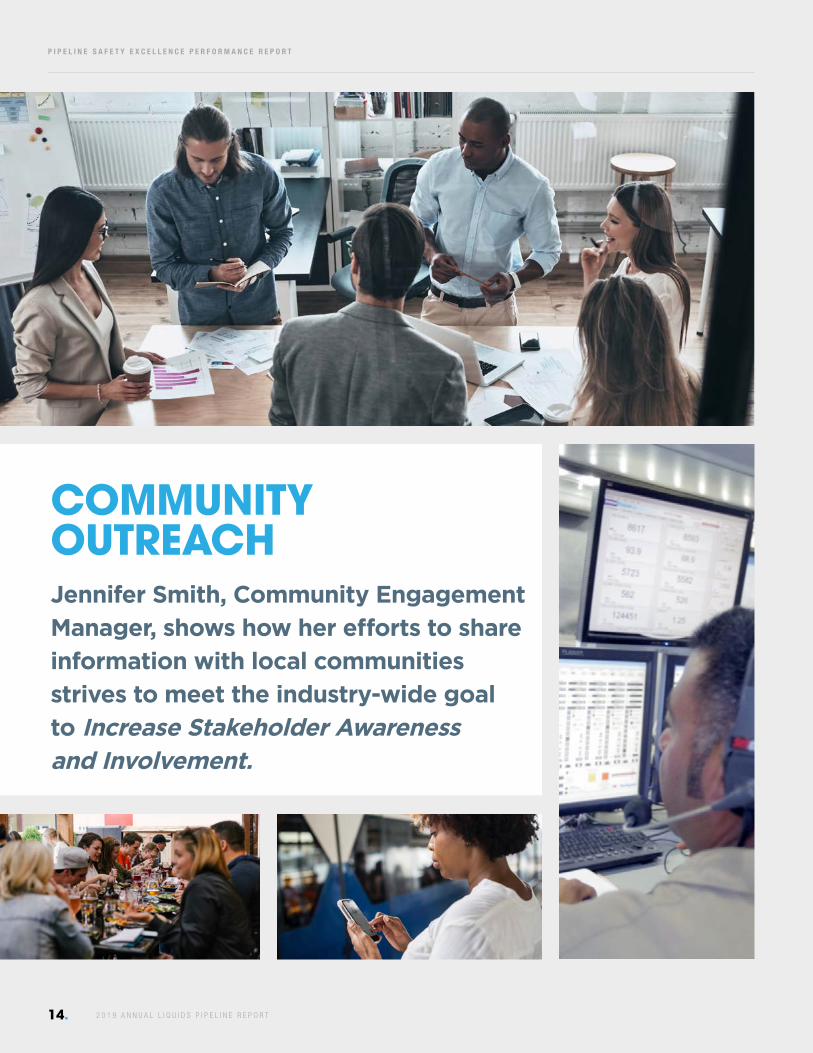
COMMUNITY OUTREACHJennifer Smith, Community Engagement Manager, shows how her efforts to share information with local communities strives to meet the industry-wide goal to Increase Stakeholder Awareness and Involvement.

P I P E L I N E S A F E T Y E X C E L L E N C E P E R F O R M A N C E R E P O R T
.152 0 1 9 A N N U A L L I Q U I D S P I P E L I N E R E P O R T
Jennifer Smith enjoys nothing more than
traveling across the wilds of Minnesota, whether
it ’s hiking with her family on the weekends or
meeting people al l across the state for her job as
Community Engagement Manager for Enbridge.
She has worked with communities from Buffalo,
New York al l the way through North Dakota,
building relationships with the people who reside
near pipeline routes. Pipeline operators are
required to notify landowners near their proposed
or current pipeline routes about their plans, any
changes in operations and any issues that may
come up while the l ine is in operation, but for
Jennifer the work is more than that – it ’s about
the people she meets along the way.
A typical day for Jennifer might have her talking
to local public off icials or attending meetings of
the local Rotary or Lions Club. She says, “We want
the communities to know that we’re there, our
employees are there, and we want to be able to
support the communities that are supporting us.”
Operators also often work with local nonprofits to
invest in and support the communities where they
operate. For Enbridge, that means grants for their
‘Safe Communities’ program which specif ical ly
supports emergency responders or investing in the
local food bank and workforce development. For
one community in Michigan, Enbridge was able to
identify a local need and secure a grant to meet
that need because of the relationships they built
within the community. “[They were] so excited
to be having the construction crews coming into
town - they put bags together for the workers
that had coupons and flyers for al l of the local
businesses, and held their big summer fair r ight
downtown [with] a ‘Welcome Pipeliners’ tent.”
JENNIFER Smith

16.
P I P E L I N E S A F E T Y E X C E L L E N C E P E R F O R M A N C E R E P O R T
2 0 1 9 A N N U A L L I Q U I D S P I P E L I N E R E P O R T
Z E R O I N C I D E N T S – Only with a goal of zero
safety incidents can accidents be minimized.
O R G A N I Z A T I O N - W I D E C O M M I T M E N T – Safety is emphasized at every level of the
organization from employees who accept personal
responsibi l ity for safety to managers who are vital
to reinforcing a safety culture.
A C U L T U R E O F S A F E T Y – A workplace culture
where safety is an enduring value that al l
employees share.
C O N T I N U O U S I M P R O V E M E N T – Pipeline
operators believe that no matter how safe they
already are, they can always improve safety.
L E A R N F R O M E X P E R I E N C E – Pipeline operators
learn how they can improve safety from their own
experiences and from other pipeline operators.
S Y S T E M S F O R S U C C E S S – Safety management
systems bring a consistent, holistic structure to
safety management, helping to improve safety
performance.
E M P L O Y T E C H N O L O G Y – From “smart pigs”
to innovative ways to interpret integrity data,
operators constantly develop new ways to advance
pipeline safety.
C O M M U N I C A T E W I T H S T A K E H O L D E R S – Operators know communicating and establishing a
positive relationship with the public and stakeholders
who value safety is vital to improving safety.
A STRATEGIC PLAN TO IMPROVE PIPELINE SAFETYThe pipeline industry’s commitment to long-term safety includes the following shared principles:

P I P E L I N E S A F E T Y E X C E L L E N C E P E R F O R M A N C E R E P O R T
.172 0 1 9 A N N U A L L I Q U I D S P I P E L I N E R E P O R T
GOALS
43E N H A N C E E M E R G E N C Y R E S P O N S E P R E P A R E D N E S S
Increase effective and rapid emergency
response efforts through the development
and adoption of industry guidance
on emergency planning and response
processes. Promote peer to peer
opportunities for conducting dri l ls ,
exercising emergency response plans, and
sharing of lessons learned from incidents.
P R O M O T E O R G A N I Z A T I O N A L E X C E L L E N C E
Develop and promote an industry-wide
safety culture through continuous improvement
mechanisms, such as Pipeline SMS, Construction
Quality Management Systems (QMS) and Pipeline
Integrity Management (IM). Transform industry-
wide sharing into a robust, sustainable program,
and emphasize the benefits and power of data
integration.
I N C R E A S E S T A K E H O L D E R A W A R E N E S S & I N V O L V E M E N T
Improve pipeline operator and
landowner relations through the
adoption and implementation of
an industry-wide training program.
Advance public knowledge and
engagement on the pipeline industry
with a robust social media campaign
plan focused on damage prevention,
integrity management and emergency
preparedness. Strive to el iminate f irst ,
second and third-party damage.
I M P R O V E S A F E T Y T H R O U G H T E C H N O L O G Y A N D I N N O V A T I O N
Drive industry-wide engagement in
advancing in-l ine inspection (ILI)
capabil it ies to achieve the pipeline
industry’s goal of zero incidents.
Accelerate the development and adoption
of the most effective ILI tools. Create
sustainable, workable frameworks for
operator leak detection management.

18.
P I P E L I N E S A F E T Y E X C E L L E N C E P E R F O R M A N C E R E P O R T
2 0 1 9 A N N U A L L I Q U I D S P I P E L I N E R E P O R T
S T R A T E G I C I N I T I A T I V E : P I P E L I N E S A F E T Y M A N A G E M E N T S Y S T E M S
In 2018, the Pipeline Safety Management System
(SMS) Team continued the development of its One
Industry, One Goal with gas and liquids operators
working together to advance SMS. The team moved
forward in 2018 with the theme of “Making it Real.”
Efforts were focused around providing tangible
examples and guidance around implementation of
Pipeline SMS. The team rolled out and presented
multiple webinars on Pipeline SMS and industry
tools, most notably the Evaluation Tool to help
operators gauge how effective their Pipeline SMS
are in advancing safety. The pipelinesms.org website
was revamped to make tools and content easier for
operators to find. Videos highlighting the importance
of SMS were made and published online to help other
operators see the benefits of Pipeline SMS. In an
effort to continue to communicate the importance
of SMS and industry progress in implementation, the
Team made multiple presentations to a variety of
key stakeholders throughout the year. Lastly, API has
developed the framework for a third-party assessment
program, including timelines, inspector qualifications
and training materials, and will conduct a pilot
assessment with a major liquid pipeline operator
in the first quarter of 2019.
S T R A T E G I C I N I T I A T I V E : C O N S T R U C T I O N Q U A L I T Y M A N A G E M E N T S Y S T E M S
With the 2017 publication of API Recommended
Practice (RP) 1177, Steel Pipeline Construction Quality
Management Systems (C-QMS), 2018 provided the C-QMS
Team an important opportunity to advocate and educate
on a leading industry practice enhancing safety during
pipeline construction activities. Specifically, the C-QMS
Team provided important tools on key elements of the RP
through webinars, conferences and introduction to latest
resources through a revamped C-QMS website. Pipeline
operators also expanded the discussion to contractors
who play a critical role in construction quality. Moving
into 2019, the C-QMS Team will continue to strongly
encourage API RP 1177 implementation while closely
monitoring API RP 1169, Basic Inspection Requirements-
New Pipeline Construction to ensure alignment.
S T R A T E G I C I N I T I A T I V E : P I P E L I N E I N T E G R I T Y M A N A G E M E N T
Through effective integrity management programs to
inspect and maintain their pipeline systems, pipeline
operators can significantly reduce adverse effects on
the public, employees, and the environment. The goal
is an error-free, spill-free, and incident-free operation
of the pipeline. In 2019, API published the third
edition of API RP 1160, Managing System Integrity
for Hazardous Liquid Pipelines. This recommended
practice provides a process that an operator can
use to assess risks and make day-to-day decisions
regarding the operation of a hazardous liquid pipeline.
The third edition incorporates new learnings and
experience into pipeline mechanics, while referencing
the overarching “plan-do-check-act” cycle of pipeline
safety management systems (API RP 1173). The
document also contains references to leading industry
publications, such as pipeline leak detection (API RP
1175), assessment and management of cracking in
pipelines (API RP 1176), integrity data management
and integration (API RP 1178), and hydrotechnical
hazards for pipelines located onshore or within
coastal areas (API RP 1133). The pipeline industry
continues to support industry-wide understanding and
implementation of these recommended practices.
Promote Organizational Excellence 1G O A L
Objective 1.1 Expand Safety Management Practices

P I P E L I N E S A F E T Y E X C E L L E N C E P E R F O R M A N C E R E P O R T
.192 0 1 9 A N N U A L L I Q U I D S P I P E L I N E R E P O R T
S T R A T E G I C I N I T I A T I V E : S H A R I N G & L E A R N I N G
The pipeline industry has a long history of sharing
safety lessons and learning from best practices,
incidents, near misses and close calls. In 2018,
API and AOPL promoted and supported industry
sharing opportunities through quarterly virtual
tai lgate meetings, the annual Pipeline Information
eXchange (PIX) and safety culture sharings during
industry-wide safety team meetings. This past
year, API and AOPL also established a Sharing and
Learning Subteam to formalize sharing processes
and promote opportunities for information
exchange to improve pipeline safety performance.
The group is developing a guide to help operators
weigh the risks and benefits of sharing. The guide
will include suggested workflows and sample
templates to address the challenges operators face
when sharing safety information. In 2019, the group
will roll out the completed Sharing and Learning
Guide to the industry.
S T R A T E G I C I N I T I A T I V E : D A T A I N T E G R A T I O N
Recognizing the importance of data integration
across a broad spectrum of pipeline safety
initiatives, there was a concerted effort in 2018
to advance aspects of Bulletin 1178, Integrity Data
Management and Integration Guideline concepts
into other key API documents in development,
specifically RP 1160, Managing System Integrity
for Hazardous Liquid Pipelines, Standard 1163,
In-line Inspection System Qualifications and
RP 1183, Dent Fatigue and Mechanical Damage
Integrity Management.
In al l three of these recommended practices,
the leveraging of data integration processes
is crit ical in supporting pipeline operators in
the assessment of anomalies through risk-based
engineering assessments. The value of data
integration and newly released bulletin was shared
through several important learning opportunities,
API Pipeline Integrity Workshop (PIW), PIX and
the API Pipeline Conference.
Promote Organizational Excellence
Objective 1.2 Promote Best Sharing Practices
Promote Organizational Excellence
Objective 1.3 Improve Pipeline Integrity Through Technical Data Analysis

20.
P I P E L I N E S A F E T Y E X C E L L E N C E P E R F O R M A N C E R E P O R T
2 0 1 9 A N N U A L L I Q U I D S P I P E L I N E R E P O R T
S T R A T E G I C I N I T I A T I V E : C O N T I N U O U S I M P R O V E M E N T O F I L I C A P A B I L I T I E S
In 2018, pipeline operators made important strides
to advance pipeline inspection technologies that
f ind and fix issues before they become a safety
problem. The ult imate objective of the pipeline
industry’s research and development program is to
properly identify and mitigate the emerging risks
associated with the transportation of hazardous
materials and better understand the factors
contributing to these risks. Industry is currently
developing a protocol to validate and test the
performance specifications published for ultrasonic
crack detection, electromagnetic acoustic
transmission, and spiral and circumferential magnetic
flux leakage in-line inspection (ILI) tools. The
project will ultimately enhance the current industry
specifications and improve ILI crack tool capabilities.
Improve Safety through Technology and Innovation
S T R A T E G I C I N I T I A T I V E : L E A K D E T E C T I O N A N D R E S P O N S E M A N A G E M E N T
Entering the third year since publication of API RP
1175, Pipeline Leak Detection – Program Management,
the focus in 2018 continued to be driving
implementation by our liquids pipeline operators.
For the RP 1175 Implementation Team, that meant
putting critical tools in the hands of our operators
and providing the resources and training necessary
to continue to increase awareness and understanding
of the importance of a holistic approach to pipeline
leak detection.
Specifically, API created an online e-training tool
which provides foundational elements and key
aspects of the RP an operator needs to know to
begin the implementation journey. With a strong
appetite for information, API witnessed a significant
increase in the number of API and AOPL members
accessing relevant roadmaps, guidance and
resources through a dedicated leak detection site
including the use of a gap assessment tool. In 2018,
84% of liquids barrel miles representing 42% of API
and AOPL members utilized the gap assessment tool.
Improve Safety through Technology and Innovation 2G O A L
Objective 2.1 Improve Pipeline Integrity Inspection Technology
Objective 2.2 Enhance Incident Identification and Response
P I P E L I N E S A F E T Y E X C E L L E N C E P E R F O R M A N C E R E P O R T
.212 0 1 9 A N N U A L L I Q U I D S P I P E L I N E R E P O R T
Enhance Emergency Response Preparedness
S T R A T E G I C I N I T I A T I V E : P I P E L I N E E M E R G E N C Y P L A N N I N G , P R E P A R E D N E S S A N D R E S P O N S E
The Pipeline Emergency Response Work Group
(ERWG) made a concerted effort in 2018 to
ensure that RP 1174, Onshore Hazardous Liquid
Pipeline Emergency Preparedness and Response,
is pushed to all operators. The ERWG produced
and published an introductory presentation,
Q&A documents, and a planning guide for
implementation of RP 1174. The ERWG also hosted
a tailgate call providing education on what RP 1174
is and the importance of companies committing
to this RP. Continued effort promoting effective
emergency response programs was made by
member companies at conferences and by PHMSA
regulators at trade conferences, resulting in
operators who move 59% of barrels in the U.S.
being committed to implementation of this RP.
In 2018, ERWG members util ized the tools and
completed gap analyses on their individual
management systems to the RP, and these analyses
were reviewed as a group to gauge each operators’
conformance baseline. The average conformance
baseline to the RP is 93%, showing companies
have been dil igent in their implementation of ER
management systems. The tools created for RP
1174 will help operators continuously improve
ER management systems, in coordination and
conjunction with RP 1173, Pipeline SMS.
G O A L3Objective 3.1 Boost Operator & First Responder Planning, Preparedness & Response Capabilities

22.
P I P E L I N E S A F E T Y E X C E L L E N C E P E R F O R M A N C E R E P O R T
2 0 1 9 A N N U A L L I Q U I D S P I P E L I N E R E P O R T
S T R A T E G I C I N I T I A T I V E : S T A K E H O L D E R E N G A G E M E N T
Engaging the public is a critical obligation
of the pipeline industry. The annual Pipeline
Safety Excellence Performance Report presents
the industry’s safety record and steps pipeline
operators are taking to improve safety. In 2018,
the pipeline industry actively communicated the
benefits of pipelines, what we are doing to keep
pipelines safe, and the steps we are taking to be
good neighbors in the community. In 2019, the
pipeline industry will develop new multimedia
content, share information through social, print and
electronic media, and engage communities and
policymakers through events, forums and hearings.
In 2018, API continued the development of RP 1162,
3rd Ed., Public Awareness Programs for Pipeline
Operators. In addition to operators, the task group
is comprised of representatives from PHMSA
and NAPSR, representatives of key stakeholders
(emergency responders, agricultural community,
excavators), industry consultants, public awareness
vendors, and industry association staff. The task
group is focused on improving how operators
communicate and engage with those who live,
work or dig near pipelines on topics such as
pipeline locations, risks and hazards, damage
prevention and emergency response.
Increase Stakeholder Awareness & Involvement 4G O A L
Objective 4.1 Improve Stakeholder Communication on Energy Infrastructure and Pipeline Safety
Increase Stakeholder Awareness & Involvement
S T R A T E G I C I N I T I A T I V E : E X C A V A T I O N D A M A G E
Pipeline operators work every day to prevent
damage to their underground pipelines and
even more importantly to protect the safety
of the communities where they operate. Most
unintentional pipeline strikes can be prevented.
One tool operators have worked on this year is the
industry Damage Prevention Tool Box with shared
practices and lessons learned from operators to
avoid damage to their pipelines. In 2018, the API/
AOPL Damage Prevention Team collected data
from operators to determine causes of operators’
near misses from first, second, and third parties
during the past two years. The survey found 92%
of reported near misses (815 out of 883 total) were
from third parties, with 73% (591) of those due to
no “one call” being placed. All first and second
near misses reported were due to not following the
job excavation plan provided. The team also began
reviewing PHMSA reportable incidents involving
first and second party damages and determined
that the leading causes were insufficient excavation
practices and insufficient l ine locating. The team is
currently planning a 2019 Damage Prevention and
Public Awareness Workshop and plans to have some
sessions addressing these leading causes.
Objective 4.2 Promote Innovative Approaches to Enhancing Damage Prevention

P I P E L I N E S A F E T Y E X C E L L E N C E P E R F O R M A N C E R E P O R T
.232 0 1 9 A N N U A L L I Q U I D S P I P E L I N E R E P O R T

24.
P I P E L I N E S A F E T Y E X C E L L E N C E P E R F O R M A N C E R E P O R T
2 0 1 9 A N N U A L L I Q U I D S P I P E L I N E R E P O R T
2018 PERFORMANCEREPORTMeasuring Pipeline Safety Performance

P I P E L I N E S A F E T Y E X C E L L E N C E P E R F O R M A N C E R E P O R T
.252 0 1 9 A N N U A L L I Q U I D S P I P E L I N E R E P O R T
K E Y P E R F O R M A N C E I N D I C A T O R S
Measuring the performance of pipelines is a key way to determine how safe they are
and whether their safety is improving. Pipeline operators and PHMSA collect hundreds
of different data points measuring how safely pipelines are operating and the reasons
behind pipeline incidents when they occur.
Particularly useful measures of pipeline safety examine incident size, location,
commodity and cause. The l iquids pipeline industry uses each one of the fol lowing
measures to better understand pipeline incident trends and develop strategies for
improving pipeline safety. As a sign of overal l pipeline safety performance, the l iquids
pipeline industry tracks a core set of Key Performance Indicators (KPIs). These KPIs
are based primari ly on incidents impacting people or the environment. They were
created through a recommendation of the U.S. National Transportation Safety Board
in a collaborative effort between PHMSA, pipeline operators and public pipeline safety
advocates represented by the Pipeline Safety Trust. They reflect the highest priority
we place on protecting people and the environment. This year, the pipeline industry
continued to demonstrate its commitment to safety, with incidents impacting people
or the environment down 20% over the last f ive years, al l while pipeline mileage has
increased 12% in that t ime.
The four industry-wide KPIs are:
1) Total Incidents Impacting People or the Environment
2) Integrity Management Incidents Impacting People or the Environment
3) Operations & Maintenance (O&M) Incidents Impacting People or the Environment
4) Participation in Pipeline Safety Management System (PSMS) Programs
Integrity management incidents are those of the pipeline itself, such as corrosion,
cracking or weld failure. Operations and maintenance causes include equipment fai lure or
incorrect operations.
.252 0 1 9 A N N U A L L I Q U I D S P I P E L I N E R E P O R T

26.
P I P E L I N E S A F E T Y E X C E L L E N C E P E R F O R M A N C E R E P O R T
2 0 1 9 A N N U A L L I Q U I D S P I P E L I N E R E P O R T
# 1 : T O T A L I N C I D E N T S & I N C I D E N T S I M P A C T I N G P E O P L E O R T H E E N V I R O N M E N T ( 2 0 1 4 - 2 0 1 8 )
Pipeline incidents impacting people or
the environment decreased 20% over the
last 5 years. Total pipeline incidents were
down as well, dropping 11% over 5 years
with 51 fewer incidents in 2018 compared
to 2014. A full description of the specific
types of incidents impacting people or the
environment can be found on page 44.
# 2 : I N T E G R I T Y M A N A G E M E N T I N C I D E N T S I M P A C T I N G P E O P L E O R T H E E N V I R O N M E N T ( 2 0 1 4 - 2 0 1 8 )
Incidents related to the pipeline itself,
such as corrosion, cracking or weld
fai lure, were down 35% over the last 5
years in areas impacting people or the
environment. In these areas, incidents
caused by incorrect operation decreased
by 38% while equipment fai lure increased
20% from 2014 to 2018.
Key Performance Indicators
0
100
200
300
400
500
TOTAL INCIDENTS TOTAL IPE INCIDENTS
20182017201620152014
113 112 104 88 90
455 460420 415 404
20182017201620152014
0
10
20
30
40
50
60
70
80
MATERIAL FAILURE OF PIPE/WELD
PREVIOUS EXCAVATION DAMAGE
PREVIOUS OUTSIDE FORCE DAMAGE
CORROSION FAILURE
02
0
21
1 00
0
111 10
17
8
14
39 42
27 27
17
P I P E L I N E S A F E T Y E X C E L L E N C E P E R F O R M A N C E R E P O R T
.272 0 1 9 A N N U A L L I Q U I D S P I P E L I N E R E P O R T
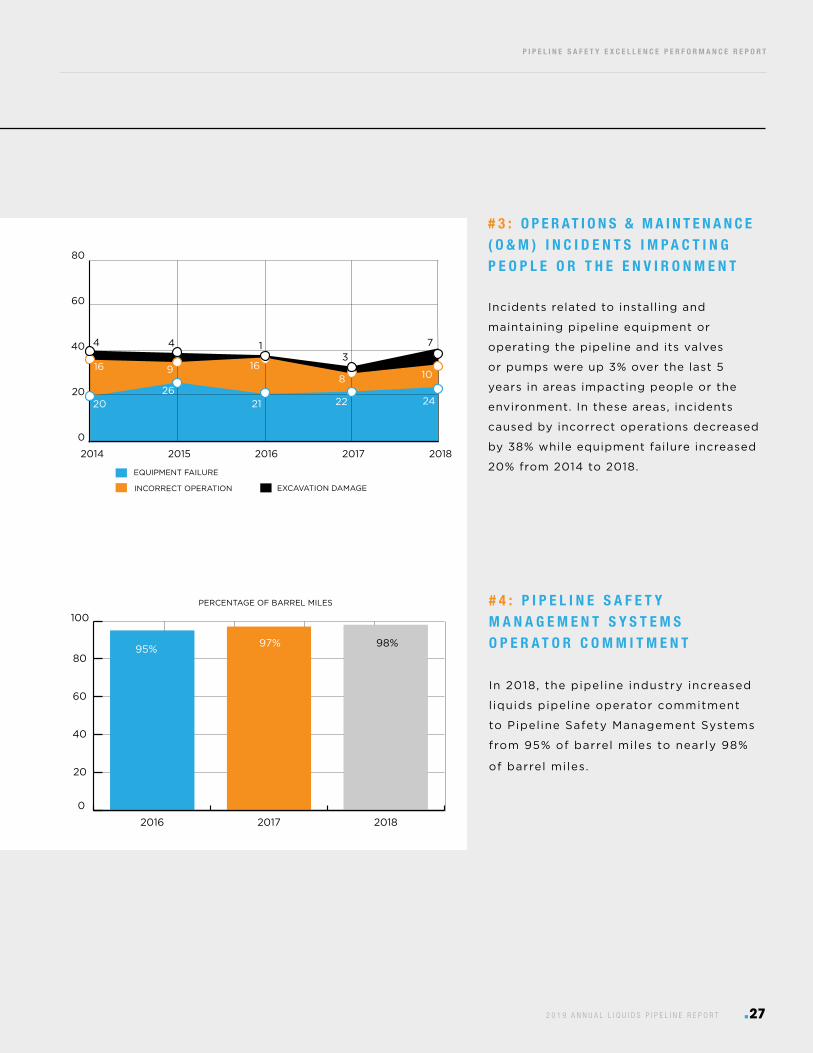
# 4 : P I P E L I N E S A F E T Y M A N A G E M E N T S Y S T E M S O P E R A T O R C O M M I T M E N T
In 2018, the pipeline industry increased
l iquids pipeline operator commitment
to Pipeline Safety Management Systems
from 95% of barrel miles to nearly 98%
of barrel miles.
# 3 : O P E R AT I O N S & M A I N T E N A N C E ( O & M ) I N C I D E N T S I M P A C T I N G P E O P L E O R T H E E N V I R O N M E N T
Incidents related to installing and
maintaining pipeline equipment or
operating the pipeline and its valves
or pumps were up 3% over the last 5
years in areas impacting people or the
environment. In these areas, incidents
caused by incorrect operations decreased
by 38% while equipment failure increased
20% from 2014 to 2018.
Key Performance Indicators
EQUIPMENT FAILURE
EXCAVATION DAMAGEINCORRECT OPERATION
4 4 13
7
0
20
40
60
80
20182017201620152014
2026
21 22 24
8 1016916
0
20
40
60
80
100PERCENTAGE OF BARREL MILES
201820172016
95% 97% 98%
28.
P I P E L I N E S A F E T Y E X C E L L E N C E P E R F O R M A N C E R E P O R T
2 0 1 9 A N N U A L L I Q U I D S P I P E L I N E R E P O R T
Incidents by Location
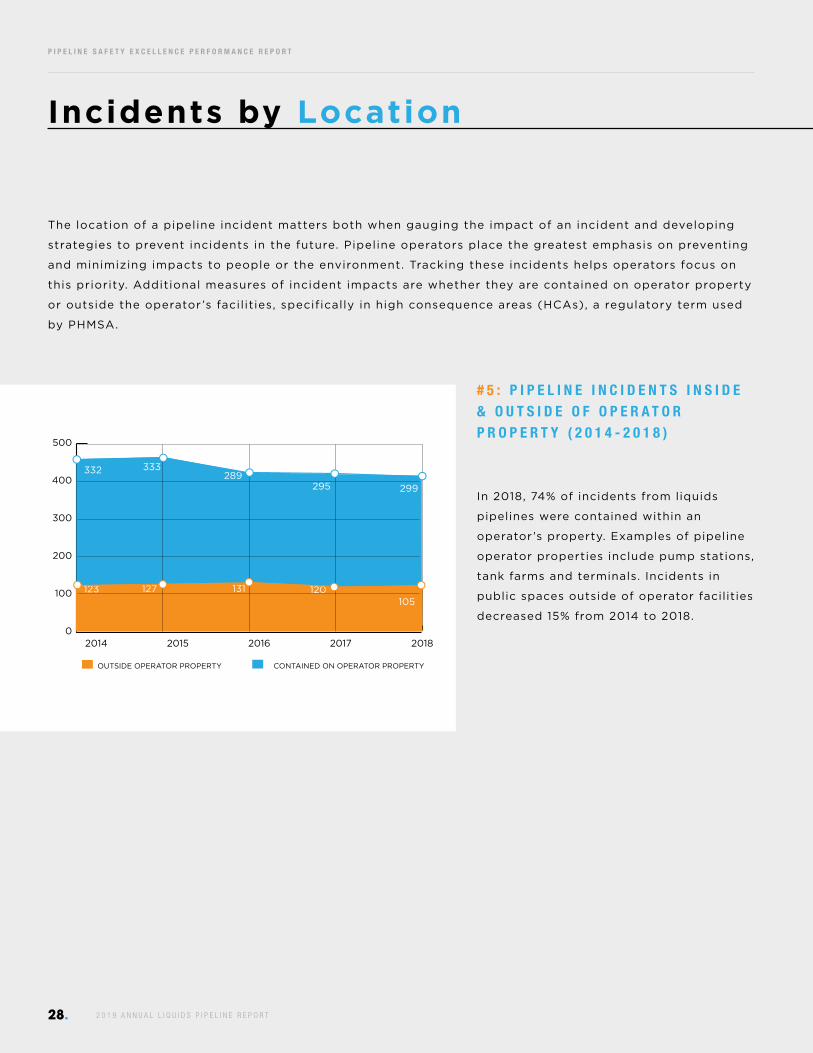
# 5 : P I P E L I N E I N C I D E N T S I N S I D E & O U T S I D E O F O P E R A T O R P R O P E R T Y ( 2 0 1 4 - 2 0 1 8 )
In 2018, 74% of incidents from liquids
pipelines were contained within an
operator ’s property. Examples of pipeline
operator properties include pump stations,
tank farms and terminals. Incidents in
public spaces outside of operator facilities
decreased 15% from 2014 to 2018.
The location of a pipeline incident matters both when gauging the impact of an incident and developing
strategies to prevent incidents in the future. Pipeline operators place the greatest emphasis on preventing
and minimizing impacts to people or the environment. Tracking these incidents helps operators focus on
this priority. Additional measures of incident impacts are whether they are contained on operator property
or outside the operator ’s facil ities, specifically in high consequence areas (HCAs), a regulatory term used
by PHMSA.
0
100
200
300
400
500
20182017201620152014
CONTAINED ON OPERATOR PROPERTYOUTSIDE OPERATOR PROPERTY
123 127 131 120105
332 333289
295 299
P I P E L I N E S A F E T Y E X C E L L E N C E P E R F O R M A N C E R E P O R T
.292 0 1 9 A N N U A L L I Q U I D S P I P E L I N E R E P O R T
Incidents by Location
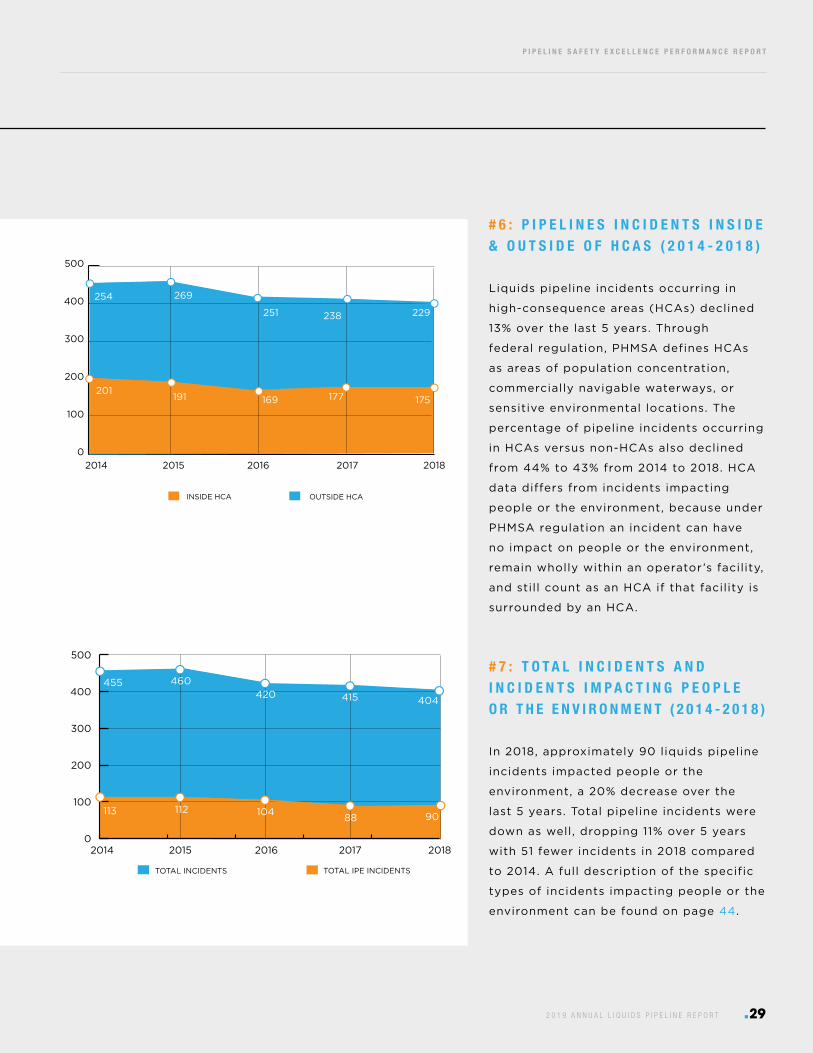
# 6 : P I P E L I N E S I N C I D E N T S I N S I D E & O U T S I D E O F H C A S ( 2 0 1 4 - 2 0 1 8 ) Liquids pipeline incidents occurring in
high-consequence areas (HCAs) declined
13% over the last 5 years. Through
federal regulation, PHMSA defines HCAs
as areas of population concentration,
commercially navigable waterways, or
sensitive environmental locations. The
percentage of pipeline incidents occurring
in HCAs versus non-HCAs also declined
from 44% to 43% from 2014 to 2018. HCA
data differs from incidents impacting
people or the environment, because under
PHMSA regulation an incident can have
no impact on people or the environment,
remain wholly within an operator ’s facility,
and still count as an HCA if that facility is
surrounded by an HCA.
# 7 : T O T A L I N C I D E N T S A N D I N C I D E N T S I M P A C T I N G P E O P L E O R T H E E N V I R O N M E N T ( 2 0 1 4 - 2 0 1 8 )
In 2018, approximately 90 liquids pipeline
incidents impacted people or the
environment, a 20% decrease over the
last 5 years. Total pipeline incidents were
down as well, dropping 11% over 5 years
with 51 fewer incidents in 2018 compared
to 2014. A full description of the specific
types of incidents impacting people or the
environment can be found on page 44.
OUTSIDE HCAINSIDE HCA
0
100
200
300
400
500
20182017201620152014
201191 169 177 175
254 269
238251 229
0
100
200
300
400
500
TOTAL INCIDENTS TOTAL IPE INCIDENTS
20182017201620152014
113 112 104 88 90
455 460420 415 404

30.
P I P E L I N E S A F E T Y E X C E L L E N C E P E R F O R M A N C E R E P O R T
2 0 1 9 A N N U A L L I Q U I D S P I P E L I N E R E P O R T
# 8 : L I Q U I D P I P E L I N E I N C I D E N T S B Y S I Z E ( 2 0 1 4 - 2 0 1 8 )
Most p ipel ine inc idents are smal l in
s ize. In 2018, 65% of inc idents were less
than 5 barre ls and 83% were less than
50 barre ls . Large pipel ine inc idents
are a lso the rarest . In 2018, only 6% of
inc idents were 500 barre ls or larger.
Incidents by Size
# 9 : I N C I D E N T S I M P A C T I N G P E O P L E O R T H E E N V I R O N M E N T B Y S I Z E ( 2 0 1 4 - 2 0 1 8 )
Most incidents impacting people or the
environment are small in size. In 2018,
approximately 56% of such incidents were
less than 50 barrels, with only 20% of
incidents 500 barrels or larger.
20182017201620152014
0
100
200
300
400
500
2426
18
19 2647
40
52
58 43
260296 302
252 261
>500 BBLS>50 AND ≤500 BBLS
>5 AND ≤50 BBLS≤5 BBLS
84 74
8382
93
0
100
200
20182017201620152014
>500 BBLS>50 AND ≤500 BBLS
>5 AND ≤50 BBLS≤5 BBLS
52 4939
14
1125
810
1927
18
31
22
24
30
20
2224
3032

P I P E L I N E S A F E T Y E X C E L L E N C E P E R F O R M A N C E R E P O R T
.312 0 1 9 A N N U A L L I Q U I D S P I P E L I N E R E P O R T
# 1 0 : C R U D E O I L I N C I D E N T S B Y S I Z E ( 2 0 1 4 - 2 0 1 8 ) Similar to total incident trends, the
majority of crude oil pipeline incidents
are small in size. In 2018, 67% of crude
oil incidents were 5 barrels or smaller
and 86% of crude oil incidents were
smaller than 50 barrels. Over the last
5 years, only 5% of crude oil incidents
were over 500 barrels.
Crude oil incidents greater than 50
barrels have decreased 18%, from 38 to
31 incidents, even as pipeline mileage and
barrels delivered have both increased
more than 10% in the last five years.
Incidents by Size
>500 BBLS>50 AND ≤500 BBLS
>5 AND ≤50 BBLS≤5 BBLS
201820172016201520140
100
200
300
149
54
31
711
8 13 12
164
51
31
120
41
120
46147
4319
35 29

32.
P I P E L I N E S A F E T Y E X C E L L E N C E P E R F O R M A N C E R E P O R T
2 0 1 9 A N N U A L L I Q U I D S P I P E L I N E R E P O R T
# 1 1 : A L L I N C I D E N T S B Y C O M M O D I T Y ( 2 0 1 4 - 2 0 1 8 ) In 2018, crude oil incidents represented
55% of total incidents, with refined
products at 27% and natural gas l iquids
at 17% of total incidents. The number of
annual crude oil incidents are down 14%
from their peak in 2015 and down 8%
from 2014.
# 1 2 : I N C I D E N T S I M P A C T I N G P E O P L E O R T H E E N V I R O N M E N T B Y C O M M O D I T Y ( 2 0 1 8 ) In 2018, there were 56 crude oil and 34
refined products incidents impacting
people or the environment. # 1 3 : P E R C E N T A G E O F B A R R E L S R E L E A S E D I M P A C T I N G P E O P L E O R T H E E N V I R O N M E N T B Y C O M M O D I T Y ( 2 0 1 8 )
Crude oil incidents impacting the people
or the environment in 2018 represented
53% of the total, with refined products
representing 47% of total incidents
impacting people or the environment.
The percentage of crude oil barrels released
out of all incidents impacting people or the
environment is up 11% from 2014, while the
percentage of refined products is down 11%.
Incidents by Commodity
0
100
200
300
400
500
20182017201620152014
NATURAL GAS LIQUIDS
REFINED PRODUCTS
CRUDE OIL
0 20 40 60 80 100
201856/62% 34/38%
2018
YE
AR
REFINED PRODUCTSCRUDE OIL
2018
YE
AR
0 5,000 10,000 15,000 20,000 25,000 30,000 35,000 40,000 45,000 50,000
REFINED PRODUCTSCRUDE OIL
21,856/53% 19,617/47%

P I P E L I N E S A F E T Y E X C E L L E N C E P E R F O R M A N C E R E P O R T
.332 0 1 9 A N N U A L L I Q U I D S P I P E L I N E R E P O R T

34.
P I P E L I N E S A F E T Y E X C E L L E N C E P E R F O R M A N C E R E P O R T
2 0 1 9 A N N U A L L I Q U I D S P I P E L I N E R E P O R T
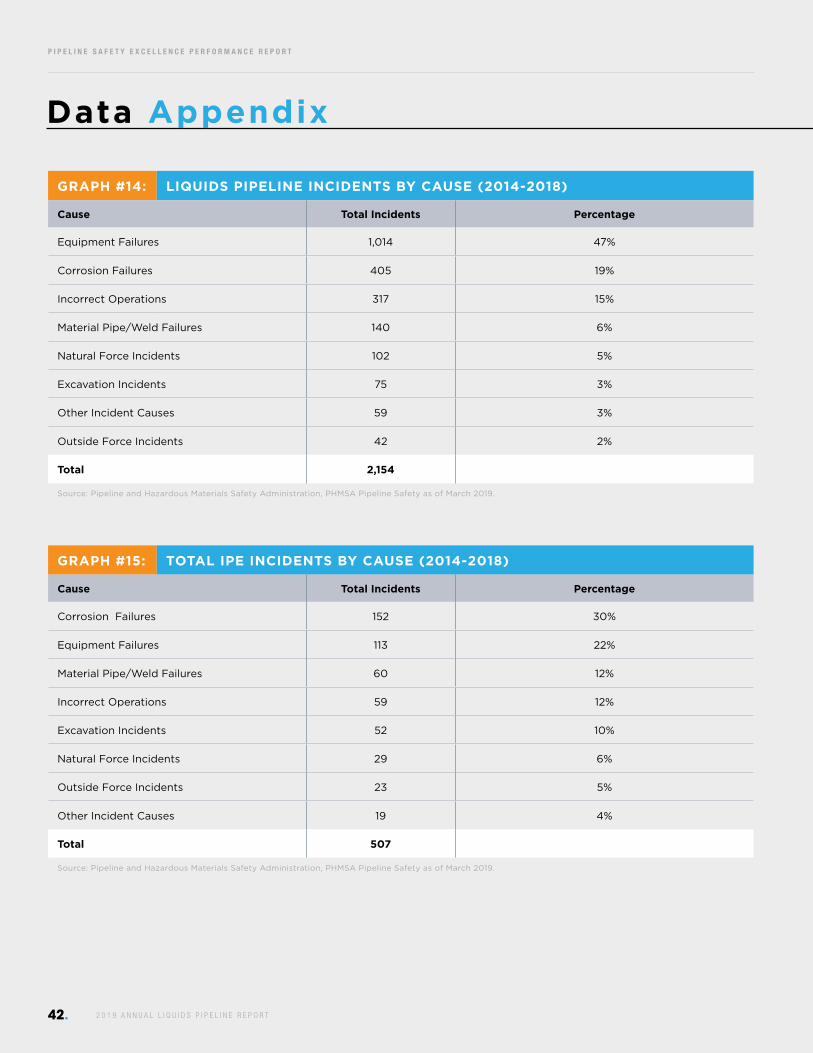
# 1 4 : L I Q U I D P I P E L I N E I N C I D E N T S B Y C A U S E ( 2 0 1 4 - 2 0 1 8 ) Equipment failure is the most frequent
cause of liquids pipeline incidents.
Over the last 5 years, equipment failure
represented 47% of incidents, corrosion
failure 19% and incorrect operation 15%
of incidents. Material pipe/weld failures,
which include cracking, a primary source
of large volume releases, represented only
6% of incidents over the last 5 years.
Incidents by Cause
0 10 20 30 40 50
Outside Force Incidents
Other Incident Causes
Excavation Incidents
Natural Force Incidents
Material Pipe/Weld Failures
Incorrect Operations
Corrosion Failures
Equipment Failures 47%
19%
15%
6%
5%
3%
3%
2%

P I P E L I N E S A F E T Y E X C E L L E N C E P E R F O R M A N C E R E P O R T
.352 0 1 9 A N N U A L L I Q U I D S P I P E L I N E R E P O R T
# 1 5 : P E R C E N T A G E O F I N C I D E N T S I M P A C T I N G P E O P L E O R T H E E N V I R O N M E N T B Y C A U S E ( 2 0 1 4 - 2 0 1 8 )
Over the last 5 years, corrosion
(30%) was the most frequent cause
of incidents impacting people
or the environment, followed by
equipment failure (22%), material
pipe/weld failures (12%), incorrect
operations (12%) and excavation
incidents (10%).
# 1 6 : P E R C E N T A G E O F B A R R E L S R E L E A S E D I M P A C T I N G P E O P L E O R T H E E N V I R O N M E N T B Y C A U S E ( 2 0 1 4 - 2 0 1 8 ) Corrosion (25%) was responsible
for the most barrels released
in incidents impacting people
or the environment, fol lowed
by excavation incidents (18%),
natural force incidents, such
as f looding, earthquakes and
l ightning (16%), and material
pipe/weld fai lures (15%).
Equipment fai lure, the most
frequent cause of al l incidents,
was the cause of only 4% of
barrels released, reflecting the
reduced proportion of operator
property incidents impacting
the people or the environment
and the smaller average size of
equipment fai lure incidents.
Incidents by Cause
0 5 10 15 20 25 30
Other Incident Causes
Outside Force Incidents
Natural Force Incidents
Excavation Incidents
Incorrect Operations
Material Pipe/Weld Failures
Equipment Failures
Corrosion Failures 30%
22%
12%
12%
10%
6%
5%
4%
0 5 10 15 20 25
Outside Force Incidents
Equipment Failures
Other Incident Causes
Incorrect Operations
Material Pipe/Weld Failures
Natural Force Incidents
Excavation Incidents
Corrosion Failures 25%
18%
16%
15%
8%
10%
4%
4%

36.
P I P E L I N E S A F E T Y E X C E L L E N C E P E R F O R M A N C E R E P O R T
2 0 1 9 A N N U A L L I Q U I D S P I P E L I N E R E P O R T
# 1 7 : M I L E S O F U . S . L I Q U I D S P I P E L I N E S B Y P R O D U C T S ( 2 0 1 3 - 2 0 1 7 ) (Thousands)
At the end of 2017 (the most recent year
this data is available), there were 215,736
total miles of liquids pipelines, with crude
oil pipelines representing 37% of the total
at 79,192 miles. Over the last five years,
the total miles of liquids pipelines
in-creased 23,324 miles or 12% and crude
oil pipelines increased 18,105 miles or 30%.
# 1 8 : B A R R E L S D E L I V E R E D B Y U . S . L I Q U I D S P I P E L I N E ( 2 0 1 3 - 2 0 1 7 )(Billions)
In 2017, there were a total of
21,572,198,940 crude oil and refined
products barrels delivered by pipeline,
with crude oil representing approximately
53% of the barrels delivered. Over the last
five years, total liquid barrels delivered
by pipeline have increased 44%, or
6,563,309,091. Crude oil barrels have
increased 37%, or 3,058,440,600 barrels,
while petroleum products have gone up
52%, or 3,504,868,491 barrels, in the last
five years.
Pipeline Miles & Barrels Delivered
0
50
100
150
200
250
300
CO2/ETHANOL
NATURAL GAS LIQUIDS (NGLS)
PETROLEUM PRODUCTS
CRUDE OIL
20172016201520142013
0
5
10
15
20
25
PETROLEUM PRODUCTS
CRUDE OIL
20172016201520142013

P I P E L I N E S A F E T Y E X C E L L E N C E P E R F O R M A N C E R E P O R T
.372 0 1 9 A N N U A L L I Q U I D S P I P E L I N E R E P O R T

38.
P I P E L I N E S A F E T Y E X C E L L E N C E P E R F O R M A N C E R E P O R T
2 0 1 9 A N N U A L L I Q U I D S P I P E L I N E R E P O R T 2 0 1 9 A N N U A L L I Q U I D S P I P E L I N E R E P O R T
Data Appendix GRAPH #1: TOTAL INCIDENTS & INCIDENTS IMPACTING PEOPLE OR THE ENVIRONMENT
(2014-2018)
Year Incidents Impacting People or the Environment Total Incidents
2014 113 455
2015 112 460
2016 104 420
2017 88 415
2018 90 404
% Change from 2014 -20% -11%
Source: Pipeline and Hazardous Materials Safety Administration, PHMSA Pipeline Safety as of March 2019.
GRAPH #2: INTEGRITY MANAGEMENT INCIDENTS IMPACTING PEOPLE OR THE ENVIRONMENT (2014-2018)
Year Corrosion Failure Material Failure of Pipe/Weld
Previous Excavation
DamagePrevious Outside
Force DamageTotal IM IPE
Incidents
2014 39 11 0 1 51
2015 42 10 0 0 52
2016 27 17 2 0 46
2017 27 8 2 0 37
2018 17 14 1 1 33
% Change from 2014 -56% 27% - 0% -35%
Source: Pipeline and Hazardous Materials Safety Administration, PHMSA Pipeline Safety as of March 2019.
GRAPH #3: OPERATIONS & MAINTENACE INCIDENTS IMPACTING PEOPLE OR THE ENVIRONMENT (2014-2018)
Year Equipment Failure Incorrect Operation Excavation Damage Total O&M IPE Incidents
2014 20 16 4 40
2015 26 9 4 39
2016 21 16 1 38
2017 22 8 3 33
2018 24 10 7 41
% Change from 2014 20% -38% 75% 3%
Source: Pipeline and Hazardous Materials Safety Administration, PHMSA Pipeline Safety as of March 2019.

.39
P I P E L I N E S A F E T Y E X C E L L E N C E P E R F O R M A N C E R E P O R T
2 0 1 9 A N N U A L L I Q U I D S P I P E L I N E R E P O R T 2 0 1 9 A N N U A L L I Q U I D S P I P E L I N E R E P O R T
Data Appendix GRAPH #4: BAR CHART FOR 2018 INDICATING OPERATOR COMMITMENT TO PSMS
Year % Commitment
2016 95
2017 97
2018 98
Source: API and AOPL Membership Survey.
GRAPH #5: PIPELINE INCIDENTS INSIDE & OUTSIDE OPERATOR PROPERTY (2014-2018)
Year Outside Operator Facility Contained on Operator Property Total Incidents
2014 123 332 455
2015 127 333 460
2016 131 289 420
2017 120 295 415
2018 105 299 404
% Change from 2014 -15% -10% -11%
Source: Pipeline and Hazardous Materials Safety Administration, PHMSA Pipeline Safety as of March 2019.
GRAPH #6: PIPELINE INCIDENTS IMPACTING HCAs (2014-2018)
Year Outside HCA Inside HCA Total Incidents
2014 254 201 455
2015 269 191 460
2016 251 169 420
2017 238 177 415
2018 229 175 404
% Change from 2014 -10% -13% -11%
Source: Pipeline and Hazardous Materials Safety Administration, PHMSA Pipeline Safety as of March 2019.
GRAPH #7: TOTAL INCIDENTS & INCIDENTS IMPACTING PEOPLE OR THE ENVIRONMENT (2014-2018)
Year Incidents Impacting People or the Environment Total Incidents
2014 113 455
2015 112 460
2016 104 420
2017 88 415
2018 90 404
% Change from 2014 -20% -11%
Source: Pipeline and Hazardous Materials Safety Administration, PHMSA Pipeline Safety as of March 2019.

40.
P I P E L I N E S A F E T Y E X C E L L E N C E P E R F O R M A N C E R E P O R T
2 0 1 9 A N N U A L L I Q U I D S P I P E L I N E R E P O R T 2 0 1 9 A N N U A L L I Q U I D S P I P E L I N E R E P O R T
Data Appendix GRAPH #8: LIQUID PIPELINE INCIDENTS BY SIZE (2014-2018)
Year ≤ 5 Bbls > 5 and ≤ 50 Bbls > 50 and ≤ 500 Bbls > 500 Bbls Total Incidents
2014 296 93 47 19 455
2015 302 83 52 23 460
2016 252 84 58 26 420
2017 248 100 42 25 415
2018 261 74 43 26 404
% Change from 2014 -12% -20% -9% 37% -11%
Source: Pipeline and Hazardous Materials Safety Administration, PHMSA Pipeline Safety as of March 2019.
GRAPH #9: IPE INCIDENTS BY SIZE (2014-2018)
Year ≤ 5 Bbls > 5 and ≤ 50 Bbls > 50 and ≤ 500 Bbls > 500 Bbls Total Incidents
2014 52 32 19 10 113
2015 49 30 25 8 112
2016 39 24 27 14 104
2017 31 24 22 11 88
2018 30 20 22 18 90
% Change from 2014 -42% -38% 16% 80% -20%
Source: Pipeline and Hazardous Materials Safety Administration, PHMSA Pipeline Safety as of March 2019.
GRAPH #10: CRUDE OIL INCIDENTS BY SIZE (2014-2018)
Year ≤ 5 Bbls > 5 and ≤ 50 Bbls > 50 and ≤ 500 Bbls > 500 Bbls Total Incidents
2014 149 54 31 7 241
2015 164 51 31 11 257
2016 120 41 35 8 204
2017 120 46 29 13 208
2018 147 43 19 12 221
% Change from 2014 -1% -20% -39% 71% -8%
Source: Pipeline and Hazardous Materials Safety Administration, PHMSA Pipeline Safety as of March 2019.

.41
P I P E L I N E S A F E T Y E X C E L L E N C E P E R F O R M A N C E R E P O R T
2 0 1 9 A N N U A L L I Q U I D S P I P E L I N E R E P O R T 2 0 1 9 A N N U A L L I Q U I D S P I P E L I N E R E P O R T
Data Appendix GRAPH #11: INCIDENTS BY COMMODITY (2014-2018)
Year Crude Oil Refined Products Highly Volatile Liquids (HVLs) CO2 Biofuel/Ethanol Total
Incidents
2014 241 158 50 5 1 455
2015 257 133 63 7 0 460
2016 204 134 72 9 1 420
2017 208 122 76 9 0 415
2018 221 109 67 5 2 404
% Change from 2014 -8% -31% 34% 0% 100% -11%
Source: Pipeline and Hazardous Materials Safety Administration, PHMSA Pipeline Safety as of March 2019.
GRAPH #12: INCIDENTS IMPACTING PEOPLE OR THE ENVIRONMENT BY COMMODITY (2014-2018)
Year Crude Oil Refined Products
2014 71 42
2015 75 37
2016 69 35
2017 54 34
2018 56 34
% Change from 2014 -21% -19%
Source: Pipeline and Hazardous Materials Safety Administration, PHMSA Pipeline Safety as of March 2019.
GRAPH #13: PERCENTAGE OF IPE BARRELS RELEASED BY COMMODITY (2014-2018)
Year Crude Oil Refined Products
2014 42% 58%
2015 70% 30%
2016 64% 36%
2017 56% 44%
2018 53% 47%
% Change from 2014 11% -11%
Source: Pipeline and Hazardous Materials Safety Administration, PHMSA Pipeline Safety as of March 2019.
42.
P I P E L I N E S A F E T Y E X C E L L E N C E P E R F O R M A N C E R E P O R T
2 0 1 9 A N N U A L L I Q U I D S P I P E L I N E R E P O R T 2 0 1 9 A N N U A L L I Q U I D S P I P E L I N E R E P O R T
Data Appendix
GRAPH #14: LIQUIDS PIPELINE INCIDENTS BY CAUSE (2014-2018)
Cause Total Incidents Percentage
Equipment Failures 1,014 47%
Corrosion Failures 405 19%
Incorrect Operations 317 15%
Material Pipe/Weld Failures 140 6%
Natural Force Incidents 102 5%
Excavation Incidents 75 3%
Other Incident Causes 59 3%
Outside Force Incidents 42 2%
Total 2,154
Source: Pipeline and Hazardous Materials Safety Administration, PHMSA Pipeline Safety as of March 2019.
GRAPH #15: TOTAL IPE INCIDENTS BY CAUSE (2014-2018)
Cause Total Incidents Percentage
Corrosion Failures 152 30%
Equipment Failures 113 22%
Material Pipe/Weld Failures 60 12%
Incorrect Operations 59 12%
Excavation Incidents 52 10%
Natural Force Incidents 29 6%
Outside Force Incidents 23 5%
Other Incident Causes 19 4%
Total 507
Source: Pipeline and Hazardous Materials Safety Administration, PHMSA Pipeline Safety as of March 2019.
.43
P I P E L I N E S A F E T Y E X C E L L E N C E P E R F O R M A N C E R E P O R T
2 0 1 9 A N N U A L L I Q U I D S P I P E L I N E R E P O R T 2 0 1 9 A N N U A L L I Q U I D S P I P E L I N E R E P O R T
Data Appendix
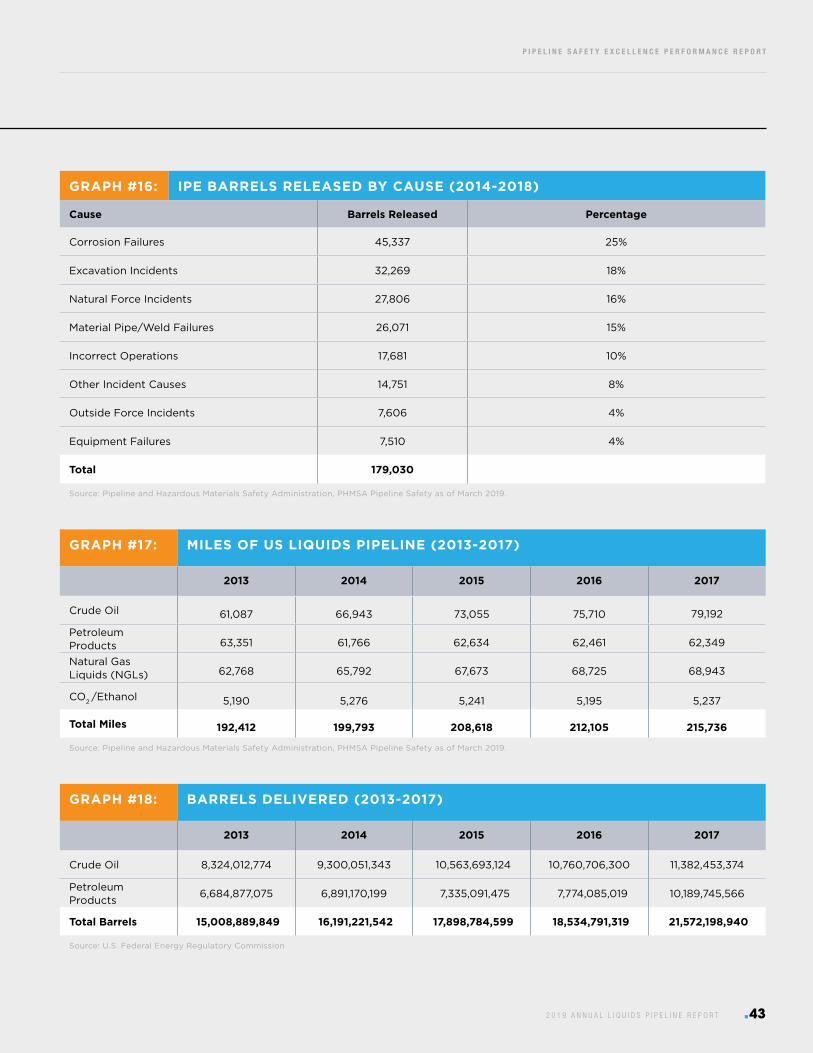
GRAPH #16: IPE BARRELS RELEASED BY CAUSE (2014-2018)
Cause Barrels Released Percentage
Corrosion Failures 45,337 25%
Excavation Incidents 32,269 18%
Natural Force Incidents 27,806 16%
Material Pipe/Weld Failures 26,071 15%
Incorrect Operations 17,681 10%
Other Incident Causes 14,751 8%
Outside Force Incidents 7,606 4%
Equipment Failures 7,510 4%
Total 179,030
Source: Pipeline and Hazardous Materials Safety Administration, PHMSA Pipeline Safety as of March 2019.
GRAPH #17: MILES OF US LIQUIDS PIPELINE (2013-2017)
2013 2014 2015 2016 2017
Crude Oil
61,087
66,943
73,055
75,710
79,192
Petroleum Products
63,351
61,766
62,634
62,461
62,349
Natural Gas Liquids (NGLs)
62,768
65,792
67,673
68,725
68,943
CO2 /Ethanol
5,190
5,276
5,241
5,195
5,237
Total Miles
192,412
199,793
208,618
212,105
215,736
Source: Pipeline and Hazardous Materials Safety Administration, PHMSA Pipeline Safety as of March 2019.
GRAPH #18: BARRELS DELIVERED (2013-2017)
2013 2014 2015 2016 2017
Crude Oil 8,324,012,774 9,300,051,343 10,563,693,124 10,760,706,300 11,382,453,374
Petroleum Products
6,684,877,075 6,891,170,199 7,335,091,475 7,774,085,019 10,189,745,566
Total Barrels 15,008,889,849 16,191,221,542 17,898,784,599 18,534,791,319 21,572,198,940
Source: U.S. Federal Energy Regulatory Commission
44.
P I P E L I N E S A F E T Y E X C E L L E N C E P E R F O R M A N C E R E P O R T
2 0 1 9 A N N U A L L I Q U I D S P I P E L I N E R E P O R T
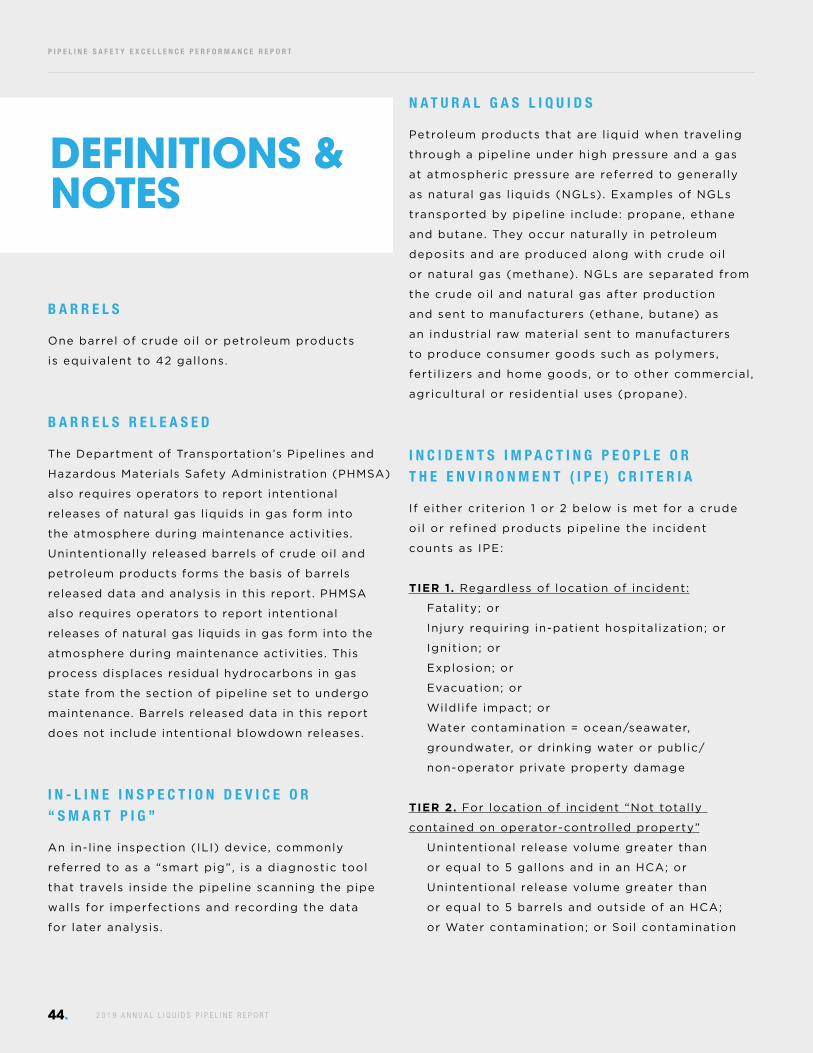
B A R R E L S
One barrel of crude oil or petroleum products
is equivalent to 42 gallons.
B A R R E L S R E L E A S E D
The Department of Transportation’s Pipelines and
Hazardous Materials Safety Administration (PHMSA)
also requires operators to report intentional
releases of natural gas l iquids in gas form into
the atmosphere during maintenance activities.
Unintentionally released barrels of crude oil and
petroleum products forms the basis of barrels
released data and analysis in this report. PHMSA
also requires operators to report intentional
releases of natural gas liquids in gas form into the
atmosphere during maintenance activities. This
process displaces residual hydrocarbons in gas
state from the section of pipeline set to undergo
maintenance. Barrels released data in this report
does not include intentional blowdown releases.
I N - L I N E I N S P E C T I O N D E V I C E O R “ S M A R T P I G ”
An in-l ine inspection (ILI) device, commonly
referred to as a “smart pig”, is a diagnostic tool
that travels inside the pipeline scanning the pipe
walls for imperfections and recording the data
for later analysis.
N A T U R A L G A S L I Q U I D S
Petroleum products that are l iquid when traveling
through a pipeline under high pressure and a gas
at atmospheric pressure are referred to general ly
as natural gas l iquids (NGLs). Examples of NGLs
transported by pipeline include: propane, ethane
and butane. They occur natural ly in petroleum
deposits and are produced along with crude oil
or natural gas (methane). NGLs are separated from
the crude oil and natural gas after production
and sent to manufacturers (ethane, butane) as
an industrial raw material sent to manufacturers
to produce consumer goods such as polymers,
ferti l izers and home goods, or to other commercial ,
agricultural or residential uses (propane).
I N C I D E N T S I M P A C T I N G P E O P L E O R T H E E N V I R O N M E N T ( I P E ) C R I T E R I A
I f e ither cr iter ion 1 or 2 below is met for a crude
oi l or ref ined products pipel ine the incident
counts as IPE:
TIER 1. Regardless of location of incident:
Fatal ity; or
Injury requiring in-patient hospital ization; or
Ignition; or
Explosion; or
Evacuation; or
Wildl ife impact; or
Water contamination = ocean/seawater,
groundwater, or drinking water or public/
non-operator private property damage
TIER 2. For location of incident “Not total ly
contained on operator-controlled property”
Unintentional release volume greater than
or equal to 5 gallons and in an HCA; or
Unintentional release volume greater than
or equal to 5 barrels and outside of an HCA;
or Water contamination; or Soil contamination
DEFINITIONS & NOTES

P I P E L I N E S A F E T Y E X C E L L E N C E P E R F O R M A N C E R E P O R T
.452 0 1 9 A N N U A L L I Q U I D S P I P E L I N E R E P O R T
P H M S A I N C I D E N T R E P O R T I N G
Pipeline operators regulated by PHMSA are
required to report data related to pipeline
incidents including location, cause and
consequences. PHMSA compiles this information
in a publicly available online database. The pipeline
safety data used in this report was obtained from
PHMSA in March 2018.
A P I R E C O M M E N D P R A C T I C E
Documents that communicate proven industry
practices; RPs may include both mandatory and
non-mandatory provisions.
R E F I N E D P R O D U C T S
Products derived from the process of refining
crude oil . Examples of refined products include:
gasoline, kerosene, and lubricating oi l .
C R U D E O I L
Includes condensate, l ight, medium, and
heavy unrefined hydrocarbons extracted from
underground petroleum formations.
© Copyright 2019, all rights reserved. Digital Media | DM2019-020 |PDF
L e a r n m o r e a t : w w w. a p i . o r g L e a r n m o r e a t : w w w. a o p l . o r g Le a r n more a t : www.aop l .o rg /sa fe t y/ s a fe ty-exce l l ence -p rog ram
L i k e u s o n f a c e b o o k : w w w. f a c e b o o k . c o m / P o w e r P a s t I m p o s s i b l e L ike us on faceb ook : www.faceb ook .com/ A ssoc ia t ionofO i l P ip e l i nes
F o l l o w u s o n t w i t t e r : w w w. t w i t t e r. c o m / @ p o w e r i m p o s s i b l e F o l l o w u s o n t w i t t e r : w w w. / t w i t t e r. c o m / o i l p i p e l i n e s
F O R M O R E I N F O R M AT I O N , C O N TA C T J O H N S T O O DY AT J S T O O DY @ A O P L . O R G O R S A M M I N I F I E AT M I N I F I E S @ A P I . O R G