pioneer fundamental growth fund - fgs inc.pira.fgraphic.com/noauth/pdf/19341.pdf · pioneer...
TRANSCRIPT

Annual Report | March 31, 2019
Ticker Symbols:
Class A PIGFX
Class C FUNCX
Class K PFGKX
Class R PFGRX
Class Y FUNYX
Pioneer Fundamental Growth Fund
Beginning in March 2021, as permitted by regulations adopted by the Securities and ExchangeCommission, paper copies of the Fund’s shareholder reports like this one will no longer be sent bymail, unless you specifically request paper copies of the reports from the Fund or from your financialintermediary, such as a broker-dealer, bank or insurance company. Instead, the reports will be madeavailable on the Fund’s website, and you will be notified by mail each time a report is posted andprovided with a website link to access the report.If you already elected to receive shareholder reports electronically, you will not be affected by thischange and you need not take any action. You may elect to receive shareholder reports and othercommunications electronically by contacting your financial intermediary or, if you invest directly withthe Fund, by calling 1-800-225-6292.You may elect to receive all future reports in paper free of charge. If you invest directly with the Fund,you can inform the Fund that you wish to continue receiving paper copies of your shareholder reportsby calling 1-800-225-6292. If you invest through a financial intermediary, you can contact yourfinancial intermediary to request that you continue to receive paper copies of your shareholder reports.Your election to receive reports in paper will apply to all funds held in your account if you invest throughyour financial intermediary or all funds held within the Pioneer Fund complex if you invest directly.

visit us: www.amundipioneer.com
Pioneer Fundamental Growth Fund | Annual Report | 3/31/19 1
Table of Contents
President’s Letter 2
Portfolio Management Discussion 4
Portfolio Summary 9
Prices and Distributions 10
Performance Update 11
Comparing Ongoing Fund Expenses 16
Schedule of Investments 18
Financial Statements 22
Notes to Financial Statements 31
Report of Independent Registered Public Accounting Firm 40
Additional Information 42
Trustees, Officers and Service Providers 43
2 Pioneer Fundamental Growth Fund | Annual Report | 3/31/19
President’s Letter
Since 1928, active portfolio management based on in-depth, fundamentalresearch, has been the foundation of Amundi Pioneer’s investment approach.We believe an active management investment strategy is a prudent approachto investing, especially during periods of market volatility, which can resultfrom any number of risk factors, including slow U.S. economic growth, risinginterest rates, and geopolitical factors. Of course, in today’s global economy,risk factors extend well beyond U.S. borders, and political and economicissues on the international front can also cause or contribute to volatility inU.S. markets.
At Amundi Pioneer, each security under consideration is researched by ourteam of experienced investment professionals, who visit companies and meetwith their management teams. At the end of this research process, if we haveconviction in a company’s business model and management team, and regardthe security as a potentially solid investment opportunity, an Amundi Pioneerportfolio manager makes an active decision to invest in that security. Theportfolio resulting from these decisions represents an expression of his or herconvictions, and strives to balance overall risk and return opportunity. As anexample, the Standard & Poor’s 500 Index – the predominant benchmark formany U.S. Large-Cap Core Equity funds – has 500 stocks. An Amundi Pioneerportfolio manager chooses to invest in only those companies that he or shebelieves can offer the most attractive opportunities to pursue the fund’sinvestment objective, thus potentially benefiting the fund’s shareowners. Thisprocess results in a portfolio that does not own all 500 stocks, but a muchnarrower universe. The same active decision to invest in a company is alsoapplied when we decide to sell a security, either due to changing fundamentals,valuation concerns, or market risks. We apply this active decision-makingacross all of our equity, fixed-income, and global portfolios.
Today, as investors, we have many options. It is our view that activemanagement can serve shareholders well not only when markets are thriving,but also during periods of market volatility and uncertainty, thus making it acompelling investment choice. As you consider the many choices today, weencourage you to work with your financial advisor to develop an overallinvestment plan that addresses both your short- and long-term goals, and toimplement such a plan in a disciplined manner.
Pioneer Fundamental Growth Fund | Annual Report | 3/31/19 3
We greatly appreciate the trust you have placed in us and look forward tocontinuing to serve you in the future.
Sincerely,
Lisa M. JonesHead of the Americas, President and CEO of U.S.Amundi Pioneer Asset Management USA, Inc.March 31, 2019
Any information in this shareowner report regarding market or economic trends or thefactors influencing the Fund’s historical or future performance are statements of opinionas of the date of this report. Past performance is no guarantee of future results.
4 Pioneer Fundamental Growth Fund | Annual Report | 3/31/19
Portfolio Management Discussion | 3/31/19
U.S. stocks delivered generous returns during the 12-month period endedMarch 31, 2019, driven by good economic growth, strong corporate earnings, andsubdued inflationary trends. The notable exception to the overall positiveenvironment came in the final quarter of 2018 when the market sold off due to anumber of concerns, including escalating trade disputes and the U.S. FederalReserve’s (the Fed’s) series of interest-rate increases throughout 2018. In thefollowing interview, Andrew Acheson and Paul Cloonan discuss the factors thataffected the performance of Pioneer Fundamental Growth Fund during the12-month period. Mr. Acheson, Managing Director, Director of Growth, U.S.,and a portfolio manager at Amundi Pioneer Asset Management, Inc. (“AmundiPioneer”), and Mr. Cloonan, a senior vice president and a portfolio manager atAmundi Pioneer, are responsible for the day-to-day management of the Fund.
Q How did the Fund perform during the 12-month period endedMarch 31, 2019?
A Pioneer Fundamental Growth Fund’s Class A shares returned 12.90% at netasset value during the 12-month period ended March 31, 2019, while theFund’s benchmark, the Russell 1000 Growth Index (the Russell Index),returned 12.75%. During the same period, the average return of the 1,397mutual funds in Morningstar’s Large Growth Funds category was 10.71%.
Q How would you describe the investment environment for U.S. equitiesduring the 12-month period ended March 31, 2019?
A The start of the 12-month period (April 2018) saw a continuation of the bullmarket that had characterized most of 2017, with investors encouraged by arobust economy, rising corporate earnings, lower tax rates, and the lack ofany acceleration in wages or inflation. In that environment, high-growthstocks with high valuations led the market rally. Stocks in the informationtechnology sector, in particular, tended to do very well during that timeframe, while more defensive and reasonably priced stocks lagged. The stockmarket peaked in September 2018 before reversing course, falling byapproximately 20% by late December as investors worried about aneconomic slowdown arising from uncertainties related to the U.S. tradenegotiations with China as well as the prospect that the Fed would keepraising short-term interest rates, and thus apply a firm brake on economicgrowth. (The Fed had raised rates for five consecutive calendar quarters,including four times in 2018 alone, culminating with its Decemberincrease.)
Pioneer Fundamental Growth Fund | Annual Report | 3/31/19 5
The pessimism that characterized the final quarter of 2018 receded early in2019, however, after the Fed signaled that it would become more “datadependent” with regard to future rate increases, and would likely delayadditional hikes, at least for the time being. The Fed’s apparent policyreversal, combined with positive commentary about progress in theChina/U.S. trade negotiations, spurred the equity markets to reboundsharply in the first quarter of 2019.
Q What factors affected the Fund’s benchmark-relative performance themost during the 12-month period ended March 31, 2019?
A The Fund slightly outperformed the Russell Index during the 12-monthperiod, with the most important factor aiding benchmark-relative returnsbeing our focus on investing the portfolio in reasonably valued shares ofcompanies with better-than-average earnings stability, as those stocksproved more resilient during the fourth-quarter market decline. Toillustrate, while the Fund did post a negative return of -12.3% in theextremely difficult market environment over the fourth quarter of 2018, itmanaged to outperform the Russell Index, which returned -15.9% for thatsame three-month period.
At the sector level, stock selection results in information technology made asubstantial contribution to positive benchmark-relative returns, whileselection in health care and materials also helped. Meanwhile, stockselection in industrials, communication services, and consumerdiscretionary detracted from the Fund’s benchmark-relative performance,with results in industrials by far the biggest drag on returns.
With regard to sector allocations, the Fund’s benchmark-relativeunderweights in the communication services and industrials sectors, whichwe maintained primarily due to the lack of companies in those sectors thatmet our investment discipline at appropriate valuations, contributedpositively to relative performance. An overweight exposure to technologystocks also contributed positively to benchmark-relative returns.
Conversely, an overweight to financials, which was the third-worst-performing sector in the Russell Index over the 12-month period, detractedfrom the Fund’s benchmark-relative results.
Q What were some of the individual portfolio holdings that had notableeffects, either positive or negative, on the Fund’s benchmark-relativeperformance during the 12-month period ended March 31, 2019?
A A position in Mastercard, a high-quality company with a history ofproducing strong profitability and steady growth, was the biggest individualpositive contributor to the Fund’s benchmark-relative performance over the12-month period. Mastercard has continued to benefit from the long-term
6 Pioneer Fundamental Growth Fund | Annual Report | 3/31/19
trend of electronic transactions replacing cash and checks. Another topperformance contributor for the period was the Fund’s position in ThermoFisher Scientific, which specializes in producing instruments andequipment mainly for the life-sciences industry. The company’s sales growthhas accelerated during the past year, while operating profit margins havecontinued to expand. The Fund’s investment in O’Reilly Automotive alsopaid off and aided benchmark-relative results, as the auto-parts retailerbenefited from rising demand for auto parts needed to repair aging cars andtrucks. At the same time, the Fund’s shares of Broadcom, which is one ofthe larger semiconductor firms, gained in value over the 12-month periodas the market began to recognize the potential of the company’s acquisitionof software firm CA Technologies.
Some portfolio positions detracted from the Fund’s benchmark-relativereturns during the period, most notably Raytheon. Raytheon, a majordefense contractor, had no real operational problems during the 12-monthperiod and continued to benefit from strong demand for its missile systems.However, the company’s share price declined sharply in the fourth quarterof 2018 as investors grew concerned that growth in defense spending maynot be quite as large as previously believed. Also holding back the Fund’srelative results for the 12-month period was an investment in BookingHoldings, the online travel company formerly known as Priceline. BookingHoldings, which has a significant business with European hotels, struggledas the market feared that the company could be affected by weakness in theEuropean economy. Finally, the Fund’s position in Electronic Arts (EA), avideo game publisher, detracted from benchmark-relative performance asthe market grew worried about increased competition and a delayed releaseof one of EA’s key game titles.
Q What were some of the more noteworthy changes you made to theportfolio during the 12-month period ended on March 31, 2019?
A Stocks that we eliminated from the portfolio over the 12-month periodincluded three drug companies: Alexion Pharmaceuticals, VertexPharmaceuticals, and Gilead Sciences. We sold Alexion because of concernsover potential competitive threats to its most important rare-disease drugfranchise. Shares of Vertex had reached our price target and, consistent withthe Fund’s discipline on valuation, we eliminated the stock from theportfolio. We sold Gilead Sciences because of continued competitivepressure on its hepatitis C drugs, and the potential for new HIV-relatedproducts in the marketplace. We also sold the Fund’s stake in Colgate-Palmolive after the company’s earnings growth rate faltered.
Pioneer Fundamental Growth Fund | Annual Report | 3/31/19 7
The stocks added to the Fund over the 12-month period included: globalpharmaceutical corporation Eli Lilly, which focuses on treatments fordiabetes, oncology, and neurology; online travel company BookingHoldings, which we discussed earlier; and Emerson Electric, a diversifiedproducer of industrial process systems and equipment that has beenbenefiting from growth in industrial automation. We also added a positionin Amazon.com after the sharp market decline in the fourth quarter, as ourconfidence increased that the company could sustain recent improvementsin its profitability.
Q Did the Fund hold any derivative securities during the 12-month periodended March 31, 2019?
A No, the Fund did not invest in any derivatives during the period.
Q What is your investment outlook?
A We expect that the U.S. economy and corporate profits should continue togrow in 2019, although more slowly than in 2018. While global economicgrowth trends are slowing, the domestic economy has shown moreresilience, and it could benefit further from the prospect of a moreaccommodative monetary policy from the Fed. The U.S. central bank’ssofter tone on interest rates has reassured investors, despite continuingconcerns about the outcome of U.S. trade negotiations with other nations,particularly China. Even so, we believe we may continue to see increasedvolatility in the equity market due to conflicting economic signals andpolitical uncertainties, given that 2020 is a U.S. election year.
In such an environment, we anticipate that the market may increasinglycome to favor reasonably priced stocks of companies with sustainableprofitability and stable earnings growth. Those are the characteristics weemphasize when selecting individual investments for the Fund’s portfolio.Over time, that investment approach has helped the Fund to have lessdownside risk in volatile markets, such as the market decline witnessed inthe fourth quarter of 2018.
8 Pioneer Fundamental Growth Fund | Annual Report | 3/31/19
Please refer to the Schedule of Investments on pages 18–21 for a full listing ofFund securities.All investments are subject to risk, including the possible loss of principal. In thepast several years, financial markets have experienced increased volatility,depressed valuations, decreased liquidity and heightened uncertainty. Theseconditions may continue, recur, worsen or spread.Investing in foreign and/or emerging markets securities involves risks relating tointerest rates, currency exchange rates, economic, and political conditions.The Fund invests in a limited number of securities and, as a result, the Fund’sperformance may be more volatile than the performance of other funds holdingmore securities.At times, the Fund’s investments may represent industries or industry sectors thatare interrelated or have common risks, making the Fund more susceptible to anyeconomic, political, or regulatory developments or other risks affecting thoseindustries and sectors.These risks may increase share price volatility.
Before investing, consider the product’s investment objectives, risks, charges andexpenses. Contact your advisor or Amundi Pioneer Asset Management, Inc., for aprospectus or summary prospectus containing this information. Read it carefully.Any information in this shareholder report regarding market or economic trendsor the factors influencing the Fund’s historical or future performance arestatements of opinion as of the date of this report. Past performance is noguarantee of future results.

Pioneer Fundamental Growth Fund | Annual Report | 3/31/19 9
Portfolio Summary | 3/31/19
Sector Distribution(As a percentage of total investments)*
10 Largest Holdings(As a percentage of total investments)*
1. Microsoft Corp. 7.68%2. Alphabet, Inc., Class C 6.303. Apple, Inc. 5.474. Mastercard, Inc. 5.185. Thermo Fisher Scientific, Inc. 3.826. PepsiCo., Inc. 3.757. Intercontinental Exchange, Inc. 3.498. Home Depot, Inc. 3.469. Marsh & McLennan Cos., Inc. 3.33
10. Broadcom, Inc. 3.06
* Excludes temporary cash investments and all derivative contracts except for options purchased. TheFund is actively managed, and current holdings may be different. The holdings listed should not beconsidered recommendations to buy or sell any securities.
Information Technology 32.6%
Industrials 8.3%
Consumer Staples 5.1% Materials 2.9%
Consumer Discretionary 16.3%
Health Care 17.0%
Financials 9.4%
Communication Services 8.4%

10 Pioneer Fundamental Growth Fund | Annual Report | 3/31/19
Prices and Distributions | 3/31/19
Net Asset Value per Share
Class 3/31/19 3/31/18
A $24.21 $22.66
C $21.93 $20.73
K $24.21 $22.68
R $23.79 $22.31
Y $24.42 $22.86
Distributions per Share: 4/1/18–3/31/19
Net Investment Short-Term Long-TermClass Income Capital Gains Capital Gains
A $0.0504 $0.0259 $1.2087
C $ — $0.0259 $1.2087
K $0.1636 $0.0259 $1.2087
R $ — $0.0259 $1.2087
Y $0.1380 $0.0259 $1.2087
The Russell 1000 Growth Index is an unmanaged index that measures theperformance of large-cap U.S. growth stocks. Index returns assumereinvestment of dividends and, unlike Fund returns, do not reflect any fees,expenses or sales charges. It is not possible to invest directly in an index.
The index defined here pertains to the “Value of $10,000 Investment” and“Value of $5 Million Investment” charts on pages 11–15.
Pioneer Fundamental Growth Fund | Annual Report | 3/31/19 11
Performance Update | 3/31/19 Class A Shares
Investment Returns
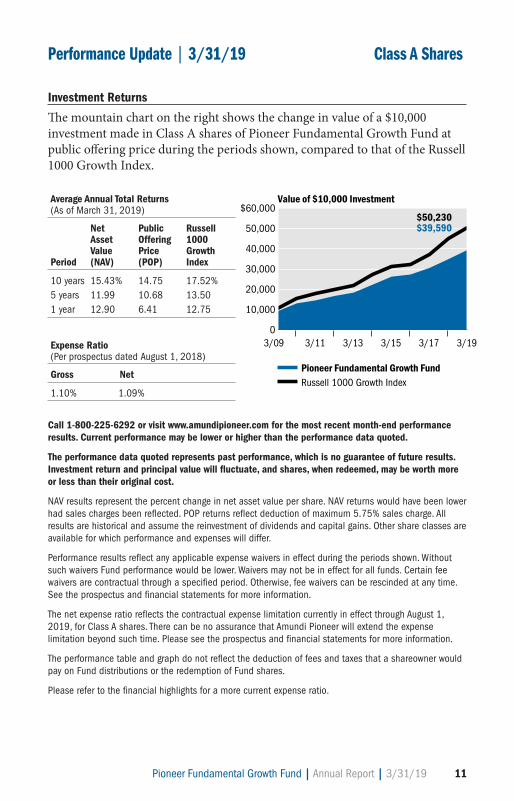
The mountain chart on the right shows the change in value of a $10,000investment made in Class A shares of Pioneer Fundamental Growth Fund atpublic offering price during the periods shown, compared to that of the Russell1000 Growth Index.
Average Annual Total Returns(As of March 31, 2019)
Net Public RussellAsset Offering 1000Value Price Growth
Period (NAV) (POP) Index
10 years 15.43% 14.75 17.52%5 years 11.99 10.68 13.501 year 12.90 6.41 12.75
Expense Ratio(Per prospectus dated August 1, 2018)
Gross Net
1.10% 1.09%
Call 1-800-225-6292 or visit www.amundipioneer.com for the most recent month-end performanceresults. Current performance may be lower or higher than the performance data quoted.
The performance data quoted represents past performance, which is no guarantee of future results.Investment return and principal value will fluctuate, and shares, when redeemed, may be worth moreor less than their original cost.
NAV results represent the percent change in net asset value per share. NAV returns would have been lowerhad sales charges been reflected. POP returns reflect deduction of maximum 5.75% sales charge. Allresults are historical and assume the reinvestment of dividends and capital gains. Other share classes areavailable for which performance and expenses will differ.
Performance results reflect any applicable expense waivers in effect during the periods shown. Withoutsuch waivers Fund performance would be lower. Waivers may not be in effect for all funds. Certain feewaivers are contractual through a specified period. Otherwise, fee waivers can be rescinded at any time.See the prospectus and financial statements for more information.
The net expense ratio reflects the contractual expense limitation currently in effect through August 1,2019, for Class A shares. There can be no assurance that Amundi Pioneer will extend the expenselimitation beyond such time. Please see the prospectus and financial statements for more information.
The performance table and graph do not reflect the deduction of fees and taxes that a shareowner wouldpay on Fund distributions or the redemption of Fund shares.
Please refer to the financial highlights for a more current expense ratio.
Value of $10,000 Investment
$50,230$39,590
$60,000
50,000
40,000
30,000
20,000
10,000
0
Pioneer Fundamental Growth FundRussell 1000 Growth Index
3/09 3/11 3/13 3/15 3/17 3/19

12 Pioneer Fundamental Growth Fund | Annual Report | 3/31/19
Performance Update | 3/31/19 Class C Shares
Investment Returns
The mountain chart on the right shows the change in value of a $10,000investment made in Class C shares of Pioneer Fundamental Growth Fundduring the periods shown, compared to that of the Russell 1000 Growth Index.
Average Annual Total Returns(As of March 31, 2019)
Russell1000
If If GrowthPeriod Held Redeemed Index
10 years 14.59% 14.59% 17.52%5 years 11.24 11.24 13.501 year 12.12 12.12 12.75
Expense Ratio(Per prospectus dated August 1, 2018)
Gross
1.74%
Call 1-800-225-6292 or visit www.amundipioneer.com for the most recent month-end performanceresults. Current performance may be lower or higher than the performance data quoted.
The performance data quoted represents past performance, which is no guarantee of future results.Investment return and principal value will fluctuate, and shares, when redeemed, may be worth moreor less than their original cost.
Class C shares held for less than one year are also subject to a 1% contingent deferred sales charge(CDSC). “If Held” results represent the percent change in net asset value per share. “If Redeemed” returnswould have been lower had sales charges been reflected. All results are historical and assume thereinvestment of dividends and capital gains. Other share classes are available for which performance andexpenses will differ.
Performance results reflect any applicable expense waivers in effect during the periods shown. Withoutsuch waivers Fund performance would be lower. Waivers may not be in effect for all funds. Certain feewaivers are contractual through a specified period. Otherwise, fee waivers can be rescinded at any time.See the prospectus and financial statements for more information.
The performance table and graph do not reflect the deduction of fees and taxes that a shareowner wouldpay on Fund distributions or the redemption of Fund shares.
Please refer to the financial highlights for a more current expense ratio.
Value of $10,000 Investment
$50,230$39,039
$60,000
50,000
40,000
30,000
20,000
10,000
0
Pioneer Fundamental Growth FundRussell 1000 Growth Index
3/09 3/11 3/13 3/15 3/17 3/19

Pioneer Fundamental Growth Fund | Annual Report | 3/31/19 13
Performance Update | 3/31/19 Class K Shares
Investment Returns
The mountain chart on the right shows the change in value of a $5 millioninvestment made in Class K shares of Pioneer Fundamental Growth Fundduring the periods shown, compared to that of the Russell 1000 Growth Index.
Average Annual Total Returns(As of March 31, 2019)
Net RussellAsset 1000Value Growth
Period (NAV) Index
10 years 15.74% 17.52%5 years 12.48 13.501 year 13.39 12.75
Expense Ratio(Per prospectus dated August 1, 2018)
Gross
0.66%
Call 1-800-225-6292 or visit www.amundipioneer.com for the most recent month-end performanceresults. Current performance may be lower or higher than the performance data quoted.
The performance data quoted represents past performance, which is no guarantee of future results.Investment return and principal value will fluctuate, and shares, when redeemed, may be worth moreor less than their original cost.
The performance shown for Class K shares for the period prior to the commencement of operations of Class Kshares on December 20, 2012, is the net asset value performance of the Fund’s Class A shares, which hasnot been restated to reflect any differences in expenses, including Rule 12b-1 fees applicable to Class Ashares. Since fees for Class A shares generally are higher than those of Class K shares, the performance ofClass K shares prior to their inception would have been higher than the performance shown. For the periodbeginning December 20, 2012, the actual performance of Class K shares is reflected. Class K shares are notsubject to sales charges and are available for limited groups of eligible investors, including institutionalinvestors. All results are historical and assume the reinvestment of dividends and capital gains. Other shareclasses are available for which performance and expenses will differ.
Performance results reflect any applicable expense waivers in effect during the periods shown. Withoutsuch waivers Fund performance would be lower. Waivers may not be in effect for all funds. Certain feewaivers are contractual through a specified period. Otherwise, fee waivers can be rescinded at any time.See the prospectus and financial statements for more information.
The performance table and graph do not reflect the deduction of fees and taxes that a shareowner wouldpay on Fund distributions or the redemption of Fund shares.
Please refer to the financial highlights for a more current expense ratio.
Value of $5 Million Investment
$25,114,834$21,565,076
$30,000,000
25,000,000
20,000,000
15,000,000
10,000,000
5,000,000
0
Pioneer Fundamental Growth FundRussell 1000 Growth Index
3/09 3/11 3/13 3/15 3/17 3/19

14 Pioneer Fundamental Growth Fund | Annual Report | 3/31/19
Performance Update | 3/31/19 Class R Shares
Investment Returns
The mountain chart on the right shows the change in value of a $10,000investment made in Class R shares of Pioneer Fundamental Growth Fundduring the periods shown, compared to that of the Russell 1000 Growth Index.
Average Annual Total Returns(As of March 31, 2019)
Net RussellAsset 1000Value Growth
Period (NAV) Index
10 years 15.19% 17.52%5 years 11.65 13.501 year 12.52 12.75
Expense Ratio(Per prospectus dated August 1, 2018)
Gross Net
1.42% 1.40%
Call 1-800-225-6292 or visit www.amundipioneer.com for the most recent month-end performanceresults. Current performance may be lower or higher than the performance data quoted.
The performance data quoted represents past performance, which is no guarantee of future results.Investment return and principal value will fluctuate, and shares, when redeemed, may be worth moreor less than their original cost.
The performance shown for Class R shares for the period prior to the commencement of operations ofClass R shares on April 2, 2012, is based on the performance of Class A shares, reduced to reflect thehigher distribution and service fees of Class R shares. For the period beginning April 2, 2012, the actualperformance of Class R shares is reflected. Class R shares are not subject to sales charges and are avail-able for limited groups of eligible investors, including institutional investors. All results are historical andassume the reinvestment of dividends and capital gains. Other share classes are available for whichperformance and expenses will differ.
Performance results reflect any applicable expense waivers in effect during the periods shown. Withoutsuch waivers Fund performance would be lower. Waivers may not be in effect for all funds. Certain feewaivers are contractual through a specified period. Otherwise, fee waivers can be rescinded at any time.See the prospectus and financial statements for more information.
The net expense ratio reflects the contractual expense limitation currently in effect through August 1,2019, for Class R shares. There can be no assurance that Amundi Pioneer will extend the expenselimitation beyond such time. Please see the prospectus and financial statements for more information.
The performance table and graph do not reflect the deduction of fees and taxes that a shareowner wouldpay on Fund distributions or the redemption of Fund shares.
Please refer to the financial highlights for a more current expense ratio.
Value of $10,000 Investment
$50,230$41,138
$60,000
50,000
40,000
30,000
20,000
10,000
0
Pioneer Fundamental Growth FundRussell 1000 Growth Index
3/09 3/11 3/13 3/15 3/17 3/19

Pioneer Fundamental Growth Fund | Annual Report | 3/31/19 15
Performance Update | 3/31/19 Class Y Shares
Investment Returns
The mountain chart on the right shows the change in value of a $5 millioninvestment made in Class Y shares of Pioneer Fundamental Growth Fundduring the periods shown, compared to that of the Russell 1000 Growth Index.
Average Annual Total Returns(As of March 31, 2019)
Net RussellAsset 1000Value Growth
Period (NAV) Index
10 years 15.83% 17.52%5 years 12.35 13.501 year 13.28 12.75
Expense Ratio(Per prospectus dated August 1, 2018)
Gross
0.77%
Call 1-800-225-6292 or visit www.amundipioneer.com for the most recent month-end performanceresults. Current performance may be lower or higher than the performance data quoted.
The performance data quoted represents past performance, which is no guarantee of future results.Investment return and principal value will fluctuate, and shares, when redeemed, may be worth moreor less than their original cost.
The performance shown for Class Y shares for the period prior to the commencement of operations ofClass Y shares on April 8, 2009, is the net asset value performance of the Fund’s Class A shares, whichhas not been restated to reflect any differences in expenses, including Rule 12b-1 fees applicable toClass A shares. Since fees for Class A shares generally are higher than those of Class Y shares, theperformance of Class Y shares prior to their inception would have been higher than the performanceshown. For the period beginning April 8, 2009, the actual performance of Class Y shares is reflected. Class Yshares are not subject to sales charges and are available for limited groups of eligible investors, includinginstitutional investors. All results are historical and assume the reinvestment of dividends and capitalgains. Other share classes are available for which performance and expenses will differ.
Performance results reflect any applicable expense waivers in effect during the periods shown. Withoutsuch waivers Fund performance would be lower. Waivers may not be in effect for all funds. Certain feewaivers are contractual through a specified period. Otherwise, fee waivers can be rescinded at any time.See the prospectus and financial statements for more information.
The performance table and graph do not reflect the deduction of fees and taxes that a shareowner wouldpay on Fund distributions or the redemption of Fund shares.
Please refer to the financial highlights for a more current expense ratio.
Value of $5 Million Investment
$25,114,834$21,731,770
$30,000,000
25,000,000
20,000,000
15,000,000
10,000,000
5,000,000
0
Pioneer Fundamental Growth FundRussell 1000 Growth Index
3/09 3/11 3/13 3/15 3/17 3/19

16 Pioneer Fundamental Growth Fund | Annual Report | 3/31/19
Comparing Ongoing Fund Expenses
As a shareowner in the Fund, you incur two types of costs:
(1) ongoing costs, including management fees, distribution and/or service(12b-1) fees, and other Fund expenses; and
(2) transaction costs, including sales charges (loads) on purchase payments.
This example is intended to help you understand your ongoing expenses (indollars) of investing in the Fund and to compare these costs with the ongoingcosts of investing in other mutual funds. The example is based on an investmentof $1,000 at the beginning of the Fund’s latest six-month period and heldthroughout the six months.
Using the Tables
Actual Expenses
The first table below provides information about actual account values andactual expenses. You may use the information in this table, together with theamount you invested, to estimate the expenses that you paid over the periodas follows:
(1) Divide your account value by $1,000Example: an $8,600 account value ÷ $1,000 = 8.6
(2) Multiply the result in (1) above by the corresponding share class’snumber in the third row under the heading entitled “Expenses PaidDuring Period” to estimate the expenses you paid on your accountduring this period.
Expenses Paid on a $1,000 Investment in Pioneer Fundamental Growth Fund
Based on actual returns from October 1, 2018, through March 31, 2019.
Share Class A C K R Y
Beginning Account $1,000.00 $1,000.00 $1,000.00 $1,000.00 $1,000.00 Value on 10/1/18
Ending Account $1,003.64 $1,000.09 $1,005.77 $1,002.14 $1,005.24 Value (after expenses) on 3/31/19
Expenses Paid $5.44 $8.63 $3.30 $6.94 $3.85 During Period*
* Expenses are equal to the Fund’s annualized expense ratio of 1.09%, 1.73%, 0.66%, 1.39% and0.77% for Class A, Class C, Class K, Class R and Class Y shares, respectively, multiplied by the averageaccount value over the period, multiplied by 182/365 (to reflect the partial year period).
Pioneer Fundamental Growth Fund | Annual Report | 3/31/19 17
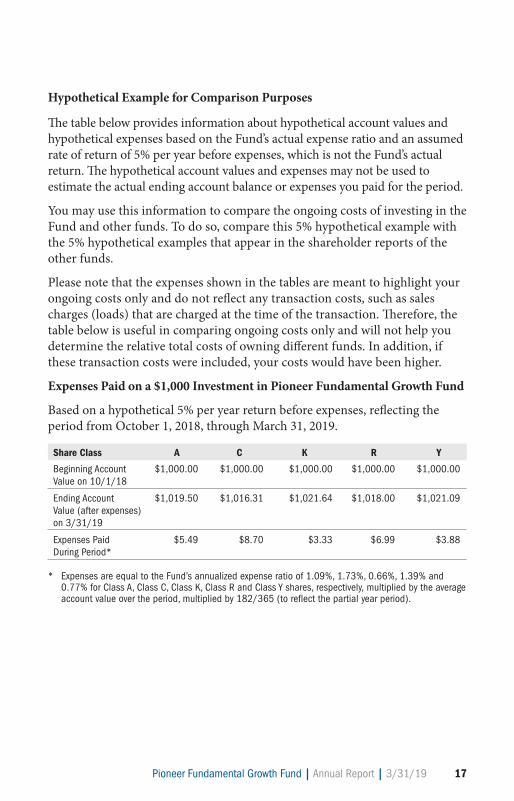
Hypothetical Example for Comparison Purposes
The table below provides information about hypothetical account values andhypothetical expenses based on the Fund’s actual expense ratio and an assumedrate of return of 5% per year before expenses, which is not the Fund’s actualreturn. The hypothetical account values and expenses may not be used toestimate the actual ending account balance or expenses you paid for the period.
You may use this information to compare the ongoing costs of investing in theFund and other funds. To do so, compare this 5% hypothetical example withthe 5% hypothetical examples that appear in the shareholder reports of theother funds.
Please note that the expenses shown in the tables are meant to highlight yourongoing costs only and do not reflect any transaction costs, such as salescharges (loads) that are charged at the time of the transaction. Therefore, thetable below is useful in comparing ongoing costs only and will not help youdetermine the relative total costs of owning different funds. In addition, ifthese transaction costs were included, your costs would have been higher.
Expenses Paid on a $1,000 Investment in Pioneer Fundamental Growth Fund
Based on a hypothetical 5% per year return before expenses, reflecting theperiod from October 1, 2018, through March 31, 2019.
Share Class A C K R Y
Beginning Account $1,000.00 $1,000.00 $1,000.00 $1,000.00 $1,000.00 Value on 10/1/18
Ending Account $1,019.50 $1,016.31 $1,021.64 $1,018.00 $1,021.09 Value (after expenses)on 3/31/19
Expenses Paid $5.49 $8.70 $3.33 $6.99 $3.88 During Period*
* Expenses are equal to the Fund’s annualized expense ratio of 1.09%, 1.73%, 0.66%, 1.39% and0.77% for Class A, Class C, Class K, Class R and Class Y shares, respectively, multiplied by the averageaccount value over the period, multiplied by 182/365 (to reflect the partial year period).

18 Pioneer Fundamental Growth Fund | Annual Report | 3/31/19
The accompanying notes are an integral part of these financial statements.
Schedule of Investments | 3/31/19
Shares Value
UNAFFILIATED ISSUERS — 99.4% COMMON STOCKS — 99.4% of Net Assets Aerospace & Defense — 2.9% 928,973 Raytheon Co. $ 169,147,404
Total Aerospace & Defense $ 169,147,404
Beverages — 3.7% 1,777,980 PepsiCo., Inc. $ 217,891,449
Total Beverages $ 217,891,449
Building Products — 1.3% 1,890,013 Masco Corp. $ 74,296,411
Total Building Products $ 74,296,411
Capital Markets — 4.8% 1,835,297 Charles Schwab Corp. $ 78,477,300 2,659,879 Intercontinental Exchange, Inc. 202,523,187
Total Capital Markets $ 281,000,487
Chemicals — 2.8% 593,389 Ecolab, Inc. $ 104,756,894 474,833 International Flavors & Fragrances, Inc. 61,153,742
Total Chemicals $ 165,910,636
Communications Equipment — 0.3% 58,389(a) Arista Networks, Inc. $ 18,361,005
Total Communications Equipment $ 18,361,005
Electrical Equipment — 2.0% 1,687,140 Emerson Electric Co. $ 115,518,476
Total Electrical Equipment $ 115,518,476
Electronic Equipment, Instruments & Components — 3.1% 657,097 Amphenol Corp. $ 62,056,241 1,245,561 CDW Corp. 120,034,713
Total Electronic Equipment, Instruments & Components $ 182,090,954
Entertainment — 2.1% 1,229,709(a) Electronic Arts, Inc. $ 124,975,326
Total Entertainment $ 124,975,326
Food & Staples Retailing — 1.3% 786,918 Walmart, Inc. $ 76,748,113
Total Food & Staples Retailing $ 76,748,113
Health Care Equipment & Supplies — 5.0% 205,516(a) ABIOMED, Inc. $ 58,693,314 204,277 Cooper Cos., Inc. 60,500,719

Pioneer Fundamental Growth Fund | Annual Report | 3/31/19 19
The accompanying notes are an integral part of these financial statements.
Shares Value
Health Care Equipment & Supplies (continued) 382,284(a) Edwards Lifesciences Corp. $ 73,142,398 1,080,757 Medtronic Plc 98,435,347
Total Health Care Equipment & Supplies $ 290,771,778
Hotels, Restaurants & Leisure — 1.0% 784,574 Starbucks Corp. $ 58,325,231
Total Hotels, Restaurants & Leisure $ 58,325,231
Insurance — 4.6% 2,059,252 Marsh & McLennan Cos., Inc. $ 193,363,763 1,023,322 Progressive Corp. 73,771,283
Total Insurance $ 267,135,046
Interactive Media & Services — 6.3% 312,094(a) Alphabet, Inc., Class C $ 366,183,011
Total Interactive Media & Services $ 366,183,011
Internet & Direct Marketing Retail — 5.7% 89,713(a) Amazon.com, Inc. $ 159,756,425 97,818(a) Booking Holdings, Inc. 170,683,606
Total Internet & Direct Marketing Retail $ 330,440,031
IT Services — 10.1% 966,523 Accenture Plc $ 170,127,379 1,277,795 Mastercard, Inc. 300,856,833 1,131,227(a) PayPal Holdings, Inc. 117,466,611
Total IT Services $ 588,450,823
Life Sciences Tools & Services — 3.8% 810,682 Thermo Fisher Scientific, Inc. $ 221,899,877
Total Life Sciences Tools & Services $ 221,899,877
Machinery — 2.1% 886,651 Stanley Black & Decker, Inc. $ 120,735,266
Total Machinery $ 120,735,266
Pharmaceuticals — 8.1% 1,953,262(a) Elanco Animal Health, Inc. $ 62,641,112 1,336,105 Eli Lilly & Co. 173,372,985 608,242 Johnson & Johnson 85,026,149 1,516,661 Zoetis, Inc. 152,682,263
Total Pharmaceuticals $ 473,722,509
Semiconductors & Semiconductor Equipment — 3.0% 591,995 Broadcom, Inc. $ 178,018,817
Total Semiconductors & Semiconductor Equipment $ 178,018,817
20 Pioneer Fundamental Growth Fund | Annual Report | 3/31/19
The accompanying notes are an integral part of these financial statements.
Schedule of Investments | 3/31/19 (continued)
Shares Value
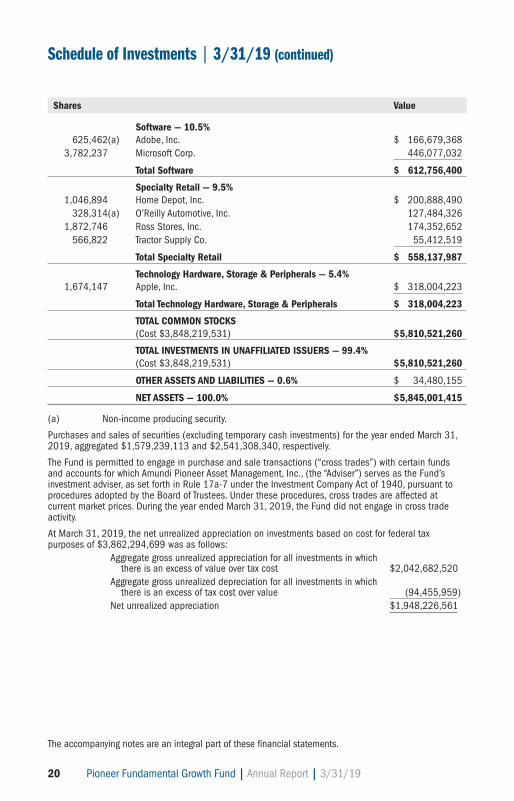
Software — 10.5% 625,462(a) Adobe, Inc. $ 166,679,368 3,782,237 Microsoft Corp. 446,077,032
Total Software $ 612,756,400
Specialty Retail — 9.5% 1,046,894 Home Depot, Inc. $ 200,888,490 328,314(a) O’Reilly Automotive, Inc. 127,484,326 1,872,746 Ross Stores, Inc. 174,352,652 566,822 Tractor Supply Co. 55,412,519
Total Specialty Retail $ 558,137,987
Technology Hardware, Storage & Peripherals — 5.4% 1,674,147 Apple, Inc. $ 318,004,223
Total Technology Hardware, Storage & Peripherals $ 318,004,223
TOTAL COMMON STOCKS (Cost $3,848,219,531) $5,810,521,260
TOTAL INVESTMENTS IN UNAFFILIATED ISSUERS — 99.4% (Cost $3,848,219,531) $5,810,521,260
OTHER ASSETS AND LIABILITIES — 0.6% $ 34,480,155
NET ASSETS — 100.0% $5,845,001,415
(a) Non-income producing security.
Purchases and sales of securities (excluding temporary cash investments) for the year ended March 31,2019, aggregated $1,579,239,113 and $2,541,308,340, respectively.
The Fund is permitted to engage in purchase and sale transactions (“cross trades”) with certain fundsand accounts for which Amundi Pioneer Asset Management, Inc., (the “Adviser”) serves as the Fund’sinvestment adviser, as set forth in Rule 17a-7 under the Investment Company Act of 1940, pursuant toprocedures adopted by the Board of Trustees. Under these procedures, cross trades are affected atcurrent market prices. During the year ended March 31, 2019, the Fund did not engage in cross tradeactivity.
At March 31, 2019, the net unrealized appreciation on investments based on cost for federal taxpurposes of $3,862,294,699 was as follows:
Aggregate gross unrealized appreciation for all investments in which there is an excess of value over tax cost $2,042,682,520 Aggregate gross unrealized depreciation for all investments in which there is an excess of tax cost over value (94,455,959) Net unrealized appreciation $1,948,226,561
Pioneer Fundamental Growth Fund | Annual Report | 3/31/19 21
The accompanying notes are an integral part of these financial statements.
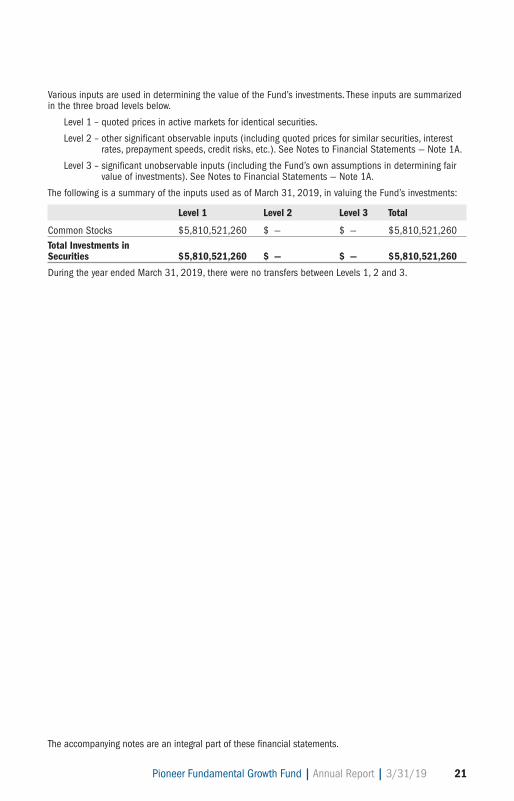
Various inputs are used in determining the value of the Fund’s investments. These inputs are summarizedin the three broad levels below.
Level 1 – quoted prices in active markets for identical securities.
Level 2 – other significant observable inputs (including quoted prices for similar securities, interestrates, prepayment speeds, credit risks, etc.). See Notes to Financial Statements — Note 1A.
Level 3 – significant unobservable inputs (including the Fund’s own assumptions in determining fairvalue of investments). See Notes to Financial Statements — Note 1A.
The following is a summary of the inputs used as of March 31, 2019, in valuing the Fund’s investments:
Level 1 Level 2 Level 3 Total
Common Stocks $5,810,521,260 $ — $ — $5,810,521,260Total Investments in Securities $5,810,521,260 $ — $ — $5,810,521,260
During the year ended March 31, 2019, there were no transfers between Levels 1, 2 and 3.
22 Pioneer Fundamental Growth Fund | Annual Report | 3/31/19
The accompanying notes are an integral part of these financial statements.
Statement of Assets and Liabilities | 3/31/19
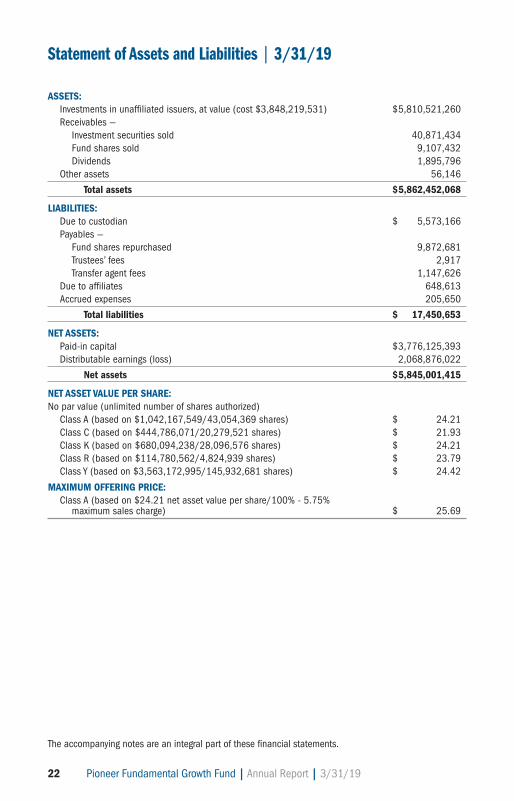
ASSETS: Investments in unaffiliated issuers, at value (cost $3,848,219,531) $5,810,521,260 Receivables — Investment securities sold 40,871,434 Fund shares sold 9,107,432 Dividends 1,895,796 Other assets 56,146
Total assets $5,862,452,068
LIABILITIES: Due to custodian $ 5,573,166 Payables — Fund shares repurchased 9,872,681 Trustees’ fees 2,917 Transfer agent fees 1,147,626 Due to affiliates 648,613 Accrued expenses 205,650
Total liabilities $ 17,450,653
NET ASSETS: Paid-in capital $3,776,125,393 Distributable earnings (loss) 2,068,876,022
Net assets $5,845,001,415
NET ASSET VALUE PER SHARE:No par value (unlimited number of shares authorized) Class A (based on $1,042,167,549/43,054,369 shares) $ 24.21 Class C (based on $444,786,071/20,279,521 shares) $ 21.93 Class K (based on $680,094,238/28,096,576 shares) $ 24.21 Class R (based on $114,780,562/4,824,939 shares) $ 23.79 Class Y (based on $3,563,172,995/145,932,681 shares) $ 24.42
MAXIMUM OFFERING PRICE: Class A (based on $24.21 net asset value per share/100% - 5.75% maximum sales charge) $ 25.69
Pioneer Fundamental Growth Fund | Annual Report | 3/31/19 23
The accompanying notes are an integral part of these financial statements.
Statement of OperationsFor the Year Ended 3/31/19
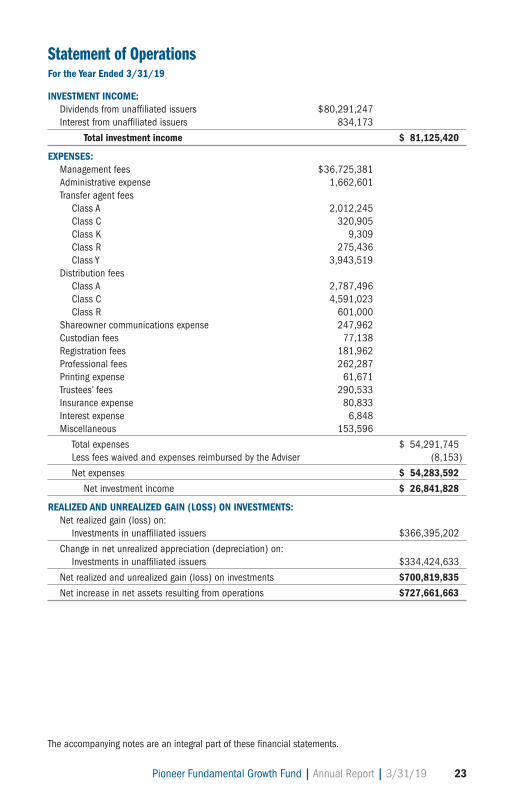
INVESTMENT INCOME: Dividends from unaffiliated issuers $80,291,247 Interest from unaffiliated issuers 834,173
Total investment income $ 81,125,420
EXPENSES: Management fees $36,725,381 Administrative expense 1,662,601 Transfer agent fees Class A 2,012,245 Class C 320,905 Class K 9,309 Class R 275,436 Class Y 3,943,519 Distribution fees Class A 2,787,496 Class C 4,591,023 Class R 601,000 Shareowner communications expense 247,962 Custodian fees 77,138 Registration fees 181,962 Professional fees 262,287 Printing expense 61,671 Trustees’ fees 290,533 Insurance expense 80,833 Interest expense 6,848 Miscellaneous 153,596
Total expenses $ 54,291,745 Less fees waived and expenses reimbursed by the Adviser (8,153)
Net expenses $ 54,283,592
Net investment income $ 26,841,828
REALIZED AND UNREALIZED GAIN (LOSS) ON INVESTMENTS: Net realized gain (loss) on: Investments in unaffiliated issuers $366,395,202
Change in net unrealized appreciation (depreciation) on: Investments in unaffiliated issuers $334,424,633
Net realized and unrealized gain (loss) on investments $700,819,835
Net increase in net assets resulting from operations $727,661,663
24 Pioneer Fundamental Growth Fund | Annual Report | 3/31/19
The accompanying notes are an integral part of these financial statements.
Statements of Changes in Net Assets
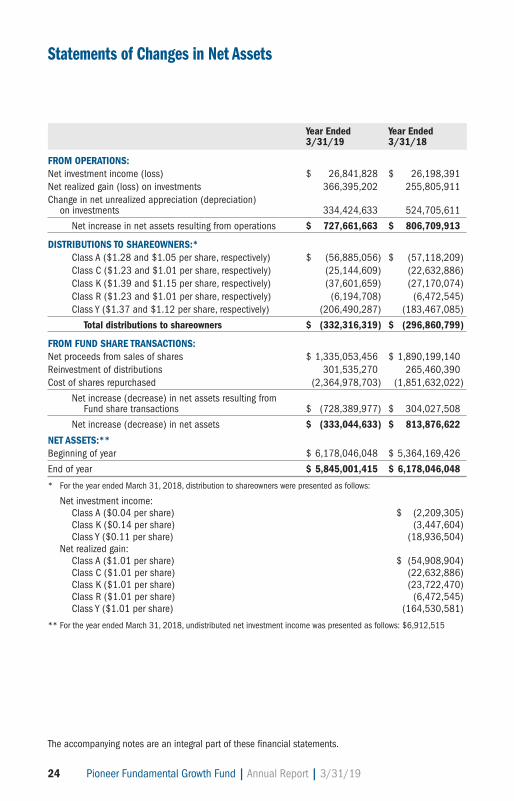
Year Ended Year Ended 3/31/19 3/31/18
FROM OPERATIONS:Net investment income (loss) $ 26,841,828 $ 26,198,391Net realized gain (loss) on investments 366,395,202 255,805,911Change in net unrealized appreciation (depreciation) on investments 334,424,633 524,705,611
Net increase in net assets resulting from operations $ 727,661,663 $ 806,709,913
DISTRIBUTIONS TO SHAREOWNERS:* Class A ($1.28 and $1.05 per share, respectively) $ (56,885,056) $ (57,118,209) Class C ($1.23 and $1.01 per share, respectively) (25,144,609) (22,632,886) Class K ($1.39 and $1.15 per share, respectively) (37,601,659) (27,170,074) Class R ($1.23 and $1.01 per share, respectively) (6,194,708) (6,472,545) Class Y ($1.37 and $1.12 per share, respectively) (206,490,287) (183,467,085)
Total distributions to shareowners $ (332,316,319) $ (296,860,799)
FROM FUND SHARE TRANSACTIONS:Net proceeds from sales of shares $ 1,335,053,456 $ 1,890,199,140Reinvestment of distributions 301,535,270 265,460,390Cost of shares repurchased (2,364,978,703) (1,851,632,022)
Net increase (decrease) in net assets resulting from Fund share transactions $ (728,389,977) $ 304,027,508
Net increase (decrease) in net assets $ (333,044,633) $ 813,876,622
NET ASSETS:**Beginning of year $ 6,178,046,048 $ 5,364,169,426
End of year $ 5,845,001,415 $ 6,178,046,048
* For the year ended March 31, 2018, distribution to shareowners were presented as follows:
Net investment income: Class A ($0.04 per share) $ (2,209,305) Class K ($0.14 per share) (3,447,604) Class Y ($0.11 per share) (18,936,504) Net realized gain: Class A ($1.01 per share) $ (54,908,904) Class C ($1.01 per share) (22,632,886) Class K ($1.01 per share) (23,722,470) Class R ($1.01 per share) (6,472,545) Class Y ($1.01 per share) (164,530,581)
** For the year ended March 31, 2018, undistributed net investment income was presented as follows: $6,912,515

Pioneer Fundamental Growth Fund | Annual Report | 3/31/19 25
The accompanying notes are an integral part of these financial statements.
Year Ended Year Ended Year Ended Year Ended3/31/19 3/31/19 3/31/18 3/31/18Shares Amount Shares Amount
Class AShares sold 7,464,963 $ 174,656,891 13,806,968 $ 306,540,567Reinvestment of distributions 2,147,773 48,760,985 2,165,560 48,482,692Less shares repurchased (19,319,758) (454,252,301) (21,209,461) (475,551,238)
Net decrease (9,707,022) $ (230,834,425) (5,236,933) $ (120,527,979)
Class CShares sold 2,716,493 $ 57,846,329 3,917,788 $ 80,229,794Reinvestment of distributions 1,059,825 21,874,816 964,970 19,762,588Less shares repurchased (6,325,451) (135,733,801) (6,336,780) (129,776,814)
Net decrease (2,549,133) $ (56,012,656) (1,454,022) $ (29,784,432)
Class KShares sold 10,787,886 $ 253,736,943 13,324,965 $ 299,047,406Reinvestment of distributions 1,635,138 36,995,323 1,163,910 26,160,337Less shares repurchased (11,429,160) (271,777,022) (5,504,088) (124,406,560)
Net increase 993,864 $ 18,955,244 8,984,787 $ 200,801,183
Class RShares sold 1,085,802 $ 24,580,239 2,589,007 $ 55,874,837Reinvestment of distributions 230,179 5,146,817 203,945 4,488,824Less shares repurchased (2,077,742) (47,159,442) (2,960,660) (65,982,881)
Net decrease (761,761) $ (17,432,386) (167,708) $ (5,619,220)
Class YShares sold 34,937,476 $ 824,233,054 51,292,560 $ 1,148,506,536Reinvestment of distributions 8,263,070 188,757,329 7,355,824 166,565,949Less shares repurchased (62,145,940) (1,456,056,137) (46,433,917) (1,055,914,529)
Net increase (decrease) (18,945,394) $ (443,065,754) 12,214,467 $ 259,157,956
26 Pioneer Fundamental Growth Fund | Annual Report | 3/31/19
The
acco
mpa
nyin
g no
tes
are
an in
tegr
al p
art o
f the
se fi
nanc
ial s
tate
men
ts.
Fina
ncia
l Hig
hlig
hts
Yea
r
Ye
ar
Ye
ar
Ye
ar
Ye
ar
E
nded
E
nded
En
ded
End
ed
Ende
d
3
/31/
19
3/3
1/18
3
/31/
17*
3/3
1/16
*
3
/31/
15*
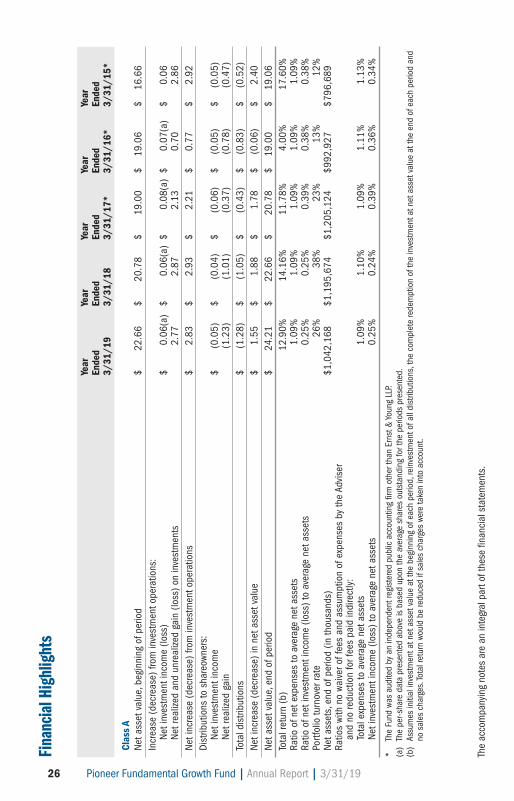
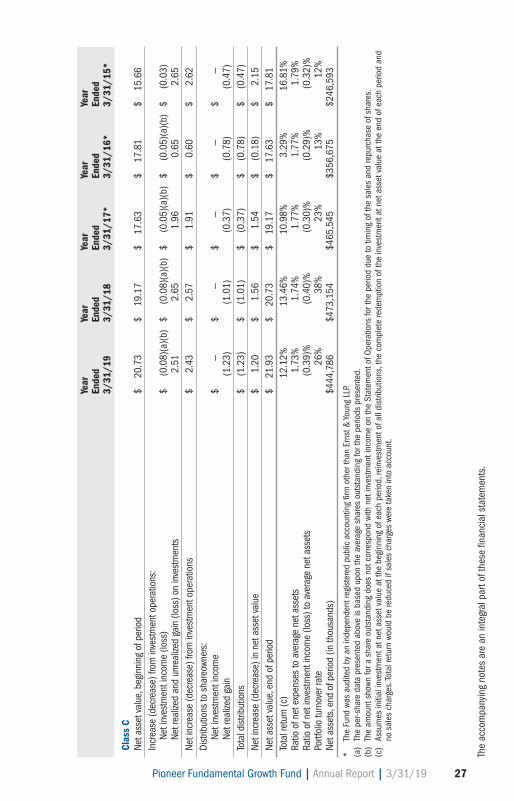
Clas
s A
Net a
sset
val
ue, b
egin
ning
of p
erio
d
$
22.6
6
$
20.
78
$
19.0
0
$
19
.06
$
16.
66In
crea
se (d
ecre
ase)
from
inve
stm
ent o
pera
tions
:
Net i
nves
tmen
t inc
ome
(loss
)
$
0.06
(a)
$
0.06
(a)
$
0.08
(a)
$
0.
07(a
)
$
0.0
6
Net r
ealiz
ed a
nd u
nrea
lized
gai
n (lo
ss) o
n in
vest
men
ts
2.7
7
2.
87
2.1
3
0
.70
2
.86
Net i
ncre
ase
(dec
reas
e) fr
om in
vest
men
t ope
ratio
ns
$
2.
83
$
2.
93
$
2.2
1
$
0
.77
$
2.
92Di
strib
utio
ns to
sha
reow
ners
:
Net i
nves
tmen
t inc
ome
$
(0.0
5)
$
(0.0
4)
$
(0
.06)
$
(0
.05)
$
(0.0
5)
Net r
ealiz
ed g
ain
(1
.23)
(1
.01)
(0.
37)
(0
.78)
(0.
47)
Tota
l dis
tribu
tions
$
(1.2
8)
$
(1.0
5)
$
(0
.43)
$
(0
.83)
$
(0.5
2)Ne
t inc
reas
e (d
ecre
ase)
in n
et a
sset
val
ue
$
1
.55
$
1.88
$
1
.78
$
(0.0
6)
$
2.40
Net a
sset
val
ue, e
nd o
f per
iod
$
24.2
1
$
22.
66
$
20.7
8
$
19
.00
$
19.
06To
tal r
etur
n (b
)
12.9
0%
1
4.16
%
11
.78%
4
.00%
17.6
0%Ra
tio o
f net
exp
ense
s to
ave
rage
net
ass
ets
1.09
%
1.09
%
1
.09%
1
.09%
1.0
9%Ra
tio o
f net
inve
stm
ent i
ncom
e (lo
ss) t
o av
erag
e ne
t ass
ets
0.2
5%
0.25
%
0
.39%
0
.38%
0.3
8%Po
rtfol
io tu
rnov
er ra
te
26%
38%
2
3%
1
3%
12%
Net a
sset
s, e
nd o
f per
iod
(in th
ousa
nds)
$1,0
42,1
68
$
1,19
5,67
4
$1
,205
,124
$992
,927
$7
96,6
89Ra
tios
with
no
waiv
er o
f fee
s an
d as
sum
ptio
n of
exp
ense
s by
the
Advi
ser
an
d no
redu
ctio
n fo
r fee
s pa
id in
dire
ctly
:
Tota
l exp
ense
s to
ave
rage
net
ass
ets
1.09
%
1.10
%
1
.09%
1
.11%
1.1
3%
Net i
nves
tmen
t inc
ome
(loss
) to
aver
age
net a
sset
s
0.25
%
0.24
%
0
.39%
0
.36%
0.3
4%
*
The
Fun
d wa
s au
dite
d by
an
inde
pend
ent r
egis
tere
d pu
blic
acc
ount
ing
firm
oth
er th
an E
rnst
& Yo
ung
LLP.
(a)
The
per
-sha
re d
ata
pres
ente
d ab
ove
is b
ased
upo
n th
e av
erag
e sh
ares
out
stan
ding
for t
he p
erio
ds p
rese
nted
.(b
) A
ssum
es in
itial
inve
stm
ent a
t net
ass
et v
alue
at t
he b
egin
ning
of e
ach
perio
d, re
inve
stm
ent o
f all
dist
ribut
ions
, the
com
plet
e re
dem
ptio
n of
the
inve
stm
ent a
t net
ass
et v
alue
at t
he e
nd o
f eac
h pe
riod
and
no s
ales
cha
rges
. Tot
al re
turn
wou
ld b
e re
duce
d if
sale
s ch
arge
s we
re ta
ken
into
acc
ount
.
Pioneer Fundamental Growth Fund | Annual Report | 3/31/19 27
The
acco
mpa
nyin
g no
tes
are
an in
tegr
al p
art o
f the
se fi
nanc
ial s
tate
men
ts.
Yea
r
Y
ear
Yea
r
Y
ear
Yea
r
E
nded
E
nded
E
nded
E
nded
E
nded
3/3
1/19
3/31
/18
3/31
/17*
3
/31/
16*
3
/31/
15*
Clas
s C
Net a
sset
valu
e, b
egin
ning
of p
erio
d
$
20.
73
$
1
9.17
$
17.
63
$
1
7.81
$
15.
66In
crea
se (d
ecre
ase)
from
inve
stm
ent o
pera
tions
:
Net
inve
stm
ent i
ncom
e (lo
ss)
$
(0
.08)
(a)(
b)
$
(0.0
8)(a
)(b)
$
(0
.05)
(a)(
b)
$
(0.0
5)(a
)(b)
$
(0
.03)
N
et re
alize
d an
d un
real
ized
gain
(los
s) o
n in
vest
men
ts
2.
51
2.65
1.
96
0.65
2.
65Ne
t inc
reas
e (d
ecre
ase)
from
inve
stm
ent o
pera
tions
$
2.43
$
2.
57
$
1.91
$
0.
60
$
2.62
Dist
ribut
ions
to s
hare
owne
rs:
N
et in
vest
men
t inc
ome
$
—
$
—
$
—
$
—
$
—
Net
real
ized
gain
(1.2
3)
(1
.01)
(0.3
7)
(0
.78)
(0.4
7)To
tal d
istrib
utio
ns
$
(
1.23
)
$
(1.
01)
$
(
0.37
)
$
(0.
78)
$
(
0.47
)Ne
t inc
reas
e (d
ecre
ase)
in n
et a
sset
valu
e
$
1.20
$
1.
56
$
1.54
$
(0.
18)
$
2.15
Net a
sset
valu
e, e
nd o
f per
iod
$
21.
93
$
2
0.73
$
19.
17
$
1
7.63
$
17.
81To
tal r
etur
n (c
)
12.
12%
1
3.46
%
10.
98%
3.29
%
16.
81%
Ratio
of n
et e
xpen
ses
to a
vera
ge n
et a
sset
s
1
.73%
1.74
%
1.
77%
1.77
%
1.
79%
Ratio
of n
et in
vest
men
t inc
ome
(loss
) to
aver
age
net a
sset
s
(0
.39)
%
(0.4
0)%
(0
.30)
%
(0.2
9)%
(0
.32)
%Po
rtfol
io tu
rnov
er ra
te
2
6%
38%
23
%
13%
12
%Ne
t ass
ets,
end
of p
erio
d (in
thou
sand
s)
$44
4,78
6
$4
73,1
54
$
465,
545
$356
,675
$24
6,59
3
*
The
Fun
d wa
s au
dite
d by
an
inde
pend
ent r
egis
tere
d pu
blic
acc
ount
ing
firm
oth
er th
an E
rnst
& Yo
ung
LLP.
(a)
The
per
-sha
re d
ata
pres
ente
d ab
ove
is b
ased
upo
n th
e av
erag
e sh
ares
out
stan
ding
for t
he p
erio
ds p
rese
nted
.(b
) T
he a
mou
nt s
hown
for a
sha
re o
utst
andi
ng d
oes
not c
orre
spon
d wi
th n
et in
vest
men
t inc
ome
on th
e St
atem
ent o
f Ope
ratio
ns fo
r the
per
iod
due
to ti
min
g of
the
sale
s an
d re
purc
hase
of s
hare
s.(c
) A
ssum
es in
itial
inve
stm
ent a
t net
ass
et v
alue
at t
he b
egin
ning
of e
ach
perio
d, re
inve
stm
ent o
f all
dist
ribut
ions
, the
com
plet
e re
dem
ptio
n of
the
inve
stm
ent a
t net
ass
et v
alue
at t
he e
nd o
f eac
h pe
riod
and
no s
ales
cha
rges
. Tot
al re
turn
wou
ld b
e re
duce
d if
sale
s ch
arge
s we
re ta
ken
into
acc
ount
.
28 Pioneer Fundamental Growth Fund | Annual Report | 3/31/19
The
acco
mpa
nyin
g no
tes
are
an in
tegr
al p
art o
f the
se fi
nanc
ial s
tate
men
ts.
Fina
ncia
l Hig
hlig
hts
(con
tinue
d)
Year
Yea
r
Ye
ar
Ye
ar
Ye
ar
En
ded
E
nded
E
nded
En
ded
End
ed
3/
31/1
9
3/3
1/18
3
/31/
17*
3/3
1/16
*
3
/31/
15*
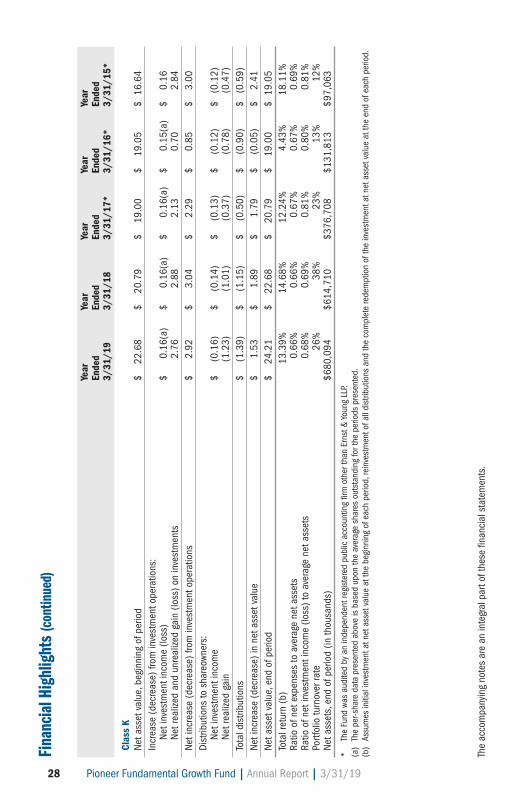
Clas
s K
Net a
sset
val
ue, b
egin
ning
of p
erio
d
$
22.
68
$
20.
79
$
19.
00
$
19.0
5
$
16.
64In
crea
se (d
ecre
ase)
from
inve
stm
ent o
pera
tions
:
Net i
nves
tmen
t inc
ome
(loss
)
$
0.1
6(a)
$
0.1
6(a)
$
0.1
6(a)
$
0.15
(a)
$
0.
16
Net r
ealiz
ed a
nd u
nrea
lized
gai
n (lo
ss) o
n in
vest
men
ts
2
.76
2.88
2.13
0
.70
2.
84Ne
t inc
reas
e (d
ecre
ase)
from
inve
stm
ent o
pera
tions
$
2.9
2
$
3.
04
$
2.
29
$
0.8
5
$
3
.00
Dist
ribut
ions
to s
hare
owne
rs:
Ne
t inv
estm
ent i
ncom
e
$
(0
.16)
$
(0
.14)
$
(0
.13)
$
(0.1
2)
$
(0.
12)
Ne
t rea
lized
gai
n
(1.
23)
(1
.01)
(0
.37)
(0.
78)
(
0.47
)To
tal d
istri
butio
ns
$
(1
.39)
$
(1
.15)
$
(0
.50)
$
(0.9
0)
$
(0.
59)
Net i
ncre
ase
(dec
reas
e) in
net
ass
et v
alue
$
1.
53
$
1.
89
$
1.
79
$
(0.0
5)
$
2
.41
Net a
sset
val
ue, e
nd o
f per
iod
$
24.
21
$
22.
68
$
20.
79
$
19.0
0
$
19.
05To
tal r
etur
n (b
)
13.
39%
14.
68%
12.
24%
4.4
3%
18.
11%
Ratio
of n
et e
xpen
ses
to a
vera
ge n
et a
sset
s
0
.66%
0
.66%
0
.67%
0.6
7%
0.
69%
Ratio
of n
et in
vest
men
t inc
ome
(loss
) to
aver
age
net a
sset
s
0
.68%
0
.69%
0
.81%
0.8
0%
0.
81%
Portf
olio
turn
over
rate
26%
38%
23%
1
3%
12%
Net a
sset
s, e
nd o
f per
iod
(in th
ousa
nds)
$
680,
094
$
614,
710
$
376,
708
$13
1,81
3
$
97,0
63
*
The
Fun
d wa
s au
dite
d by
an
inde
pend
ent r
egis
tere
d pu
blic
acc
ount
ing
firm
oth
er th
an E
rnst
& Yo
ung
LLP.
(a)
The
per
-sha
re d
ata
pres
ente
d ab
ove
is b
ased
upo
n th
e av
erag
e sh
ares
out
stan
ding
for t
he p
erio
ds p
rese
nted
.(b
) A
ssum
es in
itial
inve
stm
ent a
t net
ass
et v
alue
at t
he b
egin
ning
of e
ach
perio
d, re
inve
stm
ent o
f all
dist
ribut
ions
and
the
com
plet
e re
dem
ptio
n of
the
inve
stm
ent a
t net
ass
et v
alue
at t
he e
nd o
f eac
h pe
riod.
Pioneer Fundamental Growth Fund | Annual Report | 3/31/19 29
The
acco
mpa
nyin
g no
tes
are
an in
tegr
al p
art o
f the
se fi
nanc
ial s
tate
men
ts.
Yea
r
Y
ear
Yea
r
Y
ear
Yea
r
E
nded
E
nded
E
nded
E
nded
E
nded
3/3
1/19
3/31
/18
3/31
/17*
3
/31/
16*
3
/31/
15*
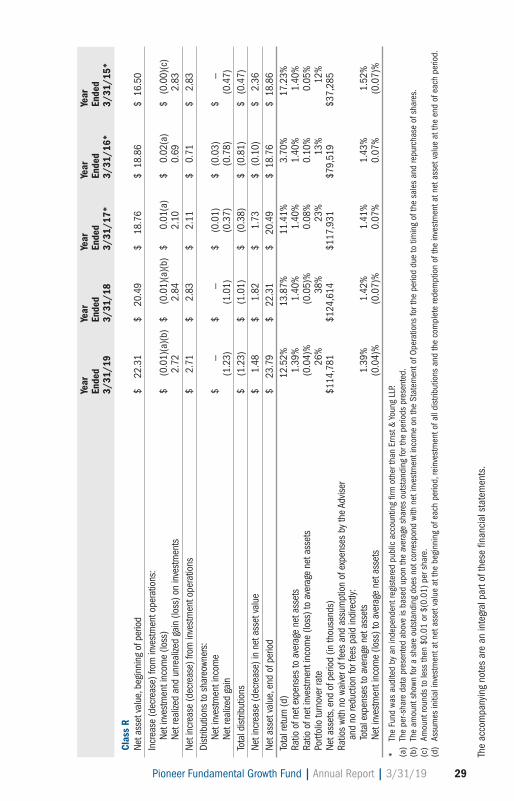
Clas
s R
Net a
sset
valu
e, b
egin
ning
of p
erio
d
$
22.
31
$
2
0.49
$
18.
76
$
18.
86
$ 1
6.50
Incr
ease
(dec
reas
e) fr
om in
vest
men
t ope
ratio
ns:
N
et in
vest
men
t inc
ome
(loss
)
$
(0.0
1)(a
)(b)
$
(0
.01)
(a)(
b)
$
0.0
1(a)
$
0.0
2(a)
$
(0.
00)(
c)
Net
real
ized
and
unre
alize
d ga
in (l
oss)
on
inve
stm
ents
2.72
2.
84
2.10
0.6
9
2.83
Net i
ncre
ase
(dec
reas
e) fr
om in
vest
men
t ope
ratio
ns
$
2.
71
$
2.83
$
2.
11
$
0
.71
$
2.8
3Di
strib
utio
ns to
sha
reow
ners
:
Net
inve
stm
ent i
ncom
e
$
—
$
—
$
(
0.01
)
$ (
0.03
)
$
—
Net
real
ized
gain
(1.2
3)
(1
.01)
(0.3
7)
(0.7
8)
(0
.47)
Tota
l dist
ribut
ions
$
(1.
23)
$
(
1.01
)
$
(0.
38)
$
(0.
81)
$ (
0.47
)Ne
t inc
reas
e (d
ecre
ase)
in n
et a
sset
valu
e
$
1.48
$
1.
82
$
1.73
$ (
0.10
)
$
2.
36Ne
t ass
et va
lue,
end
of p
erio
d
$
2
3.79
$
22.
31
$
2
0.49
$ 1
8.76
$
18.
86To
tal r
etur
n (d
)
12.
52%
1
3.87
%
11.
41%
3
.70%
1
7.23
%Ra
tio o
f net
exp
ense
s to
ave
rage
net
ass
ets
1.3
9%
1.
40%
1.40
%
1.4
0%
1.
40%
Ratio
of n
et in
vest
men
t inc
ome
(loss
) to
aver
age
net a
sset
s
(0
.04)
%
(0.0
5)%
0
.08%
0
.10%
0.05
%Po
rtfol
io tu
rnov
er ra
te
2
6%
38%
23
%
1
3%
12%
Net a
sset
s, en
d of
per
iod
(in th
ousa
nds)
$
114,
781
$124
,614
$11
7,93
1
$7
9,51
9
$
37,2
85Ra
tios
with
no
waive
r of f
ees
and
assu
mpt
ion
of e
xpen
ses
by th
e Ad
viser
and
no
redu
ctio
n fo
r fee
s pa
id in
dire
ctly:
To
tal e
xpen
ses
to a
vera
ge n
et a
sset
s
1
.39%
1.42
%
1.
41%
1
.43%
1.52
%
Net
inve
stm
ent i
ncom
e (lo
ss) t
o av
erag
e ne
t ass
ets
(0.
04)%
(0
.07)
%
0.0
7%
0.0
7%
(0.
07)%
*
The
Fun
d wa
s au
dite
d by
an
inde
pend
ent r
egis
tere
d pu
blic
acc
ount
ing
firm
oth
er th
an E
rnst
& Yo
ung
LLP.
(a)
The
per
-sha
re d
ata
pres
ente
d ab
ove
is b
ased
upo
n th
e av
erag
e sh
ares
out
stan
ding
for t
he p
erio
ds p
rese
nted
.(b
) T
he a
mou
nt s
hown
for a
sha
re o
utst
andi
ng d
oes
not c
orre
spon
d wi
th n
et in
vest
men
t inc
ome
on th
e St
atem
ent o
f Ope
ratio
ns fo
r the
per
iod
due
to ti
min
g of
the
sale
s an
d re
purc
hase
of s
hare
s.(c
) A
mou
nt ro
unds
to le
ss th
en $
0.01
or $
(0.0
1) p
er s
hare
.(d
) A
ssum
es in
itial
inve
stm
ent a
t net
ass
et v
alue
at t
he b
egin
ning
of e
ach
perio
d, re
inve
stm
ent o
f all
dist
ribut
ions
and
the
com
plet
e re
dem
ptio
n of
the
inve
stm
ent a
t net
ass
et v
alue
at t
he e
nd o
f eac
h pe
riod.
30 Pioneer Fundamental Growth Fund | Annual Report | 3/31/19
The
acco
mpa
nyin
g no
tes
are
an in
tegr
al p
art o
f the
se fi
nanc
ial s
tate
men
ts.
Fina
ncia
l Hig
hlig
hts
(con
tinue
d)
Yea
r
Ye
ar
Ye
ar
Ye
ar
Ye
ar
E
nded
E
nded
En
ded
End
ed
Ende
d
3
/31/
19
3/3
1/18
3
/31/
17*
3/3
1/16
*
3
/31/
15*
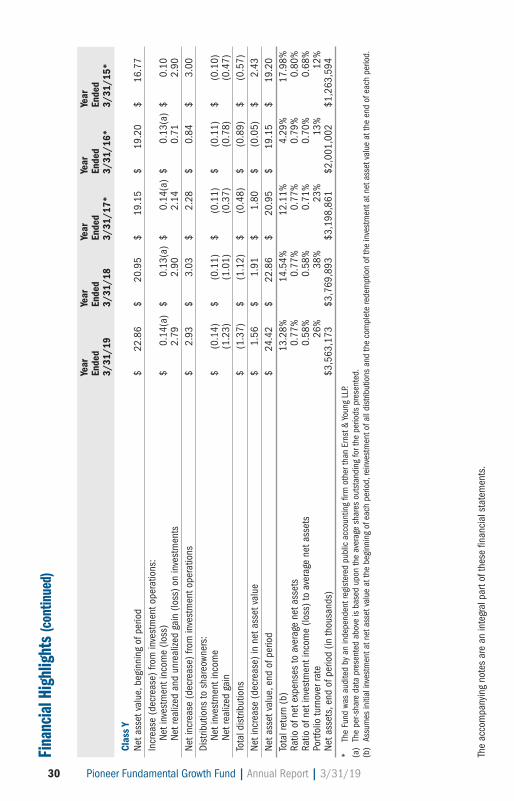
Clas
s Y
Net a
sset
val
ue, b
egin
ning
of p
erio
d
$
22.8
6
$
20.
95
$
19.1
5
$
19.2
0
$
16.7
7In
crea
se (d
ecre
ase)
from
inve
stm
ent o
pera
tions
:
Net i
nves
tmen
t inc
ome
(loss
)
$
0.14
(a)
$
0.13
(a)
$
0.14
(a)
$
0.13
(a)
$
0.10
Ne
t rea
lized
and
unr
ealiz
ed g
ain
(loss
) on
inve
stm
ents
2
.79
2.90
2
.14
0
.71
2
.90
Net i
ncre
ase
(dec
reas
e) fr
om in
vest
men
t ope
ratio
ns
$
2.
93
$
3.
03
$
2.2
8
$
0.8
4
$
3.0
0Di
strib
utio
ns to
sha
reow
ners
:
Net i
nves
tmen
t inc
ome
$
(0.1
4)
$
(0.1
1)
$
(0
.11)
$
(0.1
1)
$
(0
.10)
Ne
t rea
lized
gai
n
(1.2
3)
(1.0
1)
(
0.37
)
(0
.78)
(0.
47)
Tota
l dis
tribu
tions
$
(1.3
7)
$
(1.1
2)
$
(0
.48)
$
(0.8
9)
$
(0
.57)
Net i
ncre
ase
(dec
reas
e) in
net
ass
et v
alue
$
1.5
6
$
1.
91
$
1.8
0
$
(0.0
5)
$
2.43
Net a
sset
val
ue, e
nd o
f per
iod
$
24.4
2
$
22.
86
$
20.9
5
$
19.1
5
$
19.2
0To
tal r
etur
n (b
)
13.2
8%
1
4.54
%
12
.11%
4.2
9%
17
.98%
Ratio
of n
et e
xpen
ses
to a
vera
ge n
et a
sset
s
0.
77%
0.
77%
0.7
7%
0
.79%
0.8
0%Ra
tio o
f net
inve
stm
ent i
ncom
e (lo
ss) t
o av
erag
e ne
t ass
ets
0.5
8%
0.58
%
0
.71%
0.7
0%
0
.68%
Portf
olio
turn
over
rate
2
6%
38
%
23%
1
3%
12%
Net a
sset
s, e
nd o
f per
iod
(in th
ousa
nds)
$3,5
63,1
73
$
3,76
9,89
3
$3
,198
,861
$2,0
01,0
02
$1
,263
,594
*
The
Fun
d wa
s au
dite
d by
an
inde
pend
ent r
egis
tere
d pu
blic
acc
ount
ing
firm
oth
er th
an E
rnst
& Yo
ung
LLP.
(a)
The
per
-sha
re d
ata
pres
ente
d ab
ove
is b
ased
upo
n th
e av
erag
e sh
ares
out
stan
ding
for t
he p
erio
ds p
rese
nted
.(b
) A
ssum
es in
itial
inve
stm
ent a
t net
ass
et v
alue
at t
he b
egin
ning
of e
ach
perio
d, re
inve
stm
ent o
f all
dist
ribut
ions
and
the
com
plet
e re
dem
ptio
n of
the
inve
stm
ent a
t net
ass
et v
alue
at t
he e
nd o
f eac
h pe
riod.
Pioneer Fundamental Growth Fund | Annual Report | 3/31/19 31
Notes to Financial Statements | 3/31/19
1. Organization and Significant Accounting Policies
Pioneer Fundamental Growth Fund (the “Fund”) is one of three portfolioscomprising Pioneer Series Trust X, a Delaware statutory trust. The Fund isregistered under the Investment Company Act of 1940 as a diversified,open-end management investment company. The Fund’s investment objectiveis to seek long-term capital growth.
The Fund offers five classes of shares designated as Class A, Class C, Class K,Class R and Class Y shares. Each class of shares represents an interest in thesame portfolio of investments of the Fund and has identical rights (based onrelative net asset values) to assets and liquidation proceeds. Share classes canbear different rates of class-specific fees and expenses, such as transfer agentand distribution fees. Differences in class-specific fees and expenses will resultin differences in net investment income and, therefore, the payment ofdifferent dividends from net investment income earned by each class. TheAmended and Restated Declaration of Trust of the Fund gives the Board ofTrustees the flexibility to specify either per-share voting or dollar-weightedvoting when submitting matters for shareowner approval. Under per-sharevoting, each share of a class of the Fund is entitled to one vote. Under dollar-weighted voting, a shareowner’s voting power is determined not by thenumber of shares owned, but by the dollar value of the shares on the recorddate. Each share class has exclusive voting rights with respect to mattersaffecting only that class, including with respect to the distribution plan for thatclass. There is no distribution plan for Class K or Class Y shares.
Amundi Pioneer Asset Management, Inc., an indirect wholly owned subsidiaryof Amundi and Amundi’s wholly owned subsidiary, Amundi USA, Inc., servesas the Fund’s investment adviser (the “Adviser”). Amundi Pioneer Distributor,Inc., an affiliate of Amundi Pioneer Asset Management, Inc., serves as theFund’s distributor (the “Distributor”).
In August 2018, the Securities and Exchange Commission (“SEC”) released aDisclosure Update and Simplification Final Rule. The Final Rule amendsRegulation S-X disclosures requirements to conform them to U.S. GenerallyAccepted Accounting Principles (“U.S. GAAP”) for investment companies. TheFund’s financial statements were prepared in compliance with the newamendments to Regulation S-X.
The Fund is an investment company and follows investment companyaccounting and reporting guidance under U.S. GAAP. U.S. GAAP requires themanagement of the Fund to make estimates and assumptions that affect thereported amounts of assets and liabilities, the disclosure of contingent assets
32 Pioneer Fundamental Growth Fund | Annual Report | 3/31/19
and liabilities at the date of the financial statements, and the reported amountsof income, expenses and gain or loss on investments during the reportingperiod. Actual results could differ from those estimates.
The following is a summary of significant accounting policies followed by theFund in the preparation of its financial statements:
A. Security ValuationThe net asset value of the Fund is computed once daily, on each day theNew York Stock Exchange (“NYSE”) is open, as of the close of regular tradingon the NYSE.
Equity securities that have traded on an exchange are valued by using the lastsale price on the principal exchange where they are traded. Equity securitiesthat have not traded on the date of valuation, or securities for which saleprices are not available, generally are valued using the mean between the lastbid and asked prices or, if both last bid and asked prices are not available, atthe last quoted bid price. Last sale and bid and asked prices are provided byindependent third party pricing services. In the case of equity securities nottraded on an exchange, prices are typically determined by independent thirdparty pricing services using a variety of techniques and methods.
The value of foreign securities is translated into U.S. dollars based on foreigncurrency exchange rate quotations supplied by a third party pricing source.Trading in non-U.S. equity securities is substantially completed each day atvarious times prior to the close of the NYSE. The values of such securitiesused in computing the net asset value of the Fund’s shares are determined asof such times. The Fund may use a fair value model developed by anindependent pricing service to value non-U.S. equity securities.
Fixed-income securities are valued by using prices supplied by independentpricing services, which consider such factors as market prices, market events,quotations from one or more brokers, Treasury spreads, yields, maturities andratings, or may use a pricing matrix or other fair value methods or techniquesto provide an estimated value of the security or instrument. A pricing matrixis a means of valuing a debt security on the basis of current market prices forother debt securities, historical trading patterns in the market for fixed-income securities and/or other factors. Non-U.S. debt securities that are listedon an exchange will be valued at the bid price obtained from an independentthird party pricing service. When independent third party pricing servicesare unable to supply prices, or when prices or market quotations areconsidered to be unreliable, the value of that security may be determinedusing quotations from one or more broker-dealers.
Pioneer Fundamental Growth Fund | Annual Report | 3/31/19 33
Securities for which independent pricing services or broker-dealers areunable to supply prices or for which market prices and/or quotations are notreadily available or are considered to be unreliable are valued by a fairvaluation team comprised of certain personnel of the Adviser pursuant toprocedures adopted by the Fund’s Board of Trustees. The Adviser’s fairvaluation team uses fair value methods approved by the Valuation Committeeof the Board of Trustees. The Adviser’s fair valuation team is responsible formonitoring developments that may impact fair valued securities and fordiscussing and assessing fair values on an ongoing basis, and at leastquarterly, with the Valuation Committee of the Board of Trustees.
Inputs used when applying fair value methods to value a security may includecredit ratings, the financial condition of the company, current marketconditions and comparable securities. The Fund may use fair value methodsif it is determined that a significant event has occurred after the close of theexchange or market on which the security trades and prior to thedetermination of the Fund’s net asset value. Examples of a significant eventmight include political or economic news, corporate restructurings, naturaldisasters, terrorist activity or trading halts. Thus, the valuation of the Fund’ssecurities may differ significantly from exchange prices, and such differencescould be material.
At March 31, 2019, no securities were valued using fair value methods (otherthan securities valued using prices supplied by independent pricing services,broker-dealers or using a third party insurance industry pricing model).
B. Investment Income and TransactionsDividend income is recorded on the ex-dividend date, except that certaindividends from foreign securities where the ex-dividend date may havepassed are recorded as soon as the Fund becomes aware of the ex-dividenddata in the exercise of reasonable diligence.
Interest income, including interest on income-bearing cash accounts, isrecorded on the accrual basis. Dividend and interest income are reported netof unrecoverable foreign taxes withheld at the applicable country rates andnet of income accrued on defaulted securities.
Interest and dividend income payable by delivery of additional shares isreclassified as PIK (payment-in-kind) income upon receipt and is included ininterest and dividend income, respectively.
Security transactions are recorded as of trade date. Gains and losses on salesof investments are calculated on the identified cost method for both financialreporting and federal income tax purposes.
34 Pioneer Fundamental Growth Fund | Annual Report | 3/31/19
C. Federal Income TaxesIt is the Fund’s policy to comply with the requirements of the InternalRevenue Code applicable to regulated investment companies and todistribute all of its net taxable income and net realized capital gains, if any, toits shareowners. Therefore, no provision for federal income taxes is required.As of March 31, 2019, the Fund did not accrue any interest or penalties withrespect to uncertain tax positions, which, if applicable, would be recorded asan income tax expense on the Statement of Operations. Tax returns filedwithin the prior three years remain subject to examination by federal andstate tax authorities.
The amount and character of income and capital gain distributions toshareowners are determined in accordance with federal income tax rules,which may differ from U.S. GAAP. Distributions in excess of net investmentincome or net realized gains are temporary over distributions for financialstatement purposes resulting from differences in the recognition orclassification of income or distributions for financial statement and taxpurposes. Capital accounts within the financial statements are adjusted forpermanent book/tax differences to reflect tax character, but are not adjustedfor temporary differences.
The tax character of distributions paid during the years ended March 31,2019 and March 31, 2018, was as follows:
2019 2018
Distributions paid from:Ordinary income $ 34,716,252 $ 36,554,386Long-term capital gain 297,600,067 260,306,413
Total $332,316,319 $296,860,799
The following shows the components of distributable earnings on a federalincome tax basis at March 31, 2019:
2019
Distributable earnings:Undistributed ordinary income $ 4,403,055Undistributed long-term capital gain 116,246,406Unrealized appreciation 1,948,226,561
Total $2,068,876,022
The difference between book-basis and tax-basis unrealized appreciation isattributable to the tax deferral of losses on wash sales and tax basisadjustments on common stock.

Pioneer Fundamental Growth Fund | Annual Report | 3/31/19 35
D. Fund SharesThe Fund records sales and repurchases of its shares as of trade date. TheDistributor earned $146,131 in underwriting commissions on the sale ofClass A shares during the year ended March 31, 2019.
E. Class AllocationsIncome, common expenses and realized and unrealized gains and losses arecalculated at the Fund level and allocated daily to each class of shares basedon its respective percentage of adjusted net assets at the beginning of the day.
Distribution fees are calculated based on the average daily net asset valueattributable to Class A, Class C and Class R shares of the Fund, respectively(see Note 4). Class K and Class Y shares do not pay distribution fees. Allexpenses and fees paid to the Fund’s transfer agent for its services are allocatedamong the classes of shares based on the number of accounts in each class andthe ratable allocation of related out-of-pocket expenses (see Note 3).
Distributions to shareowners are recorded as of the ex-dividend date.Distributions paid by the Fund with respect to each class of shares arecalculated in the same manner and at the same time, except that netinvestment income dividends to Class A, Class C, Class K, Class R and Class Yshares can reflect different transfer agent and distribution expense rates.
F. RisksThe value of securities held by the Fund may go up or down, sometimesrapidly or unpredictably, due to general market conditions, such as real orperceived adverse economic, political or regulatory conditions, inflation,changes in interest rates, lack of liquidity in the bond markets or adverseinvestor sentiment. In the past several years, financial markets haveexperienced increased volatility, depressed valuations, decreased liquidityand heightened uncertainty. These conditions may continue, recur, worsenor spread.
At times, the Fund’s investments may represent industries or industry sectorsthat are interrelated or have common risks, making the Fund moresusceptible to any economic, political, or regulatory developments or otherrisks affecting those industries and sectors. The Fund’s investments in foreignmarkets and countries with limited developing markets may subject the Fundto a greater degree of risk than investments in a developed market. Theserisks include disruptive political or economic conditions and the impositionof adverse governmental laws or currency exchange restrictions.
With the increased use of technologies such as the Internet to conductbusiness, the Fund is susceptible to operational, information security andrelated risks. While the Fund’s Adviser has established business continuityplans in the event of, and risk management systems to prevent, limit or

36 Pioneer Fundamental Growth Fund | Annual Report | 3/31/19
mitigate, such cyber-attacks, there are inherent limitations in such plans andsystems, including the possibility that certain risks have not been identified.Furthermore, the Fund cannot control the cybersecurity plans and systemsput in place by service providers to the Fund such as Brown BrothersHarriman & Co., the Fund’s custodian and accounting agent, and DST AssetManager Solutions, Inc., the Fund’s transfer agent. In addition, manybeneficial owners of Fund shares hold them through accounts atbroker-dealers, retirement platforms and other financial market participantsover which neither the Fund nor Amundi Pioneer exercises control. Each ofthese may in turn rely on service providers to them, which are also subject tothe risk of cyber-attacks. Cybersecurity failures or breaches at AmundiPioneer or the Fund’s service providers or intermediaries have the ability tocause disruptions and impact business operations, potentially resulting infinancial losses, interference with the Fund’s ability to calculate its net assetvalue, impediments to trading, the inability of Fund shareowners to effectshare purchases, redemptions or exchanges or receive distributions, loss of orunauthorized access to private shareowner information and violations ofapplicable privacy and other laws, regulatory fines, penalties, reputationaldamage, or additional compliance costs. Such costs and losses may not becovered under any insurance. In addition, maintaining vigilance againstcyber-attacks may involve substantial costs over time, and systemenhancements may themselves be subject to cyber-attacks.
The Fund’s prospectus contains unaudited information regarding the Fund’sprincipal risks. Please refer to that document when considering the Fund’sprincipal risks.
G. Repurchase AgreementsRepurchase agreements are arrangements under which the Fund purchasessecurities from a broker-dealer or a bank, called the counterparty, upon theagreement of the counterparty to repurchase the securities from the Fund at alater date, and at a specific price, which is typically higher than the purchaseprice paid by the Fund. The securities purchased serve as the Fund’s collateralfor the obligation of the counterparty to repurchase the securities. The valueof the collateral, including accrued interest, is required to be equal to or inexcess of the repurchase price. The collateral for all repurchase agreements isheld in safekeeping in the customer-only account of the Fund’s custodian or asub-custodian of the Fund. The Adviser is responsible for determining thatthe value of the collateral remains at least equal to the repurchase price. In theevent of a default by the counterparty, the Fund is entitled to sell thesecurities, but the Fund may not be able to sell them for the price at which

Pioneer Fundamental Growth Fund | Annual Report | 3/31/19 37
they were purchased, thus causing a loss to the Fund. Additionally, if thecounterparty becomes insolvent, there is some risk that the Fund will nothave a right to the securities, or the immediate right to sell the securities.
There were no open repurchase agreements at March 31, 2019.
2. Management Agreement
The Adviser manages the Fund’s portfolio. Effective October 1, 2018,management fees are calculated daily at the annual rate of 0.65% of the Fund’saverage daily net assets up to $1 billion, 0.60% of the next $6.5 billion and0.55% on assets over $7.5 billion. Prior to October 1, 2018 management feeswere calculated daily at the annual rate of 0.65% of the Fund’s average daily netassets up to $1 billion and 0.60% on assets over $1 billion. For the year endedMarch 31, 2019, the effective management fee (excluding waivers and/orassumption of expenses) was equivalent to 0.61% of the Fund’s average dailynet assets.
The Adviser has contractually agreed to limit ordinary operating expenses(ordinary operating expenses means all fund expenses other than extraordinaryexpenses, such as litigation, taxes, brokerage commissions and acquired fundfees and expenses) of the Fund to the extent required to reduce Fund expensesto 1.09%, 1.40% and 0.83% of the average daily net assets attributable toClass A, Class R, and Class Y shares, respectively. These expense limitations arein effect through August 1, 2019. There can be no assurance that the Adviserwill extend the expense limitation agreement for a class of shares beyond thedate referred to above. Class C and Class K shares do not have an expenselimitation. Fees waived and expenses reimbursed during the year endedMarch 31, 2019 are reflected on the Statement of Operations.
In addition, under the management and administration agreements, certainother services and costs, including accounting, regulatory reporting andinsurance premiums, are paid by the Fund as administrative reimbursements.Included in “Due to affiliates” reflected on the Statement of Assets andLiabilities is $544,768 in management fees, administrative costs and certainother reimbursements payable to the Adviser at March 31, 2019.
3. Transfer Agent
DST Asset Manager Solutions, Inc. serves as the transfer agent to the Fund atnegotiated rates. Transfer agent fees and payables shown on the Statement ofOperations and the Statement of Assets and Liabilities, respectively, includesub-transfer agent expenses incurred through the Fund’s omnibus relationshipcontracts.
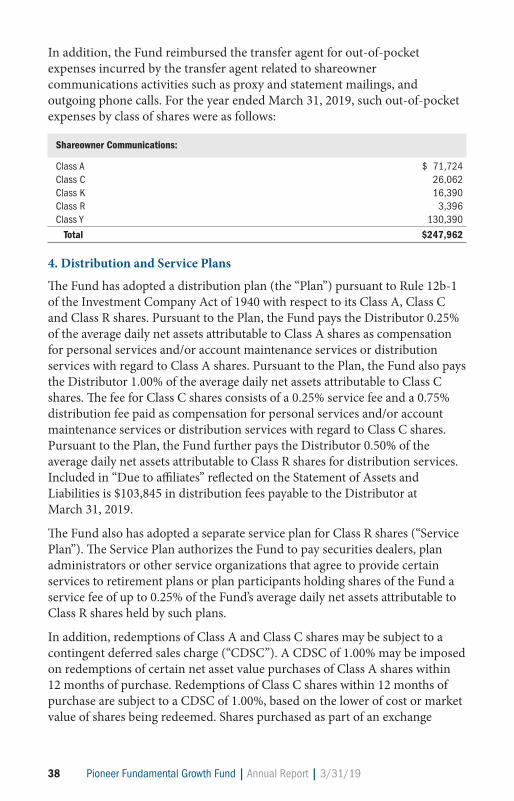
38 Pioneer Fundamental Growth Fund | Annual Report | 3/31/19
In addition, the Fund reimbursed the transfer agent for out-of-pocketexpenses incurred by the transfer agent related to shareownercommunications activities such as proxy and statement mailings, andoutgoing phone calls. For the year ended March 31, 2019, such out-of-pocketexpenses by class of shares were as follows:
Shareowner Communications:
Class A $ 71,724Class C 26,062Class K 16,390Class R 3,396Class Y 130,390
Total $247,962
4. Distribution and Service Plans
The Fund has adopted a distribution plan (the “Plan”) pursuant to Rule 12b-1of the Investment Company Act of 1940 with respect to its Class A, Class Cand Class R shares. Pursuant to the Plan, the Fund pays the Distributor 0.25%of the average daily net assets attributable to Class A shares as compensationfor personal services and/or account maintenance services or distributionservices with regard to Class A shares. Pursuant to the Plan, the Fund also paysthe Distributor 1.00% of the average daily net assets attributable to Class Cshares. The fee for Class C shares consists of a 0.25% service fee and a 0.75%distribution fee paid as compensation for personal services and/or accountmaintenance services or distribution services with regard to Class C shares.Pursuant to the Plan, the Fund further pays the Distributor 0.50% of theaverage daily net assets attributable to Class R shares for distribution services.Included in “Due to affiliates” reflected on the Statement of Assets andLiabilities is $103,845 in distribution fees payable to the Distributor atMarch 31, 2019.
The Fund also has adopted a separate service plan for Class R shares (“ServicePlan”). The Service Plan authorizes the Fund to pay securities dealers, planadministrators or other service organizations that agree to provide certainservices to retirement plans or plan participants holding shares of the Fund aservice fee of up to 0.25% of the Fund’s average daily net assets attributable toClass R shares held by such plans.
In addition, redemptions of Class A and Class C shares may be subject to acontingent deferred sales charge (“CDSC”). A CDSC of 1.00% may be imposedon redemptions of certain net asset value purchases of Class A shares within12 months of purchase. Redemptions of Class C shares within 12 months ofpurchase are subject to a CDSC of 1.00%, based on the lower of cost or marketvalue of shares being redeemed. Shares purchased as part of an exchange

Pioneer Fundamental Growth Fund | Annual Report | 3/31/19 39
remain subject to any CDSC that applied to the original purchase of thoseshares. There is no CDSC for Class K, Class R or Class Y shares. Proceeds fromthe CDSCs are paid to the Distributor. For the year ended March 31, 2019,CDSCs in the amount of $40,646 were paid to the Distributor.
5. Line of Credit Facility
The Fund, along with certain other funds in the Pioneer Family of Funds (the“Funds”), participates in a committed, unsecured revolving line of creditfacility. Borrowings are used solely for temporary or emergency purposes. TheFund may borrow up to the lesser of the amount available under the facility orthe limits set for borrowing by the Fund’s prospectus and the 1940 Act.Effective August 1, 2018, the Fund participates in a credit facility in theamount of $250 million. Prior to August 1, 2018, the credit facility was in theamount of $195 million. Under such facility, depending on the type of loan,interest on borrowings is payable at the London Interbank Offered Rate(“LIBOR”) plus 0.90% on an annualized basis, or the Alternate Base Rate,which is the greater of (a) the facility’s administrative agent’s daily announcedprime rate on the borrowing date, (b) 2% plus the Federal Funds Rate on theborrowing date, or (c) 2% plus the overnight Eurodollar rate on the borrowingdate. The Funds pay an annual commitment fee to participate in a creditfacility. The commitment fee is allocated among participating Funds based onan allocation schedule set forth in the credit agreement.
For the year ended March 31, 2019, the average daily amount of borrowingsoutstanding during the period was $8,300,000. The related weighted averageannualized interest rate for the period was 3.30%, and the total interestexpense on such borrowings was $6,848, which is shown as Interest expense,located on the Statement of Operations.
40 Pioneer Fundamental Growth Fund | Annual Report | 3/31/19
Report of Independent Registered Public Accounting Firm
To the Board of Trustees of Pioneer Series Trust X and the Shareholders of Pioneer Fundamental Growth Fund:
Opinion on the Financial StatementsWe have audited the accompanying statement of assets and liabilities ofPioneer Fundamental Growth Fund (the “Fund”) (one of the fundsconstituting Pioneer Series Trust X (the “Trust”)), including the schedule ofinvestments, as of March 31, 2019, and the related statements of operations,changes in net assets and the financial highlights for the year then ended andthe related notes, and the statement of changes in net assets and financialhighlights for the year ended March 31, 2018 (collectively referred to as the“financial statements”). The financial highlights for the periods endedMarch 31, 2015, March 31, 2016 and March 31, 2017 were audited by anotherindependent registered public accounting firm whose report, dated May 26,2017, expressed an unqualified opinion on those financial highlights. In ouropinion, the financial statements present fairly, in all material respects, thefinancial position of Pioneer Fundamental Growth Fund (one of the fundsconstituting Pioneer Series Trust X) at March 31, 2019, the results of itsoperations, the changes in its net assets, and the financial highlights for theyear ended, and the statement of changes in net assets and the financialhighlights for the year ended March 31, 2018, in conformity with U.S.generally accepted accounting principles.
Basis for Opinion These financial statements are the responsibility of the Trust’s management.Our responsibility is to express an opinion on the Fund’s financial statementsbased on our audits. We are a public accounting firm registered with the PublicCompany Accounting Oversight Board (United States) (“PCAOB”) and arerequired to be independent with respect to the Trust in accordance with theU.S. federal securities laws and the applicable rules and regulations of theSecurities and Exchange Commission and the PCAOB.
We conducted our audits in accordance with the standards of the PCAOB.Those standards require that we plan and perform the audit to obtainreasonable assurance about whether the financial statements are free ofmaterial misstatement, whether due to error or fraud. The Trust is not requiredto have, nor were we engaged to perform, an audit of the Trust’s internalcontrol over financial reporting. As part of our audits, we are required to

Pioneer Fundamental Growth Fund | Annual Report | 3/31/19 41
obtain an understanding of internal control over financial reporting, but notfor the purpose of expressing an opinion on the effectiveness of the Trust’sinternal control over financial reporting. Accordingly, we express no suchopinion.
Our audits included performing procedures to assess the risks of materialmisstatement of the financial statements, whether due to error or fraud, andperforming procedures that respond to those risks. Such procedures includedexamining, on a test basis, evidence regarding the amounts and disclosures inthe financial statements. Our procedures included confirmation of securitiesowned as of March 31, 2019, by correspondence with the custodian andbrokers. Our audits also included evaluating the accounting principles usedand significant estimates made by management, as well as evaluating theoverall presentation of the financial statements. We believe that our auditsprovide a reasonable basis for our opinion.
We have served as the Trust’s auditor since 2017.
Boston, MassachusettsMay 30, 2019

42 Pioneer Fundamental Growth Fund | Annual Report | 3/31/19
ADDITIONAL INFORMATION (unaudited)
For the year ended March 31, 2018, certain dividends paid by the Fund may besubject to a maximum tax rate of 15%, as provided for by the Jobs and GrowthTax Relief Reconciliation Act (the Act) of 2003. The Fund intends to designateup to the maximum amount of such dividends allowable under the Act, astaxed at a maximum rate of 15%. Complete information will be computed andreported in conjunction with your 2019 Form 1099-DIV.
The qualifying percentage of the Fund’s ordinary income dividends for thepurpose of the corporate dividends received deduction was 100.00%.
Pioneer Fundamental Growth Fund | Annual Report | 3/31/19 43
Trustees, Officers and Service Providers
Investment AdviserAmundi Pioneer Asset Management, Inc.
Custodian and Sub-AdministratorBrown Brothers Harriman & Co.
Independent Registered Public Accounting FirmErnst & Young LLP
Principal Underwriter Amundi Pioneer Distributor, Inc.
Legal CounselMorgan, Lewis & Bockius LLP
Shareowner Services and Transfer AgentDST Asset Manager Solutions, Inc.
Proxy Voting Policies and Procedures of the Fund are available without charge,upon request, by calling our toll free number (1-800-225-6292). Informationregarding how the Fund voted proxies relating to portfolio securities during themost recent 12-month period ended June 30 is publicly available to shareownersat www.amundipioneer.com. This information is also available on the Securitiesand Exchange Commission’s web site at www.sec.gov.
Trustees and Officers
The Fund’s Trustees and Officers are listed below, together with their principaloccupations and other directorships they have held during at least the past fiveyears. Trustees who are interested persons of the Fund within the meaning ofthe 1940 Act are referred to as Interested Trustees. Trustees who are notinterested persons of the Fund are referred to as Independent Trustees. Each ofthe Trustees serves as a Trustee of each of the 43 U.S. registered investmentportfolios for which Amundi Pioneer serves as investment adviser (the“Pioneer Funds”). The address for all Trustees and all officers of the Fund is60 State Street, Boston, Massachusetts 02109.
The Statement of Additional Information of the Fund includes additionalinformation about the Trustees and is available, without charge, upon request,by calling 1-800-225-6292.

44 Pioneer Fundamental Growth Fund | Annual Report | 3/31/19
Inde
pend
ent T
rust
ees
Nam
e, A
ge a
nd P
ositi
on
Term
of O
ffice
and
Othe
r Dire
ctor
ship
sH
eld
With
the
Fund
Leng
th o
f Ser
vice
Prin
cipa
l Occ
upat
ion
H
eld
by Tr
uste
e
Thom
as J.
Per
na (
68)
Trust
ee s
ince
200
6.
Priva
te in
vest
or (2
004
– 20
08 a
nd 2
013
– pr
esen
t); C
hairm
an (2
008
– 20
13) a
nd
Dire
ctor
, Bro
adrid
ge F
inan
cial S
olut
ions
, Ch
airm
an o
f the
Boa
rd
Serv
es u
ntil
a su
cces
sor
Chie
f Exe
cutiv
e Of
ficer
(200
8 –
2012
), Qu
adris
erv,
Inc.
(tech
nolo
gy p
rodu
cts
for
Inc.
(inve
stor
com
mun
icatio
ns a
nd
and
Trust
eetru
stee
is e
lect
ed o
r se
curit
ies
lend
ing
indu
stry
); an
d Se
nior
Exe
cutiv
e Vi
ce P
resid
ent,
The
Bank
of
secu
ritie
s pr
oces
sing
prov
ider
for fi
nanc
ial
earli
er re
tirem
ent o
r Ne
w Yo
rk (fi
nanc
ial a
nd s
ecur
ities
ser
vices
) (19
86 –
200
4)se
rvice
s in
dust
ry) (
2009
– p
rese
nt);
rem
oval
. Di
rect
or, Q
uadr
iserv,
Inc.
(200
5 –
2013
);an
d Co
mm
issio
ner,
New
Jers
ey S
tate
Civi
lSe
rvice
Com
miss
ion
(201
1 –
2015
)
Davi
d R.
Boc
k (7
5)Tru
stee
sin
ce 2
005.
M
anag
ing
Partn
er, F
eder
al C
ity C
apita
l Adv
isors
(cor
pora
te a
dviso
ry s
ervic
es
Dire
ctor
of N
ew Yo
rk M
ortg
age
Trust
Tru
stee
Serv
es u
ntil
a su
cces
sor
com
pany
) (19
97 –
200
4 an
d 20
08 –
pre
sent
); In
terim
Chi
ef E
xecu
tive
Offic
er,
(pub
licly-
trade
d m
ortg
age
REIT)
tru
stee
is e
lect
ed o
r Ox
ford
Ana
lytica
, Inc
. (pr
ivate
ly he
ld re
sear
ch a
nd c
onsu
lting
com
pany
) (20
10);
(200
4 –
2009
, 201
2 –
pres
ent);
Dire
ctor
ea
rlier
retir
emen
t or
Exec
utive
Vice
Pre
siden
t and
Chi
ef F
inan
cial O
ffice
r, I-t
rax,
Inc.
(pub
licly
trade
d of
The
Swiss
Hel
vetia
Fun
d, In
c. re
mov
al.
heal
th c
are
serv
ices
com
pany
) (20
04 –
200
7); a
nd E
xecu
tive
Vice
Pre
siden
t and
(c
lose
d-en
d fu
nd) (
2010
– 2
017)
; Ch
ief F
inan
cial O
ffice
r, Pe
dest
al In
c. (in
tern
et-b
ased
mor
tgag
e tra
ding
com
pany
) Di
rect
or o
f Oxfo
rd A
nalyt
ica, I
nc.
(200
0 –
2002
); Pr
ivate
Con
sulta
nt (1
995
– 19
97);
Man
agin
g Di
rect
or, L
ehm
an
(200
8 –
2015
); an
d Di
rect
or o
f Ent
erpr
ise
Brot
hers
(199
2 –
1995
); an
d Ex
ecut
ive, T
he W
orld
Ban
k (1
979
– 19
92)
Com
mun
ity In
vest
men
t, In
c. (p
rivat
ely-
held
af
ford
able
hou
sing
finan
ce c
ompa
ny)
(198
5 –
2010
)
Benj
amin
M. F
riedm
an (
74)
Trust
ee s
ince
200
8.
Willi
am Jo
seph
Mai
er P
rofe
ssor
of P
oliti
cal E
cono
my,
Harv
ard
Unive
rsity
Tru
stee
, Mel
lon
Inst
itutio
nal F
unds
Tru
stee
Serv
es u
ntil
a su
cces
sor
(197
2 –
pres
ent)
Inve
stm
ent T
rust
and
Mel
lon
Inst
itutio
nal
trust
ee is
ele
cted
or
Fund
s M
aste
r Por
tfolio
(ove
rsaw
ea
rlier
retir
emen
t or
17 p
ortfo
lios
in fu
nd c
ompl
ex)
rem
oval
. (1
989
–20
08)
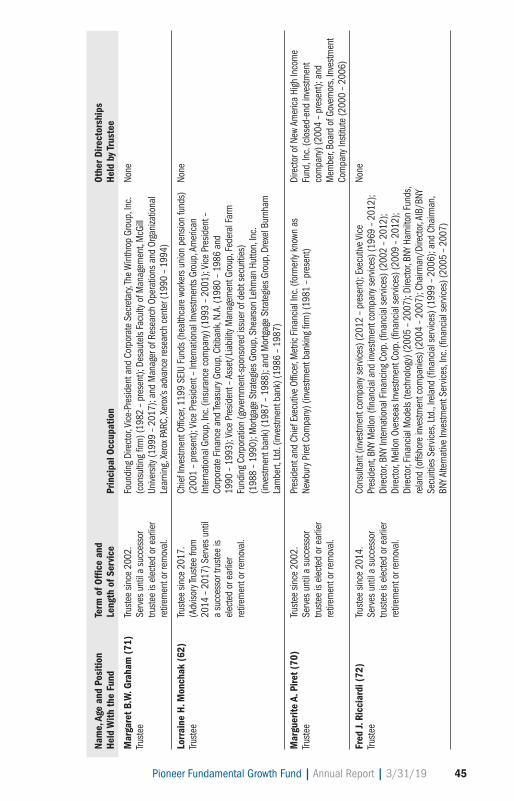
Pioneer Fundamental Growth Fund | Annual Report | 3/31/19 45
Nam
e, A
ge a
nd P
ositi
on
Term
of O
ffice
and
Othe
r Dire
ctor
ship
sH
eld
With
the
Fund
Leng
th o
f Ser
vice
Prin
cipa
l Occ
upat
ion
H
eld
by Tr
uste
e
Mar
gare
t B.W
. Gra
ham
(71
)Tru
stee
sin
ce 2
002.
Fo
undi
ng D
irect
or, V
ice-P
resid
ent a
nd C
orpo
rate
Sec
reta
ry, Th
e W
inth
rop
Grou
p, In
c. No
neTru
stee
Serv
es u
ntil
a su
cces
sor
(con
sulti
ng fi
rm) (
1982
– p
rese
nt);
Desa
utel
s Fa
culty
of M
anag
emen
t, M
cGill
trust
ee is
ele
cted
or e
arlie
r Un
ivers
ity (1
999
– 20
17);
and
Man
ager
of R
esea
rch
Oper
atio
ns a
nd O
rgan
izatio
nal
retir
emen
t or r
emov
al.
Lear
ning
, Xer
ox P
ARC,
Xer
ox’s
adva
nce
rese
arch
cen
ter (
1990
–19
94)
Lorr
aine
H. M
onch
ak (
62)
Trust
ee s
ince
201
7.
Chie
f Inv
estm
ent O
ffice
r, 11
99 S
EIU
Fund
s (h
ealth
care
wor
kers
uni
on p
ensio
n fu
nds)
No
neTru
stee
(Adv
isory
Trus
tee
from
(2
001
– pr
esen
t); V
ice P
resid
ent –
Inte
rnat
iona
l Inv
estm
ents
Gro
up, A
mer
ican
2014
–20
17) S
erve
s un
til
Inte
rnat
iona
l Gro
up, I
nc. (
insu
ranc
e co
mpa
ny) (
1993
– 2
001)
; Vice
Pre
siden
t –
a su
cces
sor t
rust
ee is
Co
rpor
ate
Fina
nce
and
Treas
ury G
roup
, Citi
bank
, N.A
. (19
80 –
198
6 an
d el
ecte
d or
ear
lier
1990
– 1
993)
; Vice
Pre
siden
t – A
sset
/Lia
bilit
y Man
agem
ent G
roup
, Fed
eral
Far
m
retir
emen
t or r
emov
al.
Fund
ing
Corp
orat
ion
(gov
ernm
ent-s
pons
ored
issu
er o
f deb
t sec
uriti
es)
(198
8 –
1990
); M
ortg
age
Stra
tegi
es G
roup
, She
arso
n Le
hman
Hut
ton,
Inc.
(inve
stm
ent b
ank)
(198
7 –
1988
); an
d M
ortg
age
Stra
tegi
es G
roup
, Dre
xel B
urnh
am
Lam
bert,
Ltd
. (in
vest
men
t ban
k) (1
986
– 19
87)
Mar
guer
ite A
. Pire
t (70
)Tru
stee
sin
ce 2
002.
Pr
esid
ent a
nd C
hief
Exe
cutiv
e Of
ficer
, Met
ric F
inan
cial I
nc. (
form
erly
know
n as
Di
rect
or o
f New
Am
erica
Hig
h In
com
e Tru
stee
Serv
es u
ntil
a su
cces
sor
Newb
ury P
iret C
ompa
ny) (
inve
stm
ent b
ankin
g fir
m) (
1981
– p
rese
nt)
Fund
, Inc
. (clo
sed-
end
inve
stm
ent
trust
ee is
ele
cted
or e
arlie
r co
mpa
ny) (
2004
– p
rese
nt);
and
retir
emen
t or r
emov
al.
Mem
ber,
Boar
d of
Gov
erno
rs, I
nves
tmen
t Co
mpa
ny In
stitu
te (2
000
– 20
06)
Fred
J. R
icci
ardi
(72
)Tru
stee
sin
ce 2
014.
Co
nsul
tant
(inv
estm
ent c
ompa
ny s
ervic
es) (
2012
– p
rese
nt);
Exec
utive
Vice
No
neTru
stee
Serv
es u
ntil
a su
cces
sor
Pres
iden
t, BN
Y M
ello
n (fi
nanc
ial a
nd in
vest
men
t com
pany
ser
vices
) (19
69 –
201
2);
trust
ee is
ele
cted
or e
arlie
r Di
rect
or, B
NY In
tern
atio
nal F
inan
cing
Corp
. (fin
ancia
l ser
vices
) (20
02 –
201
2);
retir
emen
t or r
emov
al.
Dire
ctor
, Mel
lon
Over
seas
Inve
stm
ent C
orp.
(fina
ncia
l ser
vices
) (20
09 –
201
2);
Dire
ctor
, Fin
ancia
l Mod
els
(tech
nolo
gy) (
2005
–20
07);
Dire
ctor
, BNY
Ham
ilton
Fun
ds,
rela
nd (o
ffsho
re in
vest
men
t com
pani
es) (
2004
–20
07);
Chai
rman
/Dire
ctor
, AIB
/BNY
Se
curit
ies
Serv
ices,
Ltd.
, Ire
land
(fina
ncia
l ser
vices
) (19
99 –
2006
); an
d Ch
airm
an,
BNY A
ltern
ative
Inve
stm
ent S
ervic
es, I
nc. (
finan
cial s
ervic
es) (
2005
–20
07)
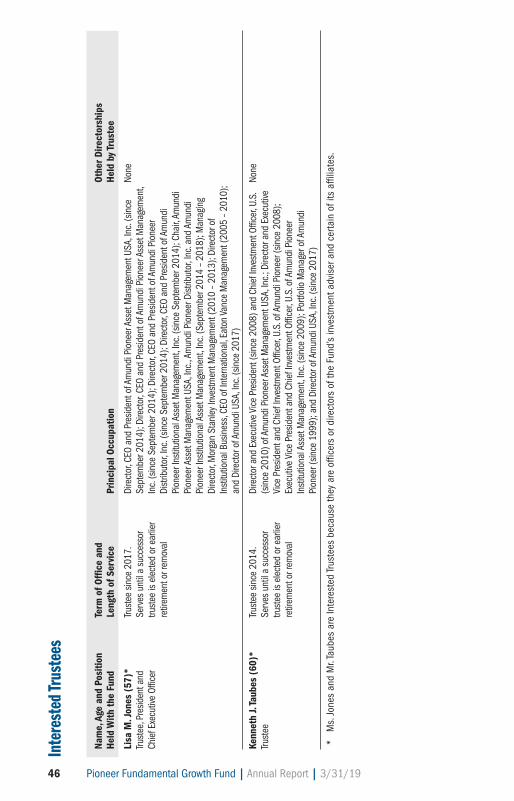
46 Pioneer Fundamental Growth Fund | Annual Report | 3/31/19
Inte
rest
ed T
rust
ees
Nam
e, A
ge a
nd P
ositi
on
Term
of O
ffice
and
Othe
r Dire
ctor
ship
sH
eld
With
the
Fund
Leng
th o
f Ser
vice
Prin
cipa
l Occ
upat
ion
H
eld
by Tr
uste
e
Lisa
M. J
ones
(57
)*Tru
stee
sin
ce 2
017.
Di
rect
or, C
EO a
nd P
resid
ent o
f Am
undi
Pio
neer
Ass
et M
anag
emen
t USA
, Inc
. (sin
ce
None
Trust
ee, P
resid
ent a
nd
Serv
es u
ntil
a su
cces
sor
Sept
embe
r 201
4); D
irect
or, C
EO a
nd P
resid
ent o
f Am
undi
Pio
neer
Ass
et M
anag
emen
t, Ch
ief E
xecu
tive
Offic
ertru
stee
is e
lect
ed o
r ear
lier
Inc.
(sin
ce S
epte
mbe
r 201
4); D
irect
or, C
EO a
nd P
resid
ent o
f Am
undi
Pio
neer
re
tirem
ent o
r rem
oval
Dist
ribut
or, I
nc. (
since
Sep
tem
ber 2
014)
; Dire
ctor
, CEO
and
Pre
siden
t of A
mun
di
Pion
eer I
nstit
utio
nal A
sset
Man
agem
ent,
Inc.
(sin
ce S
epte
mbe
r 201
4); C
hair,
Amun
di
Pion
eer A
sset
Man
agem
ent U
SA, I
nc., A
mun
di P
ione
er D
istrib
utor
, Inc
. and
Am
undi
Pi
onee
r Ins
titut
iona
l Ass
et M
anag
emen
t, In
c. (S
epte
mbe
r 201
4 –
2018
); M
anag
ing
Dire
ctor
, Mor
gan
Stan
ley In
vest
men
t Man
agem
ent (
2010
– 2
013)
; Dire
ctor
of
Inst
itutio
nal B
usin
ess,
CEO
of In
tern
atio
nal,
Eato
n Va
nce
Man
agem
ent (
2005
– 2
010)
; an
d Di
rect
or o
f Am
undi
USA
, Inc
. (sin
ce 2
017)
Kenn
eth
J. Ta
ubes
(60
)*Tru
stee
sin
ce 2
014.
Di
rect
or a
nd E
xecu
tive
Vice
Pre
siden
t (sin
ce 2
008)
and
Chi
ef In
vest
men
t Offi
cer,
U.S.
No
neTru
stee
Serv
es u
ntil
a su
cces
sor
(sin
ce 2
010)
of A
mun
di P
ione
er A
sset
Man
agem
ent U
SA, I
nc.;
Dire
ctor
and
Exe
cutiv
e tru
stee
is e
lect
ed o
r ear
lier
Vice
Pre
siden
t and
Chi
ef In
vest
men
t Offi
cer,
U.S.
of A
mun
di P
ione
er (s
ince
200
8);
retir
emen
t or r
emov
alEx
ecut
ive V
ice P
resid
ent a
nd C
hief
Inve
stm
ent O
ffice
r, U.
S. o
f Am
undi
Pio
neer
In
stitu
tiona
l Ass
et M
anag
emen
t, In
c. (s
ince
200
9); P
ortfo
lio M
anag
er o
f Am
undi
Pi
onee
r (sin
ce 1
999)
; and
Dire
ctor
of A
mun
di U
SA, I
nc. (
since
201
7)
*M
s. Jo
nes
and
Mr.
Taub
es a
re In
tere
sted
Trus
tees
bec
ause
they
are
offi
cers
or d
irect
ors
of th
e Fu
nd’s
inve
stm
ent a
dvis
er a
nd c
erta
in o
f its
affi
liate
s.

Pioneer Fundamental Growth Fund | Annual Report | 3/31/19 47
Fund
Offi
cers
Nam
e, A
ge a
nd P
ositi
on
Term
of O
ffice
and
Othe
r Dire
ctor
ship
sH
eld
With
the
Fund
Leng
th o
f Ser
vice
Prin
cipa
l Occ
upat
ion
H
eld
by O
ffice
r
Chris
toph
er J.
Kel
ley
(54)
Sinc
e 20
03. S
erve
s at
Vi
ce P
resid
ent a
nd A
ssoc
iate
Gen
eral
Cou
nsel
of A
mun
di P
ione
er s
ince
Janu
ary
None
Secr
etar
y and
Chi
ef L
egal
Offi
cer
the
disc
retio
n of
the
Boar
d20
08; S
ecre
tary
and
Chi
ef L
egal
Offi
cer o
f all
of th
e Pi
onee
r Fun
ds s
ince
June
201
0;
Assis
tant
Sec
reta
ry o
f all
of th
e Pi
onee
r Fun
ds fr
om S
epte
mbe
r 200
3 to
May
201
0;
and
Vice
Pre
siden
t and
Sen
ior C
ouns
el o
f Am
undi
Pio
neer
from
July
2002
to
Dece
mbe
r 200
7
Caro
l B. H
anni
gan
(58)
Sinc
e 20
10. S
erve
s at
Fu
nd G
over
nanc
e Di
rect
or o
f Am
undi
Pio
neer
sin
ce D
ecem
ber 2
006
and
Assis
tant
No
neAs
sista
nt S
ecre
tary
the
disc
retio
n of
the
Boar
dSe
cret
ary o
f all
the
Pion
eer F
unds
sin
ce Ju
ne 2
010;
Man
ager
– F
und
Gove
rnan
ce
of A
mun
di P
ione
er fr
om D
ecem
ber 2
003
to N
ovem
ber 2
006;
and
Sen
ior P
aral
egal
of
Am
undi
Pio
neer
from
Janu
ary 2
000
to N
ovem
ber 2
003
Thom
as R
eyes
(56
)Si
nce
2010
. Ser
ves
at
Seni
or C
ouns
el o
f Am
undi
Pio
neer
sin
ce M
ay 2
013
and
Assis
tant
Sec
reta
ry o
f all
None
Assis
tant
Sec
reta
ryth
e di
scre
tion
of th
e Bo
ard
the
Pion
eer F
unds
sin
ce Ju
ne 2
010;
and
Cou
nsel
of A
mun
di P
ione
er fr
om Ju
ne 2
007
to M
ay 2
013
Mar
k E.
Bra
dley
(59
)Si
nce
2008
. Ser
ves
at
Vice
Pre
siden
t – F
und
Treas
ury o
f Am
undi
Pio
neer
; Tre
asur
er o
f all
of th
e Pi
onee
r No
neTre
asur
er a
nd C
hief
Fin
ancia
l th
e di
scre
tion
of th
e Bo
ard
Fund
s sin
ce M
arch
200
8; D
eput
y Tre
asur
er o
f Am
undi
Pio
neer
from
Mar
ch 2
004
to
and
Acco
untin
g Of
ficer
Febr
uary
200
8; a
nd A
ssist
ant T
reas
urer
of a
ll of
the
Pion
eer F
unds
from
Mar
ch 2
004
to F
ebru
ary 2
008
Luis
I. P
resu
tti (
53)
Sinc
e 20
02. S
erve
s at
Di
rect
or –
Fun
d Tre
asur
y of A
mun
di P
ione
er; a
nd A
ssist
ant T
reas
urer
of a
ll of
the
None
Assis
tant
Trea
sure
rth
e di
scre
tion
of th
e Bo
ard
Pion
eer F
unds
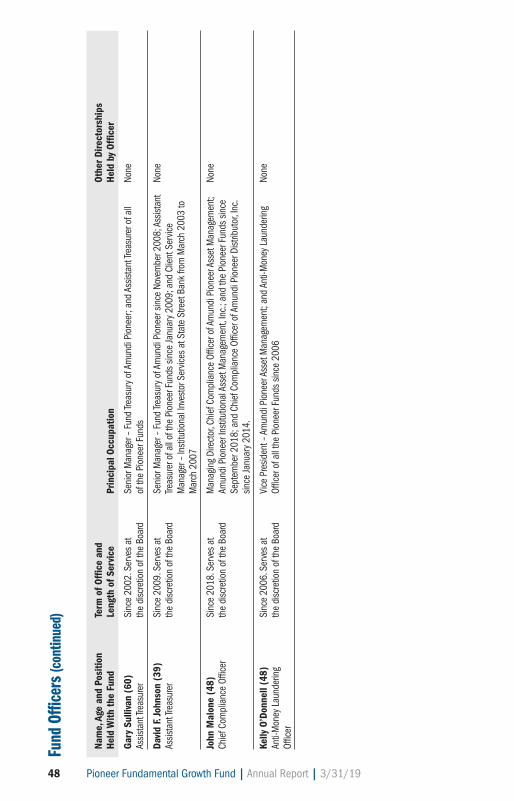
48 Pioneer Fundamental Growth Fund | Annual Report | 3/31/19
Fund
Offi
cers
(con
tinue
d)
Nam
e, A
ge a
nd P
ositi
on
Term
of O
ffice
and
Othe
r Dire
ctor
ship
sH
eld
With
the
Fund
Leng
th o
f Ser
vice
Prin
cipa
l Occ
upat
ion
H
eld
by O
ffice
r
Gar
y Su
lliva
n (6
0)Si
nce
2002
. Ser
ves
at
Seni
or M
anag
er –
Fun
d Tre
asur
y of A
mun
di P
ione
er; a
nd A
ssist
ant T
reas
urer
of a
ll No
neAs
sista
nt Tr
easu
rer
the
disc
retio
n of
the
Boar
dof
the
Pion
eer F
unds
Davi
d F.
John
son
(39)
Sinc
e 20
09. S
erve
s at
Se
nior
Man
ager
– F
und
Treas
ury o
f Am
undi
Pio
neer
sin
ce N
ovem
ber 2
008;
Ass
istan
t No
neAs
sista
nt Tr
easu
rer
the
disc
retio
n of
the
Boar
dTre
asur
er o
f all
of th
e Pi
onee
r Fun
ds s
ince
Janu
ary 2
009;
and
Clie
nt S
ervic
e M
anag
er –
Inst
itutio
nal I
nves
tor S
ervic
es a
t Sta
te S
treet
Ban
k fro
m M
arch
200
3 to
M
arch
200
7
John
Mal
one
(48)
Sinc
e 20
18. S
erve
s at
M
anag
ing
Dire
ctor
, Chi
ef C
ompl
ianc
e Of
ficer
of A
mun
di P
ione
er A
sset
Man
agem
ent;
None
Chie
f Com
plia
nce
Offic
erth
e di
scre
tion
of th
e Bo
ard
Amun
di P
ione
er In
stitu
tiona
l Ass
et M
anag
emen
t, In
c.; a
nd th
e Pi
onee
r Fun
ds s
ince
Se
ptem
ber 2
018;
and
Chi
ef C
ompl
ianc
e Of
ficer
of A
mun
di P
ione
er D
istrib
utor
, Inc
. sin
ce Ja
nuar
y 201
4.
Kelly
O’D
onne
ll (4
8)Si
nce
2006
. Ser
ves
at
Vice
Pre
siden
t – A
mun
di P
ione
er A
sset
Man
agem
ent;
and
Anti-
Mon
ey L
aund
erin
g No
neAn
ti-M
oney
Lau
nder
ing
the
disc
retio
n of
the
Boar
dOf
ficer
of a
ll th
e Pi
onee
r Fun
ds s
ince
200
6 Of
ficer

Pioneer Fundamental Growth Fund | Annual Report | 3/31/19 49
This page is for your notes.

50 Pioneer Fundamental Growth Fund | Annual Report | 3/31/19
This page is for your notes.

Pioneer Fundamental Growth Fund | Annual Report | 3/31/19 51
This page is for your notes.

52 Pioneer Fundamental Growth Fund | Annual Report | 3/31/19
This page is for your notes.
How to Contact Amundi Pioneer
We are pleased to offer a variety of convenient ways for you to contact us forassistance or information.
Call us for:
Account Information, including existing accounts, new accounts, prospectuses, applications and service forms 1-800-225-6292FactFoneSM for automated fund yields, prices,account information and transactions 1-800-225-4321Retirement plans information 1-800-622-0176
Write to us:
Amundi PioneerP.O. Box 219427Kansas City, MO 64121-9427
Our toll-free fax 1-800-225-4240
Our internet e-mail address [email protected](for general questions about Amundi Pioneer only)
Visit our web site: www.amundipioneer.com
This report must be preceded or accompanied by a prospectus.
The Fund files a complete schedule of portfolio holdings with the Securities and Exchange Commissionfor the first and third quarters of each fiscal year as an exhibit to its reports on Form N-PORT.Shareholders may view the filed Form N-PORT by visiting the Commission’s web site athttps://www.sec.gov.

Secu
ritie
s of
fere
d th
roug
h Am
undi
Pio
neer
Fun
ds D
istri
buto
r, In
c.60
Sta
te S
treet
, Bos
ton,
MA
0210
9Un
derw
riter
of P
ione
er M
utua
l Fun
ds, M
embe
r SIP
C©
201
9 Am
undi
Pio
neer
Ass
et M
anag
emen
t19
341-
13-0
519
Amun
di P
ione
er A
sset
Man
agem
ent,
Inc.
60 S
tate
Stre
etBo
ston
, MA
0210
9w
ww.
amun
dipi
onee
r.com