pim requirements must increase to support evolving...
TRANSCRIPT
White Paper
PIM Requirements Must Increase to Support Evolving DAS Systems Luigi Tarlazzi Product Line Manager, Distributed Coverage and Capacity Solutions
August, 2014
2
Executive Summary 3
Major performance threats in high traffic DAS installations 4
PIM requirements for multiband DAS 4
Multiple carriers increase PIM requirements 8
High-power DAS PIM requirements 10
Effects of aging and new bands on PIM performance 13
LTE and LTE-A create additional PIM challenges 14
Difference between certified and verifiable PIM performance 14
Conclusion 15
Appendix 15
References 16
Contents

3
Executive SummarySeveral years ago passive intermodulation (PIM) was a virtually unknown performance metric in distributed antenna systems (DAS). Today it is recognized as one of the most critical requirements for optimum system performance. Hypersensitive antennas and radios, multiple frequency overlays, and more components in the RF path create an environment in which the margin for error regarding PIM continues to shrink1. Given the high susceptibility of current DAS systems, even small levels of PIM distortion can significantly impact network performance, as measured by upload speed.
Outdoor macro sites were the first deployment scenarios where the PIM issues had to be tackled. High power levels from the base transceiver station (BTS) ports and a more complex RF path to the antennas—including jumpers, filters and tower mounted amplifiers (TMAs)—contribute to generating PIM that can be very detrimental to the quality of wireless service. Due to the limited uplink (UL) transmit power of mobile terminals, the uplink receive sensitivity is a critical parameter to optimize in outdoor scenarios to allow a balanced downlink/uplink maximum path-loss. Best practices for macro site deployments have been defined over the past few years1.
High and reliable data throughput values are even more important in DAS environments, such as stadiums, where there are many components in the RF path that can contribute to PIM generation. The minimum PIM specification for each and every component is improving continually. PIM specifications for RF components (splitters, couplers, etc.) and antennas have transitioned from –140 dBc to –150 dBc and now are moving to –153 dBc and –160 dBc [1]. With the passive components—such as splitters, hybrid couplers, and directional couplers—being placed closer to the signal sources in these systems, it is critical that the PIM specification for these devices is at the highest levels.
It should be noted that, at the DAS point of interface (POI), the PIM requirements are actually less stringent than at DAS remote unit ports coupled to a passive network. This is because DAS POIs typically feature filters that limit the frequency range of the generated PIM products. Moreover, BTS output ports are typically band-specific, so multiband carriers cannot mix together and generate PIM products falling in multiple UL bands. In this case, a –153 dBc PIM specification for POIs is typically sufficient to handle the input signals from macro BTS ports.
On the other hand, passive components used in RF signal distribution networks have wideband frequency support. Therefore, multiband and multicarrier signals from DAS remote unit output ports can mix together at every passive stage and generate a large variety of detrimental PIM products falling in multiple uplink bands. As such, PIM requirements for these passive components must be more stringent.
CommScope has introduced –160 dBc (i.e., –117 dBm IM power) passive components in the product portfolio to provide a solution for demanding DAS applications where PIM performance is critical. The following CommScope passive device families are offered with a PIM specification of –160 dBc:
•Power splitter•Hybrid coupler•Directional coupler•Tapper
[1] When measured with 2x20-Watt tones

4
Major performance threats in high traffic DAS installations There are a number of issues to consider when evaluating PIM requirements for the RF components in the passive distribution network of a multi-operator/multiband DAS installation:
1. The number of frequency bands and amount of spectrum used in each band are increasing, creating new and additional mixing products and generating wider bandwidths of PIM.
2. When multiple carriers on the same DAS infrastructure share a given band and are evenly spaced, the severity of the PIM products within the shared frequencies can multiply.
3. DAS systems are built using multiple cables and passive components in a cascaded architecture. The PIM performance is important for each element, but the passive components will be closer to the RF source—especially at high transmit (TX) power levels—and will have a greater influence on the overall PIM level produced.
4. PIM produced in the cabling and connector network may degrade over time and the importance to use high-PIM rated devices is critical for long-term operation of the system.
All the issues mentioned above represent major threats for the performance of DAS installations, which must support high data rates using large channel counts and multiple-in/multiple-out (MIMO) antenna schemes. This is an environment where PIM will have a tremendous impact on system performance, due to potential PIM creation through the multitude of channels and the need for minimum signal-to-interference noise ratio (SINR) for optimum MIMO performance.
In the following sections, the PIM requirements for passive components used in modern DAS installations are addressed in more detail and the driving needs for high-PIM rated devices are discussed.
PIM requirements for multiband DAS Many DAS sites must support multiband configurations, where multiple bands share a common DAS infrastructure. Over the years, the number of bands to be accommodated has increased constantly. This, drastically increases the possibility that combinations of multiple carriers from different bands will fall in-band, generating intermodulation (IM) products. The 3rd Generation Partnership Project 3GPP has also discussed the impact of PIM on BTS receiver performance in “Multi-standard radio base station RF requirements for non-contiguous spectrum deployments” for both single- and multiband scenarios2. As long as a BTS transmits through one common DAS infrastructure for multiband scenarios, the PIM interference may cause receiver sensitivity degradation of another co-located BTS or its own BTS.

5
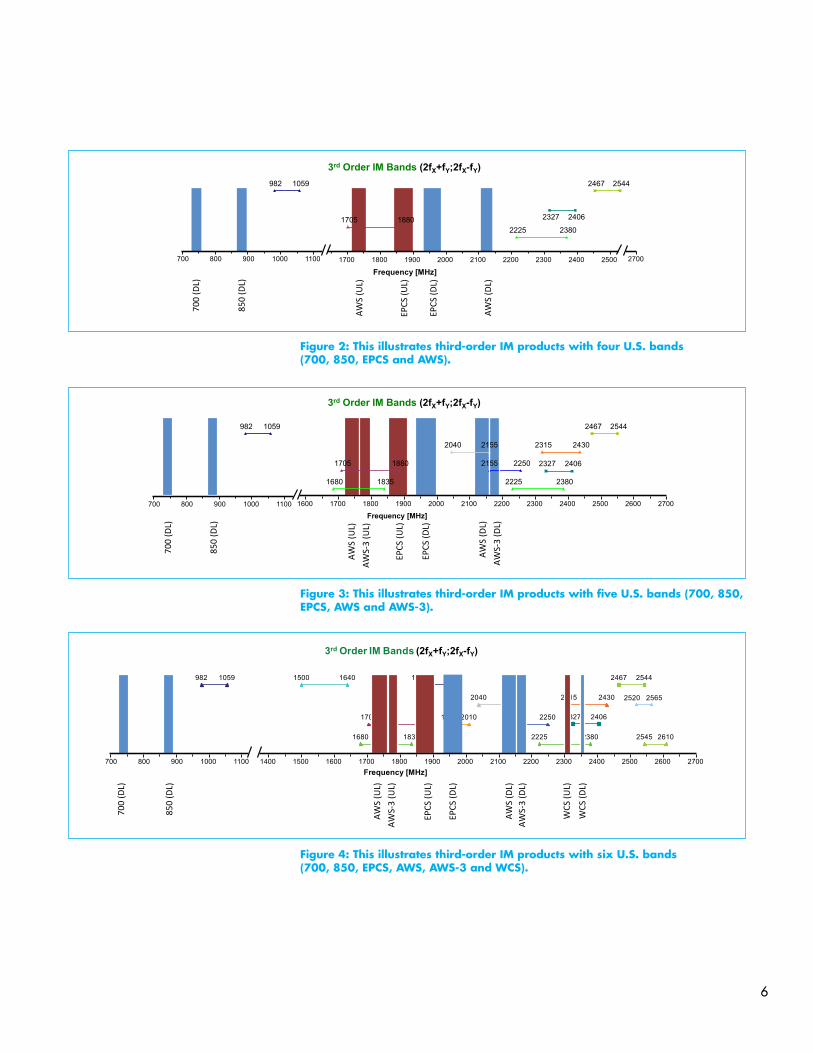
Over the next several years, more and more frequency bands and new technologies will need to be supported by DAS solutions. This will likely open the way to new frequency mixing and a higher probability of PIM generation. The following figures show the third-order IM products that are generated when multiple U.S. bands sharing a common DAS remote unit combine. Specifically, the data considers the interference generated by two bands and up to six bands. Each figure indicates the frequency intervals, representing the frequency range, where the interband third-order IM products occur. Even considering only the third-order IM products of type (e.g., 2fx+fy and 2fx-fy), several third-order IM bands—in some cases, even overlapping with each other—are generated as the carriers’ position within their respective bands shifts. The blue and red areas in each plot below indicate the downlink (DL) bands and show which calculated third-order IM bands fall in the uplink spectrum portions of the considered bands, respectively.
Figure 1 illustrates the third-order IM type (fx±fy±fz) with two wideband carriers operating in both the 729–734 MHz and 751–756 MHz bands (700 MHz), and the 2110–2120 MHz and 2145–2155 MHz bands (AWS). This is one example of a single-operator DAS that must support a multiband and multicarrier configuration.
700 AWS
f1L f1H f2L f2H
Downlink (DL) 729 756 2110 2155
Uplink (UL) 699-716 777-787 1710 1755 Table 1: This shows the two U.S. bands supported by DAS in MHz.
Figure 1: This illustrates third-order IM products with two U.S. bands and two wideband carriers per band (700 and AWS).
Even with only two bands, it is possible for overlapping PIM products to fall in the same 700 MHz UL band, causing harmful interference to the system. For applications involving wideband carriers such as LTE, even a single-operator DAS network can require the same or similar PIM performance as a multi-operator system.
Figures 2, 3 and 4 illustrate how PIM can affect a DAS network that must support from four to six U.S. bands.
3rd Order IM Bands (fX±fY±fz)
70
0 (D
L)70
0 (U
L)
700
(UL)
AWS
(DL)
2100 2200 2700700 800
709
754
776 801
706 731
779
Frequency [MHz]
6
Figure 2: This illustrates third-order IM products with four U.S. bands (700, 850, EPCS and AWS).
Figure 3: This illustrates third-order IM products with five U.S. bands (700, 850, EPCS, AWS and AWS-3).
Figure 4: This illustrates third-order IM products with six U.S. bands (700, 850, EPCS, AWS, AWS-3 and WCS).
2327 2406
2467 2544 982 1059
2225 2380
3rd Order IM Bands (2fX+fY;2fX-fY)
1705 1880
Frequency [MHz]
700
(DL)
850
(DL)
EPCS
(DL)
EPCS
(UL)
AWS
(DL)
AWS
(UL)
27001700 1800 1900 2000 2100 2200 2300 2400 2500700 800 900 1000 1100
2327
2406
2467 2544 982 1059
1705 1880
1680 1835 2225 2380
2040 2155 2315 2430
2155 2250
Frequency [MHz]
700
(DL)
850
(DL)
EPCS
(DL)
EPCS
(UL)
AWS
(DL)
AWS-
3 (D
L)
AWS
(UL)
AWS-
3 (U
L)
3rd Order IM Bands (2fX+fY;2fX-fY)
1600 1700 1800 1900 2000 2100 2200 2300 2400 2500 2600 2700700 800 900 1000 1100
2327 2406
2467 2544982 1059
1705 1880
1680 1835
1500 1640
2225 2380
2040 2155
1860 1960
2315 2430
2155 22501950 2010
2545 2610
2520 2565
3rd Order IM Bands (2fX+fY;2fX-fY)
1400 1500 1600 1700 1800 1900 2000 2100 2200 2300 2400 2500 2600 2700700 800 900 1000 1100Frequency [MHz]
700
(DL)
850
(DL)
AWS
(UL)
AWS
(DL)
AWS-
3 (U
L)
AWS-
3 (D
L)
WCS
(UL)
WCS
(DL)
EPCS
(UL)
EPCS
(DL)

7
As can be seen, the number of UL bands affected by PIM products increases as a function of the number of bands supported. Moreover, some UL bands are impacted by more than one combination of DL bands. This entails that the resulting PIM product in these bands is given by the sum of each individual PIM product.
Once you factor in the additional third-order IM types (e.g., fx±fy±fz) as well as higher IM orders (e.g., fifth and seventh), the mix of generated IM bands grows even larger. This is shown in Figure 5, in which another type of third-order IM is generated in the six-band configuration. As predicted, the number of UL bands impacted by PIM products becomes even larger.
Figure 5: This illustrates third-order IM products (fx±fy±fz) with six U.S. bands (700, 850, EPCS, AWS, AWS-3 and WCS).
For the European market, a DAS supporting five bands can be also considered.
Figure 6: This illustrates third-order IM products (2fx±fy) with five EU bands (800, EGSM 900, DCS 1800, 2100 and 2600).
The more bands the infrastructure must support, the greater the potential for PIM. Moreover, it should be noted that these plots have been computed using only one type of third-order IM products (2fx+fy and 2fx-fy). The mix of generated IM bands would have been even larger if also considering additional third-order IM types (e.g., fx±fy±fz) as well as higher IM orders (e.g., fifth and seventh). Figure 7 indicates the results when another type of third-order IM is generated in a five-band European network. As with the six-band U.S. system shown in Figure 5, the number of UL bands impacted by PIM products in the five-band European system becomes even larger.
844 981
2185 2247
2223 2320
2268 2345
2463 2525
2325 23851860 1995
1680 1800
1930 2065
1725 1825
2125 2245
2100 2200
2270 2405
1905 1985
2465 2585
2510 26102350 2430
Frequency [MHz]
3rd Order IM Bands (fX±fY±fz)
889 1006
1084 1186
924 1006
899 961
984 1119
894
1029 1144
869 964
1064 1144
1039 1099
981824
729 826779
734
799
724
700 762
2043
1945
2067
2160
2042
1990
1765 1882
700
(UL)
700
(DL)
700
(UL)
850
(UL)
850
(DL)
AWS
(UL)
AWS
(DL)
AWS-
3 (U
L)
AWS-
3 (D
L)
WCS
(UL)
WCS
(DL)
EPCS
(UL)
EPCS
(DL)
1700 1800 1900 2000 2100 2200 2300 2400 2500 2600 2700700 800 900 1000 1100 1200
756
2507 2602
2641
717
1029 1129
1440 1650
920 1140 2340 2535
1530 1720
3rd Order IM Bands (2fX+fY;2fX-fY)
700 800 900 1000 1100 1200 1300 1400 1500 1600 1700 1800 1900 2000 2100 2200 2300 2400 2500 2600 2700
800
(DL)
DCS
(UL)
DCS
(DL)
2100
(DL)
2600
(UL)
2600
(DL)
EGSM
(DL)
Frequency [MHz]

8
Figure 7: This illustrates third-order IM products (fx±fy±fz) with five EU bands (800, EGSM 900, DCS 1800, 2100 and 2600).
The bottom line is that, for any given PIM performance level, the more bands the DAS has to support, the better the PIM rating of the used passive devices needs to be.
Now let us consider the effect of a multicarrier DAS environment on PIM levels.
Multiple carriers increase PIM requirementsIn neutral host configurations, multiple channels can be allocated on the same band. Each operator may allocate one or more carriers for each band depending on its spectrum licenses. An example of this configuration is shown in Figure 8, where three evenly spaced carriers are allocated in the PCS band. The summation of third-order IM products within the same frequency is due to the combination of these evenly spaced carriers. The third-order IM products generated by the three evenly spaced, continuous-wave (CW) tones is calculated using the equations in Table 2. The pairs of intermodulation distortion (IMD) terms falling within the same frequencies are highlighted in red. It should be noted that the higher order PIM processes also contribute to the IM products at the frequencies of lower order products.
Multicarrier signal Third-order IM products
• F1• F2=F1+Δf• F3=F1+2Δf
• (F1+F2-F3)=F1+F1+Δf-F1-2Δf=F1-Δf• (F1+F3-F2)=F1+F1+2Δf-F1-Δf=F1+Δf• (F2+F3-F1)=F1+Δf+F1+2Δf-F1=F1+3Δf• (2F1-F2)=2F1-F1-Δf=F1-Δf• (2F1-F3)=2F1-F1-2Δf=F1-2Δf• (2F2-F1)=2F1+2Δf-F1=F1+2Δf• (2F2-F3)=2F1+2Δf-F1-2Δf=F1• (2F3-F1)=2F1+4Δf-F1=F1+4ΔF• (2F3-F2)=2F1+4Δf-F1-Δf=F1+3Δf
Table 2: These equations calculate third-order IM products generated by three evenly spaced CW tones.
In this example the carriers operate within a 10 MHz bandwidth and are spaced 25 MHz apart in the PCS band. Note that the bandwidth for the third-order IM products triples compared to that of the fundamental carriers. This effect can be verified by comparing the 50 MHz frequency range of the CW tones (1985–1935 MHz) with the 150 MHz range occupied by the third-order IM products (2035–1885 MHz = 150 MHz). As a result, the chance increases even more that IM products generated by combinations of multiple modulated carriers will fall in-band.
1021 1186
1531 1706 1241 1401
730
1155 1325 1665
1375 1540
839 974
3rd Order IM Bands (fX±fY±fz)
700 800 900 1000 1100 1200 1300 1400 1500 1600 1700 1800 1900 2000 2100 2200 2300 2400 2500 2600 2700
800
(DL)
800
(UL)
EGSM
(UL)
DCS
(UL)
DCS
(DL)
2100
(UL)
2100
(DL)
2600
(UL)
2600
(DL)
EGSM
(DL)
1845
1909
1941 2066 2214 2339
2460
2451 2586
2255
20491225 1636 17761430
Frequency [MHz]

9
Figure 8: Three evenly spaced carriers are allocated in the PCS band.
Another way to analyze the PIM effects of multiple carriers on a shared DAS infrastructure is by using the concept of multicarrier backoff (MBO). MBO is a coefficient used to approximate the aggregate effect of multiple third-order IM products on the carrier-to-interference ratio (C/I), when the interference falls within the same frequency and the carriers are evenly spaced. In particular, the MBO takes into account the addition of third-order IM products when more than two carriers are present. The related formula is normalized to IM products created by two tones and can be expressed as:
C/ITotal = C/I2Tones - MBO = C/I2Tones - [6dB+10log(x)]3
In this equation, X is a function of the number of tones considered. Table 4 below shows the MBO as a function of the number of evenly spaced carriers3.
Carriers x 6 dB + 10 log (x)
2 0.25 0 dB
3 1 6 dB
4 2.3 9.6 dB
5 4.5 12.5 dB
6 7.5 14.8 dB
7 11.5 16.6 dB
8 15.5 17.9 dB
9 20 19.0 dB
10 26 20.1 dB
11 33 21.2 dB
12 40 22.0 dB
13 48 22.8 dB
14 57 23.6 dB
15 67 24.3 d B
16 77 24.9 dB
n>16 ~(3/8) n2 6 dB + 10 log ((3/8) n2)
Table 3: Carrier and counting term calculations of MBO3
F1-Δ
f
F1 F2 F3
Δf=25MHzΔf=25MHz
19601935 19851885 1910
Δf=25MHz
1930 f [MHz]1990
PCS DL1930-1990
Δf=25MHz
F1-2
Δf
Δf=25MHz
F1+3
Δf
20352010
F1+4
Δf
Δf=25MHz
10
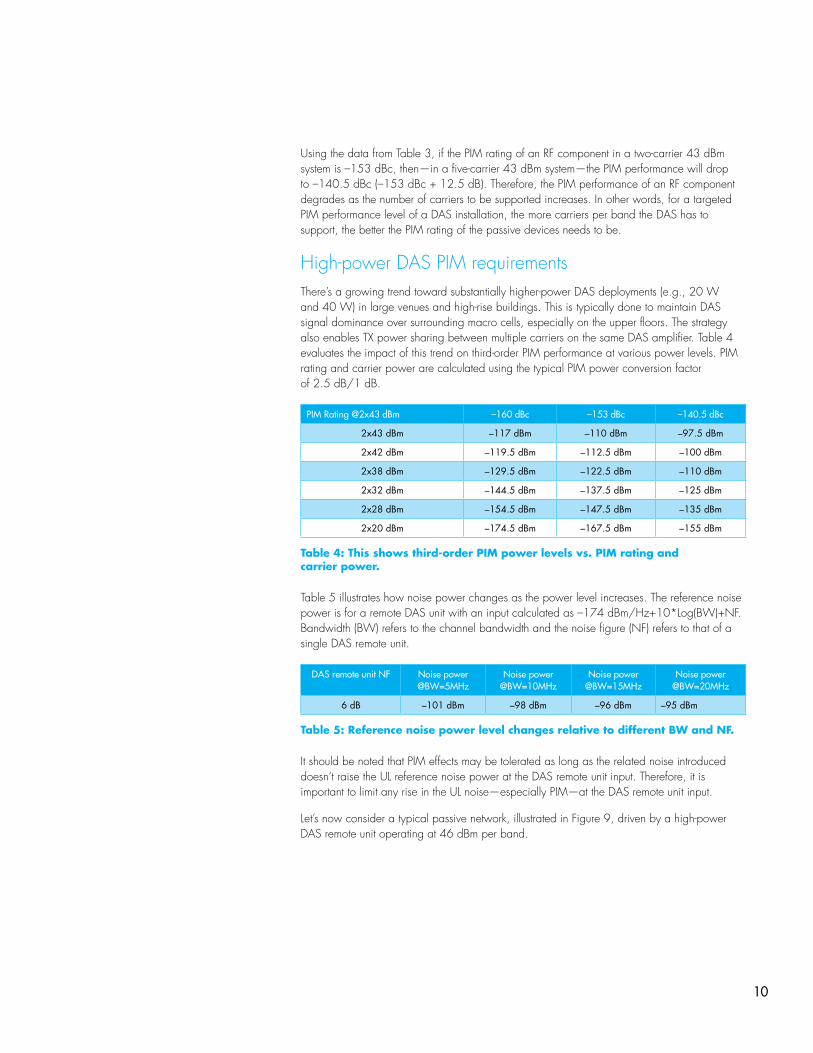
Using the data from Table 3, if the PIM rating of an RF component in a two-carrier 43 dBm system is –153 dBc, then—in a five-carrier 43 dBm system—the PIM performance will drop to –140.5 dBc (–153 dBc + 12.5 dB). Therefore, the PIM performance of an RF component degrades as the number of carriers to be supported increases. In other words, for a targeted PIM performance level of a DAS installation, the more carriers per band the DAS has to support, the better the PIM rating of the passive devices needs to be.
High-power DAS PIM requirementsThere’s a growing trend toward substantially higher-power DAS deployments (e.g., 20 W and 40 W) in large venues and high-rise buildings. This is typically done to maintain DAS signal dominance over surrounding macro cells, especially on the upper floors. The strategy also enables TX power sharing between multiple carriers on the same DAS amplifier. Table 4 evaluates the impact of this trend on third-order PIM performance at various power levels. PIM rating and carrier power are calculated using the typical PIM power conversion factor of 2.5 dB/1 dB.
PIM Rating @2x43 dBm –160 dBc –153 dBc –140.5 dBc
2x43 dBm –117 dBm –110 dBm –97.5 dBm
2x42 dBm –119.5 dBm –112.5 dBm –100 dBm
2x38 dBm –129.5 dBm –122.5 dBm –110 dBm
2x32 dBm –144.5 dBm –137.5 dBm –125 dBm
2x28 dBm –154.5 dBm –147.5 dBm –135 dBm
2x20 dBm –174.5 dBm –167.5 dBm –155 dBm
Table 4: This shows third-order PIM power levels vs. PIM rating and carrier power.
Table 5 illustrates how noise power changes as the power level increases. The reference noise power is for a remote DAS unit with an input calculated as –174 dBm/Hz+10*Log(BW)+NF. Bandwidth (BW) refers to the channel bandwidth and the noise figure (NF) refers to that of a single DAS remote unit.
DAS remote unit NF Noise power@BW=5MHz
Noise power@BW=10MHz
Noise power@BW=15MHz
Noise power@BW=20MHz
6 dB –101 dBm –98 dBm –96 dBm –95 dBm
Table 5: Reference noise power level changes relative to different BW and NF.
It should be noted that PIM effects may be tolerated as long as the related noise introduced doesn’t raise the UL reference noise power at the DAS remote unit input. Therefore, it is important to limit any rise in the UL noise—especially PIM—at the DAS remote unit input.
Let’s now consider a typical passive network, illustrated in Figure 9, driven by a high-power DAS remote unit operating at 46 dBm per band.

11
Figure 9: A typical passive network here is driven by a high-power DAS RU and passive network schematic.
Figure 10 shows the two passive stages from the network schematic highlighted in Figure 9. The four-way power splitter and the 8 dB directional coupler are connected to the panel antenna while a high-power DAS remote unit is coupled to the two RF passive stages and the antenna. Both passive devices have an assumed PIM rating of –160 dBc, whereas the antenna has a –153 dBc PIM rating. The computed total PIM power levels at the DAS remote unit input take into account the PIM generated by the entire passive chain.
SM Fiber
698-2700 MHz 6.3 dB/ DIN-Fem.
S-4-CPUSE-H-Di6
C-8-CPUSE-D-Ai6
DIN-Female698-2700 MHz
8.0 dB
C-8-CPUSE-D-Ai6
DIN-Female698-2700 MHz
6.0 dB
C-8-CPUSE-D-Ai6
DIN-Female698-2700 MHz
8.0 dB
C-8-CPUSE-D-Ai6
DIN-Female698-2700 MHz
6.0 dB
C-8-CPUSE-D-Ai6
DIN-Female698-2700 MHz
8.0 dB
C-8-CPUSE-D-Ai6
DIN-Female698-2700 MHz
6.0 dB
C-8-CPUSE-D-Ai6
DIN-Female698-2700 MHz
8.0 dB
C-8-CPUSE-D-Ai6
DIN-Female698-2700 MHz
6.0 dB

12
Figure 10: This shows the composite PIM power calculation @2x43 dBm carriers with two –160 dBc passive stages.*
From the scheme above it can be seen that the first passive stage plays the most critical role in the chain. As such it needs to have an excellent PIM rating. In this case the calculated composite third-order PIM power at the DAS remote unit input is –120.5 dBm, well below the reference noise power at the DAS remote unit (–101 dBm, 5 MHz BW, 6 dB NF).
Figure 11 shows the same passive network configuration; the passive devices, however, have a –153 dBc PIM rating. The composite third-order PIM power is calculated at DAS remote unit input. In this case the composite third-order PIM power at the DAS remote unit input is –113.5 dBm, which is still below the reference noise power (–101 dBm for 5 MHz BW and 6 dB NF).
Figure 11: This shows the composite PIM power calculation @2x43 dBm carriers with two –153 dBc passive stages.*
Should this same DAS remote unit need to support three or more bands, the equivalent PIM performance for each passive component would drop significantly. The level of noise from the overlapping PIM products generated across multiple bands could easily approach the reference noise power at the DAS remote unit. Factor in multiple carriers operating at 43 dBm on different bands and the power levels from overlapping PIM products would increase 3 dB or more—to an estimated –110.5 dBm. It should be noted that even a PIM power as low as –110.5 dBm will translate into a 0.5 dB increase in noise power at the DAS remote unit ([–101 dBm] linear + [–110.5 dBm] linear = –100.5 dBm).
DAS HP RU
NF=6dB
Passive 1Loss=6dB
PIM @160dBc
Passive 2Loss=8dB
PIM @160dBc
AntennaPIM @153dBc
DAS MUBTS Loss=1dB Loss=4dB Loss=4dB
Total Loss=23dB
RU Output Power 46dBm
2x43dBm
BTS Output Power 46dBm
2x43dBm
Intput Power
2x42dBm
Intput Power
2x32dBm
Intput Power
2x20dBm
3rd PIM Power
-119.5dBm
3rd PIM Power
-144.5dBm
3rd PIM Power
-167.5dBm
Comp 3rd PIM Power -120.5dBm
DAS DL Gain=0dB ; DAS UL Gain=0dB
DAS HP RU
NF=6dB
Passive 1Loss=6dB
PIM @153dBc
Passive 2Loss=8dB
PIM @153dBc
AntennaPIM @153dBc
DAS MUBTS Loss=1dB Loss=4dB Loss=4dB
Total Loss=23dB
RU Output Power 46dBm
2x43dBm
BTS Output Power 46dBm
2x43dBm
Intput Power
2x42dBm
Intput Power
2x32dBm
Intput Power
2x20dBm
3rd PIM Power
-112.5dBm
3rd PIM Power
-137.5dBm
3rd PIM Power
-167.5dBm
Comp 3rd PIM Power -113.5dBm
DAS DL Gain=0dB ; DAS UL Gain=0dB
*Only typical composite PIM values considered. PIM rating of RF jumpers assumed to be much better than other passives.

13
Figure 12 shows the identical scenario as Figure 11 but with five carriers instead of two. The passive devices are assumed to have a –153 dBc PIM rating and the output power of the DAS remote unit is 46 dBm. When the MBO from Table 4 is applied to this five-carrier scenario, the equivalent PIM performance will drop to –140.5 dBc (–153 dBc + 12.5 dB). The composite third-order PIM power is then calculated at the DAS remote unit input.
Figure 12: This shows the composite PIM power calculation @5x39 dBm carriers with two –153 dBc passive stages.*
It should be noted that, even in this case, the –111 dBm composite PIM power will translate into a 0.5 dB increase of noise power at the DAS remote unit ([–101 dBm] linear + [–111 dBm] linear = –100.5 dBm).
As demonstrated above, the combined effects of multiband and multicarrier application on PIM emphasizes the importance and urgency of deploying passive devices with extreme low-PIM performance. The need becomes even more dramatic when considering applications involving six bands (U.S.), as illustrated in Figures 4 and 5. In these cases, certain UL bands, like EPCS and AWS-3, may have as many as five overlapping PIM products. This becomes important as it can create an additional 7 dB of PIM products, exceeding the limit of today’s –153 dBc PIM-rated components. To ensure sufficient PIM protection is achieved in these instances, CommScope recommends using passive devices with –160 dBc PIM rating or better.
Effects of aging and new bands on PIM performanceRF devices used in passive networks are very susceptible to the effects of aging. RF connectors tend to loosen over time, exposing the network to dust, debris and water migration—common contributors to PIM. During installation, maintenance and repair, connectors can be easily damaged if over-torqued, further degrading PIM performance. Passive devices with modest PIM ratings can even accelerate the damage compared to those with better PIM ratings. Therefore, devices with excellent low-PIM performance become crucial for reliable long-term DAS performance. Using RF devices with a PIM rating of –160 dBc vs. –153 dBc provides a 7 dB margin against aging effects. This could translate to several additional years in lifespan of a DAS installation.
Low-PIM devices also provide more margins for upgrades to new bands deployed over the DAS. As highlighted in previous sections, every new band added to the DAS can generate a multitude of new PIM products in the uplink bands. Therefore, the lower the PIM rating of the devices used, the greater the capacity to add new bands without affecting overall DAS performance.
DAS HP RU
NF=6dB
Passive 1Loss=6dB
PIM @153dBc
Passive 2Loss=8dB
PIM @153dBc
AntennaPIM @153dBc
DAS MUBTS Loss=1dB Loss=4dB Loss=4dB
Total Loss=23dB
RU Output Power 46dBm
5x39dBm
BTS Output Power 46dBm
5x39dBm
Intput Power
5x38dBm
Intput Power
5x28dBm
Intput Power
5x16dBm
3rd PIM Power
-110dBm
3rd PIM Power
-135dBm
3rd PIM Power
-165dBm
Comp 3rd PIM Power -111dBm
DAS DL Gain=0dB ; DAS UL Gain=0dB
*Only typical composite PIM values considered. PIM rating of RF jumpers assumed to be much better than other passives.
14
LTE and LTE-A create additional PIM challengesFor wireless technologies like LTE, with a one-to-one frequency reuse, intercell interference is a key challenge. It’s critical to minimize the UL transmission power of mobile devices at the cell edge in order to reduce interference in the adjacent cells. As the UL noise floor—as recognized by the BTS—increases, the mobile device boosts its UL transmission power to minimize SINR at the BTS receiver. As more interference is created, the cell begins to shrink due to the increasing noise at the receiver.
MIMO technology is part of the toolkit mobile operators are using to tackle the ever-increasing demand for mobile data capacity. It has been largely demonstrated that the multiplexing of independent data streams can be supported only in good RF channel conditions. That poses severe constraints on the coverage levels required as well as on the quality of the signal, given that the SINR has become a key performance indicator to optimize. Furthermore, LTE-Advanced supports MIMO schemes for the uplink path as well. As a result, the SINR requirements must be met even at the BTS receiver. In this context, it is even more critical to limit the uplink noise rise.
Carrier aggregation (CA) is another key feature introduced by LTE-Advanced. Wireless operators will combine different frequency bands in order to cope with their spectrum fragmentation. For a DAS installation, assuming both intra- and interband CA schemes with more and more DL component carriers aggregated to boost DL data rate, the number of possible multicarrier combinations can get extremely high—with a consequent higher probability for generated PIM products falling in uplink bands.
All the features above can make the impact of PIM issues on modern DAS systems targeted for LTE and LTE-Advanced technologies even more detrimental than for legacy networks.
Difference between certified and verifiable PIM performanceQuality is only as good as the data available to prove that the product meets or exceeds the stated specifications. This is even more critical for products that must meet very high performance requirements.
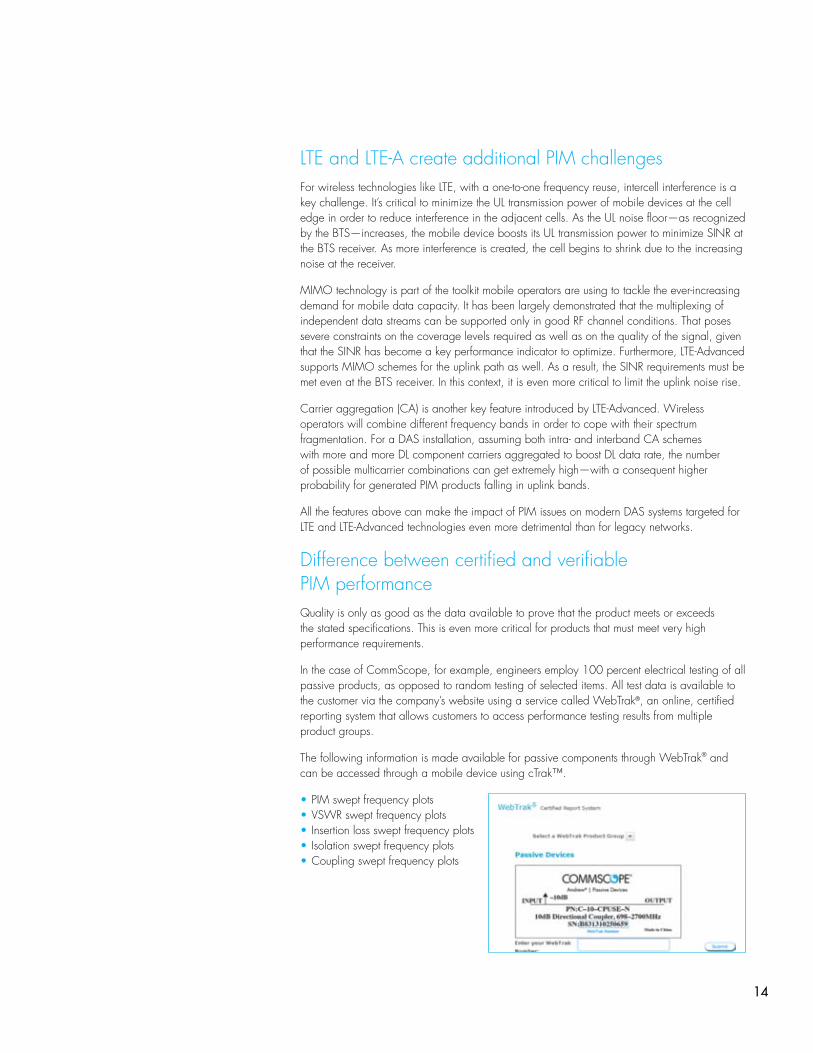
In the case of CommScope, for example, engineers employ 100 percent electrical testing of all passive products, as opposed to random testing of selected items. All test data is available to the customer via the company’s website using a service called WebTrak®, an online, certified reporting system that allows customers to access performance testing results from multiple product groups.
The following information is made available for passive components through WebTrak® and can be accessed through a mobile device using cTrak™.
•PIM swept frequency plots•VSWR swept frequency plots• Insertion loss swept frequency plots• Isolation swept frequency plots•Coupling swept frequency plots

15
ConclusionToday’s current and emerging DAS solutions pose a variety of opportunities as well as difficult challenges for wireless operators and component OEMs. A key issue that will continue to affect network performance is PIM interference produced by passive devices. This paper has attempted to demonstrate how and why the evolving DAS environment is likely to generate higher and higher levels of performance-eroding PIM.
Specifically, multiband and multicarrier configurations, higher power settings and the effects of aging DAS infrastructures will have significant effects on PIM levels. Furthermore, the impact of PIM issues on modern DAS systems targeted for LTE and LTE-Advanced technologies can be even more detrimental than for legacy networks. In order to adequately protect their investment in DAS infrastructure over the long term, operators must begin to deploy network components that provide increasingly higher PIM margins. This involves transitioning from the current devices—PIM rated up to –153 dBc—to passive devices that are both certified and can be verified for PIM performance of –160 dBc. Going forward, these higher performing passive components with a PIM rating of –160 dBc will play a crucial role in the long-term success of high-end DAS solutions.
Contact a CommScope Distributed Coverage and Capacity Solutions representative at [email protected] to learn more about PIM Solutions for DAS.
AppendixThe downlink (DL) and uplink (UL) bands of interest for U.S. are reported in the table below.
7004 8504 EPCS4
f1L f1H f2L f2H f3L f3H
DL 729 756 869 894 1930 1995
UL 699–716 777–787 824 849 1850 1915
AWS4 AWS-35 WCS6
f4L f4H f5L f5H f6L f6H
DL 2110 2155 2155 2180 2350 2360
UL 1710 1755 1755 1780 2305 2315
Table 6: These U.S. bands (in MHz) are supported by DAS.
The DL and UL bands of interest for EU are reported in the table below.
8004 EGSM 9004 DCS 18004
f1L f1H f2L f2H f3L f3H
DL 791 821 925 960 1805 1880
UL 832 862 880 915 1710 1785
21004 26005
f4L f4H f5L f5H
DL 2110 2170 2620 2690
UL 1920 1980 2500 2570
Table 7: These EU bands (in MHz) are supported by DAS.
16
www.commscope.comVisit our website or contact your local CommScope representative for more information.
© 2014 CommScope, Inc. All rights reserved.
All trademarks identified by ® or ™ are registered trademarks or trademarks, respectively, of CommScope, Inc. This document is for planning purposes only and is not intended to modify or supplement any specifications or warranties relating to CommScope products or services.
WP-108243-EN (8/14)
References1 PIM Testing-Advanced wireless services emphasize the need for better PIM control; CommScope White Paper; 2014-02
2 3rd Generation Partnership Project; Technical Specification Group Radio Access Network; Passive Intermodulation (PIM) handling for Base Stations (BS) (Release 12); 2013-09
3 RF and Microwave Fiber-Optic Design Guide; Agere Systems Inc. Application Note, April 20014 3rd Generation Partnership Project; Technical Specification Group Radio Access Network; Evolved Universal Terrestrial Radio Access (E-UTRA); Base Station (BS) radio transmission and reception (Release 12); 2014-06
5 Auction of Advanced Wireless Services Licenses, Scheduled for November 13, 2014, Comment Sought on Competitive Bidding Procedures, for Auction 97; Federal Communications Commission; May 19, 2014
6 3rd Generation Partnership Project; Technical Specification Group Radio Access Network; LTE in the US Wireless Communications Service (WCS) band (Release 12); 2013-07