pilot weather - print - aircraft spruce
TRANSCRIPT

PILOT WEATHERFROM SOLO TO THE AIRLINES
PILOT WEATHERFROM SOLO TO THE AIRLINES
Captain/Meteorologist DOUG MORRISMeteorologist/CFI SCOTT DENNSTAEDT

Pilot Weather: From Solo to the Airlines
Copyright © 2018All rights reserved. This book or any portion thereof
may not be reproduced or used in any manner without the prior written permission of the author.
Although every precaution has been taken in the preparation of this book, the authors assume no responsibility for omissions or errors.
Published by Doug Morris and Scott Dennstaedt
www.pilotweatherbook.com
Doug Morris, cover photoScott Dennstaedt, back cover photo
David Moratto, cover and interior book designer
Avmet Weather Consulting (DM)&
AvWxWorkshops (SD)www. avwxworkshops.com
ISBN 978-1-7750927-1-1
To all of our students of weather. . .

vii
CONTENTS
Preface. . . . . . . . . . . . . . . . . . . . . . . . . . . . . . . . . . . . . . . . . . . xi
1 The Atmosphere . . . . . . . . . . . . . . . . . . . . . . . . . . . . . . . . . . . . 12 Stability and Lapse Rates . . . . . . . . . . . . . . . . . . . . . . . . . . . . . . . . 93 Clouds . . . . . . . . . . . . . . . . . . . . . . . . . . . . . . . . . . . . . . . . . 214 Atmospheric Pressure . . . . . . . . . . . . . . . . . . . . . . . . . . . . . . . . . . 315 Temperature, Moisture and Precipitation . . . . . . . . . . . . . . . . . . . . . . . . . 436 Fog . . . . . . . . . . . . . . . . . . . . . . . . . . . . . . . . . . . . . . . . . . 537 Visibility... and the Weather that Restricts It . . . . . . . . . . . . . . . . . . . . . . . . 618 Air Masses . . . . . . . . . . . . . . . . . . . . . . . . . . . . . . . . . . . . . . . 699 Fronts, Frontal Weather, and the Life of a Low . . . . . . . . . . . . . . . . . . . . . . . 7510 Boundary Layer Winds and Low-Level Wind Shear (LLWS) . . . . . . . . . . . . . . . . . . 8711 General Global Circulation (Semi-Permanent Weather Features/Three-Cell Model) . . . . . . 10312 Airframe Icing . . . . . . . . . . . . . . . . . . . . . . . . . . . . . . . . . . . . 11313 Turbulence . . . . . . . . . . . . . . . . . . . . . . . . . . . . . . . . . . . . . . 133 14 Mountain Waves (Gravity Waves and Mountain Winds) . . . . . . . . . . . . . . . . . . 14715 Thunderstorms . . . . . . . . . . . . . . . . . . . . . . . . . . . . . . . . . . . . 15716 METARs (Weather Reports) . . . . . . . . . . . . . . . . . . . . . . . . . . . . . . 17117 Terminal Aerodrome Forecasts (TAFs) . . . . . . . . . . . . . . . . . . . . . . . . . . 18318 Graphical Forecasts for Aviation (GFA) . . . . . . . . . . . . . . . . . . . . . . . . . . 19319 SIGMETs, AIRMETs and CWAs . . . . . . . . . . . . . . . . . . . . . . . . . . . . . 20120 Upper Winds and Temperatures (FBs) . . . . . . . . . . . . . . . . . . . . . . . . . . 21121 Altimetry . . . . . . . . . . . . . . . . . . . . . . . . . . . . . . . . . . . . . . 21922 Weather Information and Sites . . . . . . . . . . . . . . . . . . . . . . . . . . . . . 22723 Surface Charts . . . . . . . . . . . . . . . . . . . . . . . . . . . . . . . . . . . . 23724 The Tropopause, Thermal Wind and Jet Streams . . . . . . . . . . . . . . . . . . . . . 24325 Upper Air (Constant Pressure) Charts . . . . . . . . . . . . . . . . . . . . . . . . . . 25526 Significant Weather (SIGWX) Charts . . . . . . . . . . . . . . . . . . . . . . . . . . 26327 Weather Radar . . . . . . . . . . . . . . . . . . . . . . . . . . . . . . . . . . . . 27128 Airborne Weather Radar . . . . . . . . . . . . . . . . . . . . . . . . . . . . . . . . 28129 Satellite Weather and “Over the Top” Operations . . . . . . . . . . . . . . . . . . . . . 28930 Hurricanes — How They Form and the Curve Balls They Can Throw! . . . . . . . . . . . . 29731 Space Weather and “Over-the-Top” Operations . . . . . . . . . . . . . . . . . . . . . . 305
“The Clouds Looked No Nearer Than When I Was Lying On The Street.” Doug’s Pic on a Layover—Photo by Doug Morris
Capped Cumuliform Clouds at Sunset—Photo by Scott Dennstaedt

C O N T E N T Sviii
32 Volcanic Ash . . . . . . . . . . . . . . . . . . . . . . . . . . . . . . . . . . . . . 31533 Weather Across Canada — Some Climatology . . . . . . . . . . . . . . . . . . . . . . . 323
Appendix I: Cracking the Code (Airport Codes) . . . . . . . . . . . . . . . . . . . . . . . . 339Appendix II: Time for Weather (Zulu Time) . . . . . . . . . . . . . . . . . . . . . . . . . . 341Appendix III: Doug’s Story (There I was. . .) . . . . . . . . . . . . . . . . . . . . . . . . . . 345Glossary . . . . . . . . . . . . . . . . . . . . . . . . . . . . . . . . . . . . . . . . . 347Index . . . . . . . . . . . . . . . . . . . . . . . . . . . . . . . . . . . . . . . . . . 367
Acknowledgements . . . . . . . . . . . . . . . . . . . . . . . . . . . . . . . . . . . . 375About the Authors . . . . . . . . . . . . . . . . . . . . . . . . . . . . . . . . . . . . 377 PILOT WEATHER
FROM SOLO TO THE AIRLINES

xi
PREFACE
While you may master one or more musical instruments you may never compose a score or even write a single line of music. Similarly, you may never know enough meteorology to become a professional forecaster, but you can learn enough to be a better pilot.
The Internet has now become a rich source of weather guidance for pilots. Pilots almost have too many choices. Online resources for pilots have continued to blossom to the point where so many more useful weath-er guidance and tools has emerged that it has become difficult for pilots to know what guidance to use and how to integrate that information successfully into their preflight planning ritual.
You don’t have to be a pilot very long to know weath-er will disrupt your flying activity more than any other physical factor. Instrument rated pilots have a few more doors of opportunity, but learning to decipher what is be-hind these doors is typically more challenging. Adverse weather such as thunderstorms, turbulence, airframe icing and fog are the heavy hitters when it comes to de-veloping a plan to limit your exposure to adverse weather.
Learning to fly requires the pilot master many, many disciplines and techniques. A pilot’s formal and recurrent training is heavily weighed on stick and rudder skills, in other words, how to f ly the aircraft. Additionally, in-structors place a lot of emphasis on instrument proced-ures and avionics and how to negotiate safely within the National Airspace System (NAS). Once we get our certifi-cate or additional ratings, we hear the ubiquitous state-ment that it is a beginning, not an end to our learning.
As a result, we practice landings and takeoffs until we can impress our friends and relatives. We practice instru-ment approaches to minimums until we’re tired of wearing
those not-so-flattering scratched-up “foggles.” Except for the occasional magazine article, most pilots rarely attempt to advance their core knowledge of weather and weather planning. Moreover, it is rarely done in concert with any one-on-one coaching from a weather savvy instructor who is equipped to take you beyond the basics.
Many low-time pilots feel that as they accumulate f lying experience it will somehow all just fall in place and someday they will acquire the weather knowledge they were always missing. According to an NTSB safety study, this is not the case:
“It appears that pilots generally require formal training to obtain weather knowledge and cannot be expected to acquire it on their own as they simply gain more flight experience.”
In the end, Mother Nature doesn’t discriminate; she doesn’t care how many hours are in your logbook. While experience is important, education is the key to a long flying career.
Congratulations on buying your complete A-to-Z weather book, written for American pilots. Whether you are starting from hour zero or you’ve amassed thousands of hours as an airline pilot, this will be the book you keep during your entire aviation career. It covers a gamut of aviation weather topics, from the ins and outs of weather theory to the reading and interpretation of aviation weather reports. True, this is the weather book for American pilots, but it also caters to the air traffic controller, the flight service specialist, the new upstart f light dispatcher, or the Canadian pilot wanting to brush up on weather south of the border.
The intent of this book is not to teach weather so you can pass the test, but to teach it so you will compre-hend it.
A Thunderstorm is Born Over Rock Hill, South Carolina—Photo by Scott Dennstaedt

P R E F A C E xiii
LETS GET STARTED . . .
This Cirrus icon denotes SCOTT speaking in first person.
This generic airliner represents DOUG conversing in first person.
This symbol reflects WEATHER FACTS and TRIVIA.
This symbol symbolizes WEATHER RELATED ACCIDENTS. Fortunately, it has been sparsely used.
Cumulus Turret Racing Toward the Flight Levels—Photo by Scott Dennstaedt

305
Erik Ritterbach’s photo
Our Sun: Solar activity fluctuates in cycles. During the peak period, solar max, a great number of solar f lares and CMEs (Coronal Mass Ejections) are produced. Coronal mass ejections are massive clouds of hot gases and mag-netic force fields. You will soon learn that these ejections actually reduce radiation emanating from outside our solar system. Wherever CMEs go, cosmic rays are deflected, as the CMEs “push” the GCRs away from Earth. Occa-sionally, the CMEs are strong enough to increase the dose of radiation Earth receives, but it is rare.
Solar Cycle and Sunspots: The number of sunspots f luctuates over time in a somewhat consistent 11-year cycle called the solar or sunspot cycle�—the exact length of the cycle can vary. More sunspots mean increased solar activity. Sunspots are the source of the solar flares and coronal mass ejections that send charged particles hurt-ling toward Earth, which can damage satellites, produce power grid surges, and cause aircraft radio blackouts.
Until recently, a roly-poly man with a white beard and red suit flew the only scheduled polar flight—and even then it was only once a year. But the opening of Russian airspace in the late 1990s created new opportunities. Now, many international airlines launch daily “over the top” flights. By flying a polar route, airtime can be re-duced by 60 to 90 minutes. This means huge fuel sav-ings! Duty time for aircrew is also lessened. Duty time may not seem like a big issue, but it easily enters the equation if a less-productive route is flown. Additionally, turbulence is less prevalent on polar flights because jet streams are corkscrewing around the globe farther south. There are no weather fronts to contend with—and rarely any thunderstorms! But this newfound flight path comes with many restrictions and new me-teorological and environmental considerations.
Flights operating north of 78° North latitude are
deemed “polar” flights; thus, special procedures
and policies associated with polar operations
come into play.
SPACE WEATHER HURDLES
Polar flights present some unique obstacles, especially when it comes to space weather. Space weather is defined as the conditions created on Earth from activity on the surface of the sun. But non-solar sources, such as GCR (Galactic Cosmic Rays), can also fall under the umbrella of space weather, since they substantially affect condi-tions near or on Earth.
C H A P T E R 3 1
SPACE WEATHER AND“OVER-THE-TOP” OPERATIONS
Twilight Approach—Photo by Erik Ritterbach

S P A C E W E A T H E R A N D “ O V E R - T H E - T O P ” O P E R A T I O N SC H A P T E R 3 1 307306
surpass the sun in terms of violence. When a primary cos-mic ray produces many secondary particles, we call this a cosmic-ray air shower. Cosmic rays can’t be completely stopped by any known shielding technology. At commer-cial jet aircraft operating altitudes, the percentage of GCR in the skies at solar minimum is 20% to 100% high-er than it is at solar maximum; GCR increases with alti-tude and latitude.
Solar protons, unlike GCR, are relatively easy to stop with materials such as aluminum or plastic; their inter-action with other particles may generate highly energet-ic secondary particles that provide a dose of radiation —but this is rare. Radiation may increase beyond recom-mended human dosage levels, but this will probably only occur during a SPE and not just from solar wind alone.
Cosmic radiation makes up, on average, about
17% of the natural background radiation to which
we are all exposed. The rest consists of radon gas
(50%), radiation from minerals in the soil (20%), and radia-
tion in our bodies from food and water (13%). These numbers
vary, with altitude and latitude being big players. But don’t
give up on being a pilot and become a train engineer to avoid
the cosmic risk! You would have to fly 100 one-way flights
between New York and Los Angeles to acquire the same ex-
posure as you get from other sources of natural background
radiation in one year!
At jet aircraft altitudes during solar minimum,
GCR is 2.5 to 5 times more intense in polar regions
than near the equator.
Most of the cosmic radiation that may possibly
affect crew members and frequent flyers origin-
ates from galactic cosmic rays — outside of our solar system.
The activity of the sun can reduce or increase this flux of
particles from space, but the sun itself is a weak source of
cosmic radiation.
Units and Dosage: Radiation absorption is measured in Sievert units, usually millisieverts (mSv) and microsieverts (μSv). The mSv is used for yearly exposure measure-ments, whereas the μSv (a thousand times smaller) is a more practical unit for hourly radiation dose. The FAA’s
Electromagnetic Radiation: The sun’s electromagnetic radiation spans the radio: infrared, visible, ultraviolet, X-ray spectrum and beyond. Electromagnetic radiation moves at the speed of light, and begins to affect the Earth’s atmosphere around eight minutes after it leaves the surface of the sun.
Solar Radiation: In addition to electromagnetic radiation, the sun constantly ejects clouds of matter in the form of subatomic particles known as solar protons. You may see the term SPE (Solar Proton Event), but because these events include other nuclei like helium ions and lots of electrons, the event is commonly deemed a solar particle event. The collective term for these clouds of streaming particles is the solar wind, and it is always present to some degree. The solar wind generally travels at speeds well below the speed of light, taking two to four days to reach the earth. During periods of increased activity, this speed increases, and the strength and direction of the earth’s magnetic field changes. The polar auroras (northern and southern lights) become larger and more vivid, but the ability of the ionosphere to propagate HF (High Frequency) radio signals is reduced, and GPS navi-gation accuracy may be impacted. This proton invasion is of insufficient energy to contribute to the radiation field at aviation altitudes. However, on occasion, proton particles are produced with sufficient energy to pene-trate the earth’s magnetic field and enter the atmos-phere. Such events are comparatively short lived and vary with the 11-year solar cycle; they are most frequent at solar maximum. Polar routes may not be practical during these events, since navigation and communica-tion may be affected, plus the presence of proton par-ticles produces a higher risk to human health. In most situations, protection is provided by three phenomena: the sun’s magnetic field, the earth’s magnetic field, and the earth’s atmosphere.
Galactic Cosmic Radiation (GCR): Radiation emanates from outside the solar system, exposing us to other sources besides the sun. In fact, most of the radiation that hits the earth does not come from the sun. Cosmic rays (GCR) are supercharged subatomic particles originat-ing from exploding stars and black holes; these rays greatly
Galileo and other European astronomers observed
sunspot activity over 400 years ago. They described
the spots as blemishes on the sun’s surface and
even speculated about their origin. Over the years, sunspots
have become a standard reference point when discussing the
sun’s variability and activity.
Solar Minimum: According to NOAA (National Oceanic and Atmospheric Administration) and NASA (National Aeronautics Space Administration), the sunspot cycle hit an unusually deep bottom from 2007 to 2009. In fact, in 2008 and 2009, there were almost NO sunspots. Due to the weak solar activity, galactic cosmic radiation on Earth was at record levels!
The sun’s activity varies over an 11-year cycle.
Many think that increased solar activity means
higher radiation. In reality and counterintuitively,
the opposite happens. When the sun is active, it shields the
inner solar system. When the sun is inactive, the Earth re-
ceives more cosmic radiation. At solar minimum, the GCR
flux increases by about a factor of three near the earth.
Solar Maximum: The sun’s record-breaking period of inactivity ended in 2010. We are now in Solar Cycle 24, which peaked in 2014. When it arrived, the peak of the 11-year sunspot cycle brought more solar flares, CMEs, and geomagnetic storms. However, this cycle produced a lower number of sunspots than the average of previ-ous cycles.
Sunspots are temporary intense magnetic activ-
ities that appear as dark spots on the sun. About
every 11 years, the sun starts to look like it has
a case of bad acne, as sunspots break out all over. Midway
through the cycle, the blotches vanish.
On a lighter note, the increased sunspot activity produces dazzling displays of auroras above our planet. The duration of these storms is on the order of days, with the strongest storms persisting for almost a week. The highest number of sunspots in any given cycle is designated the solar max-imum, while the lowest number is the solar minimum.
Figure 31-1: Nick Czernkovich’s photo, taken north of Yellowknife, Northwest Territories. He captured a dazzling display of vibrant green aurora borealis (northern lights) — a perk of northern flight.
Figure 31-2: Solar cycles and sunspot activities. We are on cycle 24, which peaked April 2014, but proved to be the tamest cycle in 100 years. The vertical axis depicts the number of sunspots, with years shown on the horizon-tal axis. Note: Galactic cosmic radiation is at a minimum on Earth during solar maximum, but during solar min-imum more radiation can reach the earth! (NASA’s photo.)
S P A C E W E A T H E R A N D “ O V E R - T H E - T O P ” O P E R A T I O N SC H A P T E R 3 1 309308
Of all of the sun’s emissions, it is actually UV rays
that pose the greatest risk to human health i.e.
potential skin cancer especially melanoma. Wear-
ing a baseball cap, sunscreen lotion, and a long sleeve pilot
shirt with huge sunglasses will not stop cosmic radiation, but
will provide needed protection from UV rays.
If a pilot accumulated a cosmic radiation dose of
5 mSv per year over a span of 20 years, his likeli-
hood of developing cancer would increase by 0.4%. The over-
all risk of cancer death in the western population is 23%;
thus, cosmic radiation exposure raises that risk from 23% to
23.4%. At least, so says one study found floating amongst
the cosmic universe of the Internet.
Monitoring Cosmic Radiation
There are third-party companies that assess estimated radiation exposure to pilots. One such company, the Ot-tawa-based PCAire (Predictive Code for AirCrew Radiation Exposure), allows Doug to log onto their site to determine his exposure for each flight flown. Passengers, especially frequent flyers, can also log in and set up an account.
My dose report for the last twelve months was
3.5 mSv.
These services measure the full range of radiation from both primary (sun) and secondary (outer space) sources. By using flight plans, years of measurements from on-board flights, and observations of the sun’s activities, a fine-tuned value for an individual’s radiation exposure can be determined.
Pilots that fly at low altitudes (in unpressurized
aircraft) are exempt from these readings because
flights below 15,000 feet receive negligible radiation expos-
ure and are omitted from the reporting data. That Twin Otter
job, island-hopping in the Caribbean wearing Bermuda
shorts, sounds more and more appealing.
The SST (Supersonic Transport) Concorde entered
service in 1976, retiring in 2003. From the outset,
cosmic radiation (both galactic and solar) was known to
present a hazard at cruising altitudes of 50,000 to 60,000
The atmosphere is a huge buffer against cosmic
radiation, so it’s something to take into consider-
ation when taking your “biz jet” up to FL 470. Even though
fuel burn decreases with altitude, cosmic radiation increases!
And if you plan on moving from near sea level to take up
basket weaving in Nepal nestled in the Himalayans, you will
be exposed to more radiation there, too.
There is a popular fallacy which insists that flights over the polar routes receive more radiation. But a recent ACPA (Air Canada Pilot Association) study showed that Boeing 777 pilots that fly the polar routes have the low-est average dose rate, of 4.5 μSv/hour, compared to an Embraer crew which clocks in at 6.5 μSv/hour. One ex-planation has to do with altitudes. When Doug flew the polar routes, it would take nearly ten hours for the air-craft to be light enough to climb to maximum cruising altitude. At lower altitudes, the air above offered protec-tion, even though the flight was over the pole. As flights fly south into Russian airspace, more and more protec-tion is obtained as the magnetic pole gets further away. As a result, longer domestic flights, and transcontinent-als or “Transcons” on the Embraer and Airbus A320, wind up with higher dose rates. Doug flew hundreds of Transcons on the Airbus A320.
The intensity of radiation due to solar activity is
much smaller than that caused by higher alti-
tudes or higher latitudes. There is about a 40%
decrease in intensity from solar minimum to solar maximum
conditions.
Cosmic Radiation Myths
It does not matter if you fly day or night, and for passen-gers, it does not matter if you sit in a window or aisle seat. GCR penetrates the aircraft from the top, sides and below. The only way to truly escape GCR is to fly in a concrete or lead enshrouded aircraft—and even then, the shield would have to be extremely thick. Remember that the substance in question is cosmic radiation and not ultraviolet radiation. Cosmic rays and charged par-ticles occur in different ranges on the electromagnetic spectrum, hence different frequencies, wavelengths and most importantly, energies.
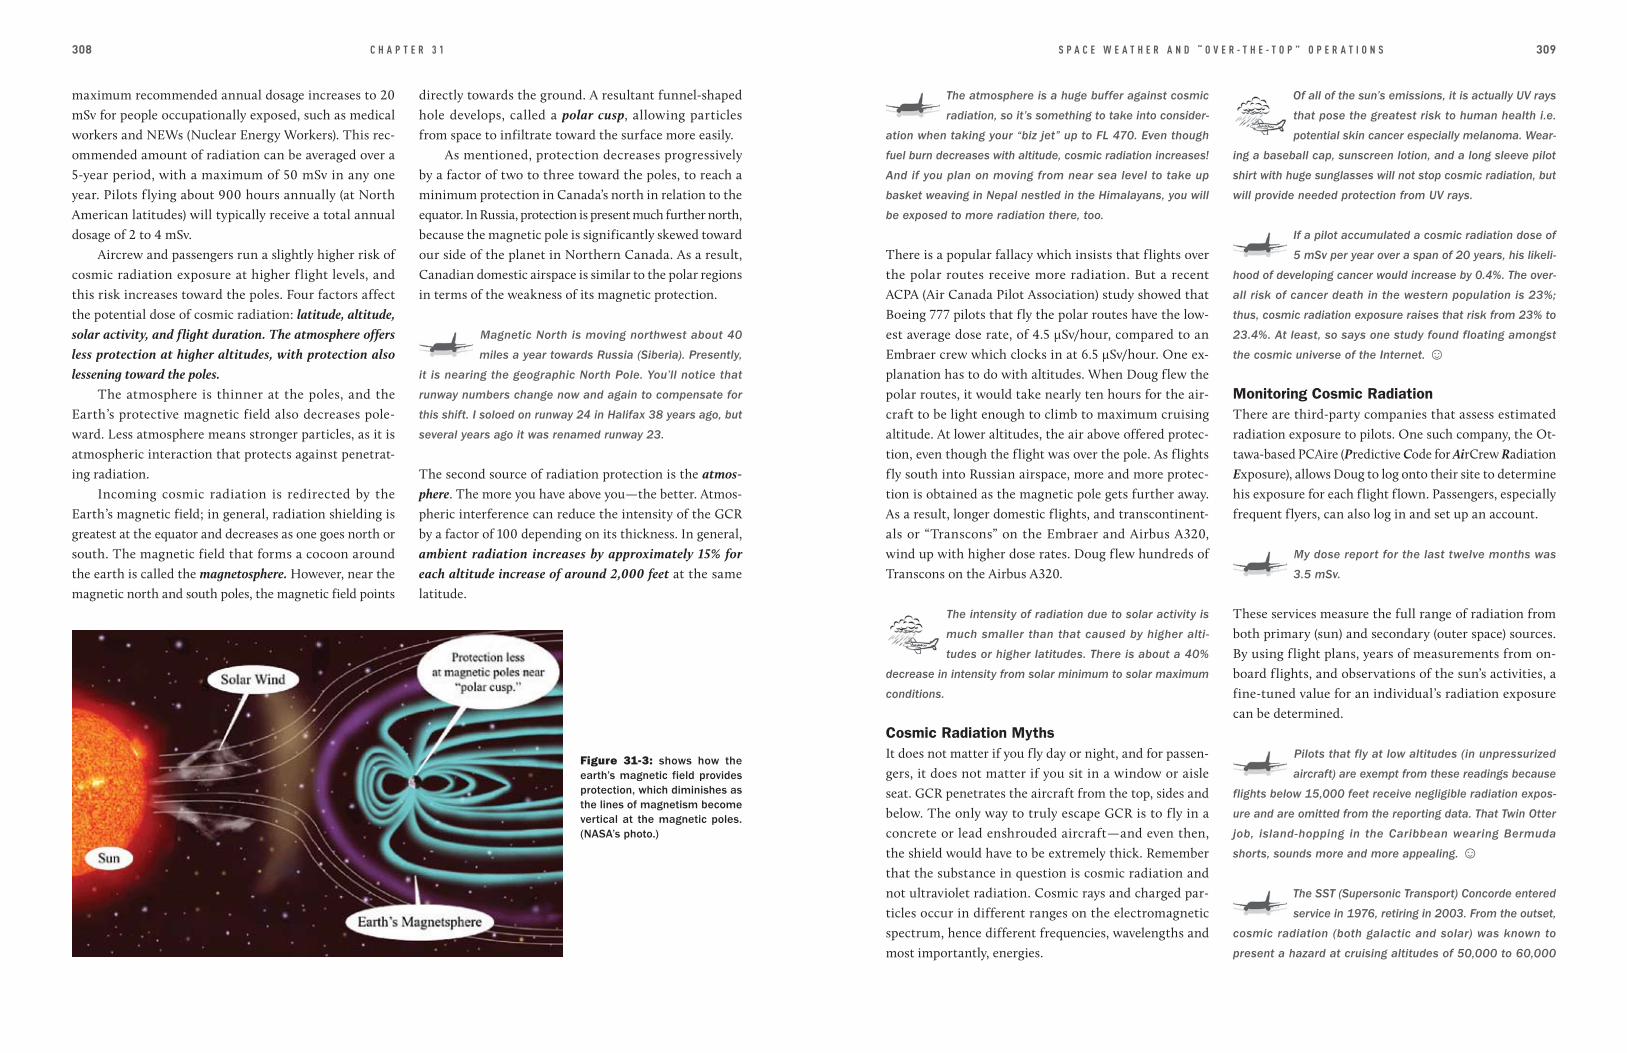
directly towards the ground. A resultant funnel-shaped hole develops, called a polar cusp, allowing particles from space to infiltrate toward the surface more easily.
As mentioned, protection decreases progressively by a factor of two to three toward the poles, to reach a minimum protection in Canada’s north in relation to the equator. In Russia, protection is present much further north, because the magnetic pole is significantly skewed toward our side of the planet in Northern Canada. As a result, Canadian domestic airspace is similar to the polar regions in terms of the weakness of its magnetic protection.
Magnetic North is moving northwest about 40
miles a year towards Russia (Siberia). Presently,
it is nearing the geographic North Pole. You’ll notice that
runway numbers change now and again to compensate for
this shift. I soloed on runway 24 in Halifax 38 years ago, but
several years ago it was renamed runway 23.
The second source of radiation protection is the atmos-phere. The more you have above you—the better. Atmos-pheric interference can reduce the intensity of the GCR by a factor of 100 depending on its thickness. In general, ambient radiation increases by approximately 15% for each altitude increase of around 2,000 feet at the same latitude.
maximum recommended annual dosage increases to 20 mSv for people occupationally exposed, such as medical workers and NEWs (Nuclear Energy Workers). This rec-ommended amount of radiation can be averaged over a 5-year period, with a maximum of 50 mSv in any one year. Pilots f lying about 900 hours annually (at North American latitudes) will typically receive a total annual dosage of 2 to 4 mSv.
Aircrew and passengers run a slightly higher risk of cosmic radiation exposure at higher f light levels, and this risk increases toward the poles. Four factors affect the potential dose of cosmic radiation: latitude, altitude, solar activity, and flight duration. The atmosphere offers less protection at higher altitudes, with protection also lessening toward the poles.
The atmosphere is thinner at the poles, and the Earth’s protective magnetic field also decreases pole-ward. Less atmosphere means stronger particles, as it is atmospheric interaction that protects against penetrat-ing radiation.
Incoming cosmic radiation is redirected by the Earth’s magnetic field; in general, radiation shielding is greatest at the equator and decreases as one goes north or south. The magnetic field that forms a cocoon around the earth is called the magnetosphere. However, near the magnetic north and south poles, the magnetic field points
Figure 31-3: shows how the earth’s magnetic field provides protection, which diminishes as the lines of magnetism become vertical at the magnetic poles. (NASA’s photo.)

S P A C E W E A T H E R A N D “ O V E R - T H E - T O P ” O P E R A T I O N SC H A P T E R 3 1 311310
Geomagnetic Storm Scale
G5 (Extreme) Power grids can collapse, transformers are damaged, spacecraft will see extensive surface charging, HF radio blackout in many areas for one to two days, low-frequency radio outage for many hours, aurora seen as low as the Tropics! Other systems: Satellite navigation maybe degraded for days. Even pipelines can be affected, with hundreds of amps running through them. Typically, a G5-level storm
occurs at a rate of 4 per 11-year solar cycle.
G4 (Severe) Voltage stability problems in power systems, satellite orientation problems, induced pipeline currents, HF radio propagation sporadic, low-frequency radio disrupted, satellite degradation for several hours.
G3 (Strong) Voltage corrections required on power systems, false alarms triggered on protection devices, increased drag on satellites, low-frequency radio navigation problems, aurora seen as low as mid-latitudes, intermittent satellite and HF problems. G3s occur at a rate of 200 per cycle.
G2 (Moderate) High-latitude power systems affected, drag on satellites effect orbit, HF radio propagation fades at higher altitudes, aurora seen at latitudes of 50 degrees.
G1 (Minor) Slight power grid fluctuations, minor impact to satellites, aurora seen at high latitudes (60 degrees).
Adapting to Space Weather
What can be done about space weather? Airlines using polar routes have adopted the policy that flights will not be conducted if solar radiation, radio blackout, or geo-magnetic storm activity is at level 4 or 5. Solar radiation
Radio Blackout Scale
R5 (Extreme) Complete HF radio blackout on the entire sunlit side of the earth for a number of hours, navigational outages on sunlit side for many hours. Satellite navigation errors will ensue as well.
R4 (Severe) One to two hour HF blackout on sunlit side of Earth, minor satellite navigation disruptions.
R3 (Strong) Wide area of HF blackout, loss of radio contact for mariners and en route aviators for about an hour, low-frequency navigation degraded.
R2 (Moderate) Limited loss of HF radio, some low-frequency navigation signals degraded.
R1 (Minor) Minor degradation of HF, minor low-frequency navigation signal degraded.
Yet another feature of space weather is the geomagnetic storm scale, which measures worldwide disturbances of the earth’s magnetic field. It, too, is ranked from 1 to 5. A G1 rating indicates slight power grid fluctuations and minor impact to satellites, whereas a G5 is extreme and denotes possible power grid collapses, damaged trans-formers, and radio blackout in many areas for one to two days. During a G5, the unreliability of satellite naviga-tion and communication, coupled with possible ground-level power outages, puts a halt to polar operations.
Solar Radiation Storm Scale
S5 (Extreme) High radiation hazard to commercial jets (equal to 100 chest X-rays), loss of some satel-lites, no HF communications in polar regions.
S4 (Severe) Radiation hazard to commercial jets (equal to 10 chest X-rays), satellite tracker orientation problems, and blackout of HF radio at polar cap for several days.
S3 (Strong) Radiation hazard to jet passengers (equal to 1 chest X-ray), permanent damage to exposed satellite components, degraded HF at polar cap.
S2 (Moderate) Infrequent satellite event upsets, slight effect to navigation and HF at polar regions. For this
level and higher pregnant woman are particularly
susceptible.
S1 (Minor) Small effect on HF radio in the polar region.
NOAA’s Space Environment Center (SEC) operates
a worldwide network of sensors that continuously
observe conditions between the earth and the
sun. Their website offers excellent real-time information on
electromagnetic and solar radiation. The frequency of oc-
currence for an S5 (extreme) is less than 1 per 11-year
cycle; S4 (severe), 3 per cycle; S3 (strong), 10 per cycle;
S2 (moderate), 25 per cycle; and S1 (minor) 50 per cycle.
Another element of flight impacted by space weather is radio reception. Again, NOAA broadcasts a five-level range of severity. High-frequency (HF) aircraft radios work by bouncing transmissions off the ionospheric lay-ers, allowing for long-distance communications. A R5 rating means radio communication will not be possible for hours. Luckily, FANS (Future Air Navigation Systems) work through satellites, lessening the reliance on HF. FANS played a major role in making polar flights a reality.
The “extreme” R5 occurs nearly once in the 11-year
solar cycle and blacks out the entire sunlit side of
the earth for hours. The more common “strong”
R3 blackouts occur at a rate of 175 per solar cycle and cause
roughly a 1-hour communications blackout. The least prob-
lematic condition, a minor R1 radio blackout, occurs at a rate
of 2,000 per 11-year solar cycle, resulting in a degraded or
lost ability to communicate for several minutes. For long-
range flights that implement HF radio for communication and
position reports, flight routes will be altered.
feet. The Concorde came installed with permanent radiation
monitoring equipment, amassing tons of data. But keep in
mind: the time this model spent exposed to higher values
was less because of its speed.
Route Average Dose Rate (μSv/hr)
Domestic < 1.5 hr 3.2
Domestic > 1.5 hr 6.2
California 5.6
Florida 5.0
Caribbean 4.8
Mexico 4.8
Asia 4.5
Europe 5.8
Southern Hemisphere 3.7
Figure 31-4: Dose rates per hour for various destinations from a recent study. The good news is that these rates were observed during low solar flare activity in 2009 (which results in higher cosmic radiation). Consequently, one can expect that in most years the exposure should be less than these values. In com-parison, the average dose rate for the SST Concorde was 12 to 15 μSv per hour.
A typical annual dose for an airline pilot is 2 to 4
mSv. A chest X-ray is 0.4 mSv, a mammogram is
0.7 mSv, and a CAT scan of the chest is 8 mSv —
almost two to three years of airline flying. An angioplasty
(heart study) may be as high as 57 mSv!
NOAA categorizes the potential impact of electro-magnetic and solar radiation by ranking these levels on a severity scale from S1 to S5. The National Oceanic and Atmospheric Administration’s (NOAA) Space Environ-ment Center (SEC) operates a worldwide network of sensors, maintained primarily through satellite data. S1 and S2 allow for a safe journey, whereas an S5 is equal to about 100 chest X-rays. Forecast levels of S4 and S5 pro-hibit polar flights (above 78°N), with S3 imposing lower altitudes or a more southerly polar route.
Figure 31-5: The “original” four polar routes. Polar route #2 is the closest to the North Pole — about 60 nautical miles away. No polar route goes directly over the pole. Because travel “over the top” has increased exponentially in recent years, there are now TEN polar routes.

S P A C E W E A T H E R A N D “ O V E R - T H E - T O P ” O P E R A T I O N SC H A P T E R 3 1 313312
THINGS YOU SHOULD KNOW . . .
Higher solar activity actually means a lower dose of radiation. Cosmic radiation reaching the earth is more intense during a solar minimum.Solar radiation is ranked from S1 to S5. Polar flights are banned during radiation ratings of S4 and S5.Geomagnetic storms and radio blackouts are also ranked in severity from G1 to G5 and R1 to R5, respectively. Four factors affect radiation levels:
7. Altitude (the lower, the better), 8. Latitude (the further south, the better), 9. Solar activity (the higher the activity, the
lower the cosmic radiation). 10. Duration of flight (the shorter, the better).
Radiation absorption is measured in units of Sievert and fractions thereof: millisieverts (mSv) and sometimes microsieverts (μSv). Our Earth is continuously bathed in high-en-ergy radiation known as GCR (Galactic Cosmic Radiation) emanating from outside the solar system.We are also exposed to sporadic bursts of ener-getic particles from the sun known as SPE (Solar Proton Events). Coronal mass ejections are massive clouds of hot gases and magnetic force fields. These ejections actually reduce radiation emanating from outside our solar system.
Flight dispatch monitors space weather websites daily for polar-destined f lights. On most polar routes, the flight dispatcher will add comments on the flight plan. For example: 1. No fuel-freeze issue 2. No solar issues expected 3. HF conditions reported fair.
Suitable Alternate Airports
Yet another consideration is the availability of suitable airports in case of a serious medical situation or other emergencies, particularly in Arctic winters. Two Arctic survival suits, along with other environmentally appro-priate clothing (boots, gloves, hats) are on board in case one has to exit the airplane to coordinate services after landing. (Rest assured, the junior pilot will be delegated this task ). But think about it—landing a fully loaded airliner with over 450 passengers and crew in a remote airport in harsh weather conditions is an emergency in itself. No wonder many airlines remind pilots of this, and caution them to land in the polar regions only in dire situations.
One airport in close proximity of the transpolar
routes is Tiksi, Russia. Briefing notes highlight the
fact that it lies in the coldest region of the north-
ern hemisphere, with temperatures possibly reaching as low
as −50°C (−58°F)!
It takes six hours to reach the North Pole from
Toronto. From Toronto to London, England, the
flight is only six hours and thirty minutes. It’s a big country
to the north! Keep in mind as well that, for polar flights, six
to ten hours of fuel burn is necessary for a long-haul aircraft
to be light enough to reach optimum cruising altitude. Chi-
cago to Hong Kong is about 16 hours.
to 90 minutes or less. Depending on the aircraft, engine type, and type of jet fuel, the fuel on board may be ana-lyzed and the actual-fuel-freeze point determined. Flight dispatch may data-link this actual-fuel-freeze temper-ature to the flight deck after the flight is airborne.
Years ago, while on a polar flight, this very prob-
lem came up for me: the jet fuel cooled to below
−40°C, triggering a caution advisory in the fuel-temperature-
monitoring system. Our fuel had a freezing threshold of
−47°C, making immediate action unwarranted. If the condi-
tions had persisted, procedures would have required us
either to descend into warmer air or increase speed. Speed-
ing up increases adiabatic compression (heating) and surface
friction hence TAT (Total Air Temperature) but the effect is
marginal. (Remember: these flights are over the North Pole,
so finding warmer air below is also highly unlikely in the
middle of winter). Descending burns more fuel, as does in-
creasing speed. Luckily, temperatures were forecast to warm
up — and they did!
at level 3 requires polar flights to be conducted at FL310 or below. Hours before each polar flight, flight dispatch determines whether space weather is deemed safe. Sometimes varying the route or changing the cruising altitude guarantees a safe flight.
Electronic components of aircraft avionic systems
are also susceptible to damage from cosmic rays,
solar particles and the secondary particles gener-
ated in the atmosphere.
If for some reason your flight takes you directly
over the North Pole, you should exercise caution
due to the possibility of aggressive autopilot maneuvers when
the heading fluctuates from north to west to east to south.
Extreme Climate
The extreme cold found in northern Canada and Siberia also has an impact on polar flights, as it can potentially freeze fuel. Flights into areas of −65°C must be restricted
Figure 31-6: A Flight Level 350 temperature depiction of the North Pole and northern latitudes. The four “original” polar routes are superimposed on the chart. (WSI chart).

339
A P P E N D I X I
CRACKING THE CODE
why are some codes, such as CDG for Charles de Gaulle, France easy to crack, while Saskatoon, Canada gets sad-dled with YXE?
Years ago, the National Weather Service devised a two-letter identification system to keep a handle on weather throughout the U.S. When aviation was in its infancy, airlines simply adopted that system, but as major expansion occurred, more and more towns without weather stations needed codes as well. IATA, the Inter-national Air Transport Association, then created three-letter identifiers for airports around the world. Canadian
For many pilots, airport identifiers seem like a mystery. Not to worry, it’s not as complicated as the Da Vinci Code.
You’re off to Chicago. You notice three mystifying letters—ORD—are assigned to this airport. Why the confusing code? History has a lot to do with it. Airport codes may be designated based on geographical loca-tion, the name of the airport, or some sort of personal tribute. For instance, DEN for Denver, Colorado falls under the first type, whereas New York’s JFK designa-tion honors President John F. Kennedy. The code for the world’s busiest airport, Atlanta, is obvious (ATL). So
This diagram lists the first letter of the world’s ICAO codes.
Flying on Top of Nimobstratus Clouds—Photo by Scott Dennstaedt

341
A P P E N D I X I340
A P P E N D I X I I
TIME FOR WEATHER
longitude of Greenwich, England, as zero degrees and established the 24 time zones starting from Greenwich. Universal Time, based on the mean solar time in Green-wich, England, emerged and became known as GMT or Greenwich Mean Time.
However, in 1972, GMT gave way to UTC (Coordin-ated Universal Time, or Universal Coordinated Time), which uses the much more precise cesium atomic clock to keep time. The atomic clocks consider the tiny hic-cups in the Earth’s rotation of about one second every year by incorporating leap seconds. But most time zones continue to compute their local time referencing the Prime Meridian located in Greenwich. Meanwhile, GMT no longer exists as a time standard, although the term GMT is often incorrectly used to denote universal time.
Just as determining the location for the epicenter of the Prime Meridian proved difficult, finding a label for the UTC met with resistance as well—hence the pecu-liar acronym for Coordinated Universal Time. English speakers and French speakers each wanted a term that ref lected their respective languages: “CUT” for “Co-ordinated Universal Time” and “TUC” for “Temps Uni-versel Coordonné.” This resulted in the final compromise of UTC.
WHERE DID “ZULU” COME FROM?
The military and NATO assigned each time zone a phonetic letter, with “Z” or “Zulu”, standing for zero de-grees longitude. Every letter is used except “J,” which is reserved for denoting the current local time of the ob-server. This seems odd, since 24 time zones exist and 26
Aviation forecasts adhere to it; surface analyses, radar, satellite pictures and upper air soundings have it ap-pended to them; hourly weather observations around the world abide by it. A weather observer might report −40°C in Alert (Canada’s high Arctic), +40°C in Dubai, U.A.E., and fog in San Diego all time stamped at 1000 Zulu. Everything related to aviation weather is inscribed in Zulu, and for some pilots, this can be a little daunting.
Because weather moves freely and doesn’t recognize political boundaries, time must be consistent as it shuf-fles from time zone to time zone. Standardized time, formerly known as Greenwich Mean Time, is now UTC. But why the confusing acronym UTC for Coordinated Universal Time? Why the “Z”? And where is the begin-ning of time?
THE BEGINNING OF TIME
In 1878, Sir Sanford Fleming, a Scotsman who immigrat-ed to Canada, proposed the system of worldwide time zones we use today after noting the inconsistencies of time implemented by the railroad system. Most towns had their own local time based on when the sun peaked at high noon. Fleming recommended that the world be divided into 24 time zones, since the Earth turns one full rotation once every 24 hours. Though heralded as a brilliant solution to a chaotic problem, Fleming’s time zone plan turned out to be difficult to implement, be-cause each country wanted to be in possession of the “Prime Meridian of the World”—the place that the rest of world references when establishing time. After much debate, the Prime Meridian Conference selected the
weather offices associated with an airport use the letter Y, making it easy to identify Canadian airports, but dif-ficult to remember individual codes. Some are easy to figure out: Vancouver is YVR, YWG means Winnipeg, and YQB designates Quebec City. But Toronto’s Lester B. Pearson, the country’s busiest airport, gets the not-so-obvious designator YYZ.
Incidentally, ORD is named for Orchard Field, and that airstrip’s moniker is a tribute to pilot Lt. Cmdr. Ed-ward O’Hare. To make things more confusing, the ICAO (International Civil Aviation Organization) has also im-plemented its own four-letter identifier for each airport. These codes are used for flight planning, aircraft naviga-tion computers, and weather info. You may be off to London, Heathrow (LHR), but you’ll have to input the ICAO four letter equivalent—EGLL into the flight man-agement computer. Want to unravel this code? It’s E for northern Europe, G for Great Britain, L for London-con-trolled airspace and L for London, Heathrow airport. Canada and the United States use “C “and “K”, respect-ively, for ICAO codes, so YOW (Ottawa) straightforward-ly becomes CYOW and BOS (Boston) is KBOS. When you fly over Alaska a “P” is appended so Anchorage is PANC. If you fly in and out of Mexico and the Western Caribbean add an “M” with the Eastern Caribbean re-quiring a “T.” BDA is Bermuda’s IATA code, but TXKF is the ICAO code.
Doug and Scott know dozens and dozens of codes, but there are still a few they must look up—and you will too. Airport codes are “need to know” information, and many websites are now available to help bust the code. Interesting permutations can arise; in the name of re-search, we identified SEX for the airport Schacksdorf, Germany, FUK for Fukuoka, Japan, and HEL for Hel-sinki, Finland.

T I M E F O R W E A T H E R ( Z U L U T I M E )A P P E N D I X I I 343342
The red-orange time ball slowly on the rise. It’s about 12:55 p.m local.
FACTS
The difference between 2400Z and 0000Z—which both depict midnight Zulu—2400Z is used for the end of the day and 0000Z is for the beginning.GMT is still often used as a synonym for UTC. Be careful when observing charts labeled 0000Z, because this designation indicates the start of a new day. For example, 0000Z on the 24th is actually 1900 Eastern Standard Time on the 23rd. Greenwich is a must see for any aviator and can be accessed by the “tube,” the historic underground foot path or scenic boat ride.
clocks. In comparison, overhead satellites send continual signals to update flight deck clocks. Why not drop the ball at noon? Well, the astronomers chose one o’clock because at noon they were too busy with their astro-nomical duties of measuring the sun as it passed the lo-cal meridian. The ball-dropping event is somewhat un-eventful. It rises half way to the top at 12:55 and reaches the top at 12:58, dropping exactly at 1.00 p.m., but with-out noise—so be careful! With a blink of an eye, you may miss it. If you’re planning to make a tourism stop, make sure you plan to get there before one o’clock local so you can see the red time ball drop.
Weather has no political boundaries and the param-eter used to observe and forecast it shares a commonality all countries in the world can agree to—universal time. “Zulu” keeps aviation and weather in sync.
Shephard Clock: 12 noon points to the bottom. The minutes are in-scribed on a different scale. The time is 6 minutes after 11:00 am local.
Convention, but it has been in (or advocated to be in) Paris, Philadelphia, and near the Great Pyramids of Giza, among other locales. The modern Prime Meridian goes south from the North Pole through the United Kingdom, France, Spain, Algeria, Mali, Burkina Faso, Togo, Ghana, Queen Maud Land (Antarctica), and on to the South Pole. A laser projecting from the Royal Observatory structure in Greenwich marks the location’s genesis.
Greenwich itself is a popular tourist destination. It includes the Royal Observatory, perched on a hill over-looking the River Thames, and the Shepherd Gate Clock, which was the first to provide Greenwich Mean Time to the public. The clock is unique in the fact that the hour band goes around the dial once every 24 hours, so that at noon it’s pointing to the bottom.
Atop the observatory is the conspicuous red-painted Greenwich “time ball.” The ball has dropped every day since 1833 at precisely 1:00 pm, serving as a visual cue to the navigators on the River Thames to synchronize their
letters make up the alphabet—however the time zone bisected by the International Date Line utilizes two let-ters: “M”/“Mike” and “Y”/“Yankee.”
Coordinated Universal Time (UTC) uses the 24-hour, or military, clock. For example, 3:00 p.m. in Montreal is 15:00 in military time. If you add 5 hours (to account for the discrepancy between Eastern Standard Time and Coordinated Universal Time), it is 2000Z (UTC). (You would only add four hours during Eastern Daylight Time). To confuse the issue Arizona and Hawaii do not observe Daylight Savings Time. Some places like New-foundland, Canada and India, base their clocks on the half hour. (Try giving a P.A to passengers on arrival time in New Delhi, India near the end of a 14-hour flight).
Keep in mind that the baseline of the international time zone system is still in Greenwich, England. The Prime Meridian is the meridian or line of longitude at which longitude is defined to be 0°. Currently, the Prime Meridian is in Greenwich, as decided by International
Time zones and their corresponding letters.

345
A P P E N D I X I I I
THERE I WAS. . .
tracks and then follow them into the airport. Yes, for us, IFR meant “I Follow Railroads”—classic ‘scud running’.
I noticed, during my days as a first officer when the weather was good, the construction of a new highway that started from Chatham and appeared to head all the way to Bathurst. I decided that, when I went captain, I would fly low and over the highway instead of using the railroad technique.
Going captain came fast, and during the first week after getting my fourth stripe, the weather came down in New Brunswick. We requested special VFR out of Chatham following the usual procedure; however, the six-hundred-foot overcast cloud deck quickly turned into two hundred feet of overcast over the hills to the north. I told my first officer we would take the highway into Bathurst, as it was the first recognizable object to appear while we were frantically scanning for landmarks in the murky conditions. There we were, less than two hundred feet above the deck, barreling down over the highway at 180 knots. Two things I didn’t realize: first,
Most aspiring pilots face the daunting task of building f light hours needed to attain those golden airline ca-reers. Many times, these aspiring pilots pay their dues at small bottom-feeder companies whose reputations are dubious and whose procedures may raise some eyebrows.
I, like most pilots pining for that illustrious flying job, decided to leave my cushy federal posting as a me-teorologist and jump ship to fly Navajos at a small air courier operation based in Halifax, Nova Scotia. I soon realized it was nothing but ‘bush f lying’ on Canada’s East coast. With the planes barely equipped for IFR, the weather took top priority on the list of challenges. Our procedure for deicing the windscreens while flying (few were electrically heated) had us reaching our arm out from a small side window to scrape the window with a car windshield wiper on the approach.
The company had three runs departing in the wee hours of the morning. One five-airport route entailed flying from Halifax, N.S., to Moncton, N.B., to Chatham N.B (blessed with a 10,000-foot runway abandoned by the military), then further north to Bathurst, N.B, and Bonaventure, Quebec, before resting in Charlo, N.B for the day and back-tracking along the same route in the evening.
Bathurst only had an NDB (Non Directional Bea-con) i.e. non-precision approach, but its high break-out limits meant a successful landing in low crappy weather wasn’t going to happen. Besides, time was crucial in the courier business, so doing a ‘straight-in scud run ap-proach’ proved faster and far more productive than a full-procedure NDB approach. The procedure to get into Bathurst with dubious weather was to request special VFR out of Chatham, head due north to hit the railway
Too Close For Comfort, Doug’s Story...—Artwork by Nina Ageyeva

347
A P P E N D I X I I I346
Air Mass: A large body of air in which temperature and moisture are uniform throughout the horizontal.
AIRMET (Airmen’s or Airman’s Meteorological Advisory)
or (Airmen’s Meteorological Information): Descrip-tion of weather occurring or may occur (forecast) along an air route that may affect aircraft safety.
Albedo: Reflectivity of the earth’s surface and its atmos-phere.
Alberta Clipper: A small but fast moving low pressure system that forms to the lee of the Rocky Mountains (Alberta, Canada).
Aleutian Low: Low pressure system that develops near the Aleutian Islands, Alaska.
Altimeter Setting (QNH): The local pressure value set to the scale of a pressure altimeter to read altitude above mean sea level. It is cal culated by adding the weight of a fictitious column of air between the elevation of the sta-tion and mean sea level based on a tem perature of 15°C and a standard lapse rate of 1.98°C/1,000 feet. Please note Mean Sea Level calculations use an average 12-hour temperature.
Altimeter: Instrument that indicates altitude of an air-craft usually above sea level.
Altocumulus (Ac): Middle cloud. May produce a light shower.
Altocumulus Castellanus (Acc): Unstable middle cloud with a common base and turrets (castellations).
Altocumulus Standing Lenticular (ACSL): Middle based lenticular cloud possibly indicating a mountain wave.
Altostratus (As): A stable middle cloud. A precursor to advancing weather.
AMDAR (Aircraft Meteorological Data Relay): System
A
Absolute Altitude: Height of an aircraft above the terrain. Absolute instability: When the actual (environmental)
temperature lapse rate exceeds the DALR (Dry Adiabat-ic Lapse Rate).
Accretion: Growth of a precipitation particle by the colli-sion of an ice crystal or snowflake with a supercooled liquid droplet.
ADDS (Aviation Digital Data Service): National Weath-er Service’s aviation website.
Adiabatic Cooling: Cooling of a gas by expansion.Adiabatic Heating: Warming of a gas by compression.Adiabatic Process: Change of temperature of a gas by
expansion or compression without the transfer of heat with a parcel of air and its surroundings.
Advection Fog: Formed when relatively warm moist air advects over a cool surface.
Advection: Horizontal movement of air. (See Convection, the vertical movement of air).
Aggregation: Clustering of ice crystals to form snow-flakes.
AGL (Above Ground Level): Cloud heights are reported in AGL in METARs and TAFs.
Air Density: Air density decreases with increasing altitude similar to pressure. It also changes with temperature and humidity. At sea level and 15 °C, air has a density of approximately 1.225 kg/m3.
Air Mass Thunderstorm: Produced by a local air mass; sometimes called garden-variety thunderstorms, but more correctly termed “pulse” thunderstorms. Some books downplay their intensity. They can still ruin your day.
unseen in the gloom, it poked menacingly into the sky to at least five hundred feet. Farther down the road, we narrowly navigated around two other, smaller towers. We did make it into Bathurst and finally to our last stop, but the lesson learned proved insurmountable. My first officer, still a good friend to this day, brings it up as one of those “There we were. . .” stories!
the new highway wasn’t completed and it quickly ran into the old highway, and second, the old highway had very tall communication towers along the roadside. Luckily, my first officer knew about them, and all of a sudden, he yelled, “Tower!!!” It was a ghastly feeling, f lying so close to the tower with the guy wires clearly visible. The tower f lashed strobes, which meant that,
GLOSSARY
As for me, I’ve been teaching weather to ‘wannabe pilots’ for years, and I always end my last class with my ‘brush with death’ story. I drive it home to the class that they should always set limits for themselves, and if things start going to hell in a handbasket�—�get out of there! Also, do try to follow the procedures set out by the company; even if they seem a little different and questionable, they tend to be tried and tested.

G L O S S A R YG L O S S A R Y 349348
surface to approximately 2,000 feet where friction plays a major part on flow.
Broken (BKN): Cloud layer covering 5/8 to less than 8/8ths (or 7/8ths) of the sky and constitutes a ceiling.
Buoyancy: The property of an object that allows it to float on the surface of a liquid or ascend through air.
Buys Ballot’s Law: By standing with one’s back to the wind in the northern hemisphere the low pressure is to the left.
C
Calm: Absence of wind with speeds near zero.Campbell Stokes Recorder: Measures amount of sun-
shine by burning onto a paper card through the magni-fying glass ball. Most weather offices no longer use this device.
Campbell Stokes recorder.
Cap Cloud: A stationary cloud crowning a mountain or hill. It may be associated with a mountain wave.
Carburetor Icing: The formation of ice in the carburetor when moist air is cooled to the frost point. It can be detrimental to engine operation.
CAT (Clear Air Turbulence): Associated with jet streams but NOT always. CAT is high-level turbulence not as-sociated with convective clouds.
Barometer: Device to measure atmospheric pressure. Two types are mercurial and aneroid.
Beaufort Wind Force Scale: A scale ranging from zero to 12 used to estimate the force of marine and land winds based on observed effects on sea state or on land.
Bergeron Process: Ice crystal theory. A process that pro-duces precipitation. Tiny ice crystals in a supercooled cloud growing larger at the expense of the surrounding liquid droplets.
Bermuda High: Semi-permanent subtropical high over Bermuda’s waters.
Billow Cloud: Puffy cumulus cloud.Blizzard: A snowstorm characterized by low temper-
atures, strong winds with low visibilities in drifting and blowing snow with sub stantial snow accumulations. 1. Sustained winds or frequent gusts must be 35 mph (30 knots) or greater. 2. Significant falling and/or blowing snow reducing visibility to under a 1/4 mile. 3. These conditions must continue for at least three consecutive hours.
Blocking System: Large-scale patterns in the atmosphere that are nearly stationary which block or redirect weather systems. They are also known as blocking highs or blocking anticyclones. An Omega block is a blocking system.
Blowing Dust (BLDU): Dust raised by the wind to moder-ate heights above the ground. If the visibility is reduced to 1/4 SM or less, blowing dust and blowing sand will be reported as heavy (+BLDU). The visibility at eye level is reduced.
Blowing Sand (BLSA): Sand raised by the wind to mod-erate heights above the ground. If the visibility is re-duced to 1/4 SM or less, blowing dust and blowing sand will be reported as heavy (+BLSA). The visibility at eye level is reduced.
Blowing Snow (BLSN): Snow raised by the wind to suf-ficient heights above the ground to reduce the horizon-tal visibility at eye level to 6 SM or less.
Blowing Spray (BLPY): Visibility reduced to high winds blowing spray onto the airport. You may see this observed during hurricane season.
Boiling: When water changes from liquid to a gas (vapor) at standard pressure (100°C or 212°F) at sea level.
Boundary Layer: The layer of the atmosphere from the
Arctic Air Mass: Cold dry air mass.Arctic Sea Smoke: Fog which forms when very cold air
moves over warmer water. ARINC: Aeronautical Radio Incorporated. Provider of
transport communications and systems engineering solutions for aviation and other industries.
ASL (Above Sea Level): Also, known as MSL (Mean Sea Level). Altitude of any object relative to the average sea level datum.
ASOS (Automated Surface Observing System): Weath-er observing system operated and controlled by the NWS, FAA and DOD (Department of Defense).
ATIS (Automatic Terminal Information Service): A con-tinuous broadcast of recorded aeronautical information in busier terminal areas.
Atmosphere: The compilation of gases that surround the earth.
Atmospheric Moisture: The presence of water in vapor, solid or liquid states typically ranging from zero to 4%.
Atmospheric Pressure: The weight of a column of air measured in inches of mercury (Hg), millibars, hecto-pascals (hPa), pounds per square inch, millimeters of mercury, etc.
Attenuation: Reduced radar intensity due to absorption by clouds and precipitation.
Aurora Borealis: The luminous radiant emission from the upper atmosphere that appears over middle and high latitudes, and is centered on the earth’s magnetic poles.
AWC (Aviation Weather Center) The main aviation fore-cast center for the U.S located in Kansas City, Missouri.
AWOS (Automated Weather Observation System)
Automated weather sensors designed to serve aviation and meteorological observing needs for safe and effi-cient aviation/weather operations.
AWWS (Aviation Weather Web Site): NAV CANADA’s site to disseminate Canadian aviation weather.
B
Backing: Change of wind direction in a counterclockwise direction. Opposite of veering.
Baroclinic Zone: Transitional or mixing zones at or near fronts.
obtains meteorological data from the aircraft’s naviga-tion and flight data systems.
Anabatic Wind: In mountain meteorology, an upslope wind created by heating (usually daytime insolation) of the slope surface under fair-weather conditions.
Analysis: Interpretation of the pattern of various weath-er parameters on a surface or upper air chart.
Anemometer: Strictly speaking, it’s an instrument for measuring wind speed only, with many having three cups. But newer and more modern devices are vane an-emometers which measure both speed and direction. The anemometer is normally exposed at the inter-nationally agreed height of 10 meters (about 33 feet).
Aneroid Barometer: Instrument for measuring atmos-pheric pressure that does not involve liquid.
Angular Momentum: A result of an object’s mass, velocity and radial distance of rotation.
Anomalous Propagation (AP): False radar returns pro-duced by unusual rates of refraction in the atmosphere.
Anticyclonic Flow: Clockwise rotation of air around an anticyclone (high pressure) in the Northern hemisphere.
Anti-ice Fluid: Fluid that prevents ice and snow accretion and designed to shear away during the takeoff roll.
Anti-Icing Equipment: Aircraft equipment used to prevent airframe icing.
Anti-icing fluid: It provides protection against the forma-tion of frost and/or ice and the accumulation of slush and/or snow on treated sur faces of an aircraft for a specific time during active frost, frozen precipitation, and freezing precipitation.
Anvil Cloud: Top portion of a cumulonimbus due to a flattening effect as it hits the tropopause taking on the appearance of a black smith’s anvil.
Anvil cloud associated with a cumulonimbus cloud topped at 46,000 to 50,000 feet over Montana.

367
G L O S S A R Y366
Anvil 21, 27, 160–165, 179, 287Arctic Haze 334, 335, 337Arctic Sea Smoke 57, 69Arctic Stratospheric Jet 253, 254ATIS (Automatic Terminal Information Service) 67, 87,
129, 173, 221, 222Atmosphere 1–16, 22, 24, 26, 29, 31, 32, 39, 40, 47, 48, 53–
59, 64, 75, 88, 93, 99, 111, 134–141, 149, 155, 160, 168, 215, 220, 223, 229, 237, 246, 248, 251, 255, 259, 271, 271–275, 291, 297, 307–309, 312, 317, 321, 335
Atmospheric Layers 295Atmospheric Pressure 4, 31, 33, 46, 70, 87, 108, 109, 180,
219, 220, 223, 255, 325, 330Atmospheric Stability 9, 64, 100, 148Attenuation 276, 279, 284, 286, 288Aurora Borealis 4, 306AUTO (Automatic Weather Station) 28, 43, 62, 66, 68,
171–179, 184AWC (Aviation Weather Center) 22, 193, 202–211, 227–
236, 238, 244, 251, 257, 263–269, 290, 316AWOS (Automatic Weather Observing System) 43, 173, 176
B
Backing 87, 101Baroclinic Zone 75Barometer 31–34, 80, 219Beaufort Scale 349BECMG (Becoming) 187, 188, 190, 191Bergeron Process 48, 52Bermuda High 107, 110Billowy Cloud 16Blowing Sand 66, 349
A
Absolute Instability 9, 13, 20Accretion 119, 122–125ADDS (Aviation Digital Data Service) 227Adiabatic Cooling 11, 57Adiabatic Heating 11Adiabatic Process 11Advection 16, 69, 71, 75, 136, 259Advection Fog 53–60, 72, 81, 327, 330–337Aerosols 1, 26, 65Aggregation 48Air mass 14, 16, 18, 56–59, 69–85, 96, 135–137, 149, 152, 154,
155, 159, 162, 165–170, 243, 246, 249, 254, 284, 297, 333Air Mass Thunderstorms 165, 166, 169, AIRMET (Airmen’s Meteorological Advisory) 65, 122,
193, 195, 196, 202–212, 227–231Albedo 5, 292Aleutian Low 35Altimeter 10, 31, 32, 34, 41, 78, 91, 97, 114, 115, 154, 155, 161,
171, 173, 177, 180, 219–225, 256, 302, 303, 326, 334Altimetry 31, 125, 161Altocumulus (Ac) 21, 23, 24, 30, 81, 119, 136, 152, 155, 179Altocumulus Standing Lenticular (ACSL) 21, 30, 152,
155, 179Altostratus (As) 23, 30, 50, 80, 119Ambient Temperature 43, 44, 66, 118, 129, 131, 177AMDAR (Aircraft Meteorological Data Relay) 216, 262Anabatic Wind 98, 99, 155Anemometer 94, 173, 297Aneroid Barometer 31–33, 219Anomalous Propagation 17, 18, 275, 277, 279, 284Anti-Icing 124, 125, 128–130
Shepherd’s clock. One of the many sights you will see in Green-wich, England where “time starts” and where “east meets west.”
Water Vapor: Gaseous form of water.Waterspout: A tornado that occurs over water, and gener-
ally less severe than a tornado.Wave: A ripple or kink that forms on a surface front
whereby circulation about a developing low pressure transpires.
Wet Bulb Temperature: Lowest temperature that can be obtained by evaporation. Along with the dry bulb tem-perature, it is used to calculate the dewpoint temper-ature.
White Out: Caused by a low sun angle and overcast skies over a snow-covered terrain where depth perception is poor or lost.
Wind Shear: A change in wind direction and/or speed either in the horizontal or vertical over a short distance.
Wind: Horizontal motion of air.WMO (World Meteorological Organization): Specialized
agency of the United Nations for meteorology (weather and climate) headquartered in Geneva, Switzerland.
WS: Abbreviation for SIGMET.WV: Abbreviation for Volcano SIGMET. (WV—Warning
Volcano)WSI: Private company from the Weather Company that
supplies a gamut of aviation forecasts and observations.
Z
Zonal Flow: Winds that predominantly flow from west to east or east to west along lines of latitude.
Zulu Time (Z): UTC or (Coordinated Universal Time) or (Universal Coordinated Time). Formerly Greenwich Mean Time (GMT).
INDEX
I N D E XI N D E X 369368
Blowing Snow 63, 66, 68, 127, 174, 189, 330, 334Blowing Spray (BLPY) 349Boiling 349Boundary Layer 26, 54, 88, 96, 119, 120, 137, 212Broken (BKN) 61, 95, 175, 178, 186–189Brume 53, 59, 60Buoyancy 9, 79, 148, 149Buoyancy Waves 155Buys Ballot’s Law 38, 246, 257
C
Campbell Stokes Recorder 181Cap Cloud 152, 155Carburetor Icing 43, 115CAT (Clear Air Turbulence) 22, 139, 145, 149, 199, 201,
229, 251CAVOK 175, 184CDF (Central Deice Facility) 122, 123, 129Ceiling 14, 20, 24, 28, 31, 61–66, 80, 144, 172–197, 205, 209,
210, 230, 264, 326–330, 336Centrifugal Force 38, 115Chinook 18, 89, 98, 154, 155, 328, 337Chop 142–145Circulation 6, 37, 39, 40, 71, 85, 99, 103, 108, 111, 169, 251,
276, 292, 293, 296, 298, 300, 331Cirrocumulus (Cc) 21–23, 30, 152, 179Cirrostratus (Cs) 22, 30, 80, 292Cirrus (Ci) 21, 22, 28, 30, 80, 118, 139, 161, 164, 167, 195,
198, 231, 250, 281, 291, 293Clean Aircraft Concept 127Clear Ice 82, 120, 126, 129, 131Climate 8, 29, 48, 109, 151, 161, 312, 323–326, 333, 335CMAC (Canadian Meteorological Aviation Center) 195, 196Coalescence 48, 52Coffin Corner 150, 166Col 35Cold Front 19, 25, 75–85, 96, 137, 148, 158, 159, 166, 187,
190, 198, 217, 242, 250, 293Cold Soaked Wing 129Comma Cloud 293, 296Condensation Level 14, 15, 54Condensation Nuclei 47, 54, 58, 64, 163Condensation Trails 28, 30
Conduction 6–8, 53Continental Arctic Air Mass (cA) 70–72Contrails 28, 29, 142Convection 6–10, 15, 24, 49, 55, 72, 79, 93, 94, 99, 109, 111,
117, 121, 135, 139, 158, 161, 164, 201, 203, 204, 210, 227, 231–234, 239, 249, 272, 278, 299, 301, 302
Convective Turbulence 134–136, 205, 229, 269Convergence 38, 40, 41, 85, 103, 105, 106, 111, 158, 164,
289, 298, 303Cooling 7–16, 43–47, 52, 54, 55, 57, 70, 80, 89, 98, 115, 120,
124, 134, 138, 164Coriolis Force 36, 37, 41, 70, 87, 106, 253, 255, 262, 298, 324COTRA (Contrail) 28CSI (Contaminated Surface Inspection) 128Cumulonimbus (Cb) 24, 27, 30, 51, 77, 81, 95, 118, 120, 140,
158, 163, 164–167, 175, 176, 179, 186–190, 196, 197, 264–269
Cumulus (Cu) 10, 14, 16, 21–27, 30, 48, 64, 71, 79, 103, 104, 118, 126, 134, 135, 136, 139, 163–165, 170, 292, 293, 331
Cyclogenesis 75, 76, 329Cyclone 35, 76, 201, 210, 250, 253, 267, 268, 289–302
D
DALR (Dry Adiabatic Lapse Rate) 11–15, 18, 20Datalink 48, 50, 130, 172, 202, 278Deepen 34, 330, 331Deformation Zone 139, 293Deice Equipment 120Deicing 115, 119–130, 199, 345DIIS (Deice Information System) 130Density 1, 2 , 45, 46, 89, 143, 148, 149, 223, 271, 284Density Altitude 45, 46, 224, 225Deposition 21, 28, 46–48, 51, 52, 58, 117, 120Derechos 95Dew 1, 54, 121Dew Point Temperature 11, 14, 38, 43, 48, 51–54, 72, 78,
84, 158, 172, 177, 241Dewcel 44Dissipation Stage 26, 94Diurnal Variation 96Divergence 38, 40, 41, 80, 85, 106, 158, 298Doldrums 104, 106, 111Doppler Radar 88, 251, 271, 272, 275, 277, 279, 283
Downbursts 87, 89, 92Downdrafts 51, 89, 92, 95, 134, 136, 151, 154, 159, 160, 161,
164, 220, 224, 282, 284Downslope 97, 98, 154, 155, 326, 327Drainage 98, 109Drifting Snow 63, 66, 68, 174, 334, 337Drizzle 19, 24, 47, 50, 51, 57, 64, 76, 79, 118, 120, 122, 129,
190, 273, 274, 288, 332Dry Bulb 43Dry Line 75, 238, 242Dust Devil 37, 162Dust Storm 66, 174, 175, 201, 209, 210
E
EDR (Eddy Dissipation Rate) 135, 140, 229ELR (Environmental Lapse Rate) 11, 13, 14, 20East Coast Deepener 35, 330, 331Echo 17, 18, 93, 170, 203, 232, 235, 271–279, 288Eddy 9, 134Equilibrium 13, 37, 40, 41Equinox 7Evaporation 6, 8, 43–47, 52, 57, 58, 60, 94, 115, 138, 164Exosphere 4, 5, 8Extratropical 299–303Extratropical Cyclones 300Eye (Hurricane) 293, 298, 301, 343
F
Fahrenheit 43, 66, 240, 241Fan Blade Damage 116FB (Upper Winds) 211–213, 216, 218, 230Ferrel Cell 103, 108, 109Fetch 261FEW 61, 178, 182, 187–190, 197, 224Filling 34, 85FIR (Flight Information Region) 278Flex Temperature 44Flight Dispatch 58, 166, 196, 312, 313Foehn Wind 155Fog 14, 16, 19, 24, 26, 30, 36, 38, 44–48, 53–68, 69, 81, 99,
110, 114, 118, 129, 141, 174–178, 183–190, 201, 241, 271, 289, 292, 296, 326–337, 341
Fold 243, 250Forward Scatter RVR Sensor 63, 68, 174Freezing Drizzle 50, 76, 118, 120, 121, 331Freezing Level 10, 15, 48, 52, 81, 113, 154, 159, 163, 167, 196,
198, 199, 205, 229, 259, 264, 274, 282, 285Freezing Precipitation 82, 115, 118, 125, 128, 181, 191, 208,
241, 328, 331, 333Freezing Rain 16, 50, 52, 76, 81, 82, 118–122, 128, 231, 324,
329, 331Frontal 16, 19, 57, 60, 76–85, 90, 96, 101, 137, 145, 158, 165,
166, 170, 180, 186, 228, 238, 245, 246, 249–254, 263, 297, 300, 302, 303, 328, 335
Frontal Fog 57, 60Frontal Inversion 16, 19, 137Frontal Lifting 158Frontal Slope 78, 80, 85Frontal Waves 154Frontogenesis 84, 85Frontolysis 84, 85FROPA (Frontal Passage) 180, 185Frost 47, 48, 51, 54, 88, 119, 120, 121, 124, 127–131FSS (Flight Service Station) 173, 303Fujita Scale 92, 166, 170Funnel Cloud 161, 174, 181Funneling 224, 336, 337
G
GCR (Galactic Cosmic Radiation) 305–313General Circulation 111Geostrophic Wind 37, 38, 255 GFA (Graphic Area Forecast) 189, 193–199, 231, 239, 253Glacier Wind 99Global Circulation 103–111GOES (Geostationary Operational Environmental Satel-
lite) 290–295Gradient (Pressure) 36–38, 96, 220, 240, 255, 262, 284,
334, 336Graupel 271, 301Gravity Waves 4, 79, 14, 136, 139–141, 147, 149, 153, 155, 168Greenhouse Effect 6Greenhouse Gases 6Ground Fog 53, 54GTG (Graphic Turbulence Guidance) 140, 229, 231
375
I N D E X374
Trade Winds 104, 105, 111, 299Transmissometer 63, 68Tropical Depression 35, 158, 297, 303Tropical Storm 35, 84, 268, 297, 300, 301, 303, 330Tropopause 3, 8, 10, 11, 15, 19, 21, 27, 69, 70, 73, 74, 103,
106, 140, 147, 151, 160, 164, 168, 169, 243–254, 267–269, 287, 289, 333, 334
Troposphere 2, 3, 8, 11, 19, 69, 71, 88, 103, 111, 243, 245, 299Trough(s) 34–36, 38, 40, 76, 78, 84, 104, 105, 108, 111, 139,
140, 149, 158, 165, 196, 218, 228, 238, 240, 242, 257, 259, 260, 261–264, 334
Trowal (Trough of Warm Air Aloft) 364True Altitude 221–224, 245, 256True Wind 87, 89, 173, 182, 186, 189, 193, 199, 212, 213, 216,
218, 220, 221Turbulence 1, 3, 10, 15, 21, 22, 24, 27, 29, 47, 54, 79, 88–97,
100, 118, 126, 133–145. . .227, 229, 231, 243, 244, 247, 251–253, 264, 266–269, 281–284, 293, 302, 305, 318, 325
Typhoon 34, 35, 299
U
Unstable 9–20, 23, 24, 25, 64, 66, 69, 79, 80, 81, 96, 99, 109, 120, 134, 135–137, 148, 149, 153, 154, 158, 162, 166, 168, 170
Updraft 38, 39, 47, 48, 50, 51, 89, 117, 136, 140, 151, 154, 159–164, 167, 168, 169, 220, 224, 230, 244, 275, 282, 284, 285
Upper Air Charts 139, 255–259, 262Upper Front 84Upper Winds (FBs) 211–218, 230Upslope Fog 57, 60UTC (Universal Coordinated Time) 171, 172, 178, 185, 302,
341–343UV (Ultraviolet) 4, 309, 312
V
VAAC (Volcanic Ash Advisory Center) 316, 320, 322Valley Fog 54, 327Veering 85, 87, 101, 190, 216VFR (Visual Flight Rules) 120, 122, 136, 155, 185, 191–194,
198, 199, 201, 202, 205, 210, 224, 264, 294, 320, 326–328, 332–337, 345
Virga 89, 92, 138, 139, 161, 277Visibility 3, 14, 16, 17, 19, 20, 24, 44, 50, 54–68, 77–85, 123,
151, 169, 171–199, 205, 210, 219, 326–330, 335, 337VMC (Visual Meteorological Conditions) 62Volcanic Ash 67, 158, 201, 209, 210, 267, 315–322Vortex 93, 108, 141, 142, 162, 253, 276VV (Vertical Visibility) 66, 67, 176, 187, 188, 189, 190, 198
W
WAFC (World Area Forecast Center) 254, 266–269Wake Turbulence 62, 141, 142, 145Warm Front 19, 57, 75, 76, 78–85, 96, 118, 125, 137, 242,
245, 302Warm Sector 76, 78, 79, 81, 82, 85, 253Water Droplet(s) 21, 24, 28, 46–48, 58, 64, 113, 116, 117,
119, 120, 131, 152Water Vapor 1, 4–8, 21, 22, 28, 30, 43–48, 52, 57, 58, 117,
120, 164, 249, 292–296Waterspout 161, 174, 181Weather Bomb 330, 331Weather Charts 35, 37, 76, 83, 206, 239, 241, 256, 263,
269, 286Weather Radar 17, 18, 90, 94, 157, 164–170, 235, 271–279,
281–289, 317, 322Wet Bulb Temperature 43White Out 366Wind Chill 334Wind Shear 17, 79, 87–101, 134, 137, 138, 145, 154, 157, 160,
162, 164, 169, 186, 199, 205, 206, 209, 243, 283, 299, 303Wingtip Vortices 141, 142WS (SIGMET) 201–210, 227, 229, 231, 322WSI (Weather Service International) 172, 235, 267, 276,
312, 369
Z
Zenith 105, 364Zonal Winds 262Zulu Time 172, 341–343
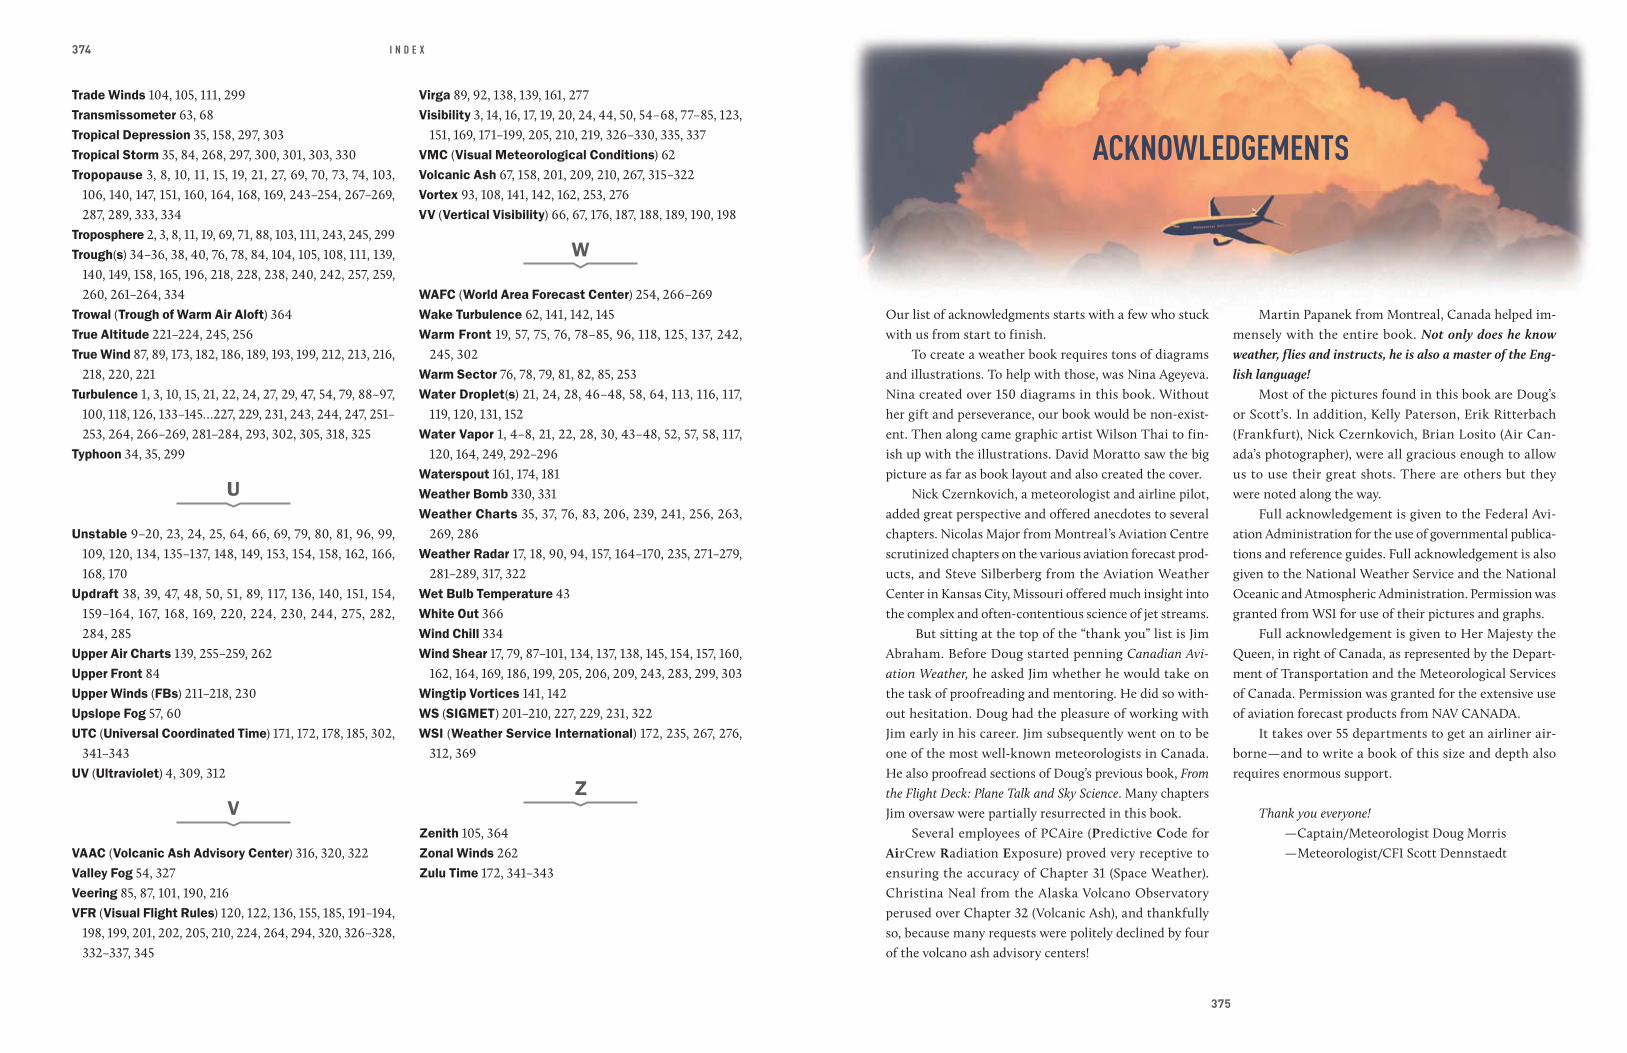
ACKNOWLEDGEMENTS
Martin Papanek from Montreal, Canada helped im-mensely with the entire book. Not only does he know weather, flies and instructs, he is also a master of the Eng-lish language!
Most of the pictures found in this book are Doug’s or Scott’s. In addition, Kelly Paterson, Erik Ritterbach (Frankfurt), Nick Czernkovich, Brian Losito (Air Can-ada’s photographer), were all gracious enough to allow us to use their great shots. There are others but they were noted along the way.
Full acknowledgement is given to the Federal Avi-ation Administration for the use of governmental publica-tions and reference guides. Full acknowledgement is also given to the National Weather Service and the National Oceanic and Atmospheric Administration. Permission was granted from WSI for use of their pictures and graphs.
Full acknowledgement is given to Her Majesty the Queen, in right of Canada, as represented by the Depart-ment of Transportation and the Meteorological Services of Canada. Permission was granted for the extensive use of aviation forecast products from NAV CANADA.
It takes over 55 departments to get an airliner air-borne—and to write a book of this size and depth also requires enormous support.
Thank you everyone!—Captain/Meteorologist Doug Morris—Meteorologist/CFI Scott Dennstaedt
Our list of acknowledgments starts with a few who stuck with us from start to finish.
To create a weather book requires tons of diagrams and illustrations. To help with those, was Nina Ageyeva. Nina created over 150 diagrams in this book. Without her gift and perseverance, our book would be non-exist-ent. Then along came graphic artist Wilson Thai to fin-ish up with the illustrations. David Moratto saw the big picture as far as book layout and also created the cover.
Nick Czernkovich, a meteorologist and airline pilot, added great perspective and offered anecdotes to several chapters. Nicolas Major from Montreal’s Aviation Centre scrutinized chapters on the various aviation forecast prod-ucts, and Steve Silberberg from the Aviation Weather Center in Kansas City, Missouri offered much insight into the complex and often-contentious science of jet streams.
But sitting at the top of the “thank you” list is Jim Abraham. Before Doug started penning Canadian Avi-ation Weather, he asked Jim whether he would take on the task of proofreading and mentoring. He did so with-out hesitation. Doug had the pleasure of working with Jim early in his career. Jim subsequently went on to be one of the most well-known meteorologists in Canada. He also proofread sections of Doug’s previous book, From the Flight Deck: Plane Talk and Sky Science. Many chapters Jim oversaw were partially resurrected in this book.
Several employees of PCAire (Predictive Code for AirCrew Radiation Exposure) proved very receptive to ensuring the accuracy of Chapter 31 (Space Weather). Christina Neal from the Alaska Volcano Observatory perused over Chapter 32 (Volcanic Ash), and thankfully so, because many requests were politely declined by four of the volcano ash advisory centers!

377
ABOUT THE AUTHORS
eastern seaboard, but throughout the world. He has con-tended with Pacific typhoons, ferocious jet streams corkscrewing both hemispheres, space weather while transiting the North Pole, wicked crosswinds at London Heathrow Airport, and low visibility approaches flying into smog-prone New Delhi, India. Plus, he has f lown into America’s top 20 busiest airports with many having unique weather.
Part of his career also saw Doug venture into me-teorology when things were lean in the aviation world.
DOUG MORRIS is an Air Canada Boeing 787 (Dreamliner) captain who has amassed nearly 24,000 hours of flight time. To put this in perspective for those starting off in the industry, this would be equivalent to driving from New York to Boston (or Los Angeles to San Francisco) and back again. . . daily. . . for over six years! Doug did most of his training and initial f light-hour accumulation on Canada’s East coast, where weather is a major player in f light operations. He has experienced a huge range of weather phenomena not only on the temperamental
DOUG
Iridescent Contrail Inscribing its Presence Above—Photo by Erik Ritterbach

A B O U T T H E A U T H O R SA B O U T T H E A U T H O R S 379378
A certified meteorologist, he worked for Atmospheric Environment Canada for four years as a forecaster—again, most of it on the East coast. Doug has been teach-ing weather to aspiring student pilots for years. Many a new Air Canada hire has received a weather refresher from Doug!
Doug has been writing the aviation page for Air Canada’s in-flight magazine, enRoute, for nearly 21 years. He writes a weather column for Canadian Aviator, and has been in Wings and Weatherwise magazines, as well as various newspapers and other publications. His best-selling book, From the Flight Deck: Plane Talk and Sky Science describes a virtual flight from Toronto to Hong Kong on the Airbus 340, explaining the many aspects of aviation along the way. To date, it’s sold over 14,000 cop-ies! Doug has added aviation talks to his growing re-sume. He travels the country delivering presentations on weather, aviation safety, and flying in general.
Captain Doug resides in Toronto, Ontario with his wife and has three adult children. Aviation and weather are his passions, and he hopes Pilot Weather will inspire others to seek an exciting and dynamic experience in aviation.
“The easiest thing in life is to do nothing�—�don’t settle for idleness. Learn, do and experience as much as you can.”
—Captain D
based website (avwxworkshops.com). At the end of 2017, Scott joined forces with another CFI to build a companion app called WeatherSpork (weatherspork.com) that pro-vides a groundbreaking approach to deliver pref light weather to pilots making it very easy to find the most opportune time to depart.
Over the past 20 years, Scott has written over 150 articles that have been published in various aviation magazines to include IFR, IFR Refresher, Flying, Plane & Pilot, Twin & Turbine, Contrails, and Pilot Journal, just to name a few. Scott now lives in Charlotte, North Carolina and is working part-time to finish his Ph.D. in Infra-structures and Environmental Systems at the University of North Carolina.
SCOTT DENNSTAEDT holds a commercial pilot certificate with an instrument rating and has been an FAA-certifi-cated flight instructor (CFI) for over 20 years. Out of col-lege he was employed by the National Weather Service as a research meteorologist while living in Maryland. He then received his Master’s degree in Computer Science and stepped out of the weather business for about 15 years to pursue a career in software engineering at vari-ous aerospace companies such as McDonnell Douglas and Northrop Grumman where he wrote and tested soft-ware for air traffic control systems, air defense systems and he even helped to build a Level D flight simulator for a Beech 1900D.
In the late 1990s, Scott left Northrop Grumman as a fellow engineer to become a full-time flight instructor where he was able to marry up his meteorology training and experience with his new love for aviation. Consequent-ly, in 2003 he founded Aviation Weather Workshops that is designed to teach pilots at all experience levels how to minimize their exposure to adverse weather. Scott built a ton of online content he distributes on his subscription-
SCOTT