pilot testing of oxidation catalysts for enhanced mercury ......
TRANSCRIPT

Pilot Testing of Oxidation Catalysts for Enhanced Mercury Control by Wet FGD Paper # 66 Gary M. Blythe and Carl F. Richardson URS Corporation P.O. Box 201088 Austin, TX 78720 Bruce W. Lani U.S. Department of Energy, National Energy Technology Laboratory P.O. Box 10940 Pittsburgh, PA 15236-0940 Richard G. Rhudy EPRI 3412 Hillview Avenue Palo Alto, CA 94304-1395 Mark Strohfus and Loren Loritz Great River Energy P.O. Box 800 Elk River, MN 55330-0800 ABSTRACT This paper presents results from a pilot-scale project co-sponsored by the U.S. Department of Energy’s National Energy Technology Laboratory (DOE-NETL), EPRI, Great River Energy (GRE), and City Public Service (CPS). The project is to evaluate catalysts that oxidize elemental mercury (Hg0) in flue gas to promote mercury removal by wet flue gas desulfurization (FGD) systems. The research is focused on power plants that fire subbituminous and lignite fuels. These fuels typically produce high percentages of Hg0, which is not scrubbed as effectively as oxidized forms. The paper presents results from the initial six-months of operation of a mercury oxidation catalyst pilot unit that was started up at GRE’s Coal Creek Station in September 2002. Results presented include mercury oxidation efficiency across each catalyst as a function of time in service and other performance results including flue gas pressure drop across the honeycomb catalysts and impacts of the catalysts on the oxidation of other flue gas species. INTRODUCTION A test program co-sponsored by EPRI and DOE-NETL is currently underway at GRE’s Coal Creek Station, as part of Cooperative Agreement DE-FC26-01NT41185, “Pilot Testing of Mercury Oxidation Catalysts for Upstream of Wet FGD Systems.” The mercury control process under development uses catalysts to promote the oxidation of Hg0 in flue gas from coal-fired

power plants that have wet FGD systems. The oxidizing species are already present in the flue gas and may include chlorine, hydrochloric acid and/or other species. Oxidized mercury is removed in wet FGD absorbers and co-precipitates with the FGD byproducts.
The objective of the project is to test catalysts identified as being effective in a previous DOE-NETL co-funded project,1 but at a larger scale and in a commercial form so as to provide engineering data for future full-scale designs. The pilot-scale tests will continue for over a year at each of two sites to provide longer-term catalyst life data.
URS Group, Inc. is the prime contractor; EPRI is a co-funder of the current effort and funded the initial development of the catalytic oxidation process. Two utilities are providing co-funding and host sites for testing: GRE, which fires North Dakota lignite at their Coal Creek Station (CCS) and CPS of San Antonio, which fires Powder River Basin (PRB) subbituminous coal at their J.K. Spruce Plant. The two host sites each have existing wet FGD systems downstream of high-efficiency particulate control devices.
Based on information from the U.S. Environmental Protection Agency’s Mercury Information Collection Request (ICR), the oxidation catalyst technology would have the greatest effect on the flue gas from lignite or subbituminous coal, where most of the mercury is present in the elemental form2. There are approximately 28,000 MW of scrubbed capacity firing these fuels, of which CCS and Spruce are good examples, with more systems planned.
This paper covers the first six-month’s of pilot test results from this project. Included is a project overview followed by a discussion of catalyst selection and procurement activities, then field results from GRE’s CCS. A summary and conclusions are made at the end of the paper.
PROJECT DESCRIPTION Figure 1 illustrates a simplified process flow diagram for the catalytic oxidation process under development. The process is very straightforward, with no “moving parts.” A catalyst, most likely in honeycomb form, is inserted into the flue gas path upstream of the FGD system. The outlet of the plant’s cold-side particulate control device is the most likely location for the catalyst for two reasons. One is that the flue gas velocity is typically low as it exits a particulate control device (e.g., about 5 ft/sec for an electrostatic precipitator [ESP]). This low velocity provides ideal conditions to operate a catalyst at longer residence time and lower pressure drop. The other is that with the flue gas being relatively particulate-free, a close-pitched catalyst can be used. This allows for a high surface area per volume of catalyst relative to “dirty” gas operation, and allows less catalyst volume to be used. Downstream of the catalyst, the oxidized mercury is scrubbed in the FGD absorber, and co-precipitates with the calcium sulfite or gypsum byproduct.
Preliminary cost estimates show that a catalytic process, if installed upstream of a wet FGD system, should allow plants to achieve 90% overall mercury control at a cost that is as much as 50% less than by injecting activated carbon. However, the cost of the process will depend largely on the catalyst life and required catalyst volume. This project is collecting data that will allow these parameters to be evaluated for two coal types.

Figure 1. General process flow diagram for the Mercury Catalytic Oxidation Process
W et FGD System(SO2/Hg Removal)
Stack
ESP (Particulate Removal)
Mercury OxidationCatalyst
Boiler
Four different catalysts in are being tested in parallel in a divided reactor sized to treat approximately 8000 acfm of flue gas (2000 acfm to each catalyst). This allows enough catalyst in each reactor to avoid “wall affects” that could significantly affect results. The pilot reactor treats low-dust flue gas from downstream of the ESP (CCS) or baghouse (Spruce), isokinetically extracted from the unit’s induced draft (ID) fan outlet. The treated flue gas returns to the host unit’s ID fan inlet, thus avoiding the need for a fan on the pilot unit. The amount of flue gas treated by this pilot unit is a very small fraction of the overall host unit flue gas flow, so this small amount of flue gas “recycle” does not cause adverse effects. The pilot unit is heat traced and instrumented for temperature, pressure drop and flow rate measurements for each catalyst bed. The gas flow rate through each catalyst bed is controlled independently.
Figure 2 shows a simplified piping and instrument diagram (P&ID) for the pilot unit. The pilot unit is actually more complex than a future full-scale implementation might be, because it has provisions to control flow rate and temperature in four separate catalyst chambers. The full-scale implementation would not likely require any instrumentation or controls other than monitoring gas pressure drop across the catalyst.
When the completed skid arrives at a site, the host utility places it near an ID fan, then runs ductwork to and from the skid, electric power, compressed air, and a telephone line for data transmittal. After startup and check out of the pilot unit, the four catalysts are loaded. Candidate catalysts are first screened for activity in URS’ mercury laboratory, using synthetic flue gases that simulate the compositions at CCS and Spruce.
Flue gas flow rates and temperatures are established and placed in automatic control, and the unit is left to operate at least a week to allow the catalysts to come to mercury adsorption equilibrium. Then initial catalyst performance data are collected for each catalyst. The flue gas flow rate through each chamber is varied to determine catalyst performance versus area velocity. These results are used to determine an optimum area velocity for each catalyst to achieve high Hg0 oxidation efficiency (preferably greater than 90%).

Figure 2. Simplified P&ID for the catalyst pilot unit (one of four catalyst chambers shown)
To Flue GasDesulfurization Process
From ESPor Baghouse
DPI
DataLogger
InducedDraft Fan
Mercury OxidationCatalyst
FIC
HgHg
TE
TI
Once the optimum flue gas flow rate for each is established, the pilot unit is left in automated operation for approximately 14 months. Telemetry equipment allows pilot unit operating data (flow rate, temperature, and pressure drop) to be monitored and some control parameters to be adjusted from off site. The pilot unit is automated for all operations except mercury analyses, as described in the next paragraph. Otherwise, no routine operator intervention is typically required.
Monthly, project team members travel to the site and use an EPRI mercury semi-continuous emissions monitor (SCEM) to track total and Hg0 concentrations upstream and downstream of each catalyst to determine oxidation activity. The EPRI SCEM is illustrated in Figure 3. It is based on the amalgamation of Hg0 with gold, and the cold-vapor atomic absorption of Hg0 that subsequently thermally desorbs from the gold. Using a liquid-phase gas conversion system, the analyzer can determine total mercury concentrations by reducing all of the oxidized mercury to the elemental form with stannous chloride upstream of the gold, or only Hg0 concentrations by using either a tris(hydroxy-methyl)aminomethane (Tris) or potassium chloride (KCl) solution to capture oxidized mercury while allowing Hg0 to pass through without being altered.
Three times over the test period at each site, manual flue gas measurements will be conducted using the Ontario Hydro method (ASTM D6784-02) to verify results from the SCEM. Also, periodic measurements will be made for sulfuric acid and NO2 concentrations upstream and downstream of each catalyst to quantify whether the oxidation catalysts also oxidize any of the flue gas SO2 or NO. Significant oxidation of either would be undesirable.
At the beginning and end of testing at each site, a thorough characterization of the flue gas at the host site ID fan outlet is being conducted. This includes mercury concentrations and speciation by the Ontario Hydro method, flue gas sulfuric acid concentration by the Controlled Condensation method, halogen species by Method 26a, and trace metals by Method 29. Ontario Hydro method measurements are also being conducted at the host unit FGD outlet, so the removal of mercury by species across the existing scrubber can be quantified.
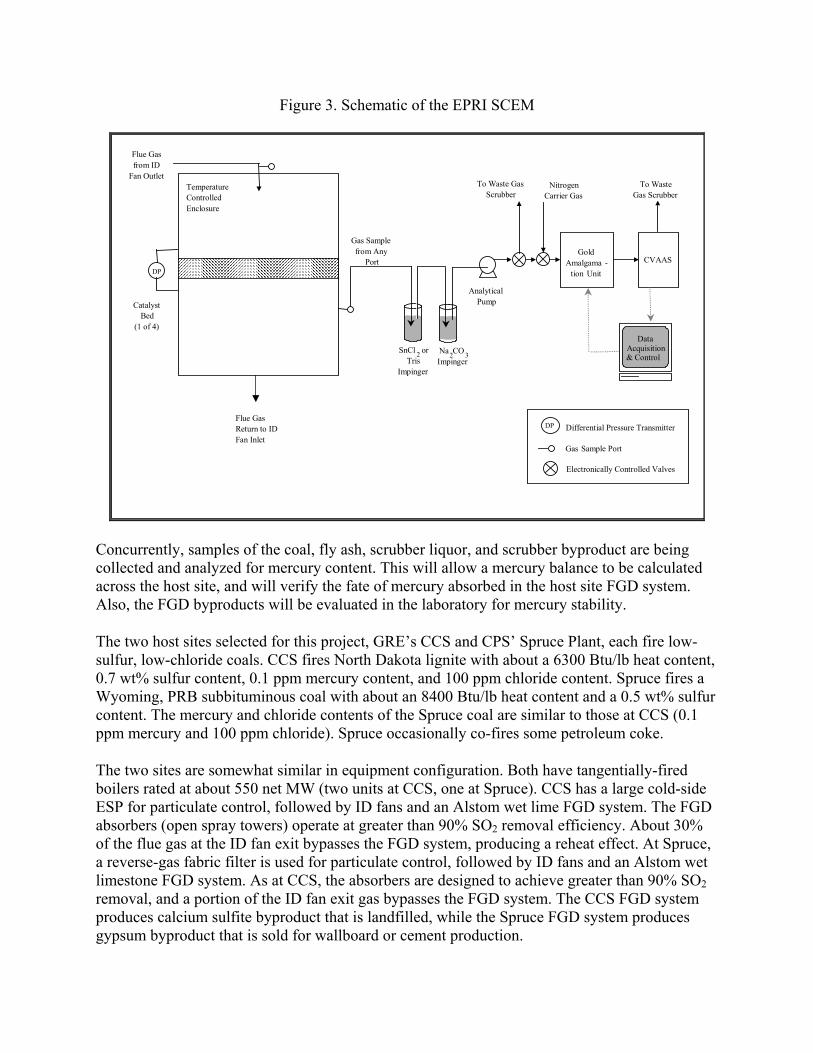
Figure 3. Schematic of the EPRI SCEM
GoldAmalgama -
tion Unit
CVAAS
DataAcquisition& Control
To Waste GasScrubber
SnCl 2 orTris
Impinger
Na2CO3Impinger
To WasteGas Scrubber
DP
CatalystBed
(1 of 4)
Flue Gasfrom ID
Fan OutletTemperatureControlledEnclosure
Gas Samplefrom Any
Port
AnalyticalPump
NitrogenCarrier Gas
Electronically Controlled Valves
Differential Pressure TransmitterDP
Gas Sample Port
Flue GasReturn to IDFan Inlet
Concurrently, samples of the coal, fly ash, scrubber liquor, and scrubber byproduct are being collected and analyzed for mercury content. This will allow a mercury balance to be calculated across the host site, and will verify the fate of mercury absorbed in the host site FGD system. Also, the FGD byproducts will be evaluated in the laboratory for mercury stability.
The two host sites selected for this project, GRE’s CCS and CPS’ Spruce Plant, each fire low-sulfur, low-chloride coals. CCS fires North Dakota lignite with about a 6300 Btu/lb heat content, 0.7 wt% sulfur content, 0.1 ppm mercury content, and 100 ppm chloride content. Spruce fires a Wyoming, PRB subbituminous coal with about an 8400 Btu/lb heat content and a 0.5 wt% sulfur content. The mercury and chloride contents of the Spruce coal are similar to those at CCS (0.1 ppm mercury and 100 ppm chloride). Spruce occasionally co-fires some petroleum coke.
The two sites are somewhat similar in equipment configuration. Both have tangentially-fired boilers rated at about 550 net MW (two units at CCS, one at Spruce). CCS has a large cold-side ESP for particulate control, followed by ID fans and an Alstom wet lime FGD system. The FGD absorbers (open spray towers) operate at greater than 90% SO2 removal efficiency. About 30% of the flue gas at the ID fan exit bypasses the FGD system, producing a reheat effect. At Spruce, a reverse-gas fabric filter is used for particulate control, followed by ID fans and an Alstom wet limestone FGD system. As at CCS, the absorbers are designed to achieve greater than 90% SO2 removal, and a portion of the ID fan exit gas bypasses the FGD system. The CCS FGD system produces calcium sulfite byproduct that is landfilled, while the Spruce FGD system produces gypsum byproduct that is sold for wallboard or cement production.
Pilot testing currently is underway at CCS. This paper presents field data from the initial gas characterization effort and approximately six months of catalyst operation there. EPRI has funded the construction of a second pilot unit for the Spruce testing, so that effort will begin in the second quarter of 2003, well before the 14-months of testing is complete at CCS.
RESULTS
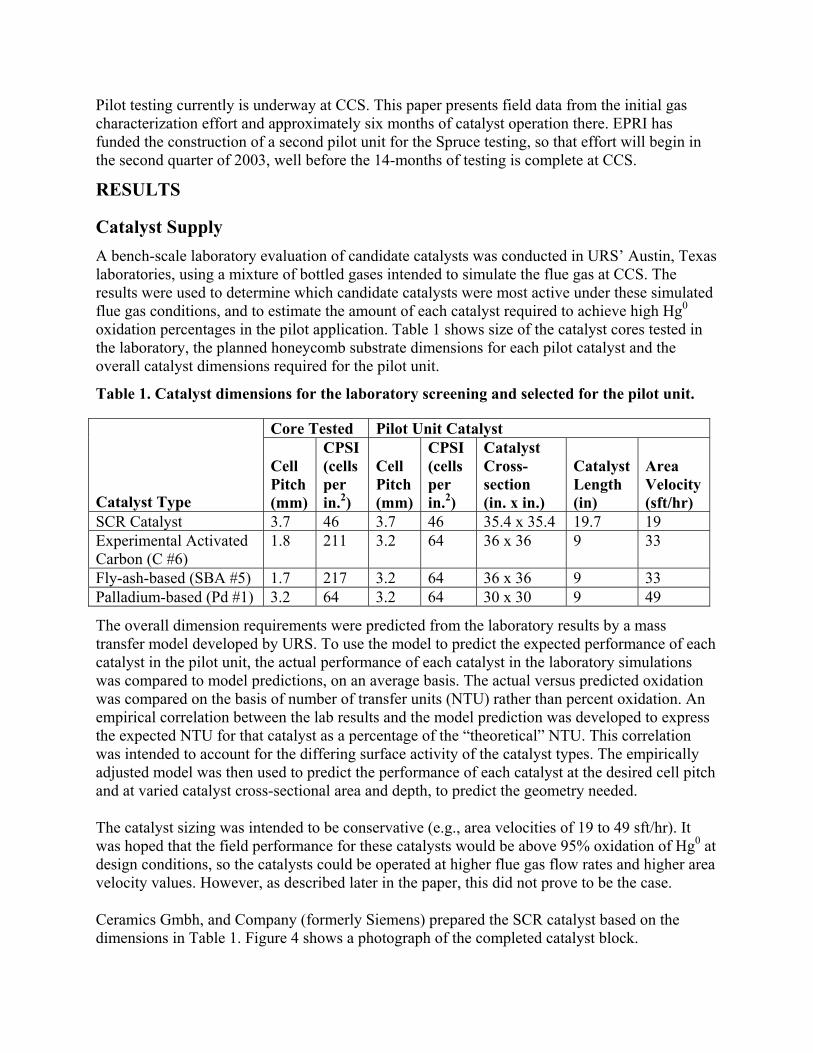
Catalyst Supply A bench-scale laboratory evaluation of candidate catalysts was conducted in URS’ Austin, Texas laboratories, using a mixture of bottled gases intended to simulate the flue gas at CCS. The results were used to determine which candidate catalysts were most active under these simulated flue gas conditions, and to estimate the amount of each catalyst required to achieve high Hg0 oxidation percentages in the pilot application. Table 1 shows size of the catalyst cores tested in the laboratory, the planned honeycomb substrate dimensions for each pilot catalyst and the overall catalyst dimensions required for the pilot unit.
Table 1. Catalyst dimensions for the laboratory screening and selected for the pilot unit.
Core Tested Pilot Unit Catalyst
Catalyst Type
Cell Pitch (mm)
CPSI (cells per in.2)
Cell Pitch (mm)
CPSI (cells per in.2)
Catalyst Cross-section (in. x in.)
Catalyst Length (in)
Area Velocity (sft/hr)
SCR Catalyst 3.7 46 3.7 46 35.4 x 35.4 19.7 19 Experimental Activated Carbon (C #6)
1.8 211 3.2 64 36 x 36 9 33
Fly-ash-based (SBA #5) 1.7 217 3.2 64 36 x 36 9 33 Palladium-based (Pd #1) 3.2 64 3.2 64 30 x 30 9 49
The overall dimension requirements were predicted from the laboratory results by a mass transfer model developed by URS. To use the model to predict the expected performance of each catalyst in the pilot unit, the actual performance of each catalyst in the laboratory simulations was compared to model predictions, on an average basis. The actual versus predicted oxidation was compared on the basis of number of transfer units (NTU) rather than percent oxidation. An empirical correlation between the lab results and the model prediction was developed to express the expected NTU for that catalyst as a percentage of the “theoretical” NTU. This correlation was intended to account for the differing surface activity of the catalyst types. The empirically adjusted model was then used to predict the performance of each catalyst at the desired cell pitch and at varied catalyst cross-sectional area and depth, to predict the geometry needed.
The catalyst sizing was intended to be conservative (e.g., area velocities of 19 to 49 sft/hr). It was hoped that the field performance for these catalysts would be above 95% oxidation of Hg0 at design conditions, so the catalysts could be operated at higher flue gas flow rates and higher area velocity values. However, as described later in the paper, this did not prove to be the case.
Ceramics Gmbh, and Company (formerly Siemens) prepared the SCR catalyst based on the dimensions in Table 1. Figure 4 shows a photograph of the completed catalyst block.

Figure 4. Ceramics Gmbh & Company catalyst block ready for installation in pilot unit
The Pd #1 catalyst for the pilot unit was ordered from Prototech, who prepared the catalyst in three separate 3-in.-deep (7.6-cm) catalyst blocks. The C#6 and SBA #5 catalysts were custom-prepared by a U.S.-based catalyst manufacturer who does not wish to be identified, as extruded monoliths in an alumina substrate. Since this is the first time either of these materials has been processed into a honeycomb form, the manufacturer had to conduct a considerable amount of development work to determine mixing, extruding, drying and firing parameters. Commercial equipment is being used for preparing catalyst quantities for the pilot unit. Consequently, these experimental efforts have had to be scheduled between commercial catalyst production runs.
The vendor first conducted an experimental extrusion of the SBA #5 catalyst, as a preparation for the “production” run to prepare material for the pilot unit. Figure 5 is a photograph of a sample 6-in. by 6-in. by 3-in. deep block from the SBA #5 test extrusion. After this block was prepared successfully, the catalyst vendor prepared enough blocks of this size with the SBA #5 material to produce composite catalyst blocks of the overall dimensions shown in Table 1. Figure 6 shows an overall view of one of the three SBA #5 catalyst cans that were installed in the pilot unit.
For the preparation of the C #6 catalyst, a 300-lb lot of activated C #6 material, prepared the Illinois State Geological Survey and MaxWell Engineering and Consulting, was ground to size for extrusion. The extrusion, drying, firing and canning of these catalyst blocks was completed in March 2003. It is expected that the C #6 catalyst will be installed in the pilot unit at CCS in April.
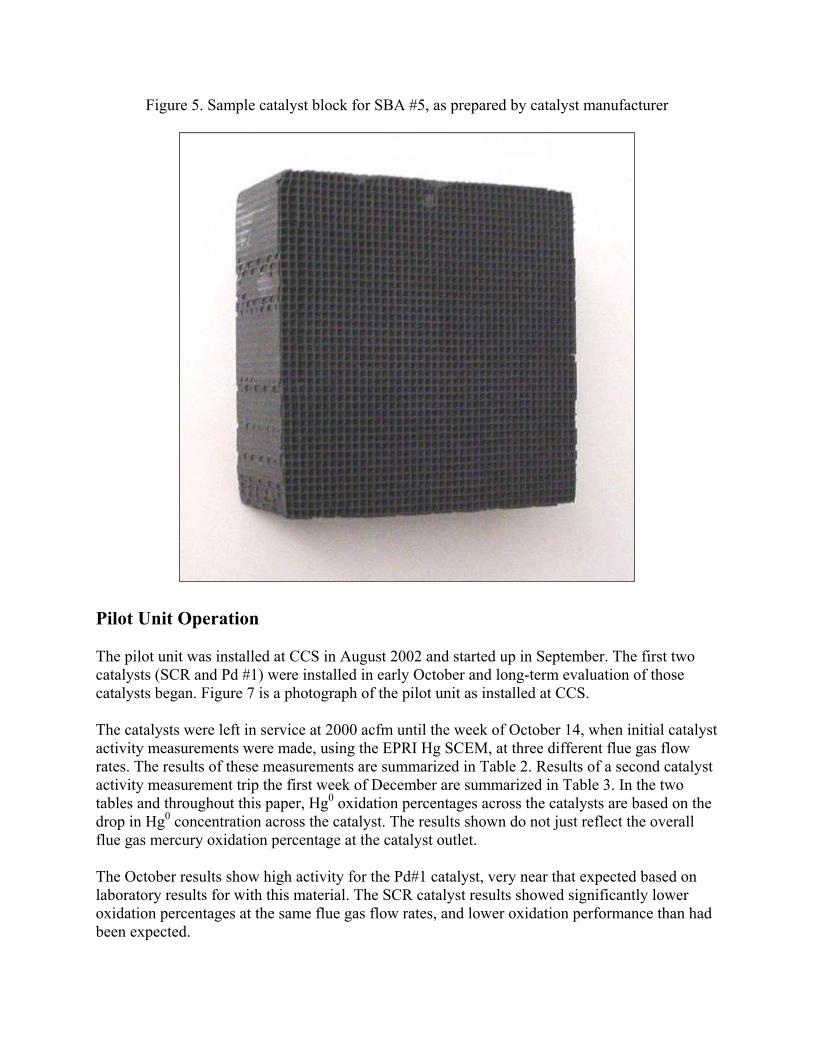
Figure 5. Sample catalyst block for SBA #5, as prepared by catalyst manufacturer
Pilot Unit Operation The pilot unit was installed at CCS in August 2002 and started up in September. The first two catalysts (SCR and Pd #1) were installed in early October and long-term evaluation of those catalysts began. Figure 7 is a photograph of the pilot unit as installed at CCS. The catalysts were left in service at 2000 acfm until the week of October 14, when initial catalyst activity measurements were made, using the EPRI Hg SCEM, at three different flue gas flow rates. The results of these measurements are summarized in Table 2. Results of a second catalyst activity measurement trip the first week of December are summarized in Table 3. In the two tables and throughout this paper, Hg0 oxidation percentages across the catalysts are based on the drop in Hg0 concentration across the catalyst. The results shown do not just reflect the overall flue gas mercury oxidation percentage at the catalyst outlet. The October results show high activity for the Pd#1 catalyst, very near that expected based on laboratory results for with this material. The SCR catalyst results showed significantly lower oxidation percentages at the same flue gas flow rates, and lower oxidation performance than had been expected.

Figure 6. Photograph of one of three SBA #5 catalyst cans
Figure 8 plots these activity results. In the figure, the October oxidation percentage results for the two catalysts are plotted as a function of area velocity. Projected performance values for the catalysts based on the previous laboratory test results are also plotted.
The December results in Table 3 showed a marked decrease in activity for both catalysts. The percentage oxidation of Hg0 across the Pd #1 dropped from greater than 90% in October to approximately 50 to 70% in December. The Hg0 oxidation across the SCR catalyst dropped from 60 to 70% in October to 20 to 30% in December.
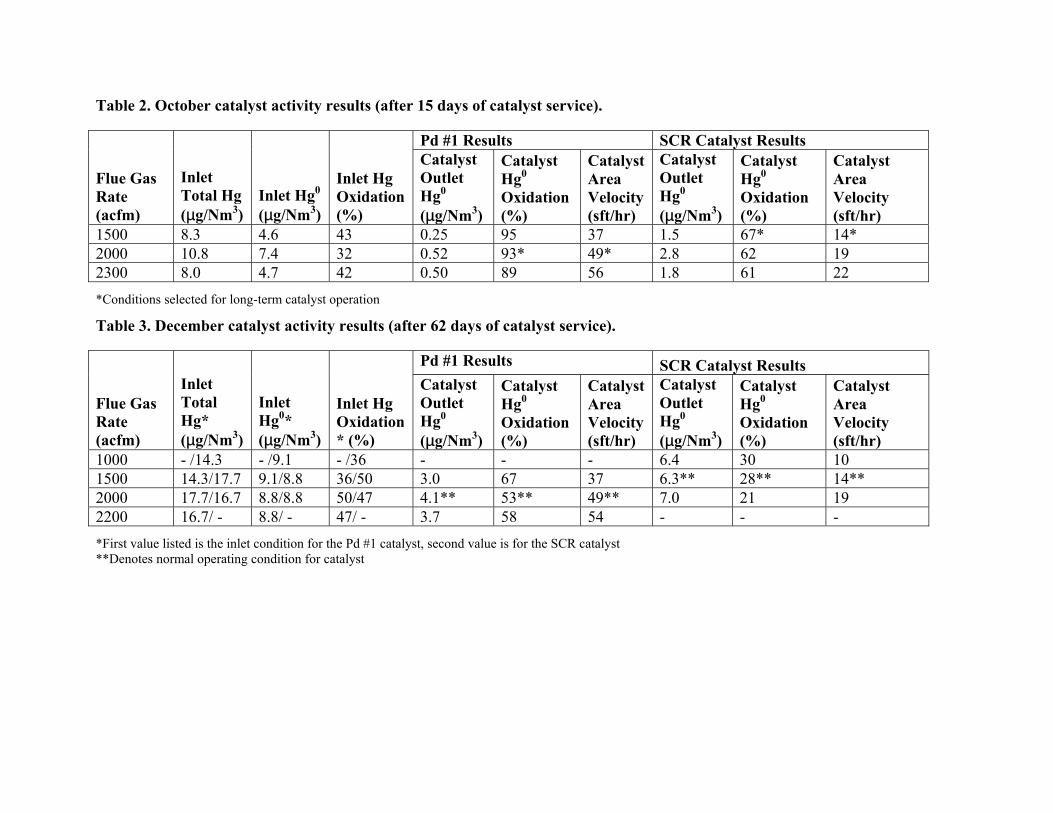
Table 2. October catalyst activity results (after 15 days of catalyst service).
Pd #1 Results SCR Catalyst Results
Flue Gas Rate (acfm)
Inlet Total Hg (µg/Nm3)
Inlet Hg0 (µg/Nm3)
Inlet Hg Oxidation (%)
Catalyst Outlet Hg0 (µg/Nm3)
Catalyst Hg0 Oxidation (%)
Catalyst Area Velocity (sft/hr)
Catalyst Outlet Hg0 (µg/Nm3)
Catalyst Hg0 Oxidation (%)
Catalyst Area Velocity (sft/hr)
1500 8.3 4.6 43 0.25 95 37 1.5 67* 14* 2000 10.8 7.4 32 0.52 93* 49* 2.8 62 19 2300 8.0 4.7 42 0.50 89 56 1.8 61 22 *Conditions selected for long-term catalyst operation
Table 3. December catalyst activity results (after 62 days of catalyst service).
Pd #1 Results SCR Catalyst Results
Flue Gas Rate (acfm)
Inlet Total Hg* (µg/Nm3)
Inlet Hg0* (µg/Nm3)
Inlet Hg Oxidation* (%)
Catalyst Outlet Hg0 (µg/Nm3)
Catalyst Hg0 Oxidation (%)
Catalyst Area Velocity (sft/hr)
Catalyst Outlet Hg0 (µg/Nm3)
Catalyst Hg0 Oxidation (%)
Catalyst Area Velocity (sft/hr)
1000 - /14.3 - /9.1 - /36 - - - 6.4 30 10 1500 14.3/17.7 9.1/8.8 36/50 3.0 67 37 6.3** 28** 14** 2000 17.7/16.7 8.8/8.8 50/47 4.1** 53** 49** 7.0 21 19 2200 16.7/ - 8.8/ - 47/ - 3.7 58 54 - - - *First value listed is the inlet condition for the Pd #1 catalyst, second value is for the SCR catalyst **Denotes normal operating condition for catalyst

Figure 7. Pilot skid as installed at CCS (inlet duct is in the foreground)
Figure 8. Predicted vs. actual Hg0 oxidation across catalysts at CCS after 15 days in service
0
10
20
30
40
50
60
70
80
90
100
0 10 20 30 40 50 60
Area Velocity, sft/hr
Hg
0 O
xid
atio
n, %
Pd #1 - CCS
Pd #1 - Predicted
SCR - CCS
SCR - Predicted

Several possible explanations for this apparent loss of activity were considered. However, it soon became apparent that the catalyst surfaces were becoming fouled due to a buildup of fly ash, in spite of the catalyst being installed downstream of a high-efficiency ESP. At the measured particulate loading of 0.004 gr/dscf in the pilot unit inlet gas, approximately 60 lbs of fly ash would have passed through the Pd #1 catalyst at 2000 acfm over 62 days. If much of that fly ash accumulated within the catalyst chamber and/or on the honeycomb surfaces, this could account for the observed loss of apparent activity.
Further evidence of fly ash buildup was seen in the measured pressure drop across the catalyst chambers. When the two catalysts were put into service in October, the initial clean catalyst pressure drop across each chamber was less than 0.5 in. H2O. By December, the indicated pressure drop across the chambers steadily increased to about 1.5 in. H2O across the SCR catalyst and over 3 in. H2O across the Pd #1 catalyst. The differential pressure transducers were, at the time, scaled for readings of 0 to 3 in. H2O; they have since been re-scaled to read 0 to 10 in. H2O. The third catalyst, SBA #5, also showed a dramatic increase in pressure drop over time after it was placed in service in early December.
Figure 9 shows pressure drop versus time for all four catalyst chambers (including the empty chamber) from the beginning of October through mid-January 2003. Since the pilot unit instrumentation was scaled to read a maximum of 3 in. H2O differential, the pressure drop data for the SBA #5 and Pd #1 catalysts became pegged at full scale.
Figure 9. Catalyst chamber pressure drop versus time in service
-0.5
0
0.5
1
1.5
2
2.5
3
3.5
9/21/02 10/11/02 10/31/02 11/20/02 12/10/02 12/30/02 1/19/03
Date
Ch
amb
er P
ress
ure
Dro
p,
in.
H2O
SBA #5
SCR
Blank
Pd #1
The next catalyst activity measurement trip occurred the week of January 20, 2003. The objective of that trip was to determine whether the apparent loss of activity continued with time, stabilized, or had reversed (i.e., improved activity compared to December results). Also, the catalyst pressure drop indications by the pilot unit instrumentation were verified and the instruments were re-scaled to read higher differential pressures (0 to 10 in. H2O). The plan was that, if the activity of the catalysts was still well below the initial values and if the high pressure drop values were confirmed, the catalyst chambers would be opened to observe if fly ash buildup was present. If significant buildup was confirmed, an attempt would be made to clean the catalyst surfaces with dry compressed air.
The January results confirmed the elevated pressure drop readings across the catalyst modules, and showed lower catalyst activity for the SCR catalyst and Pd #1 than in October. Based on these results, the catalyst modules were shut down and opened for inspection. Each was found to have significant fly ash build up. The January trip also provided the first opportunity to measure the activity of the SBA #5 catalyst. However, it too was adversely affected by fly ash buildup.
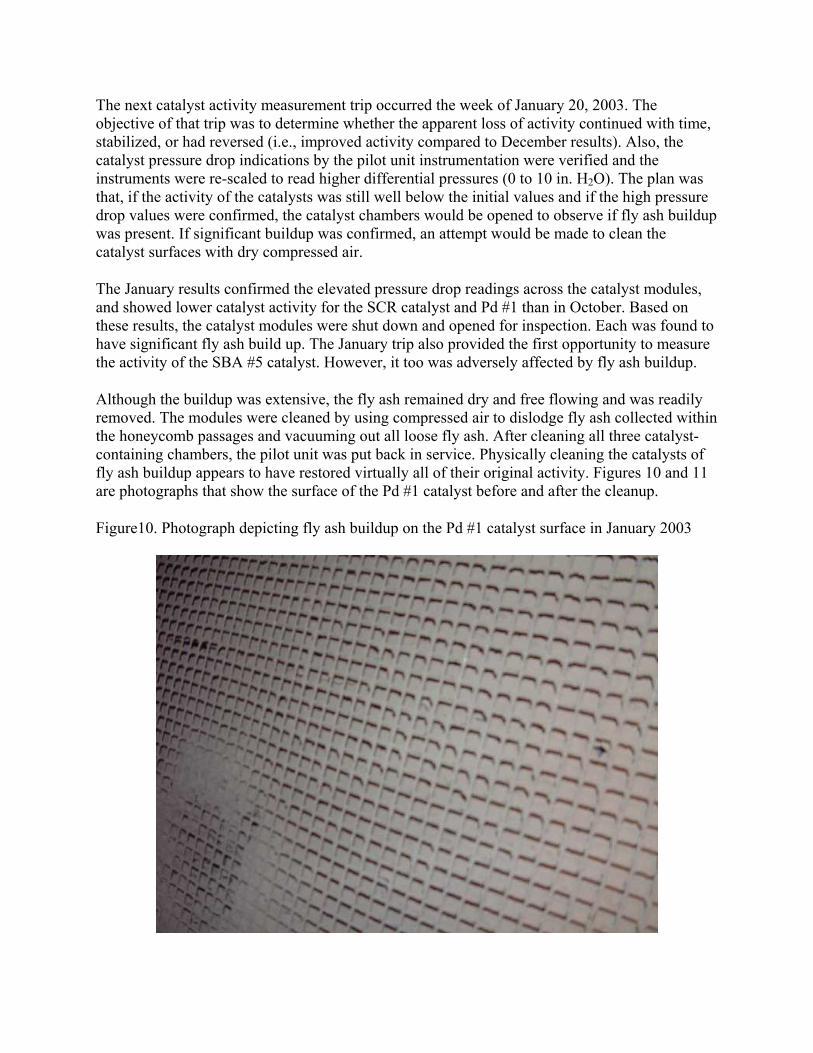
Although the buildup was extensive, the fly ash remained dry and free flowing and was readily removed. The modules were cleaned by using compressed air to dislodge fly ash collected within the honeycomb passages and vacuuming out all loose fly ash. After cleaning all three catalyst-containing chambers, the pilot unit was put back in service. Physically cleaning the catalysts of fly ash buildup appears to have restored virtually all of their original activity. Figures 10 and 11 are photographs that show the surface of the Pd #1 catalyst before and after the cleanup.
Figure10. Photograph depicting fly ash buildup on the Pd #1 catalyst surface in January 2003

Figure 11. Photograph depicting the surface of the Pd #1 catalyst after clean-up in January 2003
The catalyst activity results from before and after cleaning are shown in Table 4. For comparison, results from the October and December measurement trips are also shown, where available. Note in the table that the January "pre-clean" values were equal to or actually a little better than the December measurements, which suggests the catalysts had reached a steady state blockage of catalyst surface area. Also note that the fly-ash-based catalyst was not as active as had been hoped (75% oxidation after cleaning), although its activity might have been a bit higher had measurement results been available sooner after it first went into service.
Table 4. Summary of Hg0 oxidation catalyst activity results at CCS.
Hg0 Oxidation across Catalyst (%)
Catalyst (Flow Rate, acfm) October 17 December 3 January 22
January 24 (after cleaning)
March 27 (after cleaning)
SBA #5 (2000) NA* NA 59 75 NA SCR (1500) 67 28 37 61 NA Pd #1 (2000) 93 53 58 91 92 *No measurement results available for these dates
In late March, a sonic horn was installed in the inlet transition nozzle of the Pd #1 catalyst chamber to determine if periodic blasts with the horn will keep the fly ash fluidized and flowing

out of the chamber. If effective, a horn will be installed on the other catalyst chambers. The pilot unit has operated ten days with the horn installed. Over that short period of operation the horn has appeared to be effective in limiting fly ash buildup; the pressure drop across the Pd #1 catalyst increased by less than 0.1 in. H2O. Also, cleaning out the Pd #1 catalyst before installing the horn restored the catalyst activity, with the Hg0 oxidation across the catalyst being measured at 92% at the normal flue gas flow rate of 2000 acfm. This data point is also included in Table 4.
These results suggest that a coarser catalyst pitch and higher superficial velocities through the catalyst chamber would also help avoid fly ash buildup. Because the empty chambers were somewhat oversized to allow flexibility in the amount of catalyst installed in each, the flue gas velocities through the empty portions are quite low. At 2000 acfm, the gas velocity is 3.1 ft/sec, and at 1500 acfm the velocity is only 2.3 ft/sec. Also, the reduced pressure drop and fly ash buildup for the SCR catalyst, which was installed as a single catalyst block, compared to that for the Pd #1 and SBA #5 suggests that a single catalyst layer rather than three individual layers would be a preferred configuration.
Flue Gas Characterization Results As part of the initial catalyst activity characterization trip conducted in October, a number of flue gas characterization measurements were made. The measurements included:
• CCS FGD system inlet and outlet mercury by the Ontario Hydro method,
• Pilot unit inlet and catalyst outlet mercury by the Ontario Hydro method,
• Pilot unit inlet metals by Method 29,
• Pilot unit inlet halogens by Method 26a,
• Pilot unit inlet and catalyst outlet sulfuric acid by the Controlled Condensation method, and
• Pilot unit inlet and catalyst outlet NO and total NOX by the gas detection tube method.
All except the Method 29 results are discussed in the following paragraphs; the Method 29 results were not included due to paper length constraints.
Ontario Hydro Results
Table 5 summarizes the results of measurements made at CCS by the Ontario Hydro method. The results show that the mercury in the FGD inlet/pilot unit inlet flue gas at CCS is not highly oxidized (less than 40% oxidation). Also, the data show that oxidized mercury is removed across the FGD absorbers at high efficiency (97.6% removal) and that little or no captured mercury is re-emitted in the elemental form. That is, the increase in Hg0 concentration across the FGD absorber is negligible (0.6% increase in concentration, or an increase of less than 0.1 µg/Nm3).

Table 5. Summary of Ontario Hydro results from CCS, October 2002 (all values represent the average from three individual measurement runs).
Hg Concentration (µg/Nm3) Location (Catalyst flue gas flow rate, acfm) Hg+2 Hg0 Total
Total Hg Oxidation (%)
FGD Inlet 7.1 11.6 18.7 38 FGD Outlet 0.2 11.7 11.8 1.4
Table 6 compares the Ontario Hydro method results for the pilot unit to those measured by the EPRI Hg SCEM during the same time period. These results show excellent agreement between the EPRI SCEM and the Ontario Hydro method. The measured total mercury concentrations at each of the three pilot unit measurement locations are very close between the two methods, and the measured Hg0 oxidation percentages across the two catalysts agree well.
Table 6. Comparison of Ontario Hydro results with EPRI Hg SCEM results from CCS.
Hg Concentration (µg/Nm3) Location (Catalyst flue gas flow
rate, acfm) Hg+2 Hg0 Total
Total Hg Oxidation (%)
Hg0 Oxidation Across Catalyst (%)
Pilot Inlet – OH 6.0 11.3 17.3 35 - Pilot Inlet – SCEM 7.5 9.1 16.6 45 - Pilot Outlet: SCR Catalyst – OH (1500 acfm) 11.5 3.5 15.0 77 69 SCR Catalyst – SCEM (1500 acfm) 12.7 2.9 15.6 81 68 Pd #1 Catalyst – OH (2000 acfm) 15.4 0.67 16.1 96 94 Pd #1 Catalyst – SCEM (2000 acfm) 15.2 0.85 16.1 95 91
Some relative error is seen when comparing the pilot unit inlet oxidation percentages between the two methods. However, errors might be expected considering that the Ontario Hydro method takes an integrated, speciated sample at each location over the sampling period while the EPRI SCEM had to cycle through four measurement locations and between elemental and total mercury measurements over that same period. The SCEM data may reflect temporal changes in inlet flue gas speciation that were averaged out over time in the Ontario Hydro results.
Flue Gas Halogen Species (Method 26a)
Table 7 summarizes the results of flue gas halogen species concentration measurements made at CCS in October by Method 26a. The results in the table represent averages of three individual measurement runs.
Table 7. Flue gas halogen species concentrations at CCS by Method 26a (pilot unit inlet).
Species Concentration (ppmv, dry basis) HCl 1.56 Cl2 <0.04 HF 5.31 F2 0.12

As expected, the halogen species concentrations are quite low. It is a bit surprising to see that HF concentrations in the flue gas are higher than the HCl concentrations. In bituminous and subbituminous coals, the opposite is typically the case.
Flue Gas Sulfuric Acid Concentrations (Controlled Condensation Method)
Flue gas sulfuric acid concentrations were measured for two reasons. One is that in the previous smaller-scale catalyst evaluation project, sulfuric acid was identified as a possible contributor to loss of mercury oxidation catalyst activity.1 This was theorized to be due to adsorption or precipitation of sulfates that block active catalyst sites. Consequently, pilot unit inlet sulfuric acid concentrations were measured for comparison to values at other sites where mercury oxidation catalysts have been tested.
The second reason is that there has been some concern that catalysts active for oxidizing Hg0 might also oxidize flue gas SO2 to SO3. SO3 combines with flue gas moisture to form vapor-phase and/or condensed sulfuric acid. Sulfuric acid in the flue gas can lead to undesirable effects such as duct corrosion and increased plume opacity. Thus, oxidation of SO2 to SO3 across these mercury oxidation catalysts would be undesirable.
The results of flue gas sulfuric acid concentration measurements, by the Controlled Condensation method, are summarized in Table 8. Each data point represents the average of three runs. The results in Table 8 do not indicate oxidation of SO2 to SO3 across the catalysts.
Table 8. Flue gas sulfuric acid concentrations at CCS by the Controlled Condensation Method.
Location Sulfuric Acid Concentration (ppmv, dry basis) Pilot Unit Inlet 0.21 SCR Catalyst Outlet 0.09 Pd #1 Catalyst Outlet 0.04 Flue Gas NO2 Concentration by Gas Detection Tubes
Flue gas NO2 concentrations were measured upstream of the pilot unit and downstream of both catalysts using gas detection tubes. As for the oxidation of SO2 to SO3 discussed above, there was concern that the oxidation catalysts might catalyze the oxidation of NO to NO2. While NO is a colorless gas, NO2 has a brown color that can lead to flue gas plume coloration and increased opacity at concentrations as low as 10 ppm. Since significant oxidation of NO to NO2 would be an undesirable side effect of mercury oxidation catalysts, this was an important measurement regarding the viability of a mercury oxidation process.
Gas detection tubes were used to provide an indication of NO to NO2 conversion across the two catalysts in service. Unfortunately, there is an interferent in the flue gas with the NO2 detection tube, so changes in NO2 concentration across the catalysts had to be determined by difference using NO and NOX detection tubes. The results of these measurements are summarized in Table 9. These results indicate the possibility that approximately 10 ppmv of the flue gas NO was oxidized to NO2 across each catalysts (about 7% of the inlet NO). A concentration of 10 ppmv of NO2 in the stack flue gas might result in some visible plume coloration. However, it is likely that

any NO2 formed would be scrubbed along with oxidized mercury in the downstream wet scrubber.
Table 9. Flue gas NOX concentration data at CCS using gas detection tubes.
NOX (ppmv wet) NO (ppmv wet)
NO2 (ppmv wet, by difference)
Pilot Unit Inlet 150 150 0 SCR Catalyst Outlet 150 140 10 Pd #1 Catalyst Outlet 150 140 10
The NO2 concentrations shown in Table 9 were measured by a relatively imprecise method (the gas detection tubes results are read to the nearest 10 ppmv), and are calculated as the difference between two much larger numbers. Consequently, the indicated NO2 concentrations have a significant error band. It is estimated that the actual NO2 concentrations downstream of the two catalysts are in the range of 0 to 20 ppmv. Once all four catalysts are in service, a NOX analyzer will be used to quantify NO and NO2 concentrations upstream and downstream of all four catalysts. This should provide a better measure of NO to NO2 oxidation across the catalysts. The above results suggest that any such oxidation is relatively minor on a percentage basis, though.
SUMMARY AND CONCLUSIONS The mercury oxidation catalyst pilot unit has been designed, built and installed; catalysts were selected, sized and procured; and the pilot unit has operated approximately six months at CCS. During this period of operation at CCS, catalyst activity for Hg0 oxidation was measured several times and the flue gases on the host unit and around the pilot unit were characterized by manual gas sampling methods.
Laboratory tests conducted with simulated flue gases appear to be an acceptable method for screening and sizing candidate catalysts. However, some catalysts perform differently in actual flue gas than in simulated gases. For example, while the Pd #1 catalyst installed in the pilot unit performed very near the predicted oxidation percentage based on laboratory results, the SCR catalyst fell well short of the laboratory prediction. The field results show that a greater surface area of the SCR catalyst would be needed to achieve 90% Hg0 oxidation at this flue gas flow rate, most likely requiring a deeper catalyst bed if the current pitch is maintained.
Procurement of experimental catalysts has limited progress on the pilot evaluation. While the Pd #1 and SCR catalysts were commercially available and were readily procured, only one catalyst manufacturer was identified that could prepare the experimental SBA #5 and C #6 catalysts. Preparation of those catalysts required that fly ash or carbon be mixed with an alumina-based slurry, extruded, dried, and fired to produce an active catalyst. Because of the extended lead times for producing pilot quantities of these catalysts, the SBA #5 catalyst was installed two months after the Pd #1 and SCR catalysts, and the C #6 catalyst is still not installed.
In this initial six plus months of pilot unit operation, it has become apparent that the potential for adverse effects from the ash remaining in the flue gas downstream of a high-efficiency ESP was underestimated. After two months of operation, the Pd #1 and SCR catalysts had seen a significant loss of activity for Hg0 oxidation and a significant increase in pressure drop. Both of
these effects were attributed to fly ash buildup within the catalyst chambers and within the flow channels of the catalyst honeycomb cells. Fortunately, the collected fly ash remained dry and free flowing, and was readily removed by blowing compressed air through the catalyst cells and vacuuming up loose fly ash. The Pd #1 catalyst recovered to greater than 90% oxidation, and the SCR catalyst recovered to greater than 60%, both near their originally measured Hg0 oxidation percentages. The cleaned SBA #5 catalyst returned to 75% oxidation after cleaning, but there was no initial activity measurement available from prior to fly ash buildup for comparison.
Because of the observed ash accumulation on the catalysts at CCS, provisions are being made to help keep catalyst surfaces cleaner. Sonic horns and soot blowers are commonly used to clean catalysts in utility SCR applications for NOX control, and may similarly be effective in this application. A trial application of a sonic horn was installed and on the Pd #1 catalyst chambers in late March, and appears to be effective in limiting fly ash build during operation to date. An air soot blower is also being considered as an alternative. Once an acceptable configuration is established, a similar arrangement will be installed on the other three chambers, and will also be installed on the pilot unit for the Spruce PRB site.
Gas characterization by the Ontario Hydro method showed that the CCS flue gas mercury content was as expected: total mercury concentrations between 10 and 20 µg/Nm3, with less than 50% of the total being oxidized. The CCS wet scrubber was observed to achieve greater than 95% removal of oxidized mercury in the flue gas, and produced little, if any, increase in Hg0 concentration across the scrubber. Ontario Hydro results on the pilot unit showed good agreement with the results from the EPRI SCEM that is used to routinely measure catalyst activity results, and confirmed previously measured catalyst activity measurements. This provides additional confidence in the use of the SCEM for providing cost-effective, real-time measurements of catalyst performance in the field.
Additional gas sampling showed that the CCS flue gas has very low levels of sulfuric, hydrochloric, and hydrofluoric acids, as expected. This sampling also showed no oxidation of SO2 to increase sulfuric acid concentrations in the flue gas across the mercury oxidation catalysts, and very little oxidation of NO to NO2. These are both positive results, as significant oxidation of either of these species across the mercury oxidation catalysts could have produced undesirable balance-of-plant effects.
REFERENCES 1. Enhanced Control of Mercury by Wet Flue Gas Desulfurization Systems, Final Report, Phase
II, Award No. DE-AC22-95PC 95260, U.S. Department of Energy National Energy Technology Laboratory, Pittsburgh, PA: 2001.
2. U.S. Environmental Protection Agency. Database of information collected in the Electric Utility Steam Generating Unit Mercury Emissions Information Collection Effort. OMB Control No. 2060-0396, Office of Air Quality Planning and Standards, Research Triangle Park, NC, April 2001.