pilot study - dublin public transport interface module … study - dublin public transport...kinane...
TRANSCRIPT

Proceedings of the ITRN2013
Dublin Public Transport Interface Module
A Pilot Study Mr. Dermot Kinane Assistant ITS Officer Dublin City Council Ms. Maggie O’Donnell Senior Executive ITS Officer Dublin City Council Abstract With the introduction of Automatic Vehicle Location (AVL) across the Dublin Bus fleet this provided a new transparency network layer which was then utilised as the data input to the Dublin Public Transport Interface Module (DPTIM). Through the use of virtual detectors configured within the DPTIM system this provided a means of effective management of the traffic signals via a centralised process for the benefit of the Dublin Bus fleet operating in a dense urban environment. The key objective of this pilot study was to monitor the effects of this concept for a specific public transport corridor before implementing it across all corridors within the city. Background
In Dublin City, the main mode of Public Transport is by bus; it far outweighs both the Heavy and Light Rail systems both in passenger numbers and in coverage (1). The main operator is Dublin Bus, a State owned company with a fleet of over a 1,000 buses, most of which either terminate or pass through the city centre area. For example at Trinity College there are almost 400 buses in both directions during the peak hour (08:00-09:00), O’Connell Bridge has around the same, except with competing movements. A number of trials had taken place over the years with bus priority but none of them were very successful due to problems with on board units and in particular no standard transponder fitted to the entire fleet.
When Light Rail Transit (LRT) was installed in Dublin, all traffic signals that interacted with the LRT were fitted with tram priority. Tram priority is controlled by SCATS (Sydney Coordinated Adaptive Traffic System). The local traffic controller carries out the main work by changing the mode of operation from Masterlink and going into Isolated mode to service the tram (2).
In 2008, Dublin Bus began the process of fitting an Automatic Vehicle Location (AVL) system to their fleet. It was agreed that this system would come with a SIRI (Service Interface for Real Time Information) standard interface for connection to the SCATS system. This SIRI interface would transfer the position of each in-service bus in the fleet at a 30 second polling rate via the interface. Data on whether the bus is in congestion or not and if the bus is loading passengers at a bus stop is also contained in this feed.
While it is widely acknowledged that the slow polling rate means that it is not possible to use this method for individual junction priority (for that we use the INIT traffic signal priority system, LISA roadside units (3), the data feed seemed to be capable of providing a good picture of the bus fleet and where it was experiencing congestion. The Dublin Public

Kinane and O’Donnell: DPTIM –
Transport Interface Module (DPTIM) for the SCATS system offered the possibility of a centralised network response to polling rate was only a problem where the buses were moving fast and if they were moving too fast to be picked up a number of times in a detector zone then they did not need any assistance.
The concept therefore was to take a SIRI feed, design an interface module for it to allow processing of the data, and then interface this to SCATS to provide a feed of Public Transport data so as to influence network decisions.
Pilot Study Objective
The key objective of this pilot study was to monitor the effects of this concept for a specific public transport corridor before implementing it across all corridors within the city. This corridor considers the route from Amiens Street to the Malahide Road, known asMalahide Corridor and is presented in
The time focus of the model was on the AM peak period (07:00period (16:00-19:00). The corridor was monitored within the following scenarios;
Scenario 1 – Griffith Avenue (TCS 108) to East Wall Road (TCS 132)
– A Pilot Study 5-6th September, Trinity College Dublin
Proceedings
Transport Interface Module (DPTIM) for the SCATS system offered the possibility of a queuing, not just an individual junction response. The slow
polling rate was only a problem where the buses were moving fast and if they were moving too fast to be picked up a number of times in a detector zone then they did not need any
concept therefore was to take a SIRI feed, design an interface module for it to allow processing of the data, and then interface this to SCATS to provide a feed of Public Transport data so as to influence network decisions.
jective of this pilot study was to monitor the effects of this concept for a specific public transport corridor before implementing it across all corridors within the city. This corridor considers the route from Amiens Street to the Malahide Road, known asMalahide Corridor and is presented in Figure 1.
Figure 1 – Malahide Corridor
The time focus of the model was on the AM peak period (07:00-10:00) and the PM peak The corridor was monitored within the following scenarios;
Griffith Avenue (TCS 108) to East Wall Road (TCS 132)
Proceedings of the
ITRN2013
Transport Interface Module (DPTIM) for the SCATS system offered the possibility of a queuing, not just an individual junction response. The slow
polling rate was only a problem where the buses were moving fast and if they were moving too fast to be picked up a number of times in a detector zone then they did not need any
concept therefore was to take a SIRI feed, design an interface module for it to allow processing of the data, and then interface this to SCATS to provide a feed of Public
jective of this pilot study was to monitor the effects of this concept for a specific public transport corridor before implementing it across all corridors within the city. This corridor considers the route from Amiens Street to the Malahide Road, known as the
10:00) and the PM peak

Proceedings of the
ITRN2013 5-6th September, Trinity College Dublin
Kinane and O’Donnell: DPTIM – A Pilot Study
Scenario 2 – Greencastle (TCS 456) to Tonlegee Road (TCS 110)
Scenario 3 – Donnycarney Roundabout (TCS 107)
The performance of the corridor was monitored and observed to determine the locations within the network where busses were delayed most frequently. These observations led to the following locations being considered with the over-arching objective of decreasing the bus journey times along the Malahide corridor by using the interface to SCATS. SCATS Interface
SCATS comes equipped with an ITS port where third party applications can log on to the port and both receive data from the system AND also make changes to the operation of any junction or junctions on the network. Some trials took place with a small prototype using an LRT junction to determine if it was feasible to control SCATS in this manner and it was determined that it was. The range of items that could be altered are:-
• A dwell or hurry call could be placed on any junction or groups of junctions.
• The phase splits at a junction or series of junctions could be altered.
• Cycle times could be altered.
• Offsets and links could be altered.
For the pilot Study, once the key corridor sections were agreed on, then a methodology was developed for the scenario testing. This process involved analysing the key signalised junctions on this corridor and identifying the timing adjustments to the signals based on the range of items that could be altered but still allowing the junction to stay in coordination with the overall route. The details of the Scenarios are presents in the Feedback and Summary section.
Overview of the DPTIM System.
The sections below present an overview of the components of the DPTIM Centralised Signal Priority System providing details of the information that it receives and how the various elements of this system are integrated and configured.
Map Based User Interface
Receiving a data feed from the bus operators containing the location of each bus provides an opportunity of not only prioritising traffic signals for public transport but also a transparent means to monitor and measure the usage of the road network. For each location that is given, the routing information for that bus is also provided with its schedule deviation.
Another element of the data feed is to provide the status of each bus. This provides information such as an “at bus stop” status, an “in-service” status and “in congestion” status if the bus has not progressed sufficiently through the road network. This additional information allows the Traffic Signal Priority System to be more configurable.
In order to visualise this geo-spatial data, a map based graphical user interface was developed to provide a view of the latest status and location of the public transport vehicles. An example of this interface is given in Figure 2.

Kinane and O’Donnell: DPTIM – A Pilot Study 5-6th September, Trinity College Dublin
Proceedings of the
ITRN2013
Figure 2 – Map Based Presentation of the Bus Positions.
Different layers are presented such as the traffic signal junctions operated by SCATS, bus routes highlighted in different colours, bus garages and virtual detectors. Each bus location is represented by a shaded dot. In-service buses are represented in yellow, with a red boundary when at a stop. Buses that are in congestion are represented in pink and a blue dot means that the location of the bus is within a virtual detector and has the correct routing information. (4)
The different bus routes and their journey patterns are presented on the road network.
“Where is the bus going?” - Bus Routes and Journey Patterns
For Dublin Bus, a bus route is a sequence of bus stops. There are many variations of a bus route, which is referred to as its journey pattern. Most bus routes would consist of a least two journey patterns, one for each direction of travel for that route.
For Dublin City Council, the traffic signal network is represented by a sequence of signalised junctions and the approaches to that junction. Thus when virtual detectors are being added to the system, the application was designed to present all the journey patterns that traverse the area covered by that virtual detector and provide a means of filtering and capturing only

Proceedings of the
ITRN2013 5-6th September, Trinity College Dublin
Kinane and O’Donnell: DPTIM – A Pilot Study
the necessary journey with the correct approach or direction of travel. This provided a means of mapping the bus network data to traffic signal junction network. This also allowed the virtual detectors to be selective by only being interested in buses on specified journey patterns. Figure 3 shows how only certain journey patterns can be selected as in use for that a virtual detector.
Figure 3 – Journey Pattern Selection for Virtual detectors.
From the SIRI data feed, the routing information of a bus is presented via its journey pattern. Not all buses within the area of a virtual detector would be relevant to the purpose of that detector as they may be travelling in the opposite direction. This is presented in Figure 4 where the blue dot is a bus with the correct approach to the junction and the yellow dot is a bus travelling away from the junction as it journey pattern is not associated with that virtual detector.

Kinane and O’Donnell: DPTIM – A Pilot Study 5-6th September, Trinity College Dublin
Proceedings of the
ITRN2013
Figure 4 – Virtual detector containing one bus of interest.
Virtual Detectors
Another important element presented on the interface is Virtual Detectors. These are geo-spatial elements created by the user by highlighting an area where buses are of interest. They provide a means of monitoring the occupancy, journey times, threshold counters and other configurable parameters for public transport vehicles whose co-ordinates are within the geographical area or zone of the virtual detector.
It is quite common for a bus network route to exhibit a “star” shape with a majority of the route emanating from the city centre. Dublin City is no exception. Although there are a number of orbital routes, a high percentage of the bus routes travel from the suburbs to the city centre. To accommodate the different patterns of bus route, two types of virtual detectors were designed and developed. In areas where bus routes are quite dense, such as the city centre, this provides a means of ensuring and measuring a standard level of service in bus journey times using the Journey Time virtual detector. This can be configured for all bus routes or selected ones. In areas where the bus routes are sparse a Queuing Virtual Detector would be more efficient as it is used to detect queuing ahead of a particular SCATS site or an area of strategic importance. (4)
For the two different types of virtual detectors, different threshold parameters can be configured. These threshold parameters are assigned tolerance values that, if exceeded, can affect the behaviour of the traffic signals at specified junctions via the SCATS ITS Port.
Journey Time Virtual Detectors
A user can determine the starting location and end location of a journey they wish to measure by drawing a virtual detector for each location via the Map Based User Interface. Once bus routes are associated with detectors, journey times of buses on these routes can be captured immediately. When co-ordinates of such a bus are detected within a start

Proceedings of the
ITRN2013 5-6th September, Trinity College Dublin
Kinane and O’Donnell: DPTIM – A Pilot Study
detector and that bus has the correct routing information, its journey time clock begins. When the same bus is detected within an end detector, journey time is calculated. The status of the bus can be taken into consideration and configured to effect journey time by including or excluding the amount of time spent at bus stops along this journey.
Figure 5 presents the start and end journey time virtual detectors for a section of the road network. The start virtual detector is highlighted to indicate that there is a bus within its geo-spatial area and it is travelling in the correct direction. The end virtual detector is presented in grey as it contains no buses of interest.
Figure 5 – Journey Time Detectors.
A learning option is provided for the purpose of calculating near-optimum input values for the threshold parameters. The parameters for a journey time detector are as follows (4):
• Maximum simple moving journey time, – A maximum value for simple moving
average of journey times. This will suit shorter journey times.
• Maximum exponentially weighted moving average of journey time – A maximum
exponentially weighted moving average of journey times. This will suit longer or
higher variable journey times.
• Maximum percentage change – Percentage change in simple or weighted moving
average journey time over a specified timeframe.
• Maximum journey time – Maximum time in seconds allowable for any individual
journey while detector is active.
The current information for these parameters are can be viewed via the detector information screen as presented in Figure 6.

Kinane and O’Donnell: DPTIM – A Pilot Study 5-6th September, Trinity College Dublin
Proceedings of the
ITRN2013
Figure 6 – Information on a start journey time detector.
Queuing Virtual Detectors
As mentioned earlier, this type of detector is used to detect queuing ahead of a particular SCATS junction or areas known to be “bottlenecks”. Some of these threshold parameters are the maximum number of vehicles in a queue, maximum queuing time and maximum schedule deviation. The usage of these detectors would be ideal in a situation where a bus requires taking a right-turning movement at a traffic-signalised junction onto a main road. The queue detector could be drawn sufficiently long to accommodate the polling rate in order to ensure detection of an approaching bus. Once detected, the threshold parameters could be configured to provide an immediate green signal for a configurable timeframe.
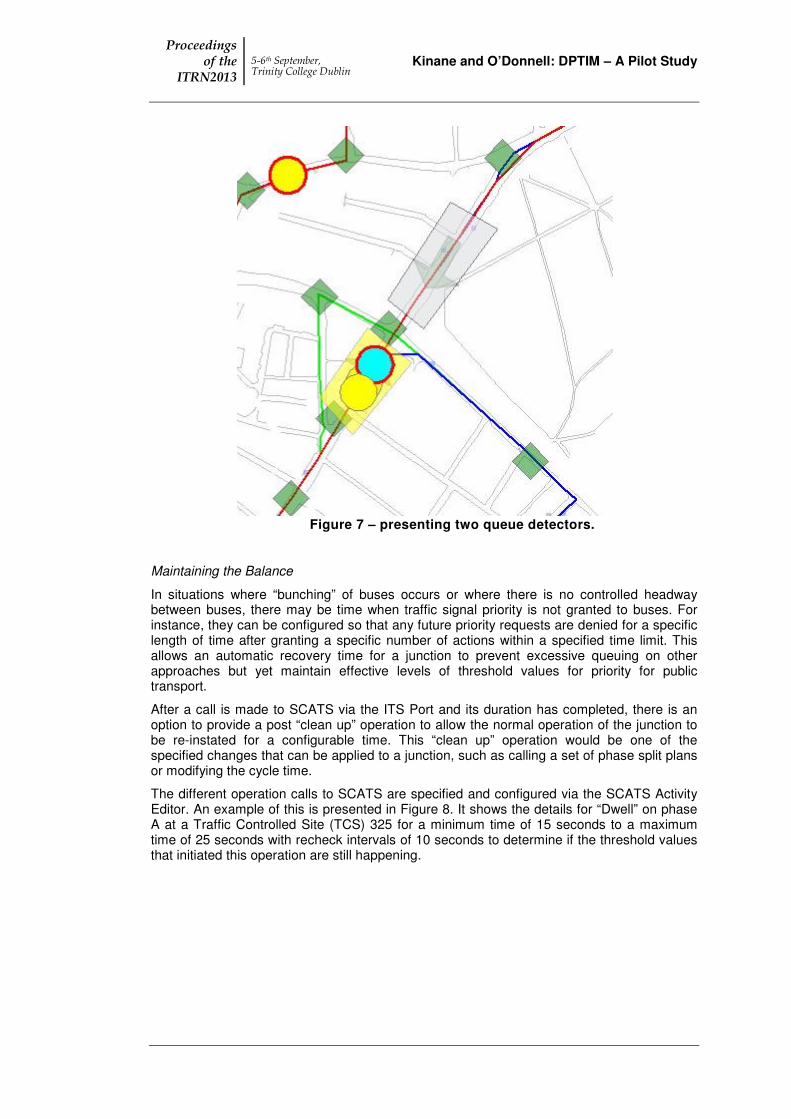
Figure 7 presents two queue virtual detectors for two different approaches to a junction. The virtual detector in grey is inactive as no buses have entered into its geo-spatial area. The virtual detector in yellow is active as there is a bus with the correct approach to the junction within it geo-spatial area.
Proceedings of the
ITRN2013 5-6th September, Trinity College Dublin
Kinane and O’Donnell: DPTIM – A Pilot Study
Figure 7 – presenting two queue detectors.
Maintaining the Balance
In situations where “bunching” of buses occurs or where there is no controlled headway between buses, there may be time when traffic signal priority is not granted to buses. For instance, they can be configured so that any future priority requests are denied for a specific length of time after granting a specific number of actions within a specified time limit. This allows an automatic recovery time for a junction to prevent excessive queuing on other approaches but yet maintain effective levels of threshold values for priority for public transport.
After a call is made to SCATS via the ITS Port and its duration has completed, there is an option to provide a post “clean up” operation to allow the normal operation of the junction to be re-instated for a configurable time. This “clean up” operation would be one of the specified changes that can be applied to a junction, such as calling a set of phase split plans or modifying the cycle time.
The different operation calls to SCATS are specified and configured via the SCATS Activity Editor. An example of this is presented in Figure 8. It shows the details for “Dwell” on phase A at a Traffic Controlled Site (TCS) 325 for a minimum time of 15 seconds to a maximum time of 25 seconds with recheck intervals of 10 seconds to determine if the threshold values that initiated this operation are still happening.

Kinane and O’Donnell: DPTIM – A Pilot Study 5-6th September, Trinity College Dublin
Proceedings of the
ITRN2013
Figure 8 – SCATS Activity Editor

Proceedings of the
ITRN2013 5-6th September, Trinity College Dublin
Kinane and O’Donnell: DPTIM – A Pilot Study
Feedback and Summary
With a significant amount of data being processed by the application one advantage this provides is the different levels and views of transparency on the usage of the road network.
The Journey Time Detector gives the performance of each journey pattern for a section of the road network. Even though it is the same section of road, this may differ for each journey pattern and the buses for certain journey patterns may stop at different stops along the route and have different passenger on/off loading times.
Figure 9 shows such a performance report for a small section of road.
Figure 9 – Journey Time Report.
The following scenarios were considered during the pilot phase.
Scenario 1 – Griffith Avenue (TCS 108) to East Wall Road (TCS 132)
For this scenario, the desired signal changes could be summarised below detailing the junction, phase and percentage of overall cycle time given to that specific traffic movement.
TCS 132 - A 58%, B 28%, C 14%
TCS 72 – No changes
TCS 73 – A 8%, B 17%, C 57% (FG), D 18s
TCS 594 – No changes
TCS 108 – A 39%, B 15%, C 28%, D 18s
Detailed results of Scenario 1 can be found in Appendix A, but can be summarised as follows, a 7% improvement in bus journey times southbound and a 4% improvement in the northbound bus journey times.

Kinane and O’Donnell: DPTIM – A Pilot Study 5-6th September, Trinity College Dublin
Proceedings of the
ITRN2013
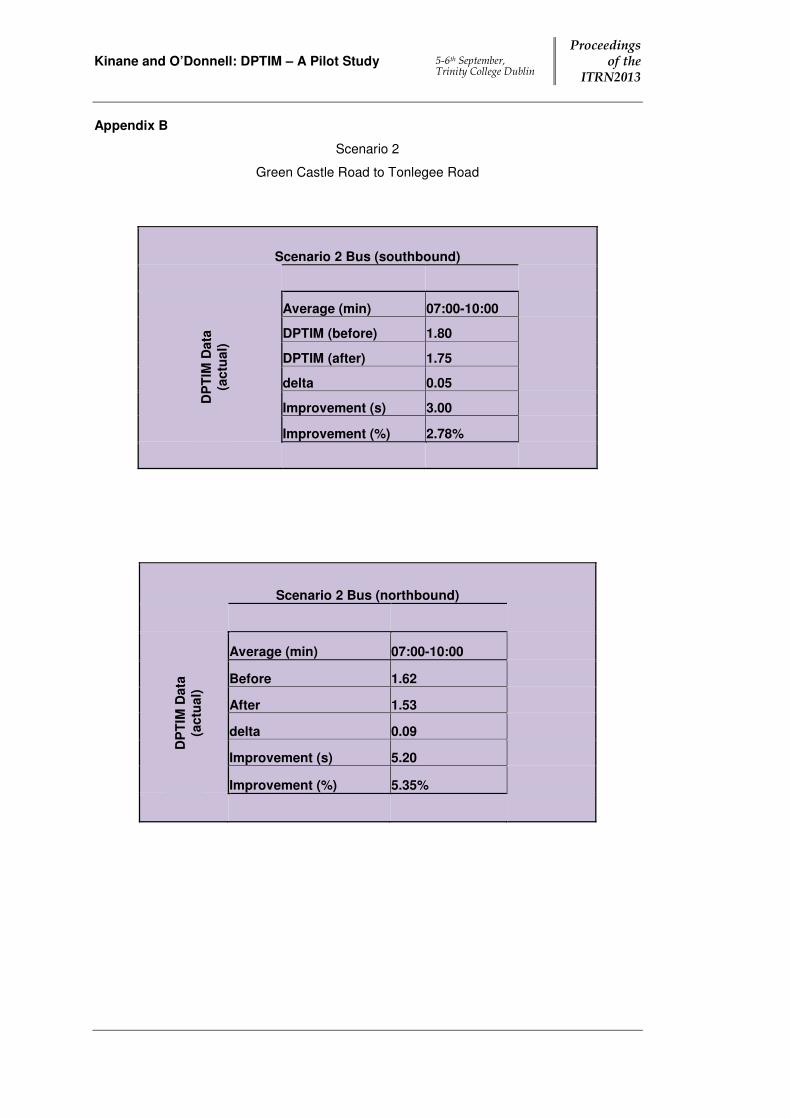
2.4 Scenario 2 – Greencastle Road (TCS 456) to Tonlegee Road (TCS 110)
Again various iterations were tested and the following proved to be the most desirable;
TCS 456 – No change
TCS 110 – A 37%, B 22%, C 28%, D 13%
Detailed results of the Scenario 2 can be found in Appendix B but can be briefly summarised as follows, a 3% improvement for buses travelling southbound and a 5.5% improvement in buses travelling northbound.
2.5 Scenario 3 – Donnycarney (TCS 107)
It was found that TCS 107 had only 1 split plan, this was changed to make 8 split plans available.
Detailed results of Scenario 3 can be found in Appendix C but can be summarised as follows, a 3% decline in the journey times for buses travelling southbound and a 24% improvement in journey times for buses travelling northbound.
2.6 Scenario 4 – Greencastle Road – Poplar Row
This iteration combined scenarios 1, 2 and 3 to determine the impact of all the changes being made at once to SCATS across the corridor from Greencastle to Poplar Row. Overall, a 4% improvement to bus journey times across this corridor was observed in the southbound direction and a 4.5% improvement to buses travelling northbound.
Detailed results for Scenario 4 can be found in Appendix D.
2.7 Scenario 5 - N32 to Store Street
Scenario 5, the final scenario, considers the impact of the SCATS changes implemented in Scenarios 1, 2 and 3 over the entire model corridor. To summarise, an overall 6% improvement to bus journey times was observed in the southbound direction.
Detailed results for Scenario 5 can be found in Appendix E.
Conclusion
Public Transport Priority is a new development for Dublin City Council and is currently is early testing phase. It is planned that for over the next few months this corridor will continue to be monitored and its performance reviewed. The DPTIM system provides a centralised city wide view of the road network usage providing bus corridor and main routing information. As there are a high number of traffic signal junctions in Dublin City under the operation of SCATS this provides a cost effective means of providing traffic signal priority for public transport.

Proceedings of the
ITRN2013 5-6th September, Trinity College Dublin
Kinane and O’Donnell: DPTIM – A Pilot Study
References 1. Dublin City Council. Dublin City Development Plan 2011 - 2017. Dublin : DCC, 2010.
2. Roads and Traffic Authority. SCATS 6.6.2 Operating Instructions. Sydney : RTA, 2008.
3. INIT. [Online] [Cited: 20 03 2013.] http://www.initag.de/en/products/ITCS.php?thisID=435.
4. Advantech Design. Public Transport Interface Module. Melbourne : s.n., 2012.

Kinane and O’Donnell: DPTIM – A Pilot Study 5-6th September, Trinity College Dublin
Proceedings of the
ITRN2013
Appendix A
Scenario 1
East Wall Road / Poplar Row to Griffith Avenue / Copeland Avenue
Scenario 1 Bus (southbound)
DP
TIM
Data
(a
ctu
al)
Average (min) 07:00-10:00
DPTIM (before) 2.53
DPTIM (after) 2.36
delta 0.18
Improvement (s) 10.57
Improvement (%) 6.96%
Scenario 1 Bus (northbound)
DP
TIM
Data
(a
ctu
al)
Average (min) 07:00-10:00
Before 3.20
After 3.06
delta 0.13
Improvement (s) 8.08
Improvement (%) 4.22%

Proceedings of the
ITRN2013 5-6th September, Trinity College Dublin
Kinane and O’Donnell: DPTIM – A Pilot Study
Summary Southbound Bus
DP
TIM
Data
(a
ctu
al)
Average (min) 07:00-10:00 07:30-08:30
DPTIM (before) 2.53 3.04
DPTIM (after) 2.36 1.70
delta 0.18 1.34
Improvement (s) 10.57 80.40
Improvement (%) 6.96% 44.08%
Summary Northbound Bus
DP
TIM
Data
(a
ctu
al)
Average (min) 07:00-10:00 07:30-08:30
Before 3.20 2.83
After 3.06 3.08
delta 0.13 -0.25
Improvement (s) 8.08 -15.00
Improvement (%) 4.22% -8.83%
Kinane and O’Donnell: DPTIM – A Pilot Study 5-6th September, Trinity College Dublin
Proceedings of the
ITRN2013
Appendix B
Scenario 2
Green Castle Road to Tonlegee Road
Scenario 2 Bus (southbound)
DP
TIM
Data
(a
ctu
al)
Average (min) 07:00-10:00
DPTIM (before) 1.80
DPTIM (after) 1.75
delta 0.05
Improvement (s) 3.00
Improvement (%) 2.78%
Scenario 2 Bus (northbound)
DP
TIM
Data
(a
ctu
al)
Average (min) 07:00-10:00
Before 1.62
After 1.53
delta 0.09
Improvement (s) 5.20
Improvement (%) 5.35%

Proceedings of the
ITRN2013 5-6th September, Trinity College Dublin
Kinane and O’Donnell: DPTIM – A Pilot Study
Appendix C
Scenario 3
Donnycarney
Scenario 3 Bus (southbound)
DP
TIM
Data
(a
ctu
al)
Average (min) 07:00-10:00
DPTIM (before) 1.66
DPTIM (after) 1.72
delta -0.06
Improvement (s) -3.60
Improvement (%) -3.61%
Scenario 3 Bus (northbound)
DP
TIM
Data
(a
ctu
al)
Average (min) 07:00-10:00
Before 0.98
After 0.76
delta 0.23
Improvement (s) 13.80
Improvement (%) 23.47%

Kinane and O’Donnell: DPTIM –
Appendix D
Greencastle Road
Scenario 4
Scenario 4 Bus (northbound)
– A Pilot Study 5-6th September, Trinity College Dublin
Proceedings
Scenario 4
Greencastle Road – Poplar Row
Scenario 4 Bus (southbound)
Scenario 4 Bus (northbound)
Proceedings of the
ITRN2013

Proceedings of the
ITRN2013 5-6th September, Trinity College Dublin
Appendix E
September, Trinity College Dublin
Kinane and O’Donnell: DPTIM
Scenario 5
N32 – Store Street
Scenario 5 Bus (southbound)
Scenario 5 (northbound)
Donnell: DPTIM – A Pilot Study