pilot model for wake vortex encounter fotofoto...
TRANSCRIPT

S. Amelsberg – 2 June 2010WakeNet3 - Europe Specific Workshop: Models and Methods for WVE Simulations
Berlin Institute ofTechnology
FotoFotoPILOT MODEL FOR WAKE VORTEX ENCOUNTER SIMULATIONS FOR TAKEOFF AND DEPARTURE

Slide 2Name Surname 3. Juni 2010
Introduction
MotivationRisk analysis in with Monte Carlo
Simulation (MCS)
Application: Wake Vortex Encounter (WVE)
Models needed: - Aircraft - Vortex (Evolution, Interaction)-- Pilot Pilot behaviourbehaviour
Pilot modeldeterministic
andprobabilistic
Aircraft simulation model
AircraftreactionPilot inputs
AileronElevatorRudderThrust
Desiredflight path
-Δ
Wake vortex simulation
model-40-30-20-10010203040
-20
-15
-10
-5
0
5
10
15
20
Lamb-OseenBurnham & HallockProctorWinckelmans
Vortex induced accelerations
Elements of MCS
Objectiveo Modelling of human pilot behaviour for tracking and WVE recovery
o Validated pilot model

Slide 3Name Surname 3. Juni 2010
Content
• Development process
• Simulator data for pilot modelling
• Structure of pilot model
• Neural network part of pilot model
o Topology
o Parameter optimisation
• Validation
• Conclusion

Slide 4Name Surname 3. Juni 2010
Development process and application
Pilot-in-the-loop Simulator tests
PM
Test evaluation(Time histories &Questionnaires)
Model optimization
Pilot task
Pilot model
Wake vortex
Normal / special procedure
WVE Risk analysis / Hazard rating
PMControl inputs
Monte Carlo Simulation
Wake Vortex
0 10 20 30 40 50 60 70 80-0.6
-0.4
-0.2
0
0.2
0.4
0.6
0.8
1
time [s]
norm
. SS
RO
[-]
test file: 777-0.tub330.8simulation
Normal / special procedure
FCOM
Flight Crew Operational Manual

Slide 5Name Surname 3. Juni 2010
Flight phases to model
The variety of tasks requires a pilot model consistent out of many submodules
TRACKING TASK WVE
0 10 20 30 40 50 60 700
2
4
6
8
Ang
le o
f atta
ck [°
]
0 10 20 30 40 50 60 7020
40
60
80
100
True
airs
peed
[m/s
]
0 10 20 30 40 50 60 70-1
-0.5
0
0.5
1
Sid
estic
k ro
ll []
0 10 20 30 40 50 60 70-20
-10
0
10
20
Ban
k an
gle
[deg
]
Disconnect AP in case of high deviation from the nominal flight path
Stabilize the a/c after encountering a wake vortex
Retract flaps, landing gear and reduce thrust setting depending on altitude and speeds
Match the stationary aircraft climb gradient to the actual thrust level
Correct lateral deviations
Climb along the desired flight path
Rotation
Take-off run on the runway centre line
CONTROL TASK
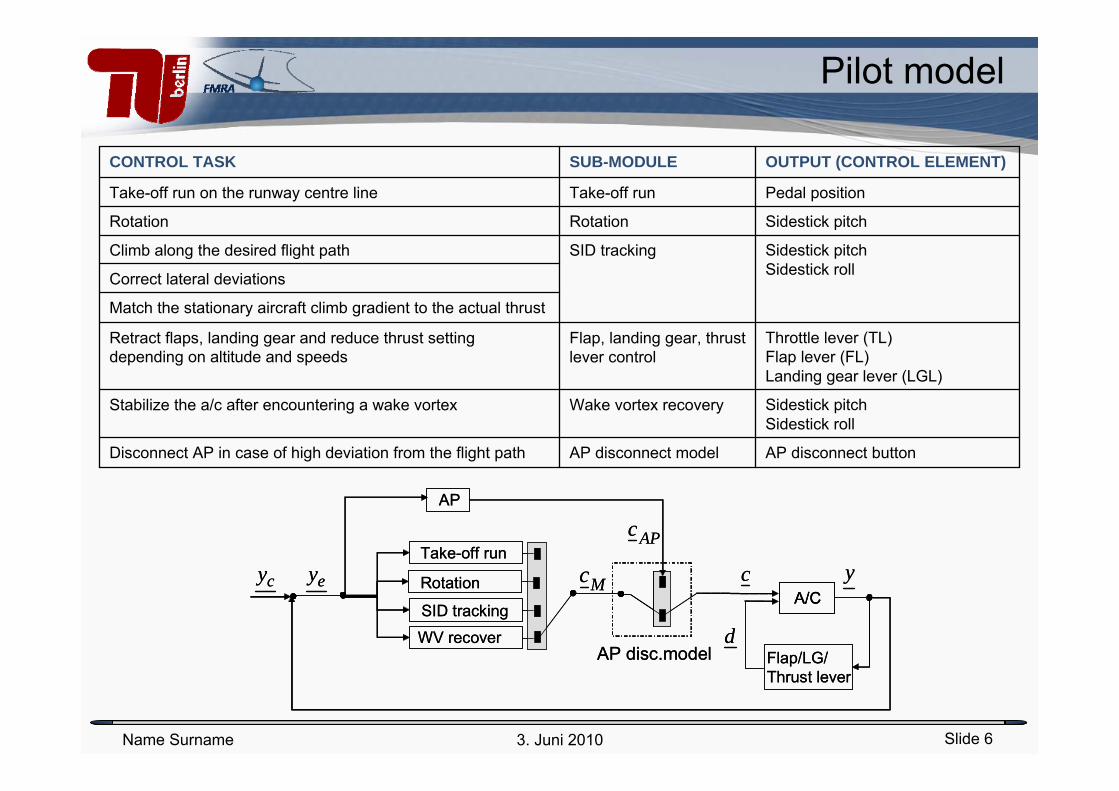
Slide 6Name Surname 3. Juni 2010
Pilot model
Flap/LG/ Thrust lever
A/Ccy ey c y
AP
Take-off run
Rotation
SID tracking
WV recoverAP disc.model
APc
d
Mc
Flap/LG/ Thrust lever
A/CA/Ccy ey c y
AP
Take-off run
Rotation
SID tracking
WV recoverAP disc.model
APc
d
Mc
AP disconnect button
Sidestick pitchSidestick roll
Throttle lever (TL)Flap lever (FL)Landing gear lever (LGL)
Sidestick pitchSidestick roll
Sidestick pitch
Pedal position
OUTPUT (CONTROL ELEMENT)
AP disconnect modelDisconnect AP in case of high deviation from the flight path
Wake vortex recoveryStabilize the a/c after encountering a wake vortex
Flap, landing gear, thrust lever control
Retract flaps, landing gear and reduce thrust setting depending on altitude and speeds
Match the stationary aircraft climb gradient to the actual thrust
Correct lateral deviations
SID trackingClimb along the desired flight path
RotationRotation
Take-off runTake-off run on the runway centre line
SUB-MODULECONTROL TASK

Slide 7Name Surname 3. Juni 2010
Neural network
• Training- backpropagation with Matlab (cost function=MSE)
- optimization with MOPS (user-defined cost function), post-processing
Problems: time-consuming calculation for evolutional algorithm because of the high number of parameters (tuners) in neural networks
-stops training by the use of cross validation
division of simulator data: 60% training, 20% validation, 20% test data
• Model approaches- static feed-forward network
- recurrent network
• Design parameters (Topology)a) number/ choice of inputs
b) number of layers
c) type of activation function
f
f
f
f
f
f
f
Inputs Hidden Outputs

Slide 8Name Surname 3. Juni 2010
Evaluate net performance
84 86 88 90 92 94 96 98 100 102-1
-0.8
-0.6
-0.4
-0.2
0
0.2
0.4
0.6
0.8
1Neural net vs. Pilot
Time
Sid
estic
k ro
ll
Neural netPilot
95 100 105 110 115 120-1
-0.8
-0.6
-0.4
-0.2
0
0.2
0.4
0.6
0.8
1Neural net vs. Pilot
Time
Sid
estic
k pi
tch
Slide 9Name Surname 3. Juni 2010
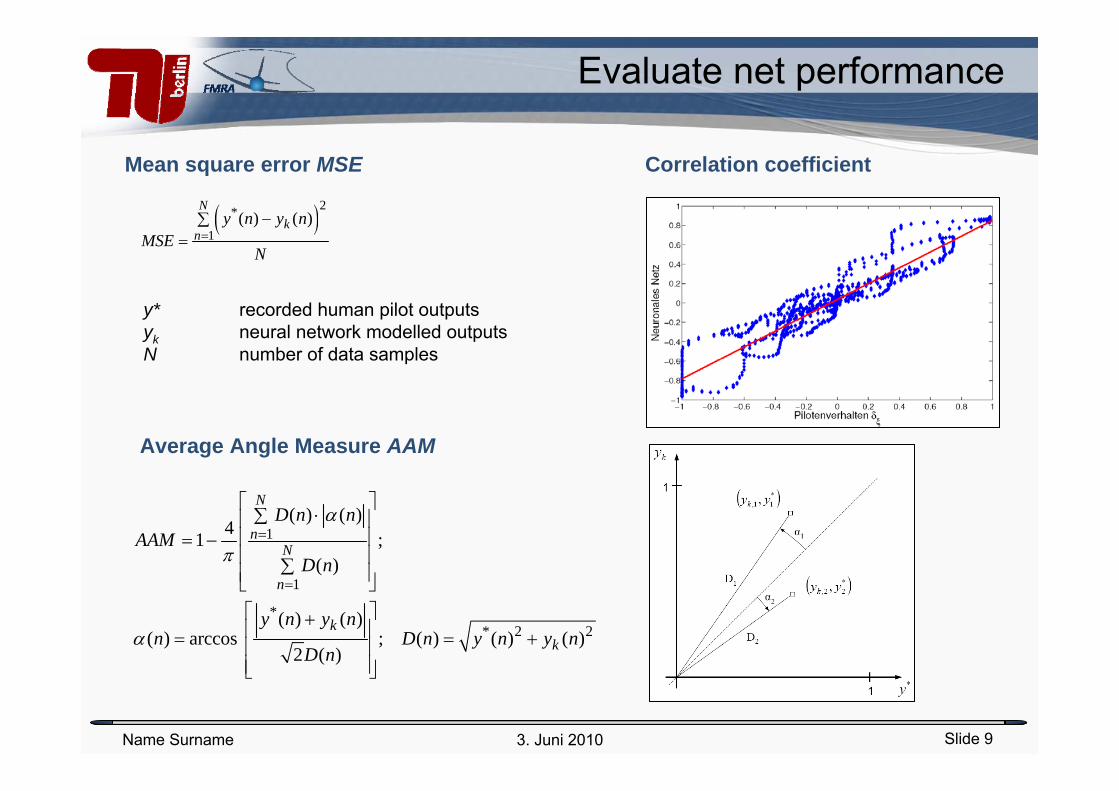
Evaluate net performance
Average Angle Measure AAM
Mean square error MSE
( )2*
1( ) ( )
Nk
ny n y n
MSEN
=−∑
=
y* recorded human pilot outputsyk neural network modelled outputsN number of data samples
1
1
** 2 2
( ) ( )41 ;
( )
( ) ( )( ) arccos ; ( ) ( ) ( )
2 ( )
N
nN
n
kk
D n nAAM
D n
y n y nn D n y n y n
D n
α
π
α
=
=
⎡ ⎤⋅∑⎢ ⎥
⎢ ⎥= −⎢ ⎥∑⎢ ⎥⎣ ⎦⎡ ⎤+⎢ ⎥= = +⎢ ⎥⎢ ⎥⎣ ⎦
Correlation coefficient
Slide 10Name Surname 3. Juni 2010
Evaluate net performance
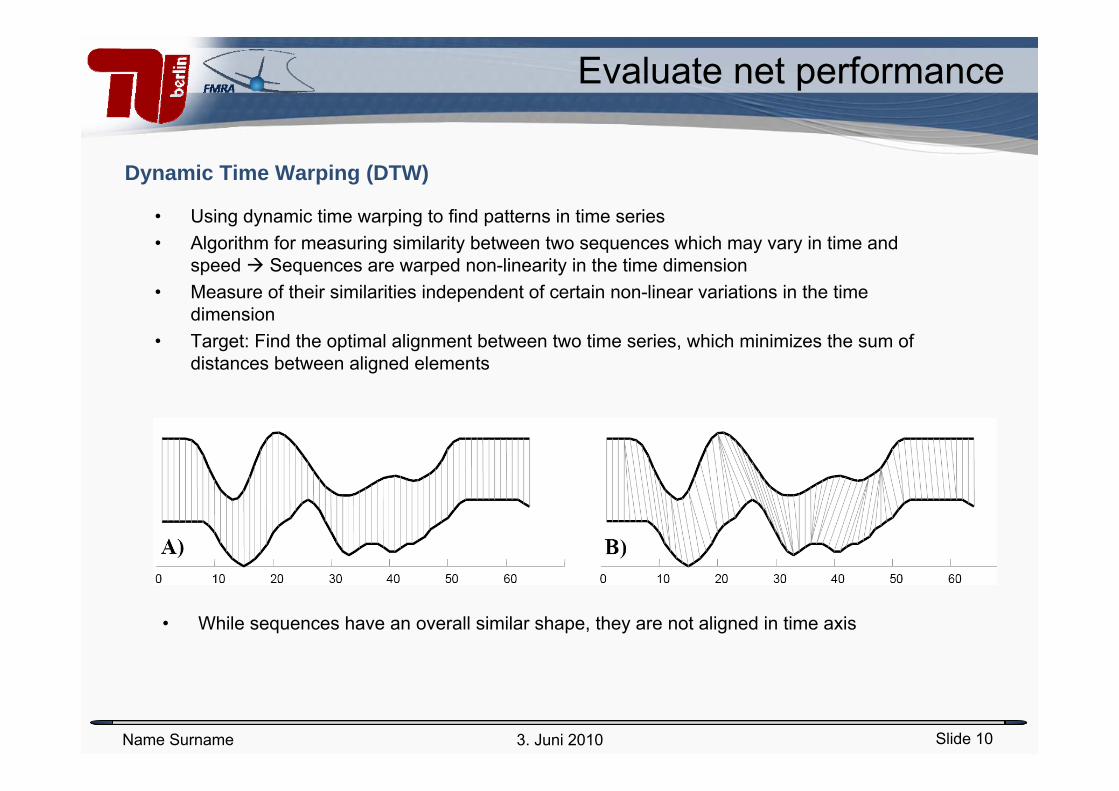
Dynamic Time Warping (DTW)
• Using dynamic time warping to find patterns in time series• Algorithm for measuring similarity between two sequences which may vary in time and
speed Sequences are warped non-linearity in the time dimension • Measure of their similarities independent of certain non-linear variations in the time
dimension• Target: Find the optimal alignment between two time series, which minimizes the sum of
distances between aligned elements
• While sequences have an overall similar shape, they are not aligned in time axis

Slide 11Name Surname 3. Juni 2010
Evaluate net performance
Dynamic Time Warping
0 5 10 15 20-2
-1.5
-1
-0.5
0
0.5
1
1.5
2
Zeit [sec]
δ col [g
rad]
CC 0.133AAM 0.092581DTW 0.70023
PilotPM
30 32 34 36 38 40 42 44 46-0.5
0
0.5
δ row [d
eg]
PilotPM
CC -0.15AAM 0.03DTW 0.63
Synthetic case: demonstrate differences between evaluation criteria
• two sinus signals, differ in amplitude and time• No similarity given by CC= 0.13 and AAM=0.09
• The DTW= 0.7 implies a reasonable similarity
CC 0.13AAM 0.09DTW 0.70
Real case:• E.g. phenomenon of variable time delayed reaction
• No similarity given by CC= -0.15 and AAM=0.03
• The DTW= 0.63 implies a reasonable similarity

Slide 12Name Surname 3. Juni 2010
Chosen net topologies
WVE Mode: Roll axis WVE Mode: Pitch axis
rollSS
rollFD
p
p&
jf
jf
jf
jf
jf
jf
kf
pitchFD
q&
pitchSS
jf
jf
jf
jf
kf
)(
,)(1
jjj
l
ijiijj
zfy
wxbz
=
∑ ⋅+==
Functionality of a neuron
,)(1
∑ ⋅+===
m
jkjjkkk wybzy
Neural net output signal
jy
ky
rollSS
rollFD
p
jf
jf
kf rollSS
rollFD
p
jf jf
jf jf
kfkf
Tracking Mode: Roll axis
Slide 13Name Surname 3. Juni 2010
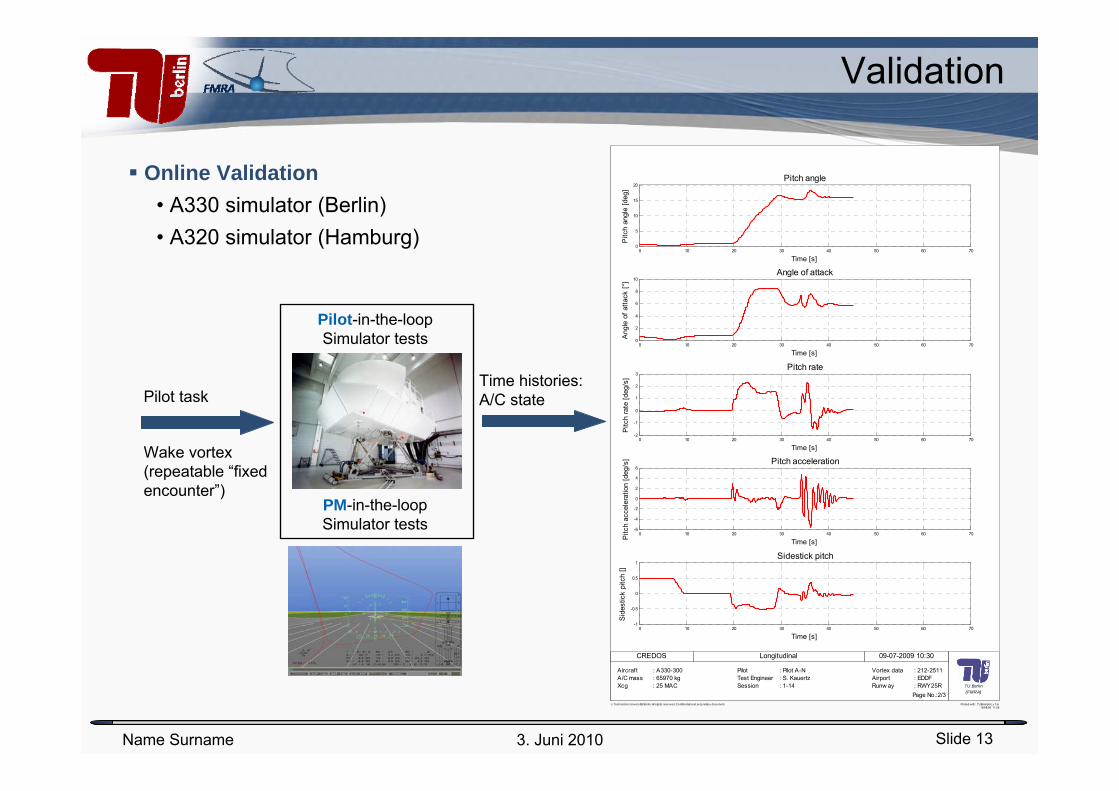
Validation
Pilot-in-the-loop Simulator tests
Time histories:A/C statePilot task
Online Validation• A330 simulator (Berlin)• A320 simulator (Hamburg)
Wake vortex (repeatable “fixed encounter”)
PM-in-the-loop Simulator tests
© Technische Universität Berlin. All rights reserved. Confidential and proprietary document. Printed with: TUBsimplot_v1.m18/08/09 11:28
TU Berlin(FMRA)Page No.:2/3
AircraftA/C massXcg
: A330-300: 65970 kg: 25 MAC
Pilot Test EngineerSession
: Pilot A-N: S. Kauertz: 1-14
Vortex data AirportRunw ay
: 212-2511: EDDF: RWY25R
CREDOS Longitudinal 09-07-2009 10:30
0 10 20 30 40 50 60 700
5
10
15
20
Time [s]
Pitc
h an
gle
[deg
]
Pitch angle
0 10 20 30 40 50 60 700
2
4
6
8
10
Time [s]
Ang
le o
f atta
ck [°
]
Angle of attack
0 10 20 30 40 50 60 70-2
-1
0
1
2
3
Time [s]
Pitc
h ra
te [d
eg/s
]
Pitch rate
0 10 20 30 40 50 60 70-6
-4
-2
0
2
4
6
Time [s]Pitc
h ac
cele
ratio
n [d
eg/s
] Pitch acceleration
0 10 20 30 40 50 60 70-1
-0.5
0
0.5
1
Time [s]
Sid
estic
k pi
tch
[]
Sidestick pitch

Slide 14Name Surname 3. Juni 2010
Validation PM-in-the-Loop
0 10 20 30 40 50 60 70-20
-10
0
10
20
Time [s]
Bank
ang
le [d
eg]
Bank angle
PilotsPM
0 10 20 30 40 50 60 70-6
-4
-2
0
2
4
Time [s]
Sid
eslip
ang
le [°
]
Sideslip angle
PilotsPM
0 10 20 30 40 50 60 70-30
-20
-10
0
10
20
30
Time [s]
Rol
l rat
e [d
eg/s
]
Roll rate
PilotsPM
0 10 20 30 40 50 60 70-60
-40
-20
0
20
40
60
Time [s]
Rol
l acc
eler
atio
n [d
eg/s
]
Roll acceleration
PilotsPM
0 10 20 30 40 50 60 70-1.5
-1
-0.5
0
0.5
1
1.5
Time [s]
Side
stic
k ro
ll []
Sidestick roll
PilotsPM
0 10 20 30 40 50 60 700
5
10
15
20
25
Time [s]
Pitc
h an
gle
[deg
]
Pitch angle
PilotsPM
0 10 20 30 40 50 60 700
2
4
6
8
10
12
Time [s]
Ang
le o
f atta
ck [°
]
Angle of attack
PilotsPM
0 10 20 30 40 50 60 70-6
-4
-2
0
2
4
6
8
Time [s]
Pitc
h ra
te [d
eg/s
]
Pitch rate
PilotsPM
0 10 20 30 40 50 60 70-15
-10
-5
0
5
10
Time [s]Pitc
h ac
cele
ratio
n [d
eg/s
]
Pitch acceleration
PilotsPM
0 10 20 30 40 50 60 70-1
-0.5
0
0.5
1
Time [s]
Sid
estic
k pi
tch
[]
Sidestick pitch
PilotsPM

Slide 15Name Surname 3. Juni 2010
Validation PM-in-the-Loop
0 10 20 30 40 50 60 70-20
-10
0
10
20
30
40
50
Time [s]
Bank
ang
le [d
eg]
Bank angle
PilotsPM
0 10 20 30 40 50 60 70-10
-5
0
5
10
Time [s]
Sid
eslip
ang
le [°
]
Sideslip angle
PilotsPM
0 10 20 30 40 50 60 70-40
-20
0
20
40
60
Time [s]
Rol
l rat
e [d
eg/s
]
Roll rate
PilotsPM
0 10 20 30 40 50 60 70-100
-50
0
50
100
Time [s]
Rol
l acc
eler
atio
n [d
eg/s
]
Roll acceleration
PilotsPM
0 10 20 30 40 50 60 70-1.5
-1
-0.5
0
0.5
1
1.5
Time [s]
Sid
estic
k ro
ll []
Sidestick roll
PilotsPM
0 10 20 30 40 50 60 70-5
0
5
10
15
20
25
Time [s]
Pitc
h an
gle
[deg
]
Pitch angle
PilotsPM
0 10 20 30 40 50 60 70-2
0
2
4
6
8
10
12
Time [s]
Ang
le o
f atta
ck [°
]
Angle of attack
PilotsPM
0 10 20 30 40 50 60 70-6
-4
-2
0
2
4
6
Time [s]
Pitc
h ra
te [d
eg/s
]
Pitch rate
PilotsPM
0 10 20 30 40 50 60 70-15
-10
-5
0
5
10
15
Time [s]Pitc
h ac
cele
ratio
n [d
eg/s
]
Pitch acceleration
PilotsPM
0 10 20 30 40 50 60 70-1
-0.5
0
0.5
1
Time [s]
Side
stic
k pi
tch
[]
Sidestick pitch
PilotsPM
Slide 16Name Surname 3. Juni 2010
Conclusion
• Successful implementation of the pilot model into the A320 simulation
• A very good agreement between human pilot and PM (on the basis of a feed-forward neural network) behaviour was achieved in the roll axis
• The deterministic pilot model lies, in most of the cases, inside the standard deviation of human pilots for sidestick roll, roll rate, roll acceleration and bank angle
• The PM based on recurrent networks delivered comparable good results
• The general structure for a PM probabilistic add-on is considered in the A320 simulation
Slide 17Name Surname 3. Juni 2010
End
Present activities
Slide 18Name Surname 3. Juni 2010
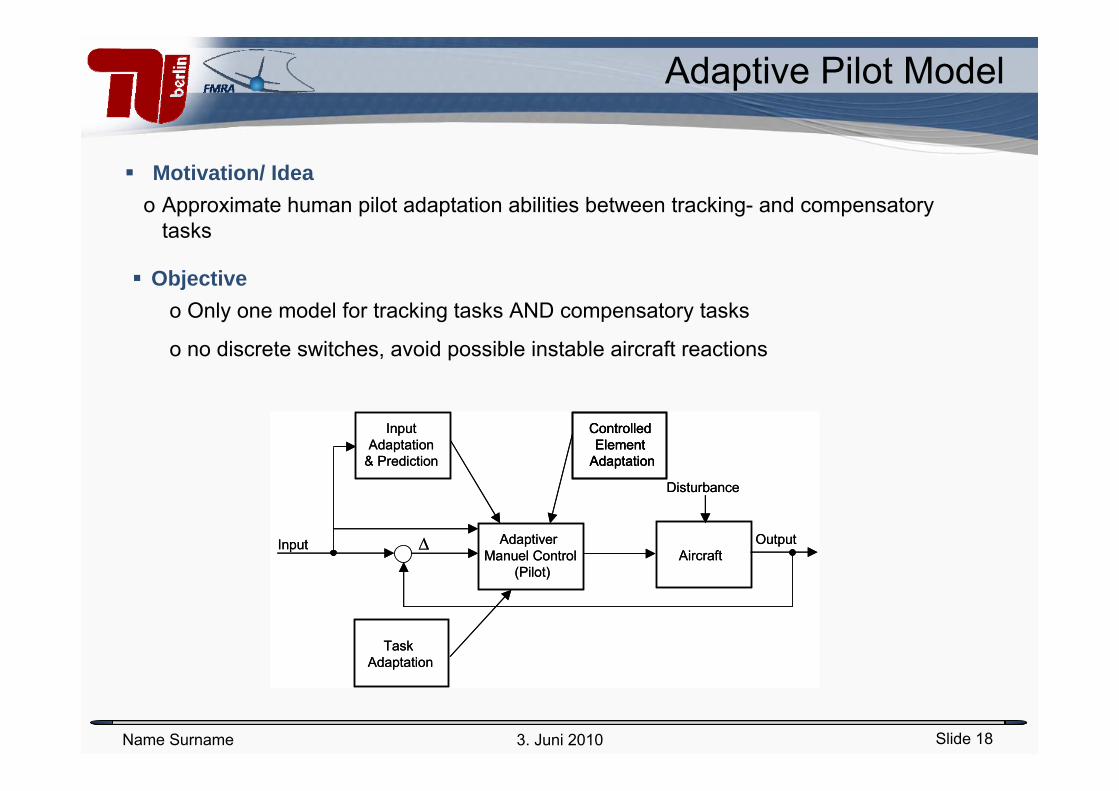
Adaptive Pilot Model
Objectiveo Only one model for tracking tasks AND compensatory tasks
o no discrete switches, avoid possible instable aircraft reactions
Motivation/ Ideao Approximate human pilot adaptation abilities between tracking- and compensatory
tasks
Input Adaptiver Manuel Control
(Pilot)
Input Adaptation
& Prediction
Controlled Element
Adaptation
TaskAdaptation
Aircraft
Disturbance
∆ OutputInput Adaptiver Manuel Control
(Pilot)
Input Adaptation
& Prediction
Controlled Element
Adaptation
Controlled Element
Adaptation
TaskAdaptation
Aircraft
Disturbance
∆ Output
Slide 19Name Surname 3. Juni 2010
Adaptive Pilot Model
Approacho Applied on a controlled aircraft (VFW-614) simulation
o Adaptive part is described by a neural networ
o Human pilots diversity
- needed for statistical investigations
- can be covered by different learning rates, required precision of adaptation, variations in time delay for input and output data of the neural net
o An extension on a predictive module (Luenberger observer, Kalman filter, or 2nd neural net) is intended
o The model should be applicable at least for real-time simulations
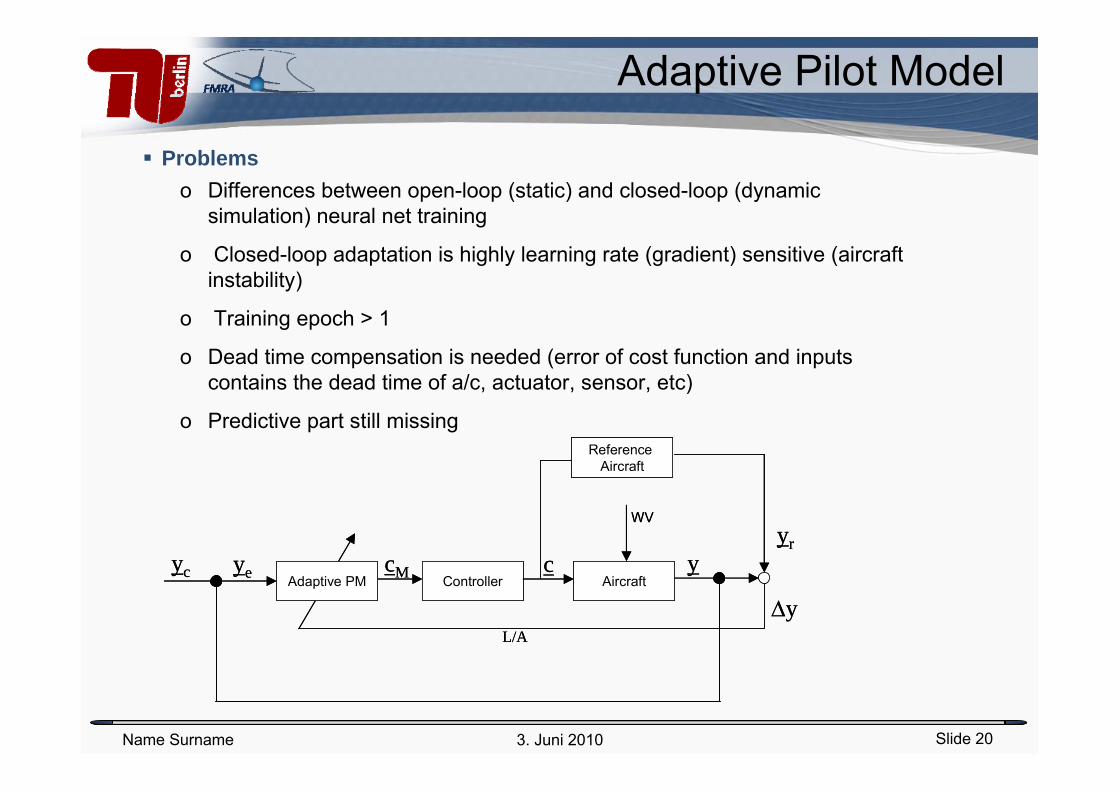
Slide 20Name Surname 3. Juni 2010
Adaptive Pilot Model
Problemso Differences between open-loop (static) and closed-loop (dynamic
simulation) neural net training
o Closed-loop adaptation is highly learning rate (gradient) sensitive (aircraft instability)
o Training epoch > 1
o Dead time compensation is needed (error of cost function and inputs contains the dead time of a/c, actuator, sensor, etc)
o Predictive part still missing
Controller AircraftAdaptive PM
WV
Reference Aircraft
yc ye
Δy
yyr
cM c
L/A
Controller AircraftAdaptive PM
WV
Reference Aircraft
yc ye
Δy
yyr
cM c
L/A