pidilite corner jilta september, 2018 6 portfolio journal of indian leather technologists’...
TRANSCRIPT

Pidilite Corner
www.iltaonleather.org JILTA SEPTEMBER, 2018 3

Pidilite Corner
www.iltaonleather.org JILTA SEPTEMBER, 2018 4

www.iltaonleather.org JILTA SEPTEMBER, 2018 5
Portfolio
ILTA News........................................................11 - 14
Editorial.......................................................... 09 - 10
News Corner.................................................... 27 - 29
Hony. Editor : Dr. Goutam Mukherjee
Communications to Editor through E-mail :
[email protected]; [email protected]
Cover Designed & Printed by :
M/s TAS Associate
11, Priya Nath Dey Lane, Kolkata - 700 036
Published & Printed by :
S. D. Set, on behalf of Indian Leather Technolo-gists’ Association
Published from :
Regd. Office : ‘Sanjoy Bhavan’, 3rd Floor,
44, Shanti Pally, Kasba, Kolkata - 700 107
Printed at :
M/s TAS Associate
11, Priya Nath Dey Lane, Kolkata - 700 036
Subscription :
Annual Rs.(INR) 400.00
Foreign $ (USD) 45.00
Single Copy Rs.(INR) 50.00
Foreign $ (USD) 4.00
All other business communications shouldbe sent to :
Indian Leather Technologists’ Association
‘Sanjoy Bhavan’, 3rd floor, 44, Shanti Pally
Kasba, Kolkata - 700 107, WB, India
Phone : 91-33-2441-3429 / 3459
Telefax : 91-33-2441-7320
E-mail : [email protected]; [email protected]
Web site : www.iltaonleather.org
Portfolio.......................................................... 05 - 08
Contents
Economic Corner.............................................. 51 - 54
STAHL Corner.................................................. 21 - 22
JOURNAL OF INDIAN LEATHER TECHNOLOGISTS’ ASSOCIATION (JILTA)
SEPTEMBER, 2018 VOL.: LXVIII NO.: 09 RNI NO.: 2839/57 REGD.NO.: ISSN 0019-5738
Balmer Lawrie Corner.........................................15 - 18
Down Memory Lane.......................................... 40 - 50
Students Corner............................................... 30 - 30
Pidilite Corner.................................................. 03 - 04
Opinions expressed by the authors of contributions published in theJournal are not necessarily those of the Association
Article - “India - As It stands Today” (Part a) byDr. Goutam Mukherjee........................................ . 19 - 20
Article - “India - As It stands Today” (Part b) byDr. Goutam Mukherjee........................................ . 23 - 26
Commentary.................................................... 38 - 39
Article - ‘Consumer Preference for Locally MadeShoes in Kolkata Market’ by Dibyendu BikashDatta1 & Sanjib Kumar Das2............................... .31 - 37
www.iltaonleather.org JILTA SEPTEMBER, 2018 6
Portfolio
JOURNAL OF INDIAN LEATHER TECHNOLOGISTS’ ASSOCIATION(JILTA)
Indian Leather Technologists’ Association is a premier organisation of its kind in India was established in 1950 by LateProf. B.M.Das. It is a Member Society of International Union of Leather Technologists & Chemists Societies (IULTCS).
The Journal of Indian Leather Technologists’ Association (JILTA) is a monthly publication which encapsulates lateststate of the art in processing technology of leather and its products, commerce and economics, research & development,news & views of the industry etc. It reaches to the Leather / Footwear Technologists and the decision makers all over thecountry and overseas.
Advertisement Tariff
Full Page / per month
Black & White Rs. 5,000.00/-Colour (full page) Rs. 10,000.00/-Colour Insert (One side) Rs. 5,000.00/-
(Provided by the Advertisers)
Full Page / per anum
Front inside (2nd Cover) Rs. 96,000/-3rd Cover Rs. 84,000/-Back Cover Rs. 1,20,000/-
Mechanical Specification Overall size : 27 cm X 21 cm Print area : 25 cm X17 cm
Payment should be made by A/c. Payee Cheque to be drawn in favour of :
Indian Leather Technologists’ Associationand Payable at Kolkata
Send your enquiries to :
Indian Leather Technologists’ Association‘SANJOY BHAVAN’
3rd floor, 44, Shanti Pally, Kasba, Kolkata – 700 107Phone : 91-33-24413429/3459, Telefax : 91-33-24417320
E-mail : [email protected] / [email protected] : www.iltaonleather.org

www.iltaonleather.org JILTA SEPTEMBER, 2018 7
Portfolio
INDIAN LEATHER TECHNOLOGISTS’ ASSOCIATION(Member Society of International Union of Leather Technologists and Chemists Societies)
Regional CommitteesCentral Committee
Southern Region :
President : Mr. N. R. Jaganathan
Vice-President : Dr. J. Raghava Rao
Secretary : Dr. R. Mohan
Treasurer : Dr. Swarna V Kanth
Committee Members :Dr. J. KanagarajDr. Subhendu ChakrabortyDr. S. V. SrinivasanMr. S. SiddharthanMr. P. Thanikaivelan
Northern / Western Region :
President : Mr. Jai Prakash Saraswat
Vice-President : Mr. Kamal Sharma
Secretary : Mr. Deepak Kr. Sharma
Treasurer : Mr. Jaswinder Singh Saini
Committee Members:Mr. Rajvir VermaMr. Sudagar LalMrs. Sunita Devi ParmerMr. Rajeev MehtaMr. Sunil Kumar
President : Mr. Arnab Kumar Jha
Vice-Presidents : Mr. Asit Baran Kanungo
Dr. K. J. Sreeram
Mr. P. K. Bhattacharjee
General Secretary : Mr. Susanta Mallick
Joint Secretaries : Mr. Shiladitya Deb Choudhury
Mr. Bibhas Chandra Jana
Treasurer : Mr. Kaushik Bhuiyan
Committee Members :
Mr. Jiban Dasgupta
Mr. Kanak Kr. Mitra
Mr. Pradipta Konar
Mr. Alokesh Roy
Mr. Aniruddha De
Mr. Aloke Kumar De
Mr. Subir Dutta
Mr. Deepak Kr. Sharma
(Secretary of Northern Region)
Dr. R. Mohan
(Secretary of Southern Region)
Ex-Officio Member : Dr. Goutam Mukherjee
Executive Committee (2017-19)

www.iltaonleather.org JILTA SEPTEMBER, 2018 8
Portfolio
Chief Patron : Dr. T. Ramasami
Advisers : Prof. Dr. A. B. MandalMrs. Antara KumarDr. Bi ShiDr. B. N. DasDr. Buddhadeb ChattopadhyayDr. Campbell PageDr. Carlo MiloneDr. Chandan RajkhowaMr. E. DevenderDr. PisiDr. Roberto VagoDr. Samir DasguptaProf. Swapan Kumar BasuMr. Suparno MoitraDr. Subha GangulyDr. Tim AmosDr. Tapas Gupta
Peer Reviewing Committee : Prof. A. K. MishraMr Abhijit DuttaMr. Animesh ChatterjeeDr. B. ChandrasekharanMr. Diganta GhoshDr. J. Raghava RaoMr. Jayanta ChaudhuriDr. N. K. ChandrababuMr. Prasanta Kumar BhattacharyyaDr. Subhendu ChakrabartiMr. Satya Narayan Maitra
Hony Editor : Dr. Goutam Mukherjee
Joint Editors : Dr. Sanjoy ChakrabortyDr. Anjan Biswas
JOURNAL OF INDIAN LEATHER TECHNOLOGISTS’ ASSOCIATION (JILTA)
EDITORIAL BOARD OF JILTA

Editorial
www.iltaonleather.org JILTA SEPTEMBER, 2018 9
Inter linking of river - Less probabilityof flash floods
The concept of linking of rivers or inter-basin transfer of water isessentially based on the availability of surplus of water in the donor riverespecially at the point of diversion to the deficit river basin. The surplusor deficit in a basin is determined on the basis of availability at 75%dependability, import, export, and existing and future needs. A riverbasin is said to be reasonably in surplus of water, if the surplus water isavailable after meeting the irrigation needs of at least 60% of the cultivablearea in the basin. Only this water from such a basin can be diverted todeficit basins. In the recipient/deficit river basin, it is proposed that, atleast, 30% of the cultivable area is covered under irrigation. This is oneof the most effective managements of surface water resources, as accordingto protagonists, it is an economically viable, technically feasible andenvironmentally sound and viewed as the future main stay for thesustainable development of any region confronting water deficit. On thisbasis, The National Water Development Authority (NWDA) after a thoroughstudy indicated that Himalayan rivers, especially, Brahmaputra and Gangahave exceedingly surplus quantum of water and hence, proposed transferof water from these surplus basins to deficit basins in peninsular region.
The idea behind interlinking of rivers is to transfer water from surplusregion to the deficient one through a number of link canals. The northernplains of India are endowed with surplus water due to the presence ofperennial rivers emanating from Himalaya, but the southern and westernIndia has seasonal rivers i.e they have water in the river only during themonsoon season. While we face floods in one region we also face droughtin the other region, so can’t we have a system of equitable distribution ofwater. Therefore, Government has identified 14 Himalayan rivers, 16Peninsular rivers and 37 intrastate rivers having potential of interlinking.
The concept is not new to India, it was initiated in the British rule. Ken-Betwa interlinking project in Bundelkhand region of UP and MP is thefirst inter-state river interlinking project in India, recently got approvalfrom NGT.
The per capita availability of water (PCA) in India is only 2200 m3 /yearas against 17500 m3 / year in Russia. As per international standards, acountry with less than 1700 cu m of PCA is considered water-stressed,when the PCA drops to 1000 m3, it is said to be water-scarce. Demographicprojections indicate that by the year 2050, the country’s populationwould be stabilized at around 1640 million; at that time, the PCA wouldbe precariously placed at 1100 m3; but the situation, it is feared, mayescalate to a higher figure (MOWR 1999). If the population increasesfurther, which is likely, the PCA would sink to less than 1000 m3 (Patel
2003). It does not constitute even 10% of the corresponding value in thedeveloped countries. The current usage of 600 BCM of water by thecountry has to be increased to 1200 BCM by 2050 to keep abreast of theneeds of the increasing population.
There is an immense pressure to share river waters among the countries,states and regions. The political and social issues are very important asthey may decide the fate of this kind of projects of national importance.Mondal (2004) opined that the linking of rivers is more problematic forsocio-economic-cultural relations of the society. In South-East Asia, theHimalayan river waters are of interest, as the Himalayan region has someof the world’s most underdeveloped/developing countries, Bangladesah,Nepal, India, Bhutan, Pakistan, Tibet, and China. Construction of damsacross the Himalayan rivers Brahmaputra and Ganga and their maintributaries in India and Nepal and interlinking of their canal system andtransfer of surplus flows of the eastern tributaries of the Ganga to thewest in addition to linking of Ganga and Brahmaputra constituteimplementation aspects of the main concept of inter-basin transfer ofwater between the countries. While providing irrigation to additional 22million hectares, it generates pollution free hydro-power and will provideflood control in the Ganga- Brahmaputra basin. Thus, Ganga- Brahmaputrabasin, and Nepal and Bangladesh would have advantage from the project.
Even as India has been procrastinating, the rest of the world has goneabout inter-basin water transfer (IBT) projects at a brisk pace during thepast 50 years or so. Global and local opposition now withstanding,China has steadfastly stayed course on its own scheme of transferring48KM3 of water from Yangtze to the Yellow to improve water availabilityin dry plains of North china. Elsewhere in the world many IBT projectshave faced a variety of problems and produced some unwanted sideeffects; however, in overall terms, most have tuned out to beneficial inbalance. Even a wary global environmental review of IBTs (Snaddon,Davis and Wishart 1999)- which advocates using precautionary principle,concluded that: “In many parts of the world, water transfers have becomethe lifeblood of developing and extant human settlements, for which noalternative is currently perceived to be available.”
Examples to be adhered :
Colorado Big Thomson , USA diverts about 0.284km3/ annum ofwater from the upper reaches of the western flowing Colorado river andsends eastwards into the south Platte River Basin, which is a part of theMississippi-Missouri basin. Completed in 1957.

Editorial
www.iltaonleather.org JILTA SEPTEMBER, 2018 10
Lesotho Highlands Water Project, South Africa. Completed in2004 diverts 750m3/ annum of water from Lesotho to South Africa.
There are several concerns raised against undertaking such a mammothproject like land acquisition, daunting cost, disturbance of natural rivercourse, population displacement and conflicts amongst Indian statesand neighboring countries. So like any major project this project comeswith its cons but it is up to us to weigh the pros and cons and take aninformed decision. By 2025 as mentioned earlier India will be a waterstarved nation if adequate steps are not taken. Alternative ideas likeimproving water harvestation techniques, efficient irrigation and properwaste management have been proposed but they are all at a very lowscale and none will make a significant impact as per studies. Disregardingwhether India goes through with this project or not, change is inevitable.With ever-growing pressure of global warming and increasing humanpopulation, water scarcity problem will not improve on its own.Interlinking of Rivers is nothing but joining the rivers of the country bynetworks of canals and reservoirs. Interlinking of rivers in India wasproposed for the first time during British Colonial rule. The main intensionof the proposal was to reduce the transportation cost of raw materialsand finished products. The Indian Government has established theNational Water Development Agency to study the interlinking of riversunder the Ministry of Water Resources. Many states have proposed forinterlinking of rivers due to scarcity of water in their states and hence thecentral government is working on a few projects.
Perceived benefits :
It expects to add 34,000 MW of hydro power to the national grid(clean energy).
Large canals will facilitate inland navigation. Will create employment and boost crop output and farm income.
India receives most of its rain during monsoon season fromJune to September, most of it falls in northern and eastern partof India, the amount of rainfall in southern and western part arecomparatively low. It will be these places which will have shortageof water. Interlinking of rivers will help these areas to have waterthroughout the year
The main occupation of rural India is agriculture and if monsoonfails in a year, then agricultural activities come to a standstill andthis will aggravate rural poverty. Interlinking of rivers will be apractical solution for this problem, because the water can be storedor water can be transferred from water surplus area to deficit.
The Ganga Basin, Brahmaputra basin sees floods almost everyyear. In order to avoid this, the water from these areas has to bediverted to other areas where there is scarcity of water. This canbe achieved by linking the rivers. There is a two way advantagewith this – floods will be controlled and scarcity of water will bereduced.
Interlinking of rivers will also have commercial importance on alonger run. This can be used as inland waterways and whichhelps in faster movement of goods from one place to other.
Interlinking creates a new occupation for people living in and aroundthese canals and it can be the main areas of fishing in India.
We pray for every upkeep and safe passage of the time of catastrophicsituations for the residents of Kerala. We do pray to the Almighty to getthe situation restored back to normalcy at the earliest and reinstate thebeautiful state in its previous stature again. Indian Leather Technologists’Association affirms its association with the disaster stricken people of Kerala.
Dr . Gou tam Mukher jee Hony. Editor, JILTA

ILTA News
www.iltaonleather.org JILTA SEPTEMBER, 2018 11
From the desk of General Secretary
68 th Foundation Day Celebrat ion
Above was organized at the Auditorium of Freya Design Studio, KolkataLeather Complex on Tuesday the 14th August, 2018.
The programme commenced with Mr. Susanta Mallick, General Secretary,ILTA requesting the following dignitaries to please take their seats on thedias –
1. Padmashri Prof. Ajoy Kumar Ray, IIT, Kharagpur & formerDirector, IIEST, Shibpur
2. Prof. Asok Kumar Banerjee, President, Calcutta ManagementAssociation & Council Member, AIMA
3. Mr. Adhar Sahni, President, ILPA4. Mr. Asit Baran Kanungo, Vice President, ILTA
Padmashri Prof. Ajoy Kumar Ray was presented a bouquet and a shawlby Mr. Asit Baran Kanungo, Vice President, ILTA.
Prof. Asok Kumar Banerjee was greeted with a bouquet and a shawl byProf. (Dr.) Sanjoy Chakraborty, Principal, Govt. College of Engineering& Leather Technology, Kolkata.
Mr. Adhar Sahni, President, ILPA was greeted with a bouquet and ashawl by Mr. B. C. Jana, Joint Secretary, ILTA.
The portrait of late Prof. B. M. Das was then garlanded by the following:-
1. Mr. Asit Baran Kanungo, Vice President, ILTA2. Padmashri Prof. Ajoy Kumar Ray3. Prof. Asok Kumar Banerjee4. Mr. Adhar Sahni5. Mr. Shiladitya Denchoudhury, Joint Secretary, ILTA6. Mr. Swapan Kumar Basu, a senior member of ILTA7. Prof. (Dr.) Sanjoy Chakraborty, Officer – in – Charge, GCELT,
Kolkata8. Mr. Kanjilal, representative from CFTC, Budge Budge9. Dr. Dipankar Chaudhuri, representative from RCED, CLRI,
Kolkata10. Mr. Patrick Lee, representative from industry
11. Dr. Shome Nath Ganguly, former Principal, Karnataka Instituteof Leather Technology
12. Mr. Champak Mukherjee, representative from FDDI, Kolkata13. Dr. V. Vijayabaskar, Balmer Lawrie & Co. Ltd., Chennai14. Mr. Ratan Chowdhury, representative from ILCPA, Kolkata
G.S. then announced the names of the award winners and requestedthem to come to the dias to receive their awards.
a) Mr. S. Ramanathan – Winner of B. M. Das Memorial Medal forsecuring 1st Class 1st Position in B.Tech, Leather Technologyexamination of Anna University in 2018 received the awardfrom Padmashri Prof. Ajoy Kumar Ray.
b) Mr. B. Ashokkumar – Winner of B. M. Das Memorial Medal forsecuring 1st Class 1st Position in M.Tech, Leather Technologyexamination of Anna University in 2018 received the awardfrom Prof. Asok Kumar Banerjee.
c) Miss N. S. Shailakshmi – Winner of B. M. Das MemorialMedal for securing 1st Class 1st Position in M.Tech, FootwearScience & Engineering examination of Anna University in2018 received the award from Mr. Adhar Sahni.
d) Miss Bilkish Begum – Winner of B. M. Das Memorial Medalfor securing 1st Class 1st Position in M.Tech, LeatherTechnology examination of Moulana Abul Kalam AzadUniversity of Technology, West Bengal in 2017 received theaward from Mr. Adhar Sahni.
e) Mr. Shubham De – Winner of both B. M. Das Memorial Medal& J. M. Dey Memorial Medal for securing 1st class 1st positionin B.Tech, Leather Technology examination of Moulana AbulKalam Azad University of Technology, West Bengal in 2018,received the awards from Prof. (Dr.) Sanjoy Chakraborty andDr. Goutam Mukherjee respectively.
f) Dr. V. Vijayabaskar, Mr. J. K. Basu & Mr. Jayantha Chaudhuri– Winner of J. Sinha Roy Memorial Award for their articletitled “Novel Surfactants in Leather Processing”published in April, 2017 issue of JILTA adjudged the Best of

ILTA News
www.iltaonleather.org JILTA SEPTEMBER, 2018 12
all articles published in JILTA in calendar year 2017 by acommittee consisting of Prof. (Dr.) Sanjoy Chakraborty,Principal, GCELT and Dr. Dipankar Chaudhuri, Scientist &Head, RCED, CLRI, Kolkata, received the Certificates and theAward from Padmashri Prof. Ajoy Kr. Ray.
Award Winners Mr. B. Ashokkumar from Chennai and Miss Bilkish Begumfrom Kolkata then made presentations after which G.S. requested Dr. V.Vijayabaskar to address the gathering.
G.S. then requested Mr. Adhar Sahni to address the gathering, Mr. AsitBaran Kanungo handed over a memento to Mr. Sahni after the address.
Above was followed by the lecture titled “Leadership & Motivationin today’s Socio-Economic Scenario” by Prof. Asok KumarBanerjee. After the lecture, a memento was handed over to Prof. Banerjeeby Prof. (Dr.) Sanjoy Chakraborty.
Mr. Asit Baran Kanungo then introduced Padmashri Prof. Ajoy KumarRay to the gathering and requested him to deliver the prestigious B. M.Das Memorial Lecture titled “A Brief History of Industrializationof India – past, present and future” .
A memento was handed over to Padmashri Prof. Ajoy Kumar Ray by Mr.Asit Baran Kanungo after the lecture.
Mr. Susanta Mallick, General Secretary, ILTA then offered Vote of Thanksby expressing gratitude to Padmashri Prof. Ajoy Kumar Ray, Prof. AsokKumar Banerjee and Mr. Adhar Sahni who spared their valuable time tobe amongst us today. Gratitude was also expressed to Dr. V. Vijayabaskar,Members, Guests, Students for their kind presence. ILPA & Freya Design
Studio were thanked for extending necessary help and co-operation. Abright future was wished for the Award Winners.
Remembering those dedicated Members who were the pillars for thesuccessive journey of our Association, G.S. invited all present to Lunchserved in the adjacent dinning hall.
60 th Annual General Meeting
Above is scheduled to be held at 03.00 PM on Saturday the 29th September,2018 at the Auditorium of Indian Science Congress Association, 14, Dr.Biresh Guha Street, Kolkata – 700 017. Notice of the AGM with furtherdetails will be posted in the first week of September, 2018.
LEXPO Si l iguri – XXV
The next LEXPO at Siliguri will be the 25th in series. We have alreadyapplied to the competent authority for allocation of KanchanjunghaKrirangan adjacent ground from around the middle of December, 2018for organizing Silver Jubilee of LEXPO at Siliguri.
Kerala Flood Relief :
The Executive Committee in an Emergency Meeting convened on Tuesday21st September, 2018 decided that ILTA will donate a sum of rupees Onelakh towards relief of several lakhs of people of Kerala affected by theworst flood of the century.
It may be recalled that our Association has always contributed to thecause of relief to the people affected by any natural calamity like Aila,earthquake in Nepal, Tsunami in Chennai etc.
With profound grief and a heavy heart we announce the sad demise of B. N. Mondal, a life member and ex-General Secretary (1995) ofour Association.
In August we received a telephone call from late Mondal’s son advising us of his father’s demise on 27.05.2018.
May his soul rest in peace and May God give strength to the members of the bereaved family to bear the irreparable loss.

ILTA News
www.iltaonleather.org JILTA SEPTEMBER, 2018 13
You are requested to :-
a) Kindly inform us your ‘E-Mail ID’, ‘Mobile No’, ‘Land Line No’, through E-Mail ID : [email protected] over Telephone Nos. : 24413429 / 3459 / 7320. This will help us to communicate you directly withouthelp of any outsiders like Postal Department / Courier etc.
b) Kindly mention your Membership No. (If any) against your each and every communication, so that we can locate you easily in our record.
(Susanta Mallick) General Secretary
Executive Committee Members meet every Thursdayat 18-30 hrs. at ILTA Office.
Members willing to participate are most welcome.

ILTA News
www.iltaonleather.org JILTA SEPTEMBER, 2018 14
Balmer Lawrie Corner
www.iltaonleather.org JILTA SEPTEMBER, 2018 15

Balmer Lawrie Corner
www.iltaonleather.org JILTA SEPTEMBER, 2018 16

Balmer Lawrie Corner
www.iltaonleather.org JILTA SEPTEMBER, 2018 17

Balmer Lawrie Corner
www.iltaonleather.org JILTA SEPTEMBER, 2018 18

www.iltaonleather.org JILTA SEPTEMBER, 2018 19
Article
India - As It stands TodayDr. Goutam Mukherjee, WBGS
Group ‘A’ Officer, Govt. of West Bengal
Associate Professor
GOVT. COLLEGE OF ENGINEERING & LEATHER TECHNOLOGY
Kolkata - 700 098, West Bengal, India
*Corresponding author E-mail: [email protected] / [email protected]
India, a South Asian nation, is the seventh-largest country by area, thesecond-most populous country with over 1.33 billion people, and themost populous democracy in the world. India boasts of an immenselyrich cultural heritage including numerous languages, traditions andpeople. The country holds its uniqueness in its diversity and hence hasadapted itself to international changes with poise and comfort. While theeconomy has welcomed international companies to invest in it with openarms since liberalisation in 1990s, Indians have been prudent and pro-active in adopting global approach and skills. Indian villagers proudlytake up farming, advanced agriculture and unique handicrafts as theirprofession on one hand while modern industries and professional servicessectors are coming up in a big way on the other.
Thus, the country is attracting many global majors for strategicinvestments owing to the presence of vast range of industries, investmentavenues and a supportive government. Huge population, mostlycomprising the youth, is a strong driver for demand and an amplesource of manpower.
India published its latest economic survey which includes a forecast ofGDP growth between 7 and 7.5 percent for the financial year 2018-2019, upfrom the 2017-2018 growth forecast of 6.75 percent, a three-year low.
The survey, an annual document released by the Ministry of Finance,reviews the developments in the Indian economy over the previous 12months and provides the basis for the federal budget, which is due to beintroduced in parliament on Thursday, the last by the government ofPrime Minister Narendra Modi before general elections next year. TheInternational Monetary Fund (IMF) said recently that India could grow at7.4 percent in 2018, against China’s 6.8 percent, making it the fastestgrowing country among emerging economies. The IMF also projecteda 7.8 percent growth rate for 2019.
India outpaced China from mid-2015 but lost the top spot in 2017, whenGDP growth fell. India’s recent slowing economic growth has been putdown to several factors, including falling private investment and decliningexports. Economists said the government’s demonetization policy andrapid implementation of a common goods and services tax also
contributed to the slowdown. Chief economic adviser Arvind Subramaniansaid there were “robust and broad-based signs of revival,” but warned ofnew obstacles such as rising oil prices, interest rates and inflation.
“It is both a story of revival and risks,” he said. “Several indicators of activity– manufacturing growth, GVA [gross value added] growth, investments,exports, net private transfers, credit, they have all started to pick up.”
“The level is still below potential. But in terms of direction, the economyseems to be picking up quite nicely, quite robustly,” Subramanian said.
The challenges facing the government include the continuedimplementation of the common tax, reigniting private investments aswell as addressing issues including job creation and agrarian distress.Besides these problems, the government has also addedthe recapitalization of banks to its policy agenda in the coming year.Indian government has eased regulations for foreign investors in aneffort to boost economic growth in the Asian nation. The new rules arealso meant to help struggling carrier Air India get out of the doldrums.A cabinet meeting has paved the way for 100-percent foreign investmentin single-brand retail and construction development. Until now, foreigndirect investment (FDI) of up to 49 percent was permitted in both sectors,but government approval was required beyond that.
“This will lead to larger FDI inflows, contributing to growth of investment,income and employment,” the government said in a statement.
The cabinet also allowed foreign airlines to invest up to 49 percent in thedebt-ridden national carrier Air India, subject to government approval.The airline ran losses for nearly a decade after a botched merger in 2007and still has debts of around $7.67 billion (€6.4 billion). It received a$5.8 billion in bailout funds from the taxpayer, but still needs morecapital to become profitable. While India has seen its economy slowingrecently, it has managed to secure a lot of foreign capital even without thenew opportunities in place for entrepreneurs from abroad.
The country received more than $60 billion in FDI in the past financial yearrunning from April 2016 to March 2017, representing an all-time high.

www.iltaonleather.org JILTA SEPTEMBER, 2018 20
Article
The region’s strong economic growth of 6.3 percent - the same as lastyear - will be supported by soft commodity prices and recovery in themajor industrial economies, said a new Asian Development Bank (ADB)report. ccording to the Asian Development Outlook 2015, India is forecastto overtake China in terms of economic growth as the initial phase ofgovernment efforts to remove structural bottlenecks is lifting investorconfidence. “With the support of stronger external demand, India is setto expand by 7.8 percent in FY2015 - ending 31 March 2016 - a sharprise from 7.4 percent growth in FY2014. This momentum is expected tobuild to 8.2 percent growth in FY2016, aided by expected easing ofmonetary policy and a pickup in capital expenditure,” said the paper.
As for China, growth is expected to slow to 7.2 percent in 2015 and 7.0percent in 2016. This is a much more moderate rate than the averagegrowth of 8.5 percent in the period since the global financial crisis.Across the sub-regions, economic growth in East Asia will slow to 6.5percent in 2015 and 6.3 percent in 2016 reflecting the moderation in China.
Growth in South Asia is projected to trend higher to 7.2 percent in 2015and 7.6 percent in 2016, and Southeast Asia is poised for a growthrebound of 4.9 percent in 2015 and 5.3 percent in 2016 as recovery inIndonesia and Thailand leads the way, and with most of the sub-regionexpected to benefit from rising exports and lower inflation, said to the report..
The main factors are the reforms undertaken in many of these countries,the recovery in high income countries such as the United States, Europeand Japan and, last but not least, the reduction in commodity prices. Theall will help to sustain growth, but this will be tempered by moderategrowth in China. China’s expected growth rate of 7.2 percent in 2015and 7.0 percent in 2016 is still relatively healthy as we see that many ofthe ongoing government reforms affecting state-owned firms and thefinancial sector have the potential to increase productivity. The impact ofthese reforms could thus offset some of the moderating forces currentlyat work such as a declining work force, rising labor costs and a strongvalue of the Chinese RMB. But there are also risks involved if some ofthese reforms aren’t carried out appropriately, if the US or Europeaneconomies slow down, or if oil prices rebound more strongly thanexpected. But there are also risks involved if some of these reforms aren’tcarried out appropriately, if the US or European economies slow down,or if oil prices rebound more strongly than expected. forecast that India’seconomy will grow faster than that of China’s is based on the assumptionthat many of the structural reforms promised by the Narendra Modi-ledgovernment will be implemented - although we don’t believe that all ofthem will be carried out overnight.
The key reforms include more flexible labor market laws, a more efficientland acquisition process, simplification of regulations, and increasedinvestment in major infrastructure projects. But none of these reformscan be taken for granted. As recent news suggests, the political processcould slow down some of these changes.
The member countries of the AEC, which is set to be launched by the endof this year, have a very ambitious reform agenda. To understand theeffects, ASEAN can be divided in two groups the high to middle-income
nations and the new members such as Myanmar and Cambodia. For thelatter, one of the main benefits of the AEC will be that it will speed up thereforms necessary to create an environment much more friendly to growthand job creation. Myanmar, for instance, will be able to better integrateitself in regional and global value chains so that its labor force can beutilized more productively.
For higher income ASEAN members, the AEC will allow a free flow ofgoods, services, and investments, as well as freer flow of capital andskills. Moreover, it should enable investors to increase their marketreach and grant ASEAN-based companies access to raw materials,production inputs, services, labor, and capital wherever in ASEAN theychoose to set-up their operations. From the trough of the global financialcrisis in 2009, the region contributed 2.3 percentage points to globalGDP growth - nearly 60 percent of the world’s annual 4.0 percent pace.
Eight economies in the region posted growth exceeding 7.0 percent innearly every year of the post-crisis period, including China, the LaoPeople’s Democratic Republic, and Sri Lanka. However, the oil and mineralexporters among those with consistently rapid growth may see theirfortunes turn in the coming years as commodity prices stumble.
Exports from India rose 17.6 percent year-on-year to USD 27.7 billion inJune of 2018, due to sales of petroleum products (52.5%); organic andinorganic chemicals (30.3%); drugs and pharmaceuticals (14.7%);engineering goods (14.2%) and gems and jewellery (2.7%). Exports inIndia used to average 5248.70 USD Million from 1957 until 2018,reaching an all time high of 30541.44 USD Million in March of 2013 anda record low of 59.01 USD Million in June of 1958.
Let us scroll down the self explanatory DATA.
Export status of India
(Continued to to page no. - 23)

www.iltaonleather.org JILTA SEPTEMBER, 2018 21
Stahl Corner

www.iltaonleather.org JILTA SEPTEMBER, 2018 22
Stahl Corner

www.iltaonleather.org JILTA SEPTEMBER, 2018 23
Article
India’s economic index having references with itself :
(Art ic le Continued from page 20)

www.iltaonleather.org JILTA SEPTEMBER, 2018 24
Article
Where do we stand at present :
www.iltaonleather.org JILTA SEPTEMBER, 2018 25
Article
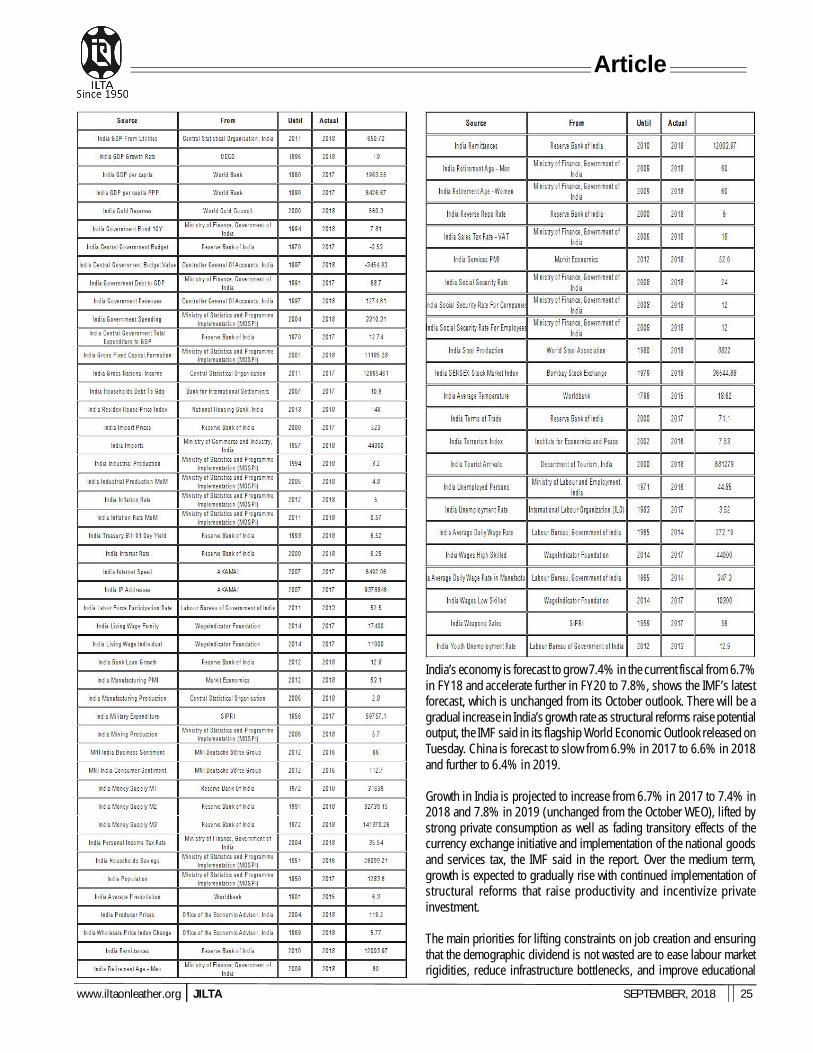
India’s economy is forecast to grow 7.4% in the current fiscal from 6.7%in FY18 and accelerate further in FY20 to 7.8%, shows the IMF’s latestforecast, which is unchanged from its October outlook. There will be agradual increase in India’s growth rate as structural reforms raise potentialoutput, the IMF said in its flagship World Economic Outlook released onTuesday. China is forecast to slow from 6.9% in 2017 to 6.6% in 2018and further to 6.4% in 2019.
Growth in India is projected to increase from 6.7% in 2017 to 7.4% in2018 and 7.8% in 2019 (unchanged from the October WEO), lifted bystrong private consumption as well as fading transitory effects of thecurrency exchange initiative and implementation of the national goodsand services tax, the IMF said in the report. Over the medium term,growth is expected to gradually rise with continued implementation ofstructural reforms that raise productivity and incentivize privateinvestment.
The main priorities for lifting constraints on job creation and ensuringthat the demographic dividend is not wasted are to ease labour marketrigidities, reduce infrastructure bottlenecks, and improve educational

www.iltaonleather.org JILTA SEPTEMBER, 2018 26
Article
outcomes. India’s per capita output growth will rise from 5.4% in FY18to 6% this year, 6.4% in FY20 and further to 6.8% by FY24. Incomeconvergence is projected to continue in China, India, and east Asia morebroadly, as well as in emerging Europe and parts of the Commonwealthof Independent States. The IMF said improvements to the monetarypolicy framework also appear to have lowered inflation expectations. Itsees consumer inflation at 5% this year and the next while the currentaccount deficit is seen at 2.3% of GDP this fiscal and 2.1% next fiscalagainst 2% in FY18.
Let us hope for the best to see a shining India.
References :
“Information About Maharashtra, Industries, Economy, Exports ofMaharashtra”. ibef.org. Retrieved 12 April 2014.
SUDALAIMUTHU, S.; RAJ, S.A. (2009). Logistics Management forInternational Business: Text and Cases. PHI Learning.ISBN 9788120337923.
“India”. International Monetary Fund. Retrieved 1 April 2018.
“Ministry of Statistics and Programme Implementation (MOSPI)”(PDF). Ministry of Statistics and Programme Implementation.Retrieved 2018-05-31.
“Sector-wise Contribution of GDP of India-Statistics.com”.StatisticsTimes.com. Retrieved 11 August 2017.
“CONSUMER PRICE INDEX NUMBERS ON BASE 2012 =100 FORRURAL, URBAN AND COMBINED FOR THE MONTH OF MARCH2018” (PDF). MINISTRY OF STATISTICS AND PROGRAMMEIMPLEMENTATION. Retrieved 12 March 2018.
“Weekly Statistical Supplement - Ratio and Rates”. Reserve Bank ofIndia. Retrieved 9 July 2018.
“Poverty headcount ratio at $1.90 a day (2011 PPP) (% ofpopulation)”. World Bank. 2011-01-01. Retrieved 8 June 2018.
“Income Gini coefficient”. United Nations Development Program.Retrieved 14 January 2017.
“Human Development Report 2016” (PDF). United NationsDevelopment Program. Retrieved 21 March 2017.

www.iltaonleather.org JILTA SEPTEMBER, 2018 27
News Corner
WEST BENGAL POLLUTION CONTROL BOARD MEETING WITHINDUSTRIAL STAKEHOLDERS
A meeting was convened by WBPCB on 22nd August 208 witha cross section of industrial stakeholders. The said meetingwas attended by Dr. Goutam Mukherjee, Hon’y Editor, JILTA onbehalf of ILTA. The meeting was presided by Sri SubhenduAdhikari, Hon’ble MiC, Department of Environment andTransport, Govt. of West Bengal. The meeting was co - chairedby Dr. Kalyan Rudra, Chairman, WBPCB. The Meetingcommenced with magnificent speech with by Dr. Rudra. Then,Sri Subhendu Adhikari, Hon’ble MiC explained the detailedactivities of the Government of West Bengal undertaken duringhis takeover of the charge of the department with the solemnblessings of Smt. Mamata Banerjee, Hon’ble Chief Minister, WestBengal. Many industries under the red and orange categorieswere cautioned by the MiC for non conformance of measurementof abatement of pollution. He also stressed for everyorganization to strictly adhere to the norms for expenditure ofCSR (2% of the profit). The meeting ended with nice open endedinteraction with the stakeholders present there.
ILTA does thank Sri Subrata Ghosh, Chief Engineer, WBPCB forinviting ILTA in such august occasion.
ILTA does pledge for all out support to the endeavours of theGovernment of West Bengal towards cleaner Bengal.
AN INTERACTIVE SESSION ON “ONE YEAR OF GST”
The Indo-Italian Chamber of Commerce & Industry (IICCI) -Eastern Region organized an interactive session on “One Yearof GST”: One Nation One Tax - Achievement & Challenges inassociation with ILPA (Indian Leather Products Association)and ILCPA (Indian Leather Chemical Promotion Association)on 24th August’ 2018 at 3.00 pm at the Seminar Hall of IndianLeather Products Association, Calcutta Leather Complex,Bantala, West Bengal – 743502.
After delivering the ‘Introductory speech’ by Ms. Jyoti Saha,Regional Manager, IICCI – ER, the ‘Welcome Address’ wasoffered by Mr. Pankaj Parekh, the Chairman of IICCI – ER. Mr.H.E. Damiano Francovigh, the Consul General of Italy in Kolkatathen delivered speech highlighting the positive and negativeimpact of India’s foreign trade especially with Italy afterimplementation of GST. Mr. B. D. Bhaiya, President of ILCPAthereafter delivered a lecture on ‘Impact of GST on overallindustry’ and Mr. Adhar Sahni, President, ILPA on ‘Impact ofGST on leather industry’.
Mr. Devendra Nagvenkar, Commissioner, Central GST & CentralExcise, Kolkata and the Chief Guest of the programmethenthrow a light as am overview on ‘One year of GST’.
The GST was then elaborated by Mr. Buswarup Das, Dy.Commissioner, and Mr. Partha Santra, Superintendant both fromCommercial tax Dept. and the Accounting Process of GST byMr. Indranil Mukherjee, Business Manager, Tally Solution Pvt.Ltd. through their PowerPoint presentations.
After a nice Interactive Session, the programme concluded withthe ‘Vote of Thanks’ offered by Mr. Ashok Aikat, Vice Chairman,IICCI – ER followed by a high tea.
FISH LEATHER INVOKES A SENSE OF FASHION AND PRIDEIN KENYA
Women sharpen their knives before setting about stinking pilesof fish skins, flesh and bones that cover the floor at an unusualartisanal tannery in Western Kenya.
Set up by a 39-year old industrial chemist named NewtonOwino, Alisom Products separates fish skins from the rest ofthe waste, then tans them to make a kind of leather used tomanufacture handbags, wallets, shoes and jackets.
Kisumu, on Lake Victoria, is a piscatorial place, a city wheregrilled tilapia and Nile perch are a ubiquitoes delicacy, and fromwhere cleaned fillets are exported around the region and theworld. But Mr Owino saw opportunity in the leftovers. Anestimated 1,50,000 tonnes of fish waste is produced everyyear and 80% of it is dumped. Mr Owino and his dozenemployees offer an alternative.
“My major business here is (to) turn fish skin into Leather,” hesays, pacing the yard in gumboots and a polo shirt. “(There are)plenty of raw materials that we have around here,” Fleets ofbicycle transporters bring sacks of skins from fishermen,restaurents and factories to his little facility every day.
There, workers strip the last pieces of rancid flesh from fly-covered skins and hang them to dry on wooden beams, likeclothes on a washing line. Hungry bird peck at his product.
The dried skins are stuffed inside a rusty hand cracked drumand drenched in an acidic herbal solution, based on local fruitssuch as papaya or avacodo, that tans them into fish leather.
News Corner
www.iltaonleather.org JILTA SEPTEMBER, 2018 28
“We now do what is called the drum turn,” said Mr Owino,putting his shoulder into spinning the contraption. What comesout is softer, darker and less smelly. The skin are then descaled,stretched and dried again, becoming workable leather.
Hand made products : Fella Atieno is a fish leather shoedesigner, making sandals, boots and other footwear. Everythingis done by hand only a pen, a pair of scissors, some glue and dye.
The result is distinctive products, with scale patternsreminiscent of crocodile or 5 snake skin, but at a fraction of theprice. Shoes sell for 1,500 shillings ($15.13 euros) and jacketsfor 2,000 shillings.
(Source : Hindu – 16/07/2018)
GOVT CANCELS EXPORT OF SHEEPS, GOATS TO UAE AFTERPROTEST
The government has cancelled the export of sheep and goatsto the United Arab Emirates (UAE) that was to begin from thecity airport from Saturday, following protests by the membersof Jain community.
The export project, an initiative of the Ministry of Commerceand Industry, was spearheaded by Rajya Sabha MP and dhangarcommunity leader Dr Vikas Mahatme. It was aimed at increasingthe income of farmers and open new avenues of self-employment.
The first consignment of a total 2,000 sheep and goats was tobe sent from the city’s Dr Babasaheb Ambedkar InternationalAirport yesterday afternoon.
Maharashtra Chief Minister Devendra Fadnavis and Unionminister Nitin Gadkari and others were scheduled to remainpresent on the occasion.
SMALL UNITS, BIG CONTRIBUTORS
TN has developed a vibrant MSME presence across several keyindustries
Micro, Small and Medium Enterprises (MSMEs) are thebackbone of any country, driving employment generation andGDP growth.
In India, MSMEs manufacture over 6,000 products andcontribute about 45 per cent to manufacturing and about 40
per cent to exports. This sector can help realize the NationalManufacturing Policy target of raising the share of the sectorin GDP from the current 16 per cent to 25 per cent by the endof 2022.
Tamil Nadu has a strong and vibrant MSME segment across all themajor industries, including textiles and garments, engineeringproducts, auto-anciliaries, leather products and plastics.
According to State government data, around 18 lakhentrepreneurs provide employment opportunities to about 114lakh persons with a total investment of Rs. 1,93,704 crore.
The state government has also anbnounced a slew of initiativesto reinvigorate MSMEs.
The most important Single Window Clearance Committee forthe sector, at www.easybusiness.tn.gov.in/msme, launched inMay this year.
Entrepreneurs planning to set up a unit can get licences/approvals from various departments via this single window.
These include the Directorate of Town and Country Planning,the Tamil Nadu Pollution Control Board and the Directorate ofInduatrial Safety and Health.
The second most important initiative of the State governmentto help MSMEs is the Business Facilitation Act / Rules, 2018.
This ensures the single point receipt of applications tosecure clearances required to establish or expand anenterprise, and in normal course of business, includingrenewals, in a time bound manner.
The Act also provides for an effective grievance redressmechanism and penalties in case the competent authority failsto act within a time frame..
Proactive steps
The Act covers 54 clearances, including pre-establishment, pre-operation, renewals and incentives. It provides for a three tierinstitutional structure – District MSME Single WindowCommittee, State MSME Single Window Committee and MSMEInvestment Promotion and Monitoring Board – to monitor andreview the progress of the single window mechanism.
www.iltaonleather.org JILTA SEPTEMBER, 2018 29
News Corner
At the Global Investors Meet in September 2015, an investmentof Rs. 16,532 crore by 10,073 MSMEs was announced. As onMarch 31, 2018, 5,358 enterprises that had signed MoUs hadcommenced production with an investment of Rs. 6,182.03crore, creating employment for 71,691 persons.
(Source : The Business Line, New Delhi – 31/07/2018)
HOW LEATHER DESIGNING IS GROWING BY LEAPS AND BOUNDS
A degree in Leather Designing can help students put theircreativity to use in the growing industry – [email protected]
With the demand for leather goods increasing at a global level,a specialized course in Leather Goods and AccessoriesDesigning is making students stand out in a creative world.Much against the misconception, Leather Designing is differentfrom Fashion Designing, and students who pursue the courseget training in making of leather accessories and garments.
“Students get a detailed insight of the industry that is nicheand has specific requirement of employees. Students makeregular visit to the tanneries to learn about different cuts,
functioning of machines and its components, computersoftware. This enhances their knowledge of leather and equipthem with digital knowledge,” says Abhishek, senior faculty atFDDI School of Leather Goods and Accessories Design, Noida.
The four year programme comprising of eight semesters isfocused on concept building in the area of leather goods andaccessories design and manufacturing technology. Studentsare offered specialization in Designing, Production andMerchandising. A third year student of FDDI, Noida, ShubangiSaxena, said, “I was always keen to pursue a career in a creativefield. In last three years, I have been trained to make differenttypes of bags, garments and belts, etc.”
After pursuing undergraduate or postgraduate course in LeatherDesigning, one can take up jobs as a production analyst,merchandiser, and designer and also work with internationallyknown brands such as Prada, Gucci and Zara provided one hasexceptional creativity and aesthetic sense.
(Source : Times of India, New Delhi – 30/07/2018)

Students Corner
www.iltaonleather.org JILTA SEPTEMBER, 2018 30
LESSON ON LEATHER GOODS – Part IX
Shome Nath GangulyFormer Principal of Karnataka Institute of Leather Technology
(The purpose of this ar ticle is to advise the students as well as artisans engaged in leather goods industr y.
Shri Puranjan Mazumder of FREYA helped me to prepare this ar ticle)
BUCKET BAG
The fashion industry constantly revisits history for new and moderninspirations. With vintage trends now turning modern, what’s could bebetter than studying design trends from the past to draw from theircreative genius ?
Let’s take a peek into the fascinating history of a practical and classictrend that’s simply known as The Bucket Bag.
According to craze, which we all understand is a complete authoritywhen it comes to fashion. The Bucket Bag trend started in the early1900’s. It appeared first as a simple drawstring pouch. Since the turn ofthe century, the bucket bag has seen three, even four, major waves ofinfluence. It was originally intended as a stylish, yet sturdy method fortransporting five bottles. Late in the 1980’s, the Bucket Bag appeared modelled in the iconicdesign that is still popular today. The bag was made with shiny patentcoral leather, along with an article titled “The Impact of Shine of Red andBlack.” In recent fashion news, Shine is still quite popular as is theimpact of red and black. Although it seems to be more popular in clothingand less so in handbags.
The fashion trend also explored the “naked leather” in the Bucket Bagstyle. Naked leather means full grain aniline finish leather. In another
Vogue spread from October 1993, we can see that the bucket bag stylewas created from a numerous of textiles and materials. It is interesting tosee vintage styles coming back again and again? Artificial fur and evensynthetic leather appeared again and again on the catwalks of the yearsfashion shows across the world.
Our leather bucket bag is come back in the modern era of fashion an ovalbase with a simple drawstring style is made from soft milled, full-grainleather is in a huge demand.
What is “milled” leather ?
Milled leather is full grain leather that has been slowly run in a drumwhile being exposed to heat which breaks down the fibers and softensthe complete hide at once. It also creates a stony kind of texture on theface of it. We use full grain leather for all of our bags, but this is one ofthe bag that uses milled leather.
Practical and Fashionable
Slip your arms through the straps and carry the bucket bag in a backpackstyle for a casual and practical hands-free look. Pull the leather drawstringthrough and swing it over your shoulder in a stylish cross body style. Thetwo narrow leather straps, when pulled evenly also slip over your arm for avintage, turned modern style that will always keep you looking stylish.

Article
www.iltaonleather.org JILTA SEPTEMBER, 2018 31
Consumer Preference for Locally
Made Shoes in Kolkata MarketDibyendu Bikash Datta1 & Sanjib Kumar Das2
1Associate Professor, Department of Fashion Management Studies2Associate Professor, Department of Fashion & Lifestyle Accessories
National Institute of Fashion Technology (Ministry of Textiles, Govt. of India)
Salt Lake City, Kolkata - 700 098
*Corresponding authors’ E-mail: [email protected]
Abstr act
A short walk in Kolkata’s ‘Juto bazaar’ known as Birshul haat at CITRoad, near Paddapukur in Kolkata can be overwhelming to one’s senses.Going to the haat helps in finding a treasure trove of stuff that is ratherunparalleled. The number of traders in the haat varies from 1,000 to1,200 and the transaction starts early in the morning at five. They areprimarily cobblers having small-scale manufacturing units at differentlocation in and around the city of Kolkata. The units are unorganised orinformal sector, neither registered nor provided with the social securityof any type. These are unincorporated private enterprise owned byindividuals or households engaged in the sale and purchase of goodsand services, operated on proprietary or partnership basis with less thanten total workers. The survival and growth of such firms depend on theirability to carve out their market niche through superior ability to cater tothe special needs of customers. Policies were targeted to encouragemodernization and consolidation that could help in reaping the benefitsof scale economies. In this backdrop, a study was conducted to understandthe consumer’s preference of the footwear in terms of quality, price, anddurability.
Keywords: customer, durability, performance, perception, pricing,quality.
Int roduct ion
Popularly known as ‘Juto bazaar’, at Padmapukur on CIT Road, is a rareflourishing haat (market) in the city. Colloquially known as Birshulhaat, is over a century old and once used to be known as Chamra haat(leather market). The market is unorganized yet very popular, at the sametime it provides opportunities to small-scale vendors. The market sellsfinished goods as well as raw materials for the production of manyfootwear and leather accessories. The market gives an opportunity to seeand feel various leather goods and provide hands-on experience forevery type of leather goods. After the shifting of the tanneries from eastKolkata to Bantala, the traders here quickly switched from leather tofinished products like shoes, chappals (slippers), bags, belts, wallet andraw materials. Birshul haat is not just the largest wholesale market for
shoes catering to retailers and individual buyers but also a shoe maker’sdelight for accessories and materials like leather, soles, adhesives, rexine,rubber, nails and cobbler tools.
The number of traders in the haat varies from 1,000 to 1,200. Theproducts are primarily taken from cobblers having their ownmanufacturing units concentrated near Janbazar, Kalabagan, AmherstStreet area, Hatibagan, Tantibagan, Phoolbagan, Narkeldanga, Rajabazar,Tangra, and Topsia areas. The geographical distribution of small units isrelated to product specialization, i.e., firms in Tantibagan and Phoolbaganmainly specialize in producing ladies and children footwear while othersproduce gent’s slippers. School footwear are procured from the smallfactories at Topsia. Shoes of branded companies like Titas, United,Paragon, Khadims, Elite, etc are also available in the market.
The market has lot to offer when it comes to footwear products. Handmadeladies product is the unique selling proposition of the market. The vendorsprocure these shoes, sandals from the middleman who purchases itfrom the companies directly, the shoes and sandals of those companiesare sold here at a very low price due to the minor defects in theseproducts. The market has a different segment for replicated products suchas Nike, Adidas, Puma, etc. which are purchased from Delhi or Agra.
The haat is located very near to some of the manufacturing localities andthe vendors generally handpick the products and bring them to the haatby paying a nominal transportation cost. The goods which are rejectedby the branded companies are bought into the haat by mini-trucks andthe cost of having such mini-trucks depends upon the location of themanufacturing units. The cost varies from 400 rupees to a maximum of1000 rupees. The mini-trucks can accommodate 300 pairs of shoes/sandals at a time.
Behind the innumerable shoe stalls, there is also a series of dingy houseswhere people are busy making a variety of shoes that are sold in themarket as well as supplied to various local footwear outlets and companies.
The vendors of the haat procure goods from the middlemen or cobblerson daily basis or an average of 2-3 days depending on the amount of

Article
www.iltaonleather.org JILTA SEPTEMBER, 2018 32
capital they have. If the purchase is made on a daily basis they pay thecost after selling the products, the accountability is given to the middlemenor the manufactures after the product is sold, if some of the productsremain unsold they are returned to the manufacturer/middlemen. Theaverage amount of shoes which the vendor purchase varies from 40-50pairs per day.
The vendors at this market do not store that much stock because they donot have proper stores, they sell in stalls that is why they do not keep thatmuch of stock in hand. They mainly procure stocks on a daily basis andsell it accordingly, but this is not the case during the main festivals ofKolkata. During the festival, the vendors generally have 15 days stock inhand and store them in a locally situated warehouse/godown near themarket. The warehouse facilities are arranged by the local union and areshared by the vendors.
The concentration of manufacturing footwear is mainly in Janbazar areaof Central Kolkata, where they set up their workplaces and it is herewhere they continue making excellent shoes, sometimes under persistentmarginalization, deprivation and usurious circumstances. Leather shoesare very prominent and require a skilled labour to realize the product.Much effort is required to produce a pair of leather shoes and is certainlya time taking process. With Postmodernism there is a shift in new materialsand processes and rise in individual shoe companies. The famed Chineseshoemakers, however, are conspicuous by their absence. Like atypical haat, the transaction starts early in the morning at five andcontinues till noon. Before the festivals like Durga Puja, Diwali, and Id,business hours extend to eight in the evening.
Birshul haat supplies to stores in the city and districts. Footwear is soldboth in bulk and retail. The haat mainly caters to the middle and lowermiddle classes. Shoes and slippers are sold at almost throwaway prices,making it a happy hunting ground for traders from the suburbs and far-flung districts. A pair of sandals can be picked up for anything betweenRs 40 and Rs 400, whereas a pair of shoes will cost between Rs 170 andRs 1200. Owners of small shoe-making units brush shoulders withindividual cobblers in this haat, hawking their wares. Many of the shoesthat are available in the haat can be found on e-commerce portals sellingunder some brand name and are mostly supplied by the traders from thismarket. (The Telegraph, 2018)
Indian footwear industry
For the Indian footwear to explode and deliver, favorable governmentpolicies, infrastructure, removal of high doses of taxation, infrastructuralsupport in capacity building, skill education and technology up gradation,brand building exercise should be initiated expeditiously no later than now.
India is the largest global producer of footwear after China, accountingto approx 13% of world footwear production, which is close to 16 billionpairs. This means that the average consumption globally is about 2-3pairs/person. India produces approximate 2,000 million pairs annuallyin different categories of footwear. India exports about 115 million pairs,thus nearly 95% of its produce meets its own domestic demand.
With an estimated global population of 7-8 billion, India constitutes ashare of approx 15%, which means 1.2 to 1.3 billion feet need to becovered from heat, cold, injuries, protection etc. Footwear sector is avery significant segment of leather and non-leather products in India.
Size of Indian domestic footwear industry is estimated to be worth 20-25,000 crores where leather and non-leather footwear per capitaconsumption is estimated to be approx 1.1 pairs. In addition to this,slippers (chappals) segment is close to 10000 crores with per capitaconsumption are estimated to be 1 pair.
Our immediate Asian neighbors reflect good per capita consumptionbetween 3-4 pairs, whereas the developed nations such as US, EU, UKetc. enviably enjoy a far better per capita of 7 to 8 pairs.
The challenge for Indian footwear industry is lit large but anticipatingIndia to become amongst top 5 Superpowers in 2030, our consumptionrates can reach as high as 7-8 Pairs. In such a scenario, India wouldneed to produce anywhere between 8-10 billion pairs consider yearlypopulation growth.
Consolidating mid-term status by 2020, the potential target for Indianfootwear industry will equalize consumption pattern of 3-4 pairs. Withsix/seven years to go, we need to scale our production from the currentlevel of 2 billion pairs to nearly 5 billion pairs at a compound annualgrowth rate (CAGR) rate of 30-40%.
Favorably for us, India ranks No.1 in milk production and we have thelargest resource of cattle population in the world. Additionally, on thestrength of raw material available domestically, the large pool of skilled andunskilled manpower, we have all the capability to take this challenge head-on.
Given this backdrop of homogeneous potential, it would not be anexaggeration to say that footwear sector is today, is on the engine ofincremental growth. With the global integration of Indian industry, rapidchange in lifestyle, income growth at bottom of the wealth pyramid,footwear industry is expected to grow leaps and bounds.
Sadly, overall industrial growth remains moderate and is struggling totake off due to lingering on infrastructural constraints. For the Indianfootwear to explode and deliver, favorable government policies,infrastructure, removal of high doses of taxation, infrastructural supportin capacity building, skill education and technology up gradation, brandbuilding exercise should be initiated expeditiously no later than now(Indian Footwear Industry, ET Retail, 2018).
Kolkata shoemaking cluster
Shoemaking is an important venture in Kolkata and has been establishedabout 200 years ago in Kolkata during British rule in India. A group oflandless farm labourers migrated from parts of Bihar to erstwhile Calcuttain West Bengal. Belonging to different religious groups, scheduled castecommunity, they were extremely poor, socially and economicallymarginalized. They brought with them two precious things – their

Article
www.iltaonleather.org JILTA SEPTEMBER, 2018 33
traditional craftsmanship in shoemaking and a common dream to succeedand establish themselves, both individually and as a group. Those inthis business are producing on a small scale as a result of lack ofgovernmental support and initial capital. Apart from these factors, thedomestic firms are competing with many leading brands of shoeproducers (Miranda, 2009) and these producers are changing the face ofcompetition in the country. As competition intensifies in the country, thedomestic producers of shoes will lose their market position to the leadingproducers. These producers are well resourced and equipped to competewith any producer and the market leader in the domestic market becomesa small competitor on a worldwide scale (Budzinski, 2008). Accordingto the production organisation, three layers of small units can be identified.Apart from the few independent units which sell their products in theirown brand names, the categories of small firms are as follows:
1. A few subcontracting units are linked with one or two reputed brandshaving high market shares such as Khadims, Sreeleathers, Elite,Elegant, Bata, Ford, and Dynasty. The raw material of specified qualityis supplied by the parent unit and the whole of the produce ispurchased. These industries ensured a process for manufacturingand quality maintenance.
2. Most of the small firms in the cluster produce slippers of differentdesigns and quality and supply them to two or three specific traders.In these cases, the small producer has to buy raw materials andsupply the final product to the trader.
3. There are units which do not maintain any fixed relationship with anytrader and sell goods of an inferior grade at Birshul haat or CollegeStreet market. The wholesalers purchase footwear directly from theproducer by paying cash.
Common Facility Centre for shoe making cluster
West Bengal Directorate of Small, Micro and Medium Industries,Government of West Bengal has decided to offer Rs 4.83 crore for buildinga Common Facility Centre (CFC) for Janbazar shoe making cluster inKolkata which will be executed by Entrepreneurship Development Instituteof India (EDII). EDII is a Ahmedabad based national resource institutefor entrepreneurship education, research, and training. The CFC willhave raw material bank, plant and machinery and is likely to be completedwithin two years time. The CFC will ideally facilitate the supply of rawmaterial at a relatively lower price by establishing marketing linkage,facilitate job work and provide support in many other ways. Further, theCFC will facilitate local cobblers to manufacture shoes under the SpecialPurpose Vehicle established under a common brand name. EDII’s skilldevelopment training programmes for artisans on establishing marketinglinkages, financial schemes, products and design development, qualitycertification and study on retail chain, will help the artisans to sustaintheir business and improve productivity.
Objectives of the study
The purpose of this research is to understand the consumer’s perceptionof attributes like quality, design, price, durability and brand name of thelocally made footwear product.
Literature review
The available literature relating to quality, design, durability, perception,and price was referred. According to Kotler et. al. (2005), customersatisfaction depends on the product’s perceived performance relative toa buyer’s expectations. If the product’s performance falls short ofexpectations, the customer is dissatisfied. If performance matchesexpectations, the customer is satisfied. If performance exceedsexpectations, the customer is highly satisfied and delighted (Mohamed& Yi, 2008).
Sales success requires offering the right product in the right place at theright time and for the right customer. The selection and buying ofproducts are very important for the customer and due to this one shouldbe meticulous when buying and selecting products (Ramaswamy andNamakumari, 2009). Keeping customers satisfied is the best competitiveadvantage over competitors. Customers are loyal, prepared to pay moreand are excellent external marketers. Exceeding the value offered bycompetitors is the key to marketing success. Customers decide uponpurchases on the judgments about the values offered by suppliers. Oncethe product is bought, customer satisfaction depends upon its perceivedperformance compared to the buyer’s expectations. Customer satisfactionoccurs when perceived performance matches or exceeds expectations.Expectations are formed through post-buying, experiences, anddiscussions with other people, and suppliers marketing activities.Companies need to avoid the mistake of setting customer expectationstoo high through exaggerated promotional claims since this can lead todissatisfaction if performance falls short of expectations. (Jobber andEllis-Chadwick, 2012). Before this advantage could be attained theorganization should assess the quality and other determinants thecustomers use to purchase products.
Percep tion
Perception is the way in which motivated individuals perceive a givensituation that determines precisely how they will behave. Individualsmay perceive the same product in different ways. Many consumersperceive that imported products are superior to the ones made in thecountry. Our beliefs and attitudes emerge from both experience and fromothers we come in contact with. Relatives, friends and colleagues’ exposureand experience could also influence the buying decision of any productand if they were happy, they will recommend the same to others and viceversa (Gilligan and Wilson, 2012). If the experiences on local productsare positive then it will influence the buying decision and vice versa.
Quality, design, and durability
Quality is defined as a zero error rate, i.e. the ability to produce a perfectproduct on the first try (Parasuraman et al., 1985). Crosby defines qualityas the producer’s ability to meet expectations (Crosby, 1979 quoted inParasuraman et al., 1985). Quality is defined as fitness for intended use,or how well the product performs its intended function (Evans andLindsay, 2013). This also means that any product that cannot perform itsfunction is inferior and should not be accepted by the consumer. Qualityis determined by the consumer of the shoes and not the firm. Customerswould even recommend others to the firm provided their shoes are of
Article
www.iltaonleather.org JILTA SEPTEMBER, 2018 34
high quality and also become loyal to the firm. If the customers are nothappy with the quality of the products they would spread bad informationto their friends, relatives, and colleagues and this, in the long run, willaffect the image of the firm.
The design is also used to describe a process. Pentagram, the notedBritish design firm, sees design as a planning and decision-makingprocess to determine the functions and characteristics of a finishedproduct, which they define as something one “can see, hold, or walkinto” (Gorb, 1978). The definition of design as given is:
The design is the process of seeking to optimize consumersatisfaction and company profitability through the creativeuse of major design elements (performance, quality, durability,appearance, and cost) in connection with products,environments, information, and corporate identities.
Thus, the objective of design is to create high satisfaction for the targetconsumers and profits for the enterprise. In order to succeed, thedesigners seek to blend creatively the major elements of the design mix,namely performance, quality, durability, appearance, and cost.
The designing of a shoe is an essential aspect of consumer buyingbehaviour. Poor design result in poor quality or higher costs and gooddesign can help to prevent defects and service errors and to reduce theneed for the non-value-added items on a product (Evans and Lindsay,2013). Before the manufacturers will come out with any design theyshould conduct research to find out from the customers what they wantand need and produce to suit the requirements of the customers.
Durability is the useful life of a product or the amount of use one getsfrom a product before it physically deteriorates (Evans and Lindsay,2013). Durability will be affected by the product’s performance and qualitycharacteristics. Consumers do not buy products for the fun of it but whatit can do for them and how long it can last. The firm should produce aproduct that can last for long for the consumers. The firm should createvalue for the consumer for producing a durable product for them. Manybuyers also want some degree of visual durability, in that the productdoesn’t start looking outdated long before its physical wear out.
Pric ing
Price help customers search for products that fall within certain priceranges (Bondari, 2010) and those that are not within the range areignored. Product pricing in a highly-competitive world has assumedunprecedented importance in the management of markets for firms’profitability, especially in the international markets where it is easy to getout-priced by a competitive company (Mathur, 2008). Consumers areincreasingly mobile and are looking for value for money and time beyondthe accepted benefits as it adds to prestige value of its buyers as well(Cook, 2008; Mathur, 2008). When consumers do not like the pricequoted for the shoes then the shoes would not be purchased and this willaffect the market share and the profitability of the firm and in the longlong-run, it will make the firm vulnerable to the competition. Competitiondemands that firms seek to satisfy consumers’ needs at lower prices andthis will enable the firm to achieve market superiority (Evans and Lindsay,
2013). This could then give the firm a competitive edge over thecompetitors. Apart from price, the firm could also use non-price variablessuch as guarantee, brand image, and easy usability to be ahead of thecompetition (Mathur, 2008). Price has a connotation with quality inKolkata, where high price means high quality and this is a perceptionheld by most of Kolkata.
Brand
The brand is an asset that contributes identity and character, guidesconsumers for product choices and forms the relations amongconsumers. The brand has several benefits for firms, consumers, andsociety. In terms of consumers, a brand is a quality indicator and createsawareness for products (Kapferer, 2008). In terms of firms, the brandprovides customer loyalty, consistent sales amount and a high-profitmargin (Kotler and Pfoertsch, 2006; Keller, 2001). Brand is a symbolicembodiment of all the information connected to the product and serviceto create associations and expectations around it and can deliver productattribute, benefits, value and personality (Kotler et. al., 2005),) so that, itcan help on developing positioning platform and help on developingdesired self-images to consumer. Brand Preference is the penchant ofthe consumer for one brand in relation to other brands of the sameproduct available in the market (Chaudhuri and Holbrook, 2001) whereasPurchase intention is the willingness of a consumer to buy a particularproduct (Dodd, et al., 1991).
Methodology
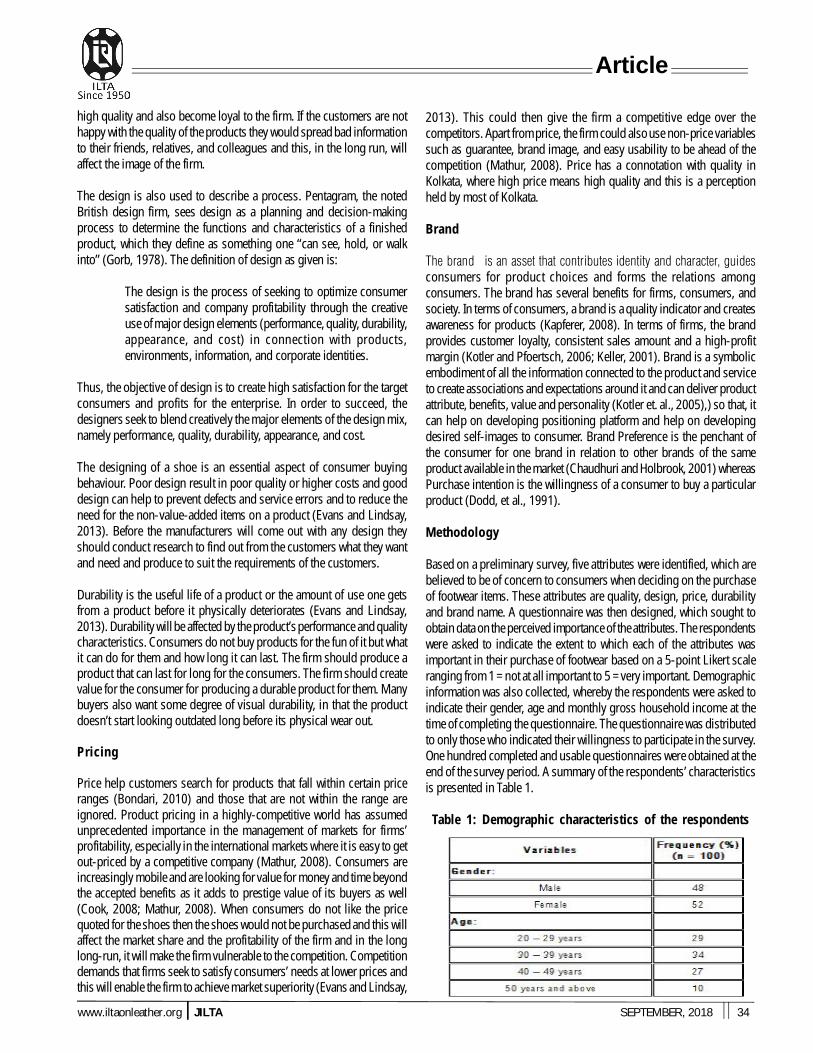
Based on a preliminary survey, five attributes were identified, which arebelieved to be of concern to consumers when deciding on the purchaseof footwear items. These attributes are quality, design, price, durabilityand brand name. A questionnaire was then designed, which sought toobtain data on the perceived importance of the attributes. The respondentswere asked to indicate the extent to which each of the attributes wasimportant in their purchase of footwear based on a 5-point Likert scaleranging from 1 = not at all important to 5 = very important. Demographicinformation was also collected, whereby the respondents were asked toindicate their gender, age and monthly gross household income at thetime of completing the questionnaire. The questionnaire was distributedto only those who indicated their willingness to participate in the survey.One hundred completed and usable questionnaires were obtained at theend of the survey period. A summary of the respondents’ characteristicsis presented in Table 1.
Table 1: Demographic characteristics of the respondents
Article
www.iltaonleather.org JILTA SEPTEMBER, 2018 35
Discussion of results
Relative importance of the attr ibutes
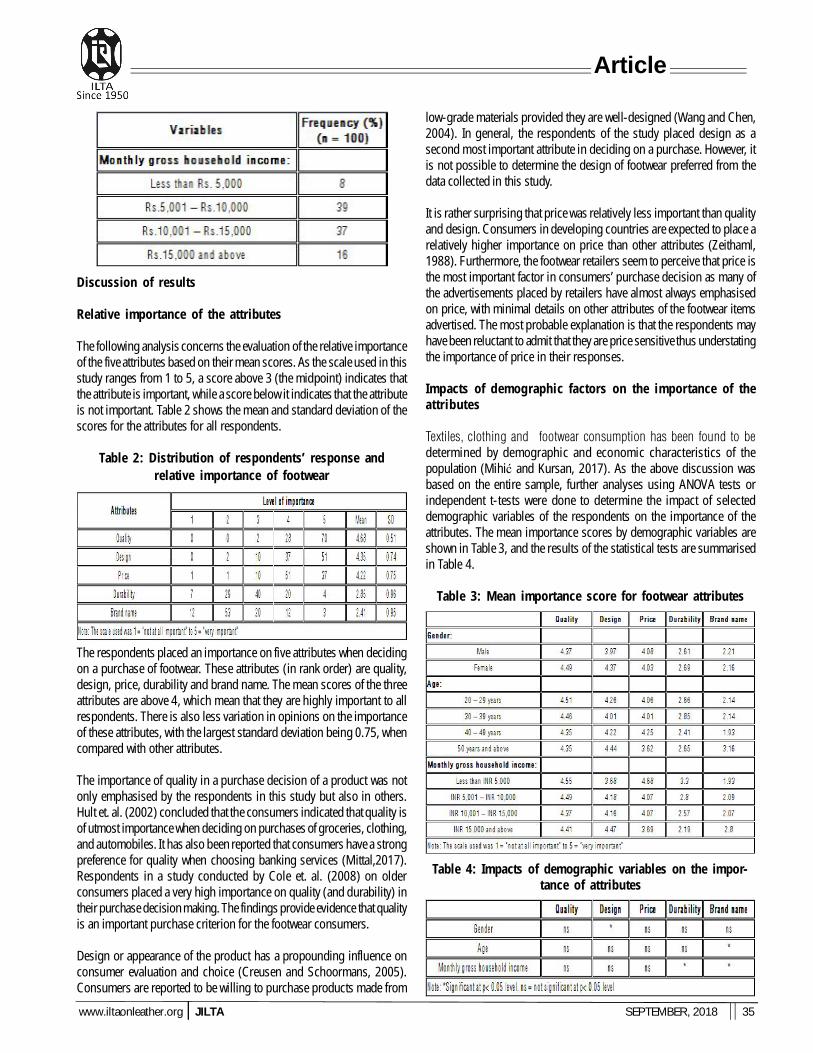
The following analysis concerns the evaluation of the relative importanceof the five attributes based on their mean scores. As the scale used in thisstudy ranges from 1 to 5, a score above 3 (the midpoint) indicates thatthe attribute is important, while a score below it indicates that the attributeis not important. Table 2 shows the mean and standard deviation of thescores for the attributes for all respondents.
Table 2: Distribution of respondents’ response andrelative importance of footwear
The respondents placed an importance on five attributes when decidingon a purchase of footwear. These attributes (in rank order) are quality,design, price, durability and brand name. The mean scores of the threeattributes are above 4, which mean that they are highly important to allrespondents. There is also less variation in opinions on the importanceof these attributes, with the largest standard deviation being 0.75, whencompared with other attributes.
The importance of quality in a purchase decision of a product was notonly emphasised by the respondents in this study but also in others.Hult et. al. (2002) concluded that the consumers indicated that quality isof utmost importance when deciding on purchases of groceries, clothing,and automobiles. It has also been reported that consumers have a strongpreference for quality when choosing banking services (Mittal,2017).Respondents in a study conducted by Cole et. al. (2008) on olderconsumers placed a very high importance on quality (and durability) intheir purchase decision making. The findings provide evidence that qualityis an important purchase criterion for the footwear consumers.
Design or appearance of the product has a propounding influence onconsumer evaluation and choice (Creusen and Schoormans, 2005).Consumers are reported to be willing to purchase products made from
low-grade materials provided they are well-designed (Wang and Chen,2004). In general, the respondents of the study placed design as asecond most important attribute in deciding on a purchase. However, itis not possible to determine the design of footwear preferred from thedata collected in this study.
It is rather surprising that price was relatively less important than qualityand design. Consumers in developing countries are expected to place arelatively higher importance on price than other attributes (Zeithaml,1988). Furthermore, the footwear retailers seem to perceive that price isthe most important factor in consumers’ purchase decision as many ofthe advertisements placed by retailers have almost always emphasisedon price, with minimal details on other attributes of the footwear itemsadvertised. The most probable explanation is that the respondents mayhave been reluctant to admit that they are price sensitive thus understatingthe importance of price in their responses.
Impacts of demographic factors on the impor tance of theat tr ibutes
Textiles, clothing and footwear consumption has been found to bedetermined by demographic and economic characteristics of thepopulation (Mihić and Kursan, 2017). As the above discussion wasbased on the entire sample, further analyses using ANOVA tests orindependent t-tests were done to determine the impact of selecteddemographic variables of the respondents on the importance of theattributes. The mean importance scores by demographic variables areshown in Table 3, and the results of the statistical tests are summarisedin Table 4.
Table 3: Mean importance score for footwear attr ibutes
Table 4: Impacts of demographic variables on the impor-tance of attributes
Article
www.iltaonleather.org JILTA SEPTEMBER, 2018 36
Gender:
The only significant impact of gender is on design. In general, womenplaced a significantly higher importance on the design of the footwearitem than men. Similarly, a study on older consumers showed that womenplaced higher importance on design than men (Gilleard and Higgs,2011). Women tend to place emphasis on design (in this case forappearance/style) when evaluating and choosing a variety of productsincluding footwear (Broega et.al., 2017) and design-related elementslike style, appearance, and colour for apparels (Williams, 2002).
Age:
Age of the respondents has significant impacts on the perceivedimportance of brand name. The respondents aged 50 years and above-perceived brand name as important criteria in their purchase decisionbut not for the others. Moschis (2003) tend to prefer hassle-free productsthat can be obtained by purchasing familiar or reputable brands or bypatronising a well-established or well-known retail outlet.
Household income:
Household income has significant impacts on the importance ofdurability, brand name. Generally, respondents in the lower income group(monthly gross household income of Rs.10,000 and less) placed asignificantly higher emphasis on durability. Those in the higher income(monthly gross income of Rs. 15,000 and more) are concerned aboutthe brand name in making footwear purchase decision. Consumers withhigher income have been reported to place a higher importance on thebrand name than lower income earners (Souiden et. al., 2011).
Conclusions
The study investigates the importance of various attributes in footwearpurchase decision. The survey revealed that quality, design, and price ofthe footwear matters to all consumers. There exist highly significantdifferences in perceived importance of the attributes by demographicvariables which are useful when promoting footwear to specific segmentsof the population. This study holds true only for the respondents fromKolkata with whom the study was carried out. The number of respondentswas limited and may not be representing the total population. Even so,this study may still be useful for footwear manufacturers and retailersfrom Kolkata. There are also opportunities for further research inunderstanding consumer preferences for footwear based on the findingsof this study. For example, while quality is important to the consumers,its meaning and measurement from the consumers’ perspective arerelatively unknown. The impact of a product’s durability on consumerpurchase decision also warrants further research. After a thoroughunderstanding of the needs and desires of the consumers, marketing offootwear to a very diverse market will be successful.
References :
[1]. Bondari, B. (2010). Wordpress 2.9 E-commerce: Build a ProficientOnline Store to Sell Products and Services. Packt Publishing Ltd.
[2]. Broega, A. C., Righetto, M., & Ribeiro, R. (2017). Female highheel shoes: a study of comfort. In IOP Conference Series: MaterialsScience and Engineering (Vol. 254, No. 23, p. 232001). IOPPublishing.
[3]. Budzinski, O. (2008). The governance of global competition:competence allocation in international competition policy. EdwardElgar Publishing.
[4]. Chaudhuri, A., & Holbrook, M. B. (2001). The chain of effectsfrom brand trust and brand affect to brand performance: the roleof brand loyalty. Journal of marketing, 65(2), 81-93.
[5]. Cole, C., Laurent, G., Drolet, A., Ebert, J., Gutchess, A., Lambert-Pandraud, R., ... & Peters, E. (2008). Decision making andbrand choice by older consumers. Marketing Letters, 19(3-4),355-365.
[6]. Cook, S. (2010). Customer care excellence: How to create aneffective customer focus. Kogan Page Publishers.
[7]. Creusen, M. E., & Schoormans, J. P. (2005). The different rolesof product appearance in consumer choice. Journal of productinnovation management, 22(1), 63-81.
[8]. Crosby, P. B. (1979). Quality is free: The art of making qualityfree. New York.
[9]. Dodds, W. B., Monroe, K. B., & Grewal, D. (1991). Effects ofprice, brand, and store information on buyers’ productevaluations. Journal of marketing research, 307-319.
[10]. Evans, J. R., & Lindsay, W. M. (2013). Managing for quality andperformance excellence. Cengage Learning. 16
[11]. Gilleard, C., & Higgs, P. (2011). Consumption and aging.In Handbook of sociology of aging (pp. 361-375). Springer,New York, NY.
[12]. Gilligan, C., & Wilson, R. M. (2012). Strategic marketingplanning. Routledge.
[13]. Gorb, P. (Ed.). (1978). Living By Design: The partners ofPentagram. Whitney Library of Design.
[14]. Hult, G. T. M., Keillor, B. D., & Hightower, R. (2000). Valuedproduct attributes in an emerging market: a comparison betweenFrench and Malaysian consumers. Journal of World Business,35(2), 206-220.
[15]. Indian Footwear Industry: A Perspective - Re-Tales by AdeshGupta | ET Retail. (2018). Retr ieved from https://retail.economictimes.indiatimes.com/re-tales/indian-footwear-industry-a-perspective/81. [Accessed on 19-06-2018]
[16]. Jobber, D., & Ellis-Chadwick, F. (2012). Principles and practiceof marketing (No. 7th). McGraw-Hill Higher Education.
Article
www.iltaonleather.org JILTA SEPTEMBER, 2018 37
[17]. Kapferer, J. (2008). The New Strategic Brand Management:Creating and Sustaining Brand Equity Long Term 4th edition(New Strategic Brand Management: Creating & Sustaining BrandEquity).
[18]. Keller, K. L. (2001). Building customer-based brand equity: Ablueprint for creating strong brands.
[19]. Kotler, P., Armstrong, G., Harris, L., & Piercy, N. (2005). Principlesof marketing. 4. European ed. Harlow: Financial Times.
[20]. Kotler, P., & Pfoertsch, W. (2006). B2B brand management.Springer Science & Business Media.
[21]. Lu Wang, C., & Xiong Chen, Z. (2004). Consumer ethnocentrismand willingness to buy domestic products in a developing countrysetting: testing moderating effects. Journal of ConsumerMarketing, 21(6), 391-400.
[22]. Mathur, U. C. (2008). International marketing management: textand cases. SAGE Publications India.
[23]. Mihiæ, M., & Kursan Milakoviæ, I. (2017). Examining shoppingenjoyment: personal factors, word of mouth and moderatingeffects of demographics. Economic Research-EkonomskaIstraživanja, 30(1), 1300-1317.
[24]. Miranda, J. A. (2009, January). Competing in fashion goods:Firms and industrial districts in the development of the Spanishshoe industry. In Business History Conference. Business andEconomic History On-line: Papers Presented at the BHC AnnualMeeting (Vol. 7, p. 1). Business History Conference.
[25]. Mittal, S., Pant, A., & Bhadauria, S. S. (2017). An Empirical
Study on Customer Preference towards Payment Banks overUniversal Banks in Delhi NCR. Procedia Computer Science, 122,463-470.
[26]. Mohamed, S., & Yi, T. P. (2008). Wooden Furniture PurchaseAttributes: A Malaysian Consumers’ Perspective. Pertanika J.Trop. Agric. Sci, 31(2), 197-203.
[27]. Moschis, G. P. (2003). Marketing to older adults: an updatedoverview of present knowledge and practice. Journal ofConsumer Marketing, 20(6), 516-525.
[28]. Parasuraman, A., Zeithaml, V. A., & Berry, L. L. (1985). Aconceptual model of service quality and its implications for futureresearch. The Journal of Marketing, 41-50.
[29]. Ramaswamy, V. S., and S. Namakumari. Marketing management:Global perspective, Indian context. Macmillan, 2009.
[30]. Souiden, N., M’Saad, B., & Pons, F. (2011). A cross-culturalanalysis of consumers’ conspicuous consumption of brandedfashion accessories. Journal of International ConsumerMarketing, 23(5), 329-343.
[31]. The Telegraph, Calcutta (Kolkata) Metro. A haat for the foot.(2018). Retrieved from https://www.telegraphindia.com/calcutta/story.jsp [Accessed on 19-06-2018]
[32]. Williams, T. G. (2002). Social class influences on purchaseevaluation criteria. Journal of consumer marketing, 19(3), 249-276.
[33]. Zeithaml, V. A. (1988). Consumer perceptions of price, quality,and value: a means-end model and synthesis of evidence. TheJournal of marketing, 20-22.
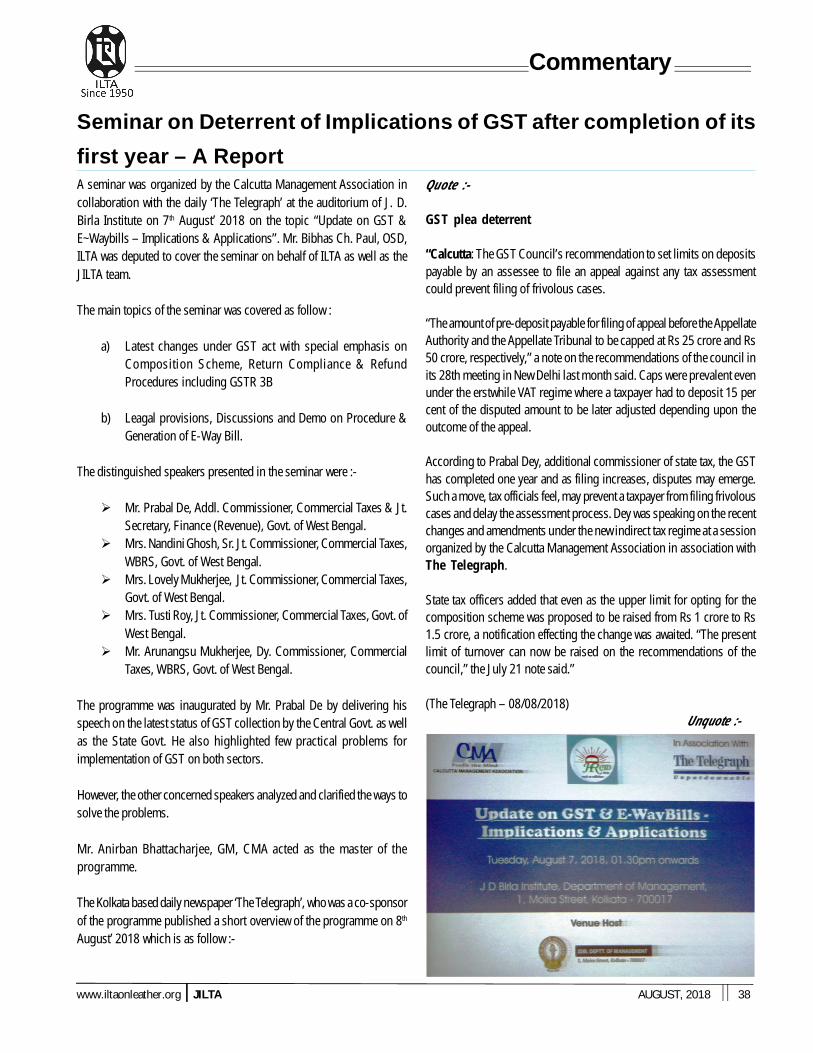
www.iltaonleather.org JILTA AUGUST, 2018 38
Commentary
Seminar on Deterrent of Implications of GST after completion of its
first year – A ReportA seminar was organized by the Calcutta Management Association incollaboration with the daily ‘The Telegraph’ at the auditorium of J. D.Birla Institute on 7 th August’ 2018 on the topic “Update on GST &E~Waybills – Implications & Applications”. Mr. Bibhas Ch. Paul, OSD,ILTA was deputed to cover the seminar on behalf of ILTA as well as theJILTA team.
The main topics of the seminar was covered as follow :
a) Latest changes under GST act with special emphasis onComposition Scheme, Return Compliance & RefundProcedures including GSTR 3B
b) Leagal provisions, Discussions and Demo on Procedure &Generation of E-Way Bill.
The distinguished speakers presented in the seminar were :-
Mr. Prabal De, Addl. Commissioner, Commercial Taxes & Jt.Secretary, Finance (Revenue), Govt. of West Bengal.
Mrs. Nandini Ghosh, Sr. Jt. Commissioner, Commercial Taxes,WBRS, Govt. of West Bengal.
Mrs. Lovely Mukherjee, Jt. Commissioner, Commercial Taxes,Govt. of West Bengal.
Mrs. Tusti Roy, Jt. Commissioner, Commercial Taxes, Govt. ofWest Bengal.
Mr. Arunangsu Mukherjee, Dy. Commissioner, CommercialTaxes, WBRS, Govt. of West Bengal.
The programme was inaugurated by Mr. Prabal De by delivering hisspeech on the latest status of GST collection by the Central Govt. as wellas the State Govt. He also highlighted few practical problems forimplementation of GST on both sectors.
However, the other concerned speakers analyzed and clarified the ways tosolve the problems.
Mr. Anirban Bhattacharjee, GM, CMA acted as the master of theprogramme.
The Kolkata based daily newspaper ‘The Telegraph’, who was a co-sponsorof the programme published a short overview of the programme on 8th
August’ 2018 which is as follow :-
Quote :-
GST plea deterrent
“Calcutta: The GST Council’s recommendation to set limits on depositspayable by an assessee to file an appeal against any tax assessmentcould prevent filing of frivolous cases.
“The amount of pre-deposit payable for filing of appeal before the AppellateAuthority and the Appellate Tribunal to be capped at Rs 25 crore and Rs50 crore, respectively,” a note on the recommendations of the council inits 28th meeting in New Delhi last month said. Caps were prevalent evenunder the erstwhile VAT regime where a taxpayer had to deposit 15 percent of the disputed amount to be later adjusted depending upon theoutcome of the appeal.
According to Prabal Dey, additional commissioner of state tax, the GSThas completed one year and as filing increases, disputes may emerge.Such a move, tax officials feel, may prevent a taxpayer from filing frivolouscases and delay the assessment process. Dey was speaking on the recentchanges and amendments under the new indirect tax regime at a sessionorganized by the Calcutta Management Association in association withThe Telegraph .
State tax officers added that even as the upper limit for opting for thecomposition scheme was proposed to be raised from Rs 1 crore to Rs1.5 crore, a notification effecting the change was awaited. “The presentlimit of turnover can now be raised on the recommendations of thecouncil,” the July 21 note said.”
(The Telegraph – 08/08/2018) Unquote :-

www.iltaonleather.org JILTA AUGUST, 2018 39
Commentary

Down Memory Lane
www.iltaonleather.org JILTA SEPTEMBER, 2018 40

Down Memory Lane
www.iltaonleather.org JILTA SEPTEMBER, 2018 41

Down Memory Lane
www.iltaonleather.org JILTA SEPTEMBER, 2018 42
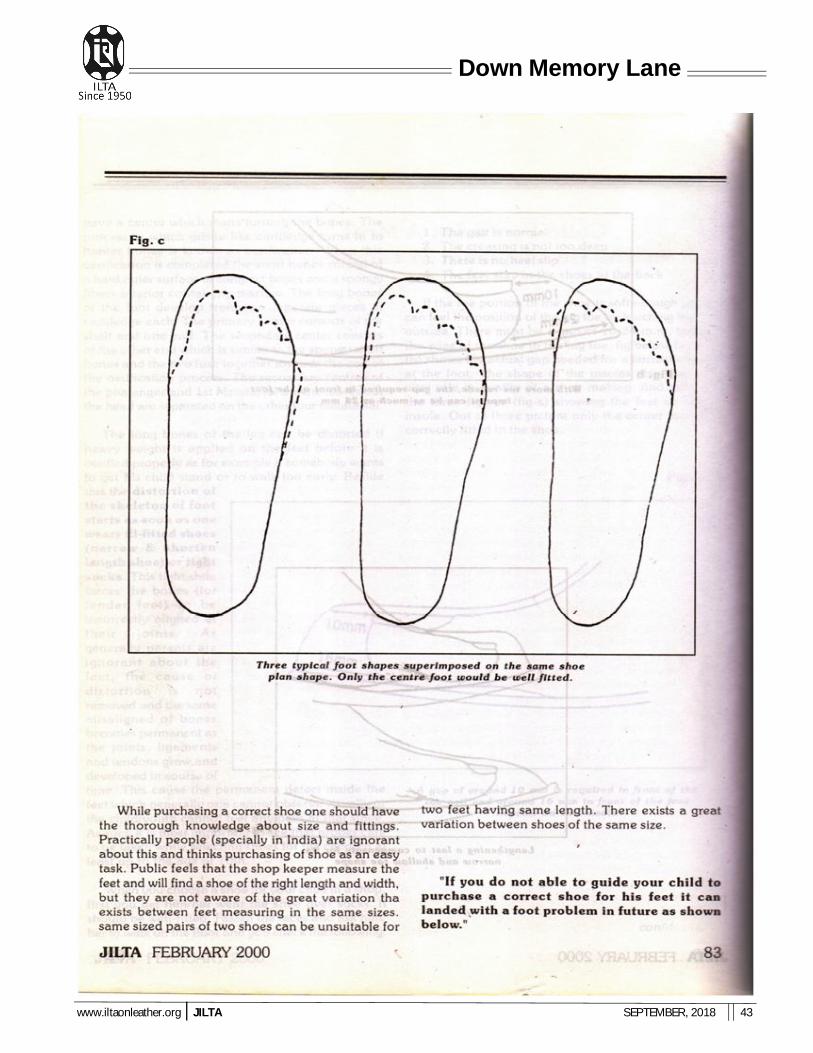
Down Memory Lane
www.iltaonleather.org JILTA SEPTEMBER, 2018 43

Down Memory Lane
www.iltaonleather.org JILTA SEPTEMBER, 2018 44

Down Memory Lane
www.iltaonleather.org JILTA SEPTEMBER, 2018 45

Down Memory Lane
www.iltaonleather.org JILTA SEPTEMBER, 2018 46

Down Memory Lane
www.iltaonleather.org JILTA SEPTEMBER, 2018 47
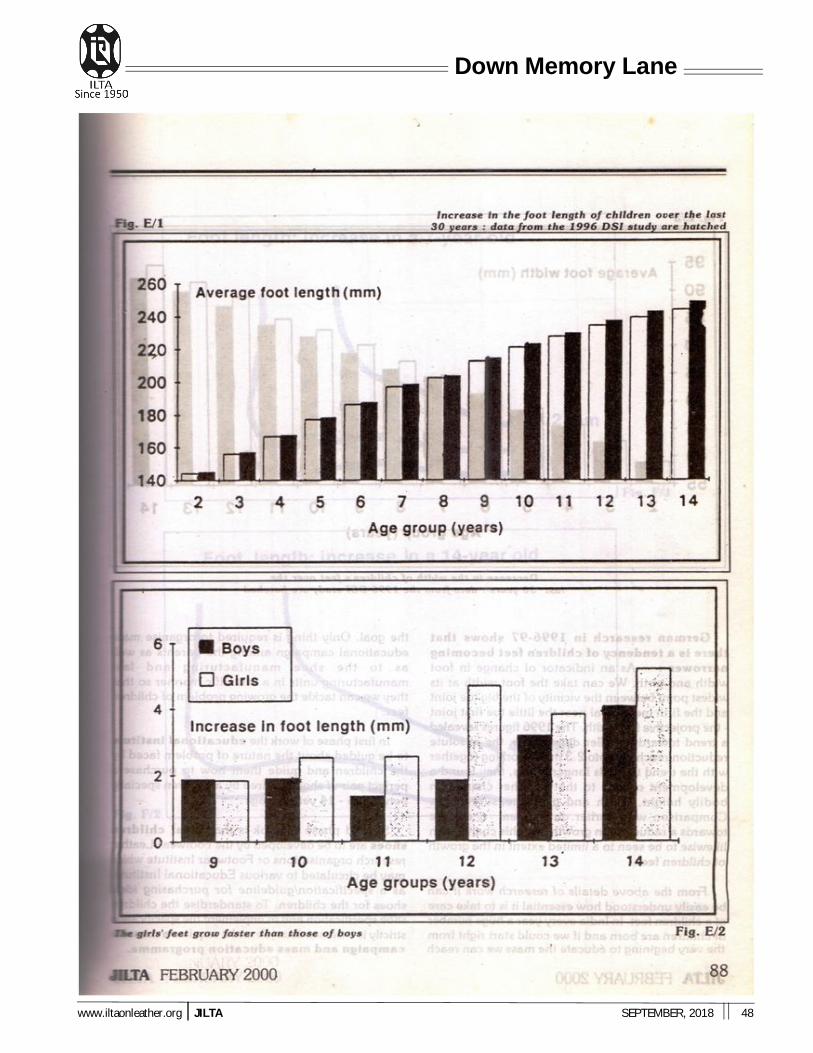
Down Memory Lane
www.iltaonleather.org JILTA SEPTEMBER, 2018 48

Down Memory Lane
www.iltaonleather.org JILTA SEPTEMBER, 2018 49

Down Memory Lane
www.iltaonleather.org JILTA SEPTEMBER, 2018 50

Economic Corner
www.iltaonleather.org JILTA SEPTEMBER, 2018 51
RETURN FILING: FAILED TO FILE YOUR INCOME TAXRETU RN BY AU GU ST, 31S T ? . . . HERE’S WH AT YOUCAN DO NOW.
If for any reason you haven’t filed your tax return yet, then there is noneed to worry. That is because all the doors are not closed. The chaos of31st August, 2018 has finally ended. All the taxpayers who have filedtheir income tax return by the due date must be considering themselvesas the most relaxed and blessed person of the world. However, if for anyreason you haven’t filed your tax return yet, then there is no need toworry. That is because all the doors are not closed. You can still file yourITR for AY2018-19 or FY2017-18. The only catch being that this willinvolve an extra cost. Here is what to do now, if you have failed to file theI-T return by 31st August.
File a Belated Return
Section 139(4) of the Income Tax Act allows an assessee to file an ITR ifhe/she has not filed it within the due date as prescribed under Section139(1), i.e. 31st July, 2018 (which got extended till 31st August, 2018).
“Such a tax return is called ‘belated return’ and it must be filed before theend of the relevant Assessment Year (AY) or before the completion ofassessment, whichever it earlier. For Financial Year 2017-18 (AY2018-19), a belated return should be filed before 31st March, 2019 orcompletion of assessment (u/s 144, if any), whichever is earlier,” saysCA Abhishek Soni, Founder, tax2win.in.
However, if you thought that filing a belated tax return would be a pieceof cake for you, then think again. Although filing belated returns isallowed by the Income Tax Act, but that can’t be done without paying anypenalty, interest, etc. These are discussed below:
Late Filing Fee u/s 234F
Section 234F has been the most-discussed topic of the Tax Season2017-18. More because it is becoming applicable for the first time fromFY 2017-18. As per this section, if ITR is not filed by the due date, then
you will have to pay a late filing fee of Rs 5,000 (if filed after 31st Aug butup to 31st Dec) and Rs 10,000 (if filed after 31st Dec). However, if yourtotal income does not exceed Rs 500,000 then late fee will be Rs 1000,irrespective of the filing date.
“It is, however, important to note that the applicability of this section isbased upon Gross Total Income (i.e. income before deductions) & thedetermination of the amount of fee is based upon Total Income (i.e.income after deductions). In simple words, if your GTI exceeds Rs 250,000(basic exemption limit), then Sec 234F will become applicable to you &the quantum of fees, i.e. Rs 1,000 or Rs 5,000/Rs 10,000 will dependupon your total income,” informs Soni.
You’ll, however, be required to determine & pay late filing fee beforefiling a belated return
Section 234A: Interest on Delay in ITR Filing
If you are filing a belated return, then you’ll be liable to pay interest u/s234A for filing ITR after the due date. This interest is levied @1% permonth on the tax liability & is calculated from the due date till the ITR isactually filed. This means, if tax liability is NIL, then you are not requiredto pay interest u/s 234A.
“For example, if your total income is Rs 250,000, which is up to thebasic exemption limit, then 234A interest will not be applicable. Further,if total income is up to Rs 300,000, then also no interest u/s 234A willbe applicable because of tax rebate of Rs 2,500 u/s 87A,” says Soni.Again, you will have to pay the interest amount first before filing abelated return.
Therefore, only if your total income exceeds Rs 300,000, interest @1%p.m. on total tax liability will be levied upon you. You are required to paythe fee u/s 234F for the return of FY 17-18.
(Business Standard - 31/08/2018)
INDIA’S FISCAL DEFICIT REACHES 86.5% OF FULL-YEARTARGET IN 4 MONTHS: RS. 5.4 TRILLION IN APR-JUL PERIOD

Economic Corner
www.iltaonleather.org JILTA SEPTEMBER, 2018 52
India reported on Friday a fiscal deficit of 5.4 trillion rupees ($76.12billion) for April-July, or 86.5 percent of the budgeted target for thecurrent fiscal year compared with 92.4 percent a year earlier.
India reported on Friday a fiscal deficit of 5.4 trillion rupees ($76.12billion) for April-July, or 86.5 percent of the budgeted target for thecurrent fiscal year compared with 92.4 percent a year earlier. Net taxreceipts in the first four months of 2018/19 fiscal year that ends in March2019 were 2.93 trillion rupees, government data showed. India expects totrim the deficit to 3.3 percent of GDP this fiscal year, after meeting an upwardlyrevised fiscal deficit target of 3.5 percent of GDP in 2017-18.
(Financial Express – 30/08/2018)
RUPEES FALLS 26 PAISE TO HIT RECORD LOW; BREACHES71-MARK FDOR FIRST TIME
Growing fears about rising inflation in amid high global crude oil pricesand consistent outflow of foreign funds from the domestic equity marketalso weighed on the domestic currency. The rupee on slumped by 26paise breach the historic low of 71 level for the first time against theUS currency due to firming crude oil prices and strong month-end demand from oil importers. At the Interbank Foreign Exchange(Forex) market, the local currency opened lower at 70.95 a dollar andslipped further to hit its lifetime low of 71 from its previous close of 70.74.
The rupee pared some of the losses to touch a day’s high of 70.85 butslumped in late trade to close at its lifetime trading low of 71.00, showinga loss of 26 paise or 0.37 per cent over the previous close. Forex dealerssaid besides robust month-end demand for theAmerican currency from oil importers, dollar’s strength against itsrival currencies on expectations of rising interest rates amid lingeringSino-US trade tensions, weighed on the domestic currency.
“The rupee has made a new record low of 71 today on the back ofrising crude oil prices in the international market. Emerging marketcurrencies are under pressure, this has also weighed on the rupee. Thedollar index continues to remain higher on expectations of aggressiveinterest rate hike by the Federal Reserve,” Rushabh Maru -Research Analyst, Anand Rathi Shares and Stock Brokers said.
On Thursday (30/08/2018) , the rupee slid further by 15 paise to closeat a fresh lifetime low of 70.74 to the dollar due to strong demand for thegreenback from oil importers and surging crude oil prices stokinginflation fears. Growing fears about rising inflation in amid highglobal crude oil prices and consistent outflow of foreign funds fromthe domestic equity market also weighed on the domestic currency.Benchmark Brent crude oil was at USD 78 a barrel in early Asian trade.
Meanwhile, both the key indices Sensex and Nifty recorded their sixthstraight week of gains by rising 393.27 points or 1.02 per cent, and123.40 points or 1.07 per cent, respectively. The rupee also fell againstthe pound sterling to finish slightly lower at Rs 92.12/14 per pound.
(Business Standard – 31/08/2018)
INDIAN ECONOMY GROWS 8.2% IN Q-1, HIGHEST IN15 QUARTERS
The previous high quarterly GDP growth was recorded in July-Septemberperiod in 2014-15 at 8.4%.
The Indian economy grew at 15-quarter high of 8.2% in the April-Junequarter of the current fiscal on good show by manufacturing and farmsectors, according to the government data released on Friday. Theprevious high quarterly GDP growth was recorded in July-Septemberperiod in 2014-15 at 8.4%.
The gross domestic product (GDP) at constant (2011-12) prices in thefirst quarter of 2018-19 is estimated at Rs 33.74 lakh crore, as againstRs 31.18 lakh crore in Q1 of 2017-18, showing a growth rate of 8.2%, aCentral Statistics Office statement said.
For the first three months of 2018, India reported a 7.7% annual growth.The world’s second-largest economy, China, reported a 6.7% growth forthe June quarter compared with 6.8% in March quarter.
India’s $2.597 trillion economy surpassed France’s in 2017 to be theworld’s sixth largest, and it was not far before the United Kingdom,according to World Bank data.
(The Hindustan Times – 30/08/2018)

Economic Corner
www.iltaonleather.org JILTA SEPTEMBER, 2018 53
WHAT ARE THE TAX EXAMPTION LIMITS FOR ALLOWANCES,REIMBURSEMENT PAID TO EMPLOYEE – FIND OUT
Many of the allowances, reimbursements paid to us as a part of salary areeither fully taxable or tax-exempt up to a certain limit but the tax exemptionis subject to certain conditions. This limit determines how much of theseallowances/reimbursements are taxable or otherwise in our hands.
Consequently, it is important to know these limits and the conditions attachedfor claiming tax exemption. Further, some allowances are fully taxable and itis important to know this too in order to calculate one’s tax properly.
Following is a list of some allowances and reimbursements which areoften paid to employees as part of salary along with which are fullytaxable, which are partially tax-exempt and the limits up to which theseare exempted from tax.
1. House Rent Allowance (HRA): If you are receiving HRA as partof your salary and also pay rent for residential accommodation then youcan claim the HRA paid to you as exempt from tax subject to certainlimits and restrictions. These are as follows:
Minimum of the following HRA is exempt from tax:
a. Actual HRA receivedb. 50% of annual salary* if living in metro cities or else 40%c. Excess of annual rent paid over 10% of annual salary*
*Salary here is considered as basic plus dearness allowance (if it formspart of retirement benefits) and commission received on the basis ofsales turnover.
However, if no rent is paid by you, then whole HRA received is taxable.
2. Dearness Allowance (DA): Dearness Allowance or DA is mostlyreceived by Government employees. However, it is fully taxable for everysalaried taxpayer irrespective of whether he/she is a government or non-government employee.
3. Transport Allowance: If receiving transport allowance fromemployer, a taxpayer can claim up to Rs 1600 per month or Rs 19,200per annum as exempt from tax before arriving at gross income chargeableto tax. In case of Blind, deaf and handicapped employees the exemptionlimit is Rs 3200 per month.
This allowance does not require you to submit bills to your employer forclaiming it. However, there is a caveat to this benefit. This exemption canonly be availed if no free conveyance is provided by the employer.
4. Leave Travel Allowance (LTA): Employees who receive LTAfrom their employers can claim exemption. An employee, here, can be anIndian or foreigner.
However, this exemption is subject to the following rules:
a. The exemption is available on 2 journeys in one block of 4 years.
b. The amount of exemption available is lower of the actualamount spent to reach the destination via shortest route or theamount received from the employer.
c. To claim exemption, the cost of reaching the destination canbe taken as A/C first class (for railways) or economy class ofnational carrier (for air travel).
d. Exemption is allowed only if actual expenditure hasbeen incurred for travelling anywhere in India.
5. Medical Reimbursement: Any reimbursement given by anemployer to his/her employee for any medical expenditure incurred forhimself/ herself or family can be claimed as exempt from tax up to Rs 15,000 annually. However, exemption is available only if you submit actualbills to your employer. Similarly, any medical insurance premium paidor reimbursed by the employer is not chargeable to tax. The premiumpaid comes under the overall limit of Rs 15,000 annually.
From FY 2018-19 onwards, standard deduction of Rs 40,000 has beenintroduced in lieu of transport allowance and medical reimbursements.
6. Fixed Medical Allowance: One should not confuse between theterms ‘medical allowance’ and ‘medical reimbursement’. Taxation of bothis different as per the Income Tax Act. Medical Allowance received by youis fully taxable whereas medical reimbursement mentioned above isexempted up to a certain exempt. However, you are not required tosubmit bills to claim medical allowance.
7. City Compensatory Allowance: This is one of the commoncomponents of salary structure. It is similar to DA as it is offered toemployees to compensate for high cost of living in cities. Just like DA, itis also fully taxable in an employee’s hands.
8. Special Allowance: Any Allowance received by an employeewhich does not fall under any other allowances head, is fully taxablein his/her hands.
9. Overtime Allowance: Some employers compensate for the overtimedone by their employees. This allowance is taxable in the employee’s hands.
10. Children Education Allowance: If you are receiving childreneducation allowance from your employer then you are eligible to claim atax exemption under the Income Tax Act. However, the maximum amountexempted is Rs. 100 per month or Rs. 1200 per annum for maximum ofup to 2 children. Along with this, you can also claim deductions for feespaid for your children under section 80C.
11. Hostel Expend i tu re A llowance: Similarly, any hostelexpenditure allowance received by you for your children from employeris eligible for exemption up to Rs. 300 per month or Rs. 3600 perannum for maximum up to 2 children.
(The Economic Times - 31/07/2018)

Economic Corner
www.iltaonleather.org JILTA SEPTEMBER, 2018 54
99.3% OF JUNKED RS. 500 & RS. 1000 NOTES RETURNEDTO BANK – RBI
Banks received Rs 15.31 lakh crore in term of 99.3 % of the Rs 15.41lakh crore worth Rs 500 and Rs 1,000 notes that were in circulation onNovember 8, 2016— the day when the note ban was announced, accordingto the RBI. Almost all the 500 and 1,000 currency notes that were madeillegal in November 2016 have returned to the banking system, the RBIsaid on 29th August, prompting the Opposition to question the efficacyof demonetization in curbing black money.
This means that just Rs 10,720 crore of the junked currency notes didnot return to the banking system. Initial estimates had pegged that aroundRs 3 lakh crore worth demonetized notes would not return to the systemas they might have been stashed away illegally to avoid tax.
The RBI, which has taken over two years to count the currency notes thatwere returned in the limited period window provided by the governmentto exchange or deposit the demonetized notes, said in its 2017-18 annualreport that the exercise is finally over. The government vehementlydefended the note ban decision, which sucked out 86 per cent of thecurrency in circulation, saying the move was not intended to confiscatemoney but to bring it into formal channels and tax them.
“I think demonetization has achieved its objective quite substantially,”Economic Affairs Secretary Subhash Chandra Garg told reporters inNew Delhi. On whether the objective of reducing black money wasachieved, he said, “yes.”
Former Finance Minister and senior Congress leader P Chidambaramwas quick to pounce on the data to attack the government saying everyrupee barring a small sum has come back to the RBI. “Remember whohad said that Rs 3 lakh crore will not come back and that will be a gain forthe government!?,” he tweeted.
He said he suspected that the bulk of the currency not returned may belying in Nepal and Bhutan, where Indian currency is acceptable, andsome that may have been lost or destroyed.
Stating that the country paid a huge price for demonetization, he said,“Indian economy lost 1.5 per cent of GDP in terms of growth. That alonewas a loss of Rs 2.25 lakh crore a year.” “Over 100 lives were lost. 15crore daily wage earners lost their livelihood for several weeks. Thousandsof SME units were shut down. Lakhs of jobs were destroyed,” he said in
another tweet. After November 8, 2016, the government provided a limitedperiod window to first exchange any cancelled currency notes inpossession and then deposit them in bank accounts.
Also, the junked currency notes were allowed to be used for buyingpetrol and diesel at petrol pumps, paying for hospital and electricity billsas well as bus fares on state road transport buses, among others.Thecurrency notes returned is a combination of deposits made in banks andnotes exchanged. Post-demonetization, RBI spent Rs 7,965 crore in 2016-17 on printing new Rs 500, Rs 2,000 and other denomination notes. Theamount stood at Rs 4,912 crore in 2017-18, according to the annual report.
The central bank — whose accounting year runs from July to June —had spent Rs 3,421 crore on printing currency notes in 2015-16. As aresult of higher expenses in printing new currency notes, the RBI’s profitas well as annual dividend payment were impacted. The apex banktransferred Rs 30,659 crore as dividend to the government in 2016-17and the amount was Rs 50,000 crore in 2017-18.It had spent Rs 3,421 crore on printing currency notes in 2015-16. Gargsought to justify the cost of printing saying it depends on the volume ofcurrency to be printed. The RBI said overall banknotes in circulationwere Rs 18.03 lakh crore as on March 2018, a growth of 9.9 per centover March 2016.
Post note ban, the value share of high denomination currencies — Rs 500and Rs 2,000 — in overall currency composition was 80.6 per cent, lowerthan 86.4 per cent in the pre-demonetization period. The figures indicate a5.8 per cent increase in use of small denomination currency notes.
After the note ban, junked notes — called Specified Bank Notes (SBNs)— were allowed to be deposited in banks and unusual deposits cameunder the scrutiny of the I-T Department.
The “humongous task” of processing and verification of SBNs wassuccessfully achieved, the RBI said. The SBNs received were verified,counted and processed in the sophisticated high speed currencyverification and processing system (CVPS) for accuracy and genuinenessand then shredded, it added. RBI said the processing of SBNs has beencompleted and that the “total SBNs returned from circulation is Rs15,310.73 billion”.
The government replaced old Rs 500 notes with new ones, but noreplacement for Rs 1,000 notes has been made. Instead, new Rs 2,000note was introduced post note ban.
-: J I L T A : -Owner: Indian Leather Technologis ts ’ Association, Publisher & Printer: Mr. S. D. Set, Published From :
‘Sanjoy Bhavan’, (3 rd floor), 44, Shanti Pally , Kasba, Kolkata - 700107, West Bengal, INDIA and Printed
From: M/s TAS Associate, 11, Priya Nath Dey Lane, Kolkata- 700036, West Bengal, INDIA