phytochemical content of melissa officinalis l. herbal
TRANSCRIPT
processes
Article
Phytochemical Content of Melissa officinalis L.Herbal Preparations Appropriate for Consumption
Vassiliki T. Papoti 1,2,*, Nikolaos Totomis 1, Aikaterini Atmatzidou 1, Kyriaki Zinoviadou 2,Anna Androulaki 3, Dimitris Petridis 1 and Christos Ritzoulis 1
1 Department of Food Technology, Alexander Technological Educational Institute of Thessaloniki,Thessaloniki GR-57400, Greece; [email protected] (N.T.); [email protected] (A.A.);[email protected] (D.P.); [email protected] (C.R.)
2 Department of Food Science & Technology, Perrotis College, American Farm School,Thessaloniki GR-57001, Greece; [email protected]
3 Aliment Lab, Water & Food Analysis-Consultants of Food/Beverage Industries, N. Plastira 3, Triandria,Thessaloniki GR-55337, Greece; [email protected]
* Correspondence: [email protected] or [email protected]; Tel.: +30-2310-492-826
Received: 18 January 2019; Accepted: 5 February 2019; Published: 12 February 2019
Abstract: Melissa Officinalis L. (MOL) domestic preparations appropriate for consumption werestudied by monitoring content in Na, K, Ca, Li, phenolic bioactives (total phenols, hydroxycinnamicacid derivatives and flavonols), and antioxidant activity (1,1-diphenyl-2-picrylhydrazyl radicalinhibition (DPPH) and ferric reducing ability (FRAP)). The effects of practice applied, materialto solvent ratio, time of preparation, and solvent were studied. MOL decoctions and infusions,commonly prepared at home, were better or of equal nutritional value to preparations uponultrasounds or maceration concerning the studied parameters. Aqueous MOL preparations werericher in total phenols (704–1949 mg per 250 mL) and the examined macroelements (1.1–2.9,30.5–288.4 and 50.1–176.1 mg Na, K and Ca per 250 mL, respectively) and showed better antioxidantactivity compared to ethanol counterparts. The 25% w/v hydroethanolic MOL preparations, suitablefor consumption, presented a significant content in phenolic antioxidants and in the examinedminerals, too. MOL infusions were significantly richer in total phenols with respective chamomileand olive leaf ones, comparatively examined. Overall acceptance scores of aqueous MOL preparationsindicated that bitterness has to be masked for efficient reception by the consumers.
Keywords: Melissa officinalis L.; infusions; decoctions; minerals; phenols; antioxidants
1. Introduction
The bioactivity of plants has been acknowledged worldwide throughout centuries; whereas lately,the interest in the beneficial power of nature has expanded. Scientists, consumers, food, pharmaceuticaland cosmetic industries embrace Hippocrates’ (Greek physician, 460–377 BC) strong belief about thehealing dynamic of natural sources. However, no matter that the bioactivity of numerous naturalproducts has been well proved, there is still the need to ensure their safety [1]. Plant formulationshave been reappraised, among others, as being of lower risk compared to synthetic counterparts. Sincethis is not always valid, materials that own a “safety passport” due to a history of safe use should bemore preferable for exploitation than others [1]. Cultivation of the latter could be seen as a profitablecommercial opportunity aiming at economic crisis outlets.
Melissa Officinalis L. (lemon balm or Melissa; MOL) is an edible perennial herb of the Lamiaceaefamily. Its name originates to the Greek words for bee (melissa) and honey (meli). There are worldwiderecords of its medicinal and culinary use [2–4] that date back to Dioscorides (father of pharmacology)times (40–90 A.D.) and which allow its safe exploitation [4–6].
Processes 2019, 7, 88; doi:10.3390/pr7020088 www.mdpi.com/journal/processes
Processes 2019, 7, 88 2 of 16
MOL is reputed in folk medicine for memory enhancing effects, promoting long life, actionagainst gastrointestinal disorders, rheumatism, Graves’, Alzheimer’s, thyroid diseases, flatulence,colic, anemia, nausea, vertigo, syncope, asthma, influenza, bronchitis, amenorrhea, cardiac disorders,epilepsy, insomnia, migraines, nervousness, malaise, depression, psychosis, hysteria, wounds [2,4–6].Literature continually confirms the medicinal effectiveness of MOL preparations, as well as itsantioxidant and other properties suggesting its use against anxiety disorders, digestive disturbancesand for prevention of oxidative stress-related diseases [6]. The bioactivity of its extracts is mainlyattributed, as for any other plant formulation, to the comprised phenolic acids, flavonoids andterpenoids. Qualitative and quantitative composition of MOL extracts depends on the inherentvariability of the material (e.g., origin, harvest time, phenological phase of development) andthe treatments (e.g., drying, extraction parameters) applied, as in any other natural source [7–9].Furthermore, MOL contains essential oils of high value [10].
The bioactivity of MOL extracts has been pointed out, whilst recent studies deal with optimizationof phytochemicals extraction from MOL [11,12]. Though, such practices are based on sophisticatedextraction means or/and comprise solvents inappropriate for consumption. Additionally, otherstudies report either on individual preparations, that contain higher quantities of the herb thanthose normally consumed or deal with other objectives [13–15]. Meanwhile, due to the inherentvariability of the material, differences in treatment and analysis conditions used, findings are difficultto compare. The innovation of the present study is the comparative examination of a wide array ofpreparations appropriate for consumption that may contribute to the daily intake of phytochemicalswith nutritional interest.
The objective of the present study concerns the appraisal of the bioactive potential of MOLpreparations as regards their content in total phenols, total hydroxycinnamic acid derivatives, totalflavonols, antioxidant activity, pigments and content in selected minerals (Na, K, Ca and Li). A numberof preparations easily made at home and usually consumed by general population (i.e., infusions,decoctions and macerates) are employed. In addition, extracts prepared upon ultrasounds are alsostudied due to the wide, advantageous (low cost, simplicity of use, short extraction times, highextraction yield, fast kinetics and recovery of thermolibile compounds) and efficient applicability ofthe latter in phytochemicals extraction [16]. Preparations of different material to solvent ratio, time andsolvent (water, ethanol, 25% hydroethanolic mixture) are examined. Additionally, representative MOLinfusions are examined in parallel with respective chamomile and olive leaf ones, known for theirbioactive potential [17,18]. Aqueous MOL preparations are also assessed for their overall acceptancefrom a 45-member panel.
2. Materials and Methods
2.1. Chemicals
Caffeic acid (98%, CAF) and Li2SO4 × H2O (99.1%) were purchased from Riedel deHaën (Seelze, Germany). Gallic acid (99.5%, GAL), quercetin (99%, QUER), DPPH• radical(1,1-diphenyl-2-picrylhydrazyl, 90%) and 2,4,6-tripyridyl-s-triazine (TPTZ), FeCl3 × 6H2O were fromSigma Chemical Co. (St. Louis, MO, USA). Folin-Ciocalteu reagent and Na2CO3 (99.8%) were fromPanreac Química (Barcelona, Spain). Potassium (K), High Performance Liquid Chromatography grademethanol (MeOH), NaCl, Span 60 and Tween 20 were from Merck (Darmstadt, Germany). Sodium (Na)and calcium (Ca) were from Polyscience (Niles, Illinois, USA). LiCl was from Sigma Aldrich (Berlin,Germany). All other common reagents and solvents were of the appropriate purity from varioussuppliers and the water used was deionized obtained by an ion-exchange resin system (ZALION 2000,IONEL, Athens, Greece) with a minimum resistance of 800,000 Ω/cm.
Processes 2019, 7, 88 3 of 16
2.2. Plant Materials
Melissa Officinalis L. (MOL) was donated in a dry form by Apivita Cosmetic Company(Athens, Greece); the sample was collected from an organic farm placed in Arkadia region(Tripoli, Greece). Chamomile (CHM) was purchased in a dry form from an open market in Thessaloniki,Greece. Olive leaf (OLF) sample used was a mixture of lyophilized leaves collected from various olivetrees grown in Thessaloniki, Greece.
2.3. Herbal Preparations
The studied extracts were prepared as described:
Decoction (D): A suitable amount of deionized water was boiled in a Duran bottle. Then, a suitableportion of MOL (2% w/v) was added and the mixture was further boiled for 5, 10 or 15 min (namely DMOL 2% 5’ W, D MOL 2% 10’ W, D MOL 2% 15’ W).Infusion A: A suitable amount of boiled deionized water was immediately transferred to a Duranbottle that contained an appropriate portion of the plant material (2% w/v of MOL, CHM or OLF;namely I(A) MOL 2% 10’ W, I(A) CHM 2% 10’ W, I(A) OLF 2% 10’ W). The mixture was left to stand atroom temperature for 10 min. 0.5% (I(A) MOL 0.5% 10’ W) and 4% w/v (I(A) MOL 4% 10’ W) MOLinfusions were also prepared in the same way.Infusion B: A Duran bottle containing an appropriate amount of deionized water was placed in a waterbath at 80 C. Then, a suitable portion of MOL (2% w/v) was added and the mixture was left to standfor 10 min (I(B) MOL 2% 10’ W).Macerate: A suitable amount of MOL (2% w/v) was macerated in water (M MOL 2% 24 h W), ethanol(M MOL 2% 24 h E) or aqueous ethanol (EtOH/H2O: 25/75 v/v; M MOL 2% 24 h E/W) for 24 h atroom temperature under periodical magnetic stirring.Extract by Ultrasounds: MOL (2% w/v) was treated in an ultrasonic bath (Elmas 30H Elmasonic, Elma,Singen, Germany; ultrasonic power effective 80 W, ultrasonic frequency 37 kHz) at room temperaturefor 10 min. Extraction solvent was water (S MOL 2% 10’ W), ethanol (S MOL 2% 10’ E) or aqueousethanol (EtOH/H2O: 25/75 v/v; S MOL 2% 10’ E/W)
Extracts were in each case prepared in triplicate and combined to a representative extract. Aliquotsof the representative extracts were used in the determination of minerals, total phenol and pigmentscontent. Another aliquot was brought up to dryness and used for the antioxidant activity studies,extraction yield determination and classification of bioactive compounds. Aqueous extracts werelyophilized in a freeze-dryer (Freeze dryer Gamma 1-20 LMC2, Christ, Osterode, Germany). Ethanolicextracts were evaporated to dryness by a rotary evaporator (Rotarvapor-R, Büchi, Flawil, Switzerland)under vacuum (at 60 C). Hydroethanolic extracts were initially evaporated by the rotary evaporatorto remove the ethanol fraction and then lyophilized to obtain freeze-dried extracts.
2.4. Content in Total Phenols (TP) Determined via the Folin-Ciocalteu Assay
Suitable aliquots of the extracts were transferred in a 10 mL volumetric flask and then, water(5 mL) and the Folin-Ciocalteu reagent (0.5 mL, Panreac Química, Barcelona, Spain) were added. After3 min, 1 mL of carboante sodium solution (35% w/v) was added and the solution was further dilutedwith water to 10 mL. One hour latter the absorbance was measured at 725 nm against a blank solutionwith the aid of a spectrophotometer (Heλioσ alpha and Beta, Thermo Scientific, London, England). TPcontent was expressed as mg CAF/250 mL extract through a CAF calibration curve. All determinationswere performed in triplicate at room temperature and data are given as the mean ± standard deviation.
2.5. Determination and Classification of Different Bioactive Phenolic Compounds
Determination of bioactive phenolic classes was carried out according to Obied et al. [19] withslight modifications. 0.5 mL of MOL extract (2 mg dry MOL extract/mL MeOH) was mixed with

Processes 2019, 7, 88 4 of 16
1 mL 0.1% HCl–ethanol solution and 8.5 mL 2% HCl–ethanol solution. The absorbance of the mixturewas measured after 30 min at 280, 320 and 360 nm to evaluate total phenols, hydroxycinnamic acidderivatives and flavonols, respectively. The relative standard curves were prepared using GAL(65–400 mg/L), CAF (50–400 mg/L), and QUER (55–460 mg/L) solutions in MeOH, respectively.Measurements were carried out in triplicate and data are given as the mean ± standard deviation.
2.6. Antioxidant Activity Determined via the DPPH• Assay
Assay employed for determination of extracts ability to scavenge the DPPH radical was basedon a protocol employed by Hatzidimitriou et al. [20]. Briefly, 2.9 mL of a DPPH• solution (0.1 mM inMeOH) was mixed with 0.1 mL of a methanolic extract (aliquot tested contained 15, 25, 35 or 50 µgdry MOL decoction). Moreover % DPPH• inhibition was also estimated on the same dry extractweight basis (aliquot tested contained 35 µg of dry extract) and on the same TP content basis (aliquottested contained 5 µg TP expressed as CAF) of herbal preparations. Standard solutions of CAF atconcentrations of 20–160 mg/L were also tested. The absorption at 516 nm (A516) was recorded atthe start of the reaction (t = 0) and after 30 min (t = 30). The results were expressed as % inhibition =[(A516 (t = 0) − A516 (t = 30)) × 100 / A516 (t = 0)], as well as CAF equivalents. All determinationswere performed in triplicate at room temperature and data are given as the mean ± standard deviation.IC50 value, the concentration able to scavenge the 50% of the DPPH radical, was also determined.
2.7. Antioxidant Activity Determined via the Ferric Reducing Ability (FRAP) Assay
The FRAP assay was carried out according to Benzie and Strain [21] with slight modificationsto determine the ferric reducing power capacity of the studied extracts. A mixture containing 3 mLof freshly prepared and prewarmed at 37 C FRAP reagent and 50 µL of MOL extract (2 mg dryextract/mL MeOH) was incubated at 37 C for 30 min and the absorbance was then recorded at 593 nm.The same was applied for CAF solutions (125–1000 mg/L) to construct a standard curve. The ferricreducing ability of the examined extracts was expressed as CAF equivalents. Measurements werecarried out in triplicate and data are given as the mean ± standard deviation. The FRAP reagentcontained 2.5 mL of a 10 mM TPTZ solution in 40 mM HCl (Sigma Chemical Co., St. Louis, MO, USA)and 2.5 mL of 20 mM FeCl3 × 6H2O (Sigma Chemical Co., St. Louis, MO, USA) and 25 mL of 0.3 Macetate buffer, pH 3.6.
2.8. Na, K, Ca and Li Content Determination via Emission Flame Photometry
The content of the extracts in Na, K, Ca and Li was determined with the aid of a single channelemission flame photometer (model PFP7 Jenway, Essex, UK) after selection of the appropriate opticalfilter for the element being assessed. In each set of measurements under the same experimentalconditions (fuel and air flow, sensitivity adjustments) along with the extracts, respective standardsolutions of known concentrations were also analysed. The concentration of examined extracts wasthen determined via the constructed calibration curves, depicting light emitted from the flame (directreading digital instrument) versus concentration of the respective standard. Measurement repeatabilitywas determined in every set of measurements and was always satisfactory (Coefficient of Variation <10%, n = 5).
2.9. Pigment Content
For the determination of the pigment content of selective aqueous preparations the equations ofLichtenthaler and Welburn [22] were employed. Absorbance values of diluted herbal preparations(1/80) were recorded at 470, 647 and 663 nm using a spectrophotometer and results for Chlorophyll a,Chlorophyll b and Carotenoid content are given as µg per extract mL. Results are the mean value oftwo independent measurements.
Processes 2019, 7, 88 5 of 16
2.10. Extraction Yield
Extracts were dried as described in herbal preparations section. The dried extracts were thenweighed, and the extraction yield was expressed as the weight (mg) of the crude extract contained in250 mL of each preparation. Results are the mean value of two independent measurements.
2.11. Sensory Evaluation
Selective aqueous MOL preparations were scored for overall acceptance by a non trained panelconsisting of 45 panelists using a 1–9 hedonic scale; 1: indicated extreme dislike, 2: great dislike, 3:moderate dislike, 4: slight dislike, 5: neither liking nor dislike, 6: slight liking, 7: moderate liking, 8:great liking, 9: extreme liking. A preliminary experiment was performed only for MOL infusions anddecoctions, when herbal preparations were served without the addition of honey. In the final trial 2%w/v honey was added in the tested samples (namely I(A) MOL 2% 10’ W, I(B) MOL 2% 10’ W, D MOL2% 10’ W, M MOL 2% 24 h W and S MOL 2% 10’ W) to overcome bitterness. Preparations were servedat room temperature.
2.12. Statistical Analysis
A principal component analysis (PCA) was used to detect potential relationship between mineralcontent of herbal preparations using MINITAB 16 software (Minitab, Inc., State College, PA, USA). Themean values for total phenols, total hydroxycinnamic acid derivatives, total flavonols and antioxidantactivity experiments were statistically compared based on one-way analysis of variance (ANOVA),followed by the multiple Duncan test (0.05 significance level) using PASW statistics 18.0 software(SPSS Inc., Chicago, IL, USA).
3. Results and Discussion
3.1. Content in TP, Hydroxycinnamic Acid Derivatives and Flavonols of Herbal Preparations
Appraisal of the phenol content of a plant material is amongst the most popular subjects of studyin favor of their health beneficial actions [23,24]. The TP content of the prepared herbal formulationswas assessed, and results are depicted in Figure 1.
Processes 2018, 6, x FOR PEER REVIEW 5 of 17
great liking, 9: extreme liking. A preliminary experiment was performed only for MOL infusions and decoctions, when herbal preparations were served without the addition of honey. In the final trial 2% w/v honey was added in the tested samples (namely I(A) MOL 2% 10' W, I(B) MOL 2% 10' W, D MOL 2% 10' W, M MOL 2% 24 h W and S MOL 2% 10' W) to overcome bitterness. Preparations were served at room temperature.
2.12. Statistical Analysis
A principal component analysis (PCA) was used to detect potential relationship between mineral content of herbal preparations using MINITAB 16 software (Minitab, Inc., State College, PA, USA). The mean values for total phenols, total hydroxycinnamic acid derivatives, total flavonols and antioxidant activity experiments were statistically compared based on one-way analysis of variance (ANOVA), followed by the multiple Duncan test (0.05 significance level) using PASW statistics 18.0 software (SPSS Inc., Chicago, IL, USA).
3. Results and Discussion
3.1. Content in TP, Hydroxycinnamic Acid Derivatives and Flavonols of Herbal Preparations
Appraisal of the phenol content of a plant material is amongst the most popular subjects of study in favor of their health beneficial actions [23,24]. The TP content of the prepared herbal formulations was assessed, and results are depicted in Figure 1.
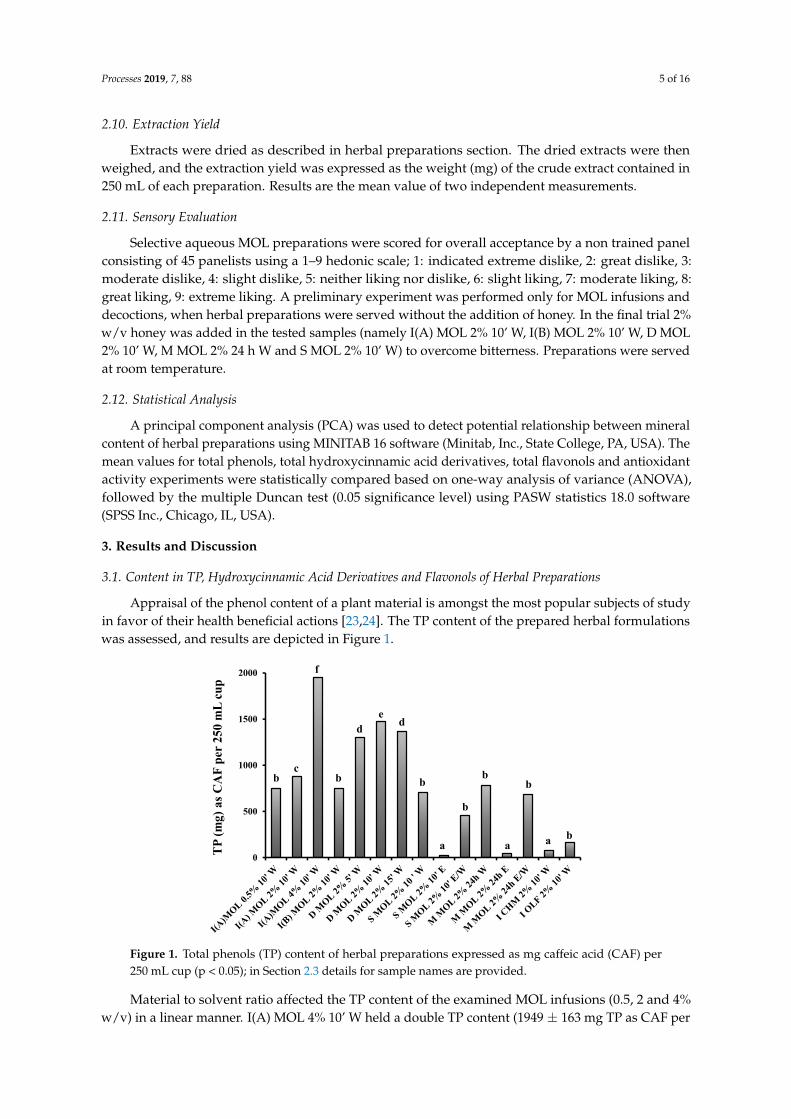
Figure 1. Total phenols (TP) content of herbal preparations expressed as mg caffeic acid (CAF) per 250 mL cup (p < 0.05); in section 2.3 details for sample names are provided.
Material to solvent ratio affected the TP content of the examined MOL infusions (0.5, 2 and 4% w/v) in a linear manner. I(A) MOL 4% 10΄ W held a double TP content (1949 ± 163 mg TP as CAF per 250 mL cup) in comparison to I(A) MOL 2% 10΄ W and I(A)MOL 0.5% 10΄ W. 2% MOL decoctions in comparison to the rest 2% MOL preparations possessed a richer content (1297‒1471 mg TP as CAF per 250 mL cup). Initially, TP slightly increased with prolonged time of decoction process (from 5 to 10 min), no further increase was noticed when time was further extended (at 15 min). Similar were the observations for MOL preparations studied by Sentkowska, et al. [25]. Apart from I(A) MOL 4% 10΄ W and MOL decoctions the rest aqueous MOL preparations had similar TP content.
0
500
1000
1500
2000
TP (m
g) a
s CA
F pe
r 250
mL
cup
bc
f
b
de
d
b
a
b
b
a a
b
b
Figure 1. Total phenols (TP) content of herbal preparations expressed as mg caffeic acid (CAF) per250 mL cup (p < 0.05); in Section 2.3 details for sample names are provided.
Material to solvent ratio affected the TP content of the examined MOL infusions (0.5, 2 and 4%w/v) in a linear manner. I(A) MOL 4% 10’ W held a double TP content (1949 ± 163 mg TP as CAF per
Processes 2019, 7, 88 6 of 16
250 mL cup) in comparison to I(A) MOL 2% 10’ W and I(A)MOL 0.5% 10’ W. 2% MOL decoctions incomparison to the rest 2% MOL preparations possessed a richer content (1297–1471 mg TP as CAFper 250 mL cup). Initially, TP slightly increased with prolonged time of decoction process (from 5 to10 min), no further increase was noticed when time was further extended (at 15 min). Similar were theobservations for MOL preparations studied by Sentkowska, et al. [25]. Apart from I(A) MOL 4% 10’ Wand MOL decoctions the rest aqueous MOL preparations had similar TP content.
The aqueous MOL preparations were followed by the hydroethanolic ones regarding phenol contentand that by the ethanol ones. The inferior performance of ethanol to extract phenolics from MOL wasexpected since it has been repeatedly published for MOL and other natural sources [12,26–29].
Additionally, MOL infusion when compared to CHM and OLF had a considerably higher(correspondingly ~11 and ~5 times more) TP content. MOL infusions studied by [8] also presentedhigher TP content than olive leaf ones. Considering that Folin Ciocalteu assay calibration curves forcaffeic and gallic acid are similar [30], findings of the present study were compared to literature andMOL preparations appeared remarkable TP sources [31]. Jiménez-Zamora et al. [32] also distinguishedthis material for its high TP content (1003 mg GAL/L) among 36 plants (6–1387 mg GAL/L).
Furthermore, the hydroethanolic MOL preparations of the present study have a richer TP contentin respect to similar natural preparations such as Salvia fruticosa, Origanum dictamnus L., Olea europaeaeL. and Citrus sinensis leaves [29]. Similarly, ethanol MOL extracts of the present study had 13800 (S OL2% 10’ E) and 15130 (M MOL 2% 24 h E) mg CAF per 100 g dry extract, when TP content of otherLamiaceae ethanol extracts vary among 5000–15,100 mg CAF per 100 g dry extract [33].
Values for MOL aqueous preparations of this study were higher to that reported byTriantaphyllou et al. [15] for a relevant MOL preparation (5% w/v infusion of 25 min: 0.13 gCAF/100 mL) and respective ones of Komes and coworkers (2011) [8] (1% w/v infusions of 5 and15 min: ~791 and 929 mg GAL/L, respectively) and Skotti et al. [34] (1% preparation of 15 min at85 C: 0.985mg CAF/mL, and ultrasounds at room temperature: 0.8 mg CAF/mL). Such differencesare expected, due to discrepancies in biotic, abiotic parameters and postharvest treatment of thematerial [7–9].
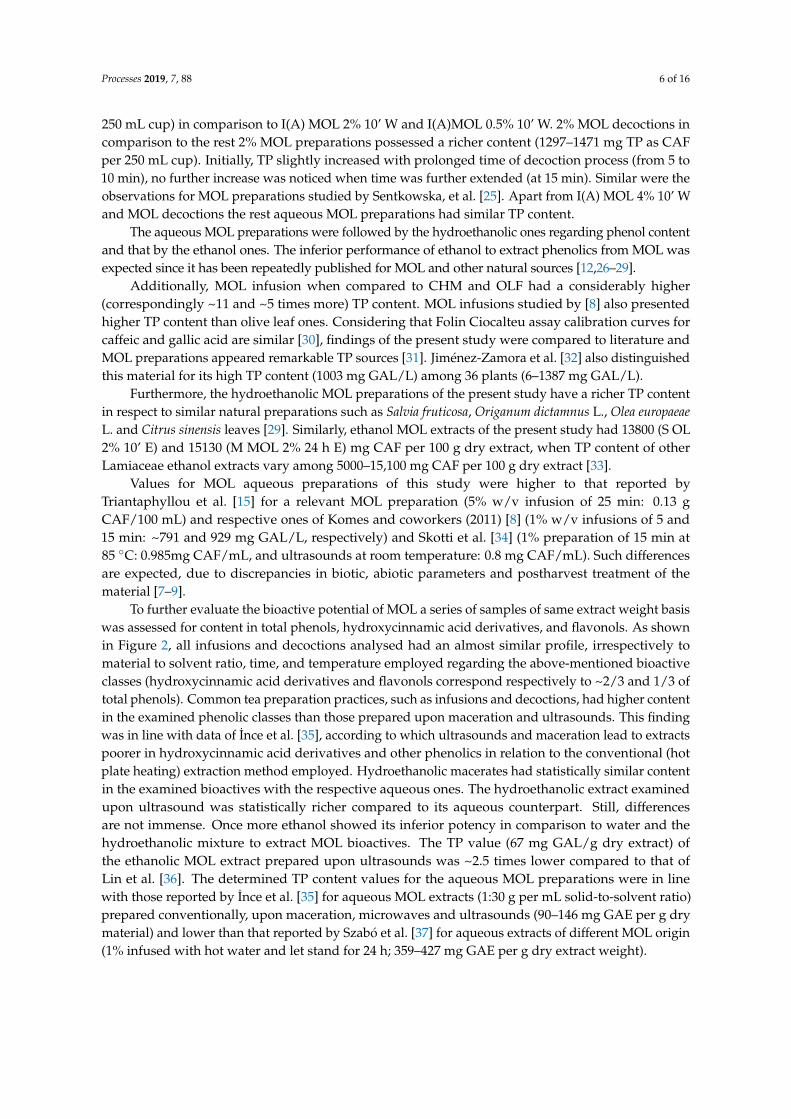
To further evaluate the bioactive potential of MOL a series of samples of same extract weight basiswas assessed for content in total phenols, hydroxycinnamic acid derivatives, and flavonols. As shownin Figure 2, all infusions and decoctions analysed had an almost similar profile, irrespectively tomaterial to solvent ratio, time, and temperature employed regarding the above-mentioned bioactiveclasses (hydroxycinnamic acid derivatives and flavonols correspond respectively to ~2/3 and 1/3 oftotal phenols). Common tea preparation practices, such as infusions and decoctions, had higher contentin the examined phenolic classes than those prepared upon maceration and ultrasounds. This findingwas in line with data of Ince et al. [35], according to which ultrasounds and maceration lead to extractspoorer in hydroxycinnamic acid derivatives and other phenolics in relation to the conventional (hotplate heating) extraction method employed. Hydroethanolic macerates had statistically similar contentin the examined bioactives with the respective aqueous ones. The hydroethanolic extract examinedupon ultrasound was statistically richer compared to its aqueous counterpart. Still, differencesare not immense. Once more ethanol showed its inferior potency in comparison to water and thehydroethanolic mixture to extract MOL bioactives. The TP value (67 mg GAL/g dry extract) ofthe ethanolic MOL extract prepared upon ultrasounds was ~2.5 times lower compared to that ofLin et al. [36]. The determined TP content values for the aqueous MOL preparations were in linewith those reported by Ince et al. [35] for aqueous MOL extracts (1:30 g per mL solid-to-solvent ratio)prepared conventionally, upon maceration, microwaves and ultrasounds (90–146 mg GAE per g drymaterial) and lower than that reported by Szabó et al. [37] for aqueous extracts of different MOL origin(1% infused with hot water and let stand for 24 h; 359–427 mg GAE per g dry extract weight).
Processes 2019, 7, 88 7 of 16
Processes 2018, 6, x FOR PEER REVIEW 7 of 17
Determination of the concentrations of the main individual phenolics could add some value to the evaluation of the effect of the extraction method on the phenolic dynamic of the herbal preparations. Still, this was beyond the scope of this study. The phenolic composition of MOL has been studied and is shown to bear qualitative similarities but quantitative variability in individual constituents according to many factors (e.g., nature, origin, postharvest treatment conditions of MOL) [25,26,35,39,40]. Since in plant materials levels of bioactive ingredients may vary significantly, individual phenolics cannot be easily considered suitable quality markers for final formulations, when content in TP and other phenolic classes, as well as antioxidant activity data can be [41,42].
The antioxidant activity of plant products has been widely accredited owning to its relation with treatment and prevention of diseases and disorders. Whereas, for safe antioxidant capacity evaluations more than one method based on different principles of action are needed [24,43,44]. Therefore, in order to assess the antioxidant activity of the studied extracts, the latter were examined for their ability to inhibit the DPPH radical (on the same TP and dry extract basis) and their ferric reducing power capacity (on the same dry extract basis) (Figures 2 and 3).
Figure 2. Total phenols, total hydroxycinnamic acid derivatives, total flavonols and ferric reducing ability (FRAP) of Melissa Officinalis L. (MOL) preparations of same extract weight basis.
Regarding results of DPPH findings on the same extract weight basis (Figure 3 a) it was shown that all aqueous and hydroethanolic preparations were potent radical scavengers. The inhibiting activity of the aqueous and hydroethanolic macerates and extracts upon ultrasounds presented statistically similar potency. Ethanol preparations showed a significantly lower activity in relation to the rest studied extracts. This was according to previous findings (Figures 1 and 2) as ethanol extracts were expected to contain significantly lower amounts of phenolic compounds. Our results were in line with those reported by others [26,45] that found aqueous MOL extracts to be more antioxidant potent than ethanol counterparts.
All infusions and decoctions (of same extract weight basis) assessed for their ferric reducing ability showed an almost equal capacity (Figure 2). These common tea preparation practices produce extracts of higher potency in relation to ones prepared upon ultrasounds or maceration. This was also observed from DPPH assay findings on same extract weight basis (Figure 3a). Aqueous and hydroethanolic macerates were equally potent, whereas the hydroethanolic extract of ultrasounds was slightly better than its aqueous counterpart. Ethanol preparation was shown to be significantly inferior to relevant aqueous and hydroethanolic ones. The moderate linear correlation (R2 = 0.621) between FRAP and DPPH assay (on same extract weight basis) findings implied that the antioxidant
Figure 2. Total phenols, total hydroxycinnamic acid derivatives, total flavonols and ferric reducingability (FRAP) of Melissa Officinalis L. (MOL) preparations of same extract weight basis.
The high content of aqueous and hydroalcoholic extracts in phenolic bioactive classes was relatedto matters of solvents polarity and other solubility matters of the individual constituents. The latterhas been well documented in literature for several natural sources and is associated with the nature ofthe material, nature (polarity and stereochemistry) of individual phenols, intermolecular forces amongphenols and extraction solvent, easier penetration of solvent to solvent matrix due to swelling effectdrawn by the presence of water among others [28,29,38]. According to Arceusz and Wesolowski [39]mixtures of ethanol with water are more effective for the extraction of phenolic acids from MOL.
Determination of the concentrations of the main individual phenolics could add some value to theevaluation of the effect of the extraction method on the phenolic dynamic of the herbal preparations.Still, this was beyond the scope of this study. The phenolic composition of MOL has been studied and isshown to bear qualitative similarities but quantitative variability in individual constituents accordingto many factors (e.g., nature, origin, postharvest treatment conditions of MOL) [25,26,35,39,40]. Sincein plant materials levels of bioactive ingredients may vary significantly, individual phenolics cannotbe easily considered suitable quality markers for final formulations, when content in TP and otherphenolic classes, as well as antioxidant activity data can be [41,42].
The antioxidant activity of plant products has been widely accredited owning to its relation withtreatment and prevention of diseases and disorders. Whereas, for safe antioxidant capacity evaluationsmore than one method based on different principles of action are needed [24,43,44]. Therefore, in orderto assess the antioxidant activity of the studied extracts, the latter were examined for their abilityto inhibit the DPPH radical (on the same TP and dry extract basis) and their ferric reducing powercapacity (on the same dry extract basis) (Figures 2 and 3).
Regarding results of DPPH findings on the same extract weight basis (Figure 3a) it was shown thatall aqueous and hydroethanolic preparations were potent radical scavengers. The inhibiting activityof the aqueous and hydroethanolic macerates and extracts upon ultrasounds presented statisticallysimilar potency. Ethanol preparations showed a significantly lower activity in relation to the reststudied extracts. This was according to previous findings (Figures 1 and 2) as ethanol extracts wereexpected to contain significantly lower amounts of phenolic compounds. Our results were in line withthose reported by others [26,45] that found aqueous MOL extracts to be more antioxidant potent thanethanol counterparts.

Processes 2019, 7, 88 8 of 16
Processes 2018, 6, x FOR PEER REVIEW 9 of 17
(a)
(b)
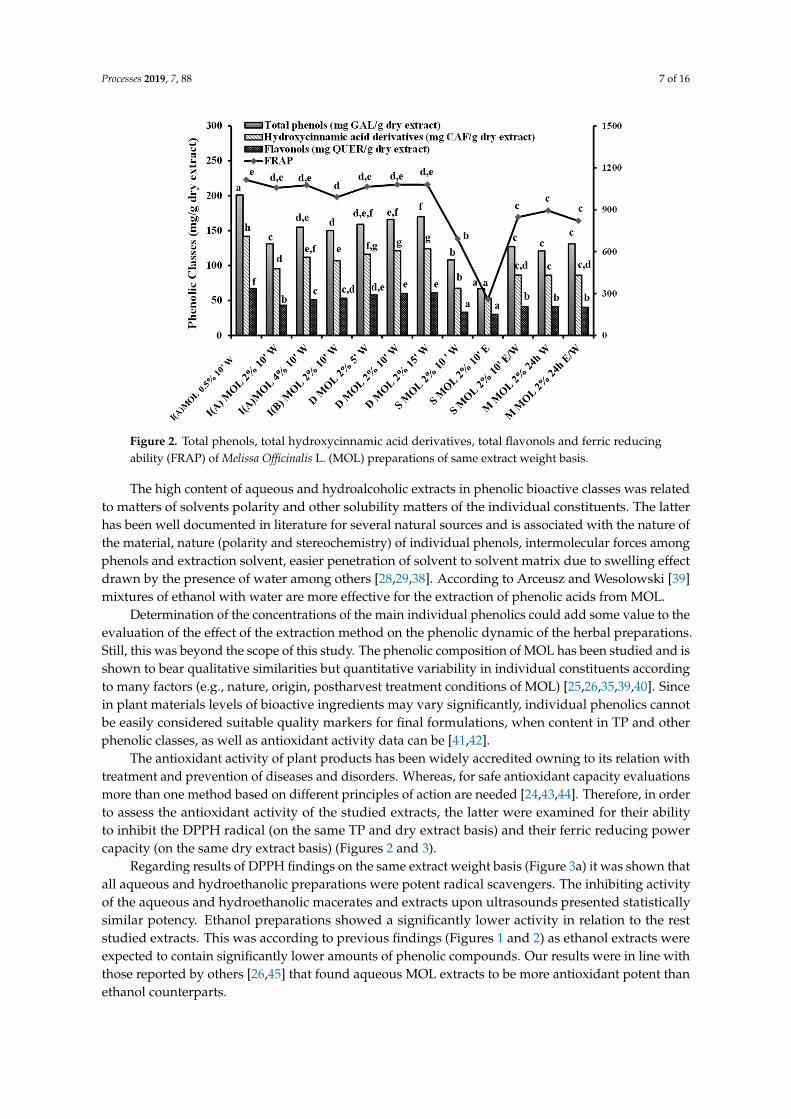
Figure 3. DPPH radical scavenging activity (expressed as %Inhibition and CAF μM equivalents) of MOL preparations. (a) same TP content basis; (b) same dry extract weight basis.
Additionally, increase of material to solvent ratio and time of decoction preparation led to no or slightly enhancement of the radical scavenging ability (Figure 3a,b) and ferric reducing capacity (Figure 2) of the studied preparations (infusions and decoctions respectively). The latter is in line to Komes et al. [8] that report prolongation of extraction time not to significantly affect the antioxidant activity of MOL extracts.
Figure 3. DPPH radical scavenging activity (expressed as %Inhibition and CAF µM equivalents) ofMOL preparations. (a) same TP content basis; (b) same dry extract weight basis.
All infusions and decoctions (of same extract weight basis) assessed for their ferric reducingability showed an almost equal capacity (Figure 2). These common tea preparation practices produceextracts of higher potency in relation to ones prepared upon ultrasounds or maceration. This wasalso observed from DPPH assay findings on same extract weight basis (Figure 3a). Aqueous andhydroethanolic macerates were equally potent, whereas the hydroethanolic extract of ultrasounds wasslightly better than its aqueous counterpart. Ethanol preparation was shown to be significantly inferior

Processes 2019, 7, 88 9 of 16
to relevant aqueous and hydroethanolic ones. The moderate linear correlation (R2 = 0.621) betweenFRAP and DPPH assay (on same extract weight basis) findings implied that the antioxidant activity asdetermined with the two assays could be not exclusively due to the action of the same phenolics.
On the other hand, DPPH radical scavenging activity data of same TP basis (Figure 3b) revealedinteresting information. The hydroethanolic preparations were now dominant in scavenging of theDPPH radical, followed by decoctions and I(B) MOL 2% 10’ W. The latter presented according toprevious findings a moderate profile and a low TP content, statistically similar to hydroethanolicpreparations (Figure 1). Moreover, ethanol preparations presented comparable capacity to respectiveaqueous ones. These data were in accordance to Papoti and Tsimidou [41] that presented naturalcompositional variability of olive leaf samples not to be reflected to DPPH• inhibition values on samephenol basis.
The above-mentioned observations could be related with almost equivalent contribution of most ofthe main phenolic constituents [42]. Additionally, synergistic effects among the individual componentsare not excluded. Moreover, the powerful antioxidants carnosic and gallic acids [28,43,46,47], as wellas the weaker scavengers of the DPPH radical oleanolic and ursolic acids [48], are expected to bebetter extracted with ethanol from the material. Additionally, hydroalcoholic mixtures are expectedto recover higher amounts of the main MOL constituents namely rosmarinic, caffeic, protocatehuic,vanillic and syringic acids. Moreover, rosmarinic and caffeic acid are known to be strong inhibitors ofthe DPPH radical, possessing better activity in comparison to cinnamic acids, protocatehuic and otherbenzoic acids [49,50] expected in such MOL preparations. Additionally, glucoside form phenols suchas luteolin 7-O-glucoside (respected to polar MOL extracts) [13] are also expected to be more efficientlyextracted from MOL with hydroalcoholic solvents due to solubility matters [51] and are dominantDPPH radical scavengers [42].
Additionally, increase of material to solvent ratio and time of decoction preparation led to noor slightly enhancement of the radical scavenging ability (Figure 3a,b) and ferric reducing capacity(Figure 2) of the studied preparations (infusions and decoctions respectively). The latter is in line toKomes et al. [8] that report prolongation of extraction time not to significantly affect the antioxidantactivity of MOL extracts.
Finally, the concentration of an aqueous MOL dry extract capable to inhibit 50% DPPH radicalformation (IC50 value) was found to be 309 µg dry MOL per extract mL, whereas for CAF 80 µg/mL.Considering that a cup (250 mL) of a 2% MOL infusion or decoction contains according to our findings~1700–3300 mg dry extract it can be safely said that its consumption may effectively contribute to dailyradical inhibitors intake.
The different conditions employed in the experimental parts of published antioxidant activitydata of MOL preparations do not allow direct comparisons [35,36,52–55]. Still, findings of the presentstudy, in line with literature, indicate that MOL preparations show significant antioxidant activity.
3.2. Mineral Content of Herbal Preparations
Minerals are known to influence human metabolism, affect general health and be linked tophysiological function of the human body and are therefore commonly examined in studies dealingwith herbal issues. In the present study the Na, K, Ca and Li content of the examined preparationswas determined, and data are presented in Table 1. To better elucidate the effect of variousherbal preparations on the mineral concentration a principal component analysis was employed(Table 2, Figure 4).

Processes 2019, 7, 88 10 of 16
Table 1. Na, K, Ca and Li content of herbal preparations expressed as mg per 250 mL cup and mg dryextract (n = 2) contained in 250mL cup (MOL: Melissa Officinalis L; CHM: Chamomile; OLF: Olive leaf).
Herbal Beverage(mg per 250 mL cup)
Naa Kb Cac Lid Dry Extract Weighte
I(A)MOL 0.5% 10’ W 1.1 30.5 50.1 0.1 455I(A) MOL 2% 10’ W 2.0 100.0 98.3 0.3 1707I(A)MOL 4% 10’ W 2.9 175.7 137.7 0.4 3377I(B) MOL 2% 10’ W 2.1 115.5 176.1 0.3 1742
D MOL 2% 5’ W 2.0 288.4 154.1 0.2 2856D MOL 2% 10’ W 2.8 263.0 153.4 0.3 3381D MOL 2% 15’ W 2.1 256.1 150.7 0.2 3185S MOL 2% 10’ W 1.9 117.4 93.7 0.2 1564S MOL 2% 10’ E 1.2 5.1 56.0 0.4 144
S MOL 2% 10’ E/W 2.7 125.0 101.1 0.2 1383M MOL 2% 24 h W 1.6 125.1 97.7 0.2 1609M MOL 2% 24 h E 0.8 4.1 65.0 0.4 283
M MOL 2% 24 h E/W 2.0 130.3 118.5 0.3 1730I CHM 2% 10’ W 15.0 103.6 108.2 0.3 1199I OLF 2% 10’ W 1.9 62.7 70.8 0.3 1524
a: Coefficient of Variance (CV) < 4%, b: CV < 6%, c: CV < 1%, d: CV < 2%, e: CV < 5%.
Table 2. Correlation coefficients between principal component analysis (PCA) axes 1 and 2 and themineral concentration of MOL herbal preparations.
Variable AXIS 1 AXIS 2
mg Ca per 250 mL 0.914 0.141mg Na per 250 mL 0.819 0.07mg K per 250 mL 0.809 −0.142mg Li per 250 mL −0.071 0.989
Variance 2.164 1.023Var% 54.1 25.6
Processes 2018, 6, x FOR PEER REVIEW 11 of 17
determined in the present study for 2% w/v MOL aqueous preparations were of the same size for K and Ca and higher for Na and Li to that of relevant MOL preparations examined by Özcan et. al. [56].
Data for MOL herbal treatments shown in Figure 4 imply that high values of Na, K and Ca are found in MOL decoctions and secondarily in I(B) MOL 2% 10΄ W, prepared at 80 °C. High temperature seems to enable the extraction of these macroelements from MOL. Concerning Ca this could be attributed to the fact that it is mainly accumulated into cells, making its extraction hard [57] and higher temperatures could enhance its release. The intense conditions employed in decoction process, as well as the long extraction process (24 h) of the M MOL 2% 24 h W enhanced K extraction. Potassium is considered a highly extractable element from herbs in favor to its chemical properties and its abundance outside plant cells [57].
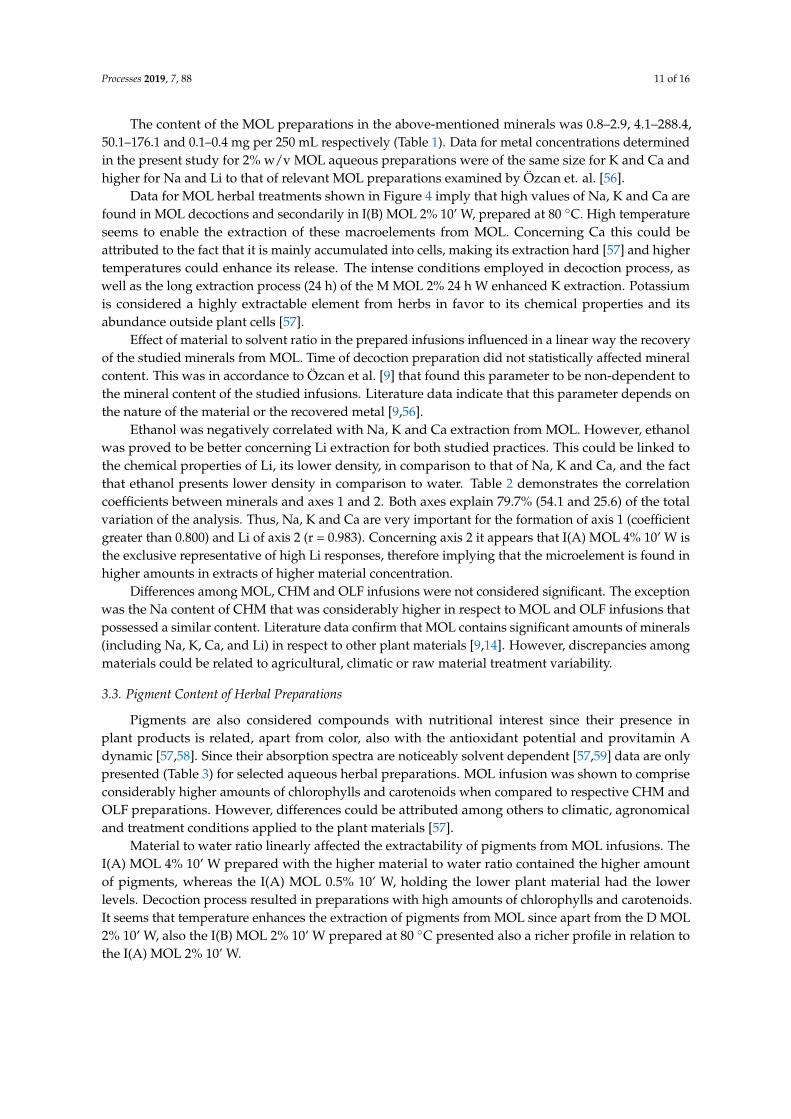
Figure 4. Arrangement of MOL herbal preparations according to the scores produced by the PCA technique based on Na, K, Ca and Li data. Table 2 shows the contribution of each of the four studied variables (Na, K, Ca, Li) with each axis.
Effect of material to solvent ratio in the prepared infusions influenced in a linear way the recovery of the studied minerals from MOL. Time of decoction preparation did not statistically affected mineral content. This was in accordance to Özcan et al. [9] that found this parameter to be non-dependent to the mineral content of the studied infusions. Literature data indicate that this parameter depends on the nature of the material or the recovered metal [9,56].
Ethanol was negatively correlated with Na, K and Ca extraction from MOL. However, ethanol was proved to be better concerning Li extraction for both studied practices. This could be linked to the chemical properties of Li, its lower density, in comparison to that of Na, K and Ca, and the fact that ethanol presents lower density in comparison to water. Table 2 demonstrates the correlation coefficients between minerals and axes 1 and 2. Both axes explain 79.7% (54.1 and 25.6) of the total variation of the analysis. Thus, Na, K and Ca are very important for the formation of axis 1 (coefficient greater than 0.800) and Li of axis 2 (r = 0.983). Concerning axis 2 it appears that I(A) MOL 4% 10΄ W is the exclusive representative of high Li responses, therefore implying that the microelement is found in higher amounts in extracts of higher material concentration.
Differences among MOL, CHM and OLF infusions were not considered significant. The exception was the Na content of CHM that was considerably higher in respect to MOL and OLF infusions that possessed a similar content. Literature data confirm that MOL contains significant amounts of minerals (including Na, K, Ca, and Li) in respect to other plant materials [9,14]. However, discrepancies among materials could be related to agricultural, climatic or raw material treatment variability.
Figure 4. Arrangement of MOL herbal preparations according to the scores produced by the PCAtechnique based on Na, K, Ca and Li data. Table 2 shows the contribution of each of the four studiedvariables (Na, K, Ca, Li) with each axis.
Processes 2019, 7, 88 11 of 16
The content of the MOL preparations in the above-mentioned minerals was 0.8–2.9, 4.1–288.4,50.1–176.1 and 0.1–0.4 mg per 250 mL respectively (Table 1). Data for metal concentrations determinedin the present study for 2% w/v MOL aqueous preparations were of the same size for K and Ca andhigher for Na and Li to that of relevant MOL preparations examined by Özcan et. al. [56].
Data for MOL herbal treatments shown in Figure 4 imply that high values of Na, K and Ca arefound in MOL decoctions and secondarily in I(B) MOL 2% 10’ W, prepared at 80 C. High temperatureseems to enable the extraction of these macroelements from MOL. Concerning Ca this could beattributed to the fact that it is mainly accumulated into cells, making its extraction hard [57] and highertemperatures could enhance its release. The intense conditions employed in decoction process, aswell as the long extraction process (24 h) of the M MOL 2% 24 h W enhanced K extraction. Potassiumis considered a highly extractable element from herbs in favor to its chemical properties and itsabundance outside plant cells [57].
Effect of material to solvent ratio in the prepared infusions influenced in a linear way the recoveryof the studied minerals from MOL. Time of decoction preparation did not statistically affected mineralcontent. This was in accordance to Özcan et al. [9] that found this parameter to be non-dependent tothe mineral content of the studied infusions. Literature data indicate that this parameter depends onthe nature of the material or the recovered metal [9,56].
Ethanol was negatively correlated with Na, K and Ca extraction from MOL. However, ethanolwas proved to be better concerning Li extraction for both studied practices. This could be linked tothe chemical properties of Li, its lower density, in comparison to that of Na, K and Ca, and the factthat ethanol presents lower density in comparison to water. Table 2 demonstrates the correlationcoefficients between minerals and axes 1 and 2. Both axes explain 79.7% (54.1 and 25.6) of the totalvariation of the analysis. Thus, Na, K and Ca are very important for the formation of axis 1 (coefficientgreater than 0.800) and Li of axis 2 (r = 0.983). Concerning axis 2 it appears that I(A) MOL 4% 10’ W isthe exclusive representative of high Li responses, therefore implying that the microelement is found inhigher amounts in extracts of higher material concentration.
Differences among MOL, CHM and OLF infusions were not considered significant. The exceptionwas the Na content of CHM that was considerably higher in respect to MOL and OLF infusions thatpossessed a similar content. Literature data confirm that MOL contains significant amounts of minerals(including Na, K, Ca, and Li) in respect to other plant materials [9,14]. However, discrepancies amongmaterials could be related to agricultural, climatic or raw material treatment variability.
3.3. Pigment Content of Herbal Preparations
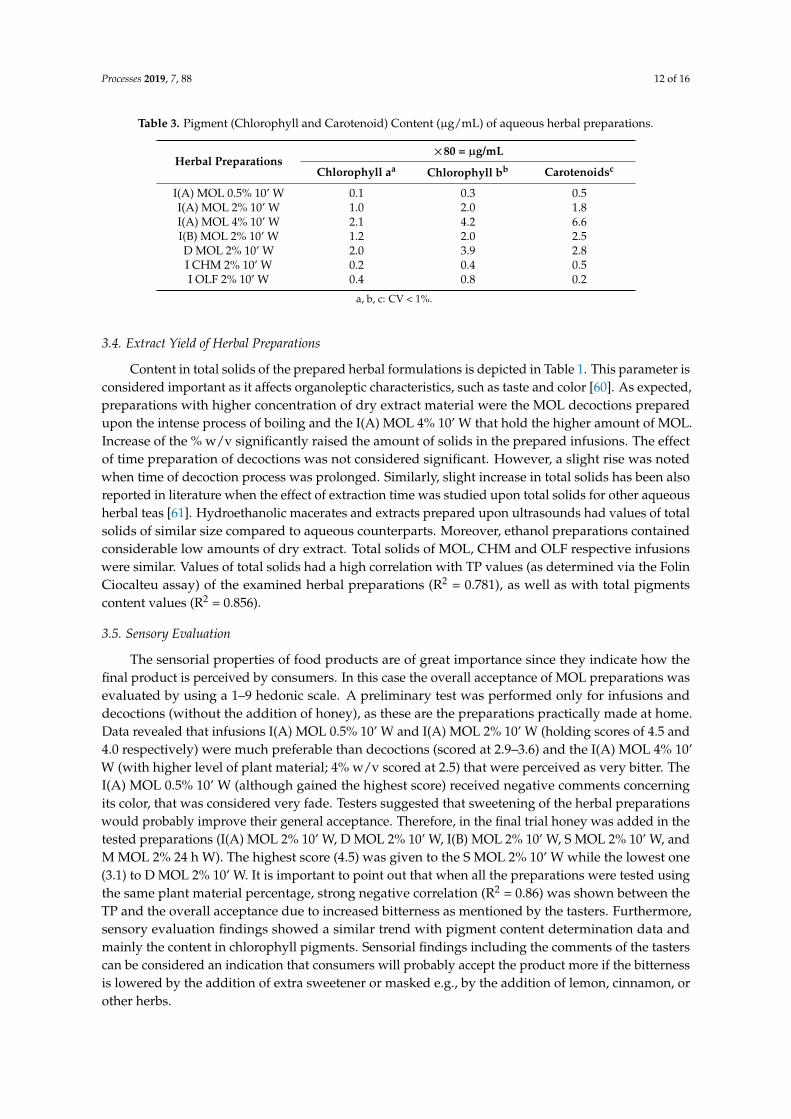
Pigments are also considered compounds with nutritional interest since their presence inplant products is related, apart from color, also with the antioxidant potential and provitamin Adynamic [57,58]. Since their absorption spectra are noticeably solvent dependent [57,59] data are onlypresented (Table 3) for selected aqueous herbal preparations. MOL infusion was shown to compriseconsiderably higher amounts of chlorophylls and carotenoids when compared to respective CHM andOLF preparations. However, differences could be attributed among others to climatic, agronomicaland treatment conditions applied to the plant materials [57].
Material to water ratio linearly affected the extractability of pigments from MOL infusions. TheI(A) MOL 4% 10’ W prepared with the higher material to water ratio contained the higher amountof pigments, whereas the I(A) MOL 0.5% 10’ W, holding the lower plant material had the lowerlevels. Decoction process resulted in preparations with high amounts of chlorophylls and carotenoids.It seems that temperature enhances the extraction of pigments from MOL since apart from the D MOL2% 10’ W, also the I(B) MOL 2% 10’ W prepared at 80 C presented also a richer profile in relation tothe I(A) MOL 2% 10’ W.
Processes 2019, 7, 88 12 of 16
Table 3. Pigment (Chlorophyll and Carotenoid) Content (µg/mL) of aqueous herbal preparations.
Herbal Preparations×80 = µg/mL
Chlorophyll aa Chlorophyll bb Carotenoidsc
I(A) MOL 0.5% 10’ W 0.1 0.3 0.5I(A) MOL 2% 10’ W 1.0 2.0 1.8I(A) MOL 4% 10’ W 2.1 4.2 6.6I(B) MOL 2% 10’ W 1.2 2.0 2.5D MOL 2% 10’ W 2.0 3.9 2.8I CHM 2% 10’ W 0.2 0.4 0.5I OLF 2% 10’ W 0.4 0.8 0.2
a, b, c: CV < 1%.
3.4. Extract Yield of Herbal Preparations
Content in total solids of the prepared herbal formulations is depicted in Table 1. This parameter isconsidered important as it affects organoleptic characteristics, such as taste and color [60]. As expected,preparations with higher concentration of dry extract material were the MOL decoctions preparedupon the intense process of boiling and the I(A) MOL 4% 10’ W that hold the higher amount of MOL.Increase of the % w/v significantly raised the amount of solids in the prepared infusions. The effectof time preparation of decoctions was not considered significant. However, a slight rise was notedwhen time of decoction process was prolonged. Similarly, slight increase in total solids has been alsoreported in literature when the effect of extraction time was studied upon total solids for other aqueousherbal teas [61]. Hydroethanolic macerates and extracts prepared upon ultrasounds had values of totalsolids of similar size compared to aqueous counterparts. Moreover, ethanol preparations containedconsiderable low amounts of dry extract. Total solids of MOL, CHM and OLF respective infusionswere similar. Values of total solids had a high correlation with TP values (as determined via the FolinCiocalteu assay) of the examined herbal preparations (R2 = 0.781), as well as with total pigmentscontent values (R2 = 0.856).
3.5. Sensory Evaluation
The sensorial properties of food products are of great importance since they indicate how thefinal product is perceived by consumers. In this case the overall acceptance of MOL preparations wasevaluated by using a 1–9 hedonic scale. A preliminary test was performed only for infusions anddecoctions (without the addition of honey), as these are the preparations practically made at home.Data revealed that infusions I(A) MOL 0.5% 10’ W and I(A) MOL 2% 10’ W (holding scores of 4.5 and4.0 respectively) were much preferable than decoctions (scored at 2.9–3.6) and the I(A) MOL 4% 10’W (with higher level of plant material; 4% w/v scored at 2.5) that were perceived as very bitter. TheI(A) MOL 0.5% 10’ W (although gained the highest score) received negative comments concerningits color, that was considered very fade. Testers suggested that sweetening of the herbal preparationswould probably improve their general acceptance. Therefore, in the final trial honey was added in thetested preparations (I(A) MOL 2% 10’ W, D MOL 2% 10’ W, I(B) MOL 2% 10’ W, S MOL 2% 10’ W, andM MOL 2% 24 h W). The highest score (4.5) was given to the S MOL 2% 10’ W while the lowest one(3.1) to D MOL 2% 10’ W. It is important to point out that when all the preparations were tested usingthe same plant material percentage, strong negative correlation (R2 = 0.86) was shown between theTP and the overall acceptance due to increased bitterness as mentioned by the tasters. Furthermore,sensory evaluation findings showed a similar trend with pigment content determination data andmainly the content in chlorophyll pigments. Sensorial findings including the comments of the tasterscan be considered an indication that consumers will probably accept the product more if the bitternessis lowered by the addition of extra sweetener or masked e.g., by the addition of lemon, cinnamon, orother herbs.
Processes 2019, 7, 88 13 of 16
4. Conclusions
Melissa Officinalis L. aqueous preparations easily made at home such as infusions were consideredremarkable sources of phytochemicals with nutritional importance. Such aqueous preparations mayregularly provide human body with minerals (Na, K, Ca, Li) and phenolic antioxidants, contributing tohealthy living, while exploiting their calming and refreshing properties. Infusion of 2% was preferableregarding organoleptic properties and nutritional values. Decoctions, although superior in thephytochemical characteristics studied were rejected in terms of sensorial attributes. 25% hydroethanolicMOL preparations are also significant sources of phenolic antioxidants and minerals. In a period thatanxiety and gastroesophagic disorders have been worryingly expanded, MOL preparations easilymade at home could, apart from boosting human body defense via phytochemical consumption,relieve from stress associated effects in a natural manner. Moreover, in view of the urgent demandfor the introduction of medicinal plants in the agricultural systems of Mediterranean area, due toeconomic emergencies, MOL could be a profitable choice regarding phytochemical content, bioactivityand safety issues.
Author Contributions: Methodology, N.T., A.A. (Aikaterini Atmatzidou), A.A. (Anna Androulaki), V.T.P., K.Z.and C.R.; Software, D.P., V.T.P. and K.Z.; Validation, V.T.P. and D.P.; Formal Analysis, V.T.P.; Investigation, V.T.P.;Resources, N.T., A.A (Aikaterini Atmatzidou) and V.T.P.; Data Curation, V.T.P.; Writing-Original Draft Preparation,V.T.P.; Writing-Review & Editing, V.T.P. and K.Z.; Supervision, V.T.P., and C.R.; Project Administration, V.T.P.
Funding: This research received no external funding.
Acknowledgments: Apivita Cosmetic Company is gratefully acknowledged for providing Melissa Officinalis L.from companies’ organic farm. The authors also gratefully acknowledge Ioannis Mourtzinos (Assistant ProfessorLaboratory of Food Chemistry - Biochemistry, Dept. of Food Science & Technology, Faculty of Agriculture AristotleUniversity of Thessaloniki) for his advice on the bioactive potential of MOL.
Conflicts of Interest: The authors declare no conflict of interest.
Abbreviations
The abbreviation list is given below:Melissa Officinalis L. (MOL); caffeic acid (CAF); gallic acid (GAL); quercetin(QUER); 1,1-diphenyl-2-picrylhydrazyl (DPPH•); Potassium (K); Sodium (Na); calcium (Ca); Lithium (Li);methanol (MeOH); Chamomile (CHM); Olive leaf (OLF); Water–in–oil–in water (W/O/W); Total Phenols (TP);0.5% w/v MOL aqueous preparation prepared by 10 min infusion at room temperature (I(A) MOL 0.5% 10’ W);2% w/v MOL aqueous preparation prepared by 10 min infusion at room temperature (I(A) MOL 2% 10’ W);4% w/v MOL aqueous preparation prepared by 10 min infusion at room temperature (I(A) MOL 4% 10’ W);2% w/v CHM aqueous preparation prepared by 10 min infusion at room temperature (I(A) CHM 2% 10’ W);2% w/v OLF aqueous preparation prepared by 10 min infusion at room temperature (I(A) OLF 2% 10’ W); 2%w/v MOL aqueous preparation prepared by 10 min infusion at 80 C (I(B) MOL 2% 10’ W); 2 % w/v MOLaqueous preparation prepared by 5 min boiling/decoction (D MOL 2% 5’ W); 2 % w/v MOL aqueous preparationprepared by 10 min boiling/decoction (D MOL 2% 10’ W); 2 % w/v MOL aqueous preparation prepared by15 min boiling/decoction (D MOL 2% 15’ W); 2% w/v aqueous MOL preparation prepared by 10 min ultrasounds(S MOL 2% 10’ W); 2% w/v ethanol MOL preparation prepared by 10 min ultrasounds (S MOL 2% 10’ E); 2% w/vhydroethanolic (25/75 v/v EtOH/H2O) MOL preparation prepared by 10 min ultrasounds S MOL 2% 10’ E/W);2% w/v MOL aqueous preparation prepared by 24 h maceration (M MOL 2% 24 h W); 2% w/v ethanol MOLpreparation prepared by 24 h maceration (M MOL 2% 24 h E); 2% w/v hydroethanolic (25/75 v/v EtOH/H2O)MOL preparation prepared by 24 h maceration (M MOL 2% 24 h E/W).
References
1. Rietjens, I.M.C.M.; Slob, W.; Galli, C.; Silano, V. Risk assessment of botanicals and botanical preparationsintended for use in food and food supplements: Emerging issues. Toxicol. Lett. 2008, 180, 131–136. [CrossRef][PubMed]
2. González-Tejero, M.R.; Casares-Porcel, M.; Sánchez-Rojas, C.P.; Ramiro-Gutiérrez, J.M.; Molero-Mesa, J.;Pieroni, A.; Giusti, M.E.; Censorii, E.; de Pasquale, C.; Della, A.; et al. Medicinal plants in the mediterraneanarea: Synthesis of the results of the project rubia. J. Ethnopharmacol. 2008, 116, 341–357. [CrossRef] [PubMed]
3. Moradkhani, H.; Sargsyan, E.; Bibak, H.; Naseri, B.; Sadat-Hosseini, M.; Fayazi-Barjin, A.; Meftahizade, H.Melissa officinalis L., a valuable medicine plant: A review. J. Med. Plants Res. 2010, 4, 2753–2759.
Processes 2019, 7, 88 14 of 16
4. Shakeri, A.; Sahebkar, A.; Javadi, B. Melissa officinalis L.—A review of its traditional uses, phytochemistryand pharmacology. J. Ethnopharm. 2016, 188, 204–228. [CrossRef] [PubMed]
5. Lardos, A. The botanical materia medica of the iatrosophikon—A collection of prescriptions from a monasteryin Cyprus. J. Ethnopharm. 2006, 104, 387–406. [CrossRef] [PubMed]
6. Gomes, N.; Campos, M.; Órfão, J.; Ribeiro, C. Plants with neurobiological activity as potential targets fordrug discovery. Prog. Neuro-Psychopharmacol. Biol. Psychiatry 2009, 33, 1372–1389. [CrossRef] [PubMed]
7. Škrovánková, S.; Mišurcová, L.; Machu, L. Antioxidant Activity and Protecting Health Effects of Commonmedicinal Plants; Elsevier Inc.: Amsterdam, The Netherlands, 2012; pp. 75–139.
8. Komes, D.; Belšcak-Cvitanovic, A.; Horžic, D.; Rusak, G.; Likic, S.; Berendika, M. Phenolic compositionand antioxidant properties of some traditionally used medicinal plants affected by the extraction time andhydrolysis. Phytochem. Anal. 2011, 22, 172–180. [CrossRef]
9. Musa Özcan, M.; Ünver, A.; Uçar, T.; Arslan, D. Mineral content of some herbs and herbal teas by infusionand decoction. Food Chem. 2008, 106, 1120–1127. [CrossRef]
10. Topal, U.; Sasaki, M.; Goto, M.; Otles, S. Chemical compositions and antioxidant properties of essential oilsfrom nine species of turkish plants obtained by supercritical carbon dioxide extraction and steam distillation.Int. J. Food Sci. Nutr. 2008, 59, 619–634. [CrossRef]
11. Kim, S.; Yun, E.J.; Bak, J.S.; Lee, H.; Lee, S.J.; Kim, C.T.; Lee, J.H.; Kim, K.H. Response surface optimisedextraction and chromatographic purification of rosmarinic acid from Melissa officinalis leaves. Food Chem.2010, 121, 521–526. [CrossRef]
12. Peev, G.; Penchev, P.; Peshev, D.; Angelov, G. Solvent extraction of rosmarinic acid from lemon balm andconcentration of extracts by nanofiltration: Effect of plant pre-treatment by supercritical carbon dioxide.Chem. Eng. Res. Des. 2011, 89, 2236–2243. [CrossRef]
13. Fecka, I.; Turek, S. Determination of water-soluble polyphenolic compounds in commercial herbal teas fromLamiaceae: Peppermint, Melissa, and Sage. J. Agric. Food Chem. 2007, 55, 10908–10917. [CrossRef] [PubMed]
14. Petenatti, M.E.; Petenatti, E.M.; del Vitto, L.A.; Téves, M.R.; Caffini, N.O.; Marchevsky, E.J.; Pellerano, R.G.Evaluation of macro and microminerals in crude drugs and infusions of five herbs widely used as sedatives.Braz. J. Pharm. 2011, 21, 1144–1149. [CrossRef]
15. Triantaphyllou, K.; Blekas, G.; Boskou, D. Antioxidative properties of water extracts obtained from herbs ofthe species Lamiaceae. Int. J. Food Sci. Nutr. 2001, 52, 313–317. [CrossRef] [PubMed]
16. Vilkhu, K.; Mawson, R.; Simons, L.; Bates, D. Applications and opportunities for ultrasound assistedextraction in the food industry—A review. Innov. Food Sci. Emerg. Technol. 2008, 9, 161–169. [CrossRef]
17. McKay, D.L.; Blumberg, J.B. A review of the bioactivity and potential health benefits of chamomile tea(Matricaria recutita L.). Phytother. Res. 2006, 20, 519–530. [CrossRef] [PubMed]
18. Papoti, V.; Pegklidou, K.; Perifantsi, E.; Nenadis, N.; Demopoulos, V.; Tsimidou, M. Antioxidant and aldosereductase inhibition activity of Ligustrum japonicum and Olea europaea L. leaf extracts. Eur. J. Lipid Sci. Technol.2011, 113, 876–885. [CrossRef]
19. Obied, H.K.; Allen, M.S.; Bedgood, D.R., Jr.; Prenzler, P.D.; Robards, K. Investigation of australian olive millwaste for recovery of biophenols. J. Agric. Food Chem. 2005, 53, 9911–9920. [CrossRef]
20. Hatzidimitriou, E.; Nenadis, N.; Tsimidou, M.Z. Changes in the catechin and epicatechin content of grapeseeds on storage under different water activity (aw) conditions. Food Chem. 2007, 105, 1504–1511. [CrossRef]
21. Benzie, I.F.; Strain, J.J. The ferric reducing ability of plasma (frap) as a measure of “antioxidant power”: Thefrap assay. Anal. Biochem. 1996, 239, 70–76. [CrossRef]
22. Lichtenthaler, H.K.; Wellburn, A.R. Determinations of total carotenoids and chlorophylls A and B of leafextracts in different solvents. Biochem. Soc. Trans. 1983, 11, 591–592. [CrossRef]
23. Ignat, I.; Volf, I.; Popa, V.I. A critical review of methods for characterisation of polyphenolic compounds infruits and vegetables. Food Chem. 2011, 126, 1821–1835. [CrossRef] [PubMed]
24. Moon, J.K.; Shibamoto, T. Antioxidant assays for plant and food components. J. Agric. Food Chem. 2009, 57,1655–1666. [CrossRef] [PubMed]
25. Sentkowska, A.; Biesaga, M.; Pyrzynska, K. Polyphenolic composition and antioxidative properties oflemon balm (Melissa officinalis L.) extract affected by different brewing processes. Int. J. Food Prop. 2015, 18,2009–2014. [CrossRef]
Processes 2019, 7, 88 15 of 16
26. Pereira, R.P.; Fachinetto, R.; de Souza Prestes, A.; Puntel, R.L.; Santos da Silva, G.N.; Heinzmann, B.M.;Boschetti, T.K.; Athayde, M.L.; Bürger, M.E.; Morel, A.F.; et al. Antioxidant effects of different extracts fromMelissa officinalis, Matricaria recutita and Cymbopogon citratus. Neurochem. Res. 2009, 34, 973–983. [CrossRef]
27. Caniova, A.; Brandsteterova, E. HPLC analysis of phenolic acids in Melissa officinalis. J. Liq. Chromatogr. Relat.Technol. 2001, 24, 2647–2659. [CrossRef]
28. Galanakis, C.M.; Goulas, V.; Tsakona, S.; Manganaris, G.A.; Gekas, V. A knowledge base for the recovery ofnatural phenols with different solvents. Int. J. Food Prop. 2013, 16, 382–396. [CrossRef]
29. Tsakona, S.; Galanakis, C.M.; Gekas, V. Hydro-ethanolic mixtures for the recovery of phenols frommediterranean plant materials. Food Bioprocess Technol. 2012, 5, 1384–1393. [CrossRef]
30. Blekas, G.; Psomiadou, E.; Tsimidou, M.; Boskou, D. On the importance of total polar phenols to monitor thestability of Greek virgin olive oil. Eur. J. Lipid Sci. Technol. 2002, 104, 340–346. [CrossRef]
31. Atoui, A.K.; Mansouri, A.; Boskou, G.; Kefalas, P. Tea and herbal infusions: Their antioxidant activity andphenolic profile. Food Chem. 2005, 89, 27–36. [CrossRef]
32. Jiménez-Zamora, A.; Delgado-Andrade, C.; Rufián-Henares, J.A. Antioxidant capacity, total phenols andcolor profile during the storage of selected plants used for infusion. Food Chem. 2016, 199, 339–346. [CrossRef][PubMed]
33. Exarchou, V.; Nenadis, N.; Tsimidou, M.; Gerothanassis, I.P.; Troganis, A.; Boskou, D. Antioxidant activitiesand phenolic composition of extracts from Greek oregano, Greek sage, and summer savory. J. Agric. FoodChem. 2002, 50, 5294–5299. [CrossRef] [PubMed]
34. Skotti, E.; Anastasaki, E.; Kanellou, G.; Polissiou, M.; Tarantilis, P.A. Total phenolic content, antioxidantactivity and toxicity of aqueous extracts from selected Greek medicinal and aromatic plants. Ind. Crops Prod.2014, 53, 46–54. [CrossRef]
35. Ince, A.E.; Sahin, S.; Samna, S.G. Extraction of phenolic compounds from Melissa using microwave andultrasound. Turk. J. Agric. For. 2013, 37, 69–75.
36. Lin, J.-T.; Chen, Y.-C.; Lee, Y.-C.; Rolis Hou, C.-W.; Chen, F.-L.; Yang, D.-J. Antioxidant, anti-proliferative andcyclooxygenase-2 inhibitory activities of ethanolic extracts from lemon balm (Melissa officinalis L.) leaves.LWT Food Sci. Technol. 2012, 49, 1–7. [CrossRef]
37. Szabó, K.; Malekzadeh, M.; Radácsi, P.; Ladányi, M.; Rajhárt, P.; Inotai, K.; Tavaszi-Sárosi, S.; Németh, É.Could the variety influence the quantitative and qualitative outcome of lemon balm production? Ind. CropsProd. 2016, 83, 710–716. [CrossRef]
38. Naczk, M.; Shahidi, F. Phenolics in cereals, fruits and vegetables: Occurrence, extraction and analysis.J. Pharm. Biomed. Anal. 2006, 41, 1523–1542. [CrossRef]
39. Arceusz, A.; Wesolowski, M. Quality consistency evaluation of Melissa officinalis L. Commercial herbs byHPLC fingerprint and quantitation of selected phenolic acids. J. Pharm. Biomed. Anal. 2013, 83, 215–220.[CrossRef]
40. Skendi, A.; Irakli, M.; Chatzopoulou, P. Analysis of phenolic compounds in Greek plants of Lamiaceae familyby HPLC. J. Appl. Res. Med. Aromat. Plants 2017, 6, 62–69. [CrossRef]
41. Papoti, V.T.; Tsimidou, M.Z. Impact of sampling parameters on the radical scavenging potential of olive(Olea europaea L.) leaves. J. Agric. Food Chem. 2009, 57, 3470–3477. [CrossRef]
42. Goulas, V.; Papoti, V.T.; Exarchou, V.; Tsimidou, M.Z.; Gerothanassis, I.P. Contribution of flavonoids to theoverall radical scavenging activity of olive (Olea europaea L.) leaf polar extracts. J. Agric. Food Chem. 2010, 58,3303–3308. [CrossRef] [PubMed]
43. Mishra, K.; Ojha, H.; Chaudhury, N.K. Estimation of antiradical properties of antioxidants using DPPH-assay:A critical review and results. Food Chem. 2012, 130, 1036–1043. [CrossRef]
44. Prior, R.L.; Wu, X.; Schaich, K. Standardized methods for the determination of antioxidant capacity andphenolics in foods and dietary supplements. J. Agric. Food Chem. 2005, 53, 4290–4302. [CrossRef] [PubMed]
45. Koksal, E.; Bursal, E.; Dikici, E.; Tozoglu, F.; Gulcin, I. Antioxidant activity of Melissa officinalis leaves. J. Med.Plants Res. 2011, 5, 217–222.
46. Erkan, N.; Ayranci, G.; Ayranci, E. Antioxidant activities of rosemary (Rosmarinus officinalis L.) extract,blackseed (Nigella sativa L.) essential oil, carnosic acid, rosmarinic acid and sesamol. Food Chem. 2008, 110,76–82. [CrossRef] [PubMed]
47. Herodež, S.S.; Hadolin, M.; Škerget, M.; Knez, Ž. Solvent extraction study of antioxidants from balm (Melissaofficinalis L.) leaves. Food Chem. 2003, 80, 275–282. [CrossRef]
Processes 2019, 7, 88 16 of 16
48. Nugraheni, M.; Santoso, U.; Suparmo, H.; Wuryastuti, H. In vitro antioxidant, antiproliferative and apoptosiseffect of coleus Tuberosus L. Afr. J. Food Sci. 2011, 5, 232–241.
49. Nenadis, N.; Tsimidou, M. Observations on the estimation of scavenging activity of phenolic compoundsusing rapid 1,1-diphenyl-2-picrylhydrazyl (DPPH.) tests. J. Am. Oil Chem. Soc. 2002, 79, 1191–1195.[CrossRef]
50. Ordoudi, S.A.; Tsimidou, M.Z.; Vafiadis, A.P.; Bakalbassis, E.G. Structure-DPPH• scavenging activityrelationships: Parallel study of catechol and guaiacol acid derivatives. J. Agric. Food Chem. 2006, 54,5763–5768. [CrossRef] [PubMed]
51. Silva, E.M.; Pompeu, D.R.; Larondelle, Y.; Rogez, H. Optimisation of the adsorption of polyphenols fromInga edulis leaves on macroporous resins using an experimental design methodology. Sep. Purif. Technol.2007, 53, 274–280. [CrossRef]
52. Spiridon, I.; Colceru, S.; Anghel, N.; Teaca, C.A.; Bodirlau, R.; Armatu, A. Antioxidant capacity andtotal phenolic contents of oregano (Origanum vulgare), lavender (Lavandula angustifolia) and lemon balm(Melissa officinalis) from romania. Nat. Prod. Res. 2011, 25, 1657–1661. [CrossRef] [PubMed]
53. Dias, M.I.; Barros, L.; Sousa, M.J.; Ferreira, I.C.F.R. Systematic comparison of nutraceuticals and antioxidantpotential of cultivated, in vitro cultured and commercial Melissa officinalis samples. Food Chem. Toxicol. 2012,50, 1866–1873. [CrossRef] [PubMed]
54. Kamdem, J.P.; Adeniran, A.; Boligon, A.A.; Klimaczewski, C.V.; Elekofehinti, O.O.; Hassan, W.; Ibrahim, M.;Waczuk, E.P.; Meinerz, D.F.; Athayde, M.L. Antioxidant activity, genotoxicity and cytotoxicity evaluationof lemon balm (Melissa officinalis L.) ethanolic extract: Its potential role in neuroprotection. Ind. Crops Prod.2013, 51, 26–34. [CrossRef]
55. Nicolai, M.; Pereira, P.; Vitor, R.F.; Reis, C.P.; Roberto, A.; Rijo, P. Antioxidant activity and rosmarinicacid content of ultrasound-assisted ethanolic extracts of medicinal plants. Measurement 2016, 89, 328–332.[CrossRef]
56. Pytlakowska, K.; Kita, A.; Janoska, P.; Połowniak, M.; Kozik, V. Multi-element analysis of mineral and traceelements in medicinal herbs and their infusions. Food Chem. 2012, 135, 494–501. [CrossRef] [PubMed]
57. Rodriguez-Amaya, D.B.; Kimura, M. Harvestplus handbook for carotenoid analysis. In Harvestplus TechnicalMonographs; International Food Policy Research Institute (IFPRI) International Center for Tropical Agriculture(CIAT): Washington, WA, USA, 2004; pp. 1–58.
58. Bernal, J.; Mendiola, J.A.; Ibáñez, E.; Cifuentes, A. Advanced analysis of nutraceuticals. J. Pharm. Biomed.Anal. 2011, 55, 758–774. [CrossRef] [PubMed]
59. Wellburn, A.R. The spectral determination of chlorophylls a and b, as well as total carotenoids, using varioussolvents with spectrophotometers of different resolution. J. Plant Physiol. 1994, 144, 307–313. [CrossRef]
60. Joubert, E. Chemical and sensory analyses of spray- and freezedried extracts of rooibos tea (Aspalathuslinearis). Int. J. Food Sci. Technol. 1990, 25, 344–349. [CrossRef]
61. Von Gadow, A.; Joubert, E.; Hansmann, C.F. Effect of extraction time and additional heating on theantioxidant activity of rooibos tea (Aspalathus linearis) extracts. J. Agric. Food Chem. 1997, 45, 1370–1374.[CrossRef]
© 2019 by the authors. Licensee MDPI, Basel, Switzerland. This article is an open accessarticle distributed under the terms and conditions of the Creative Commons Attribution(CC BY) license (http://creativecommons.org/licenses/by/4.0/).