physiology lessons lesson 10 for use with the biopac ... · physiology lessons for use with the...
TRANSCRIPT
Physiology Lessons for use with the
Biopac Student Lab
Lesson 10
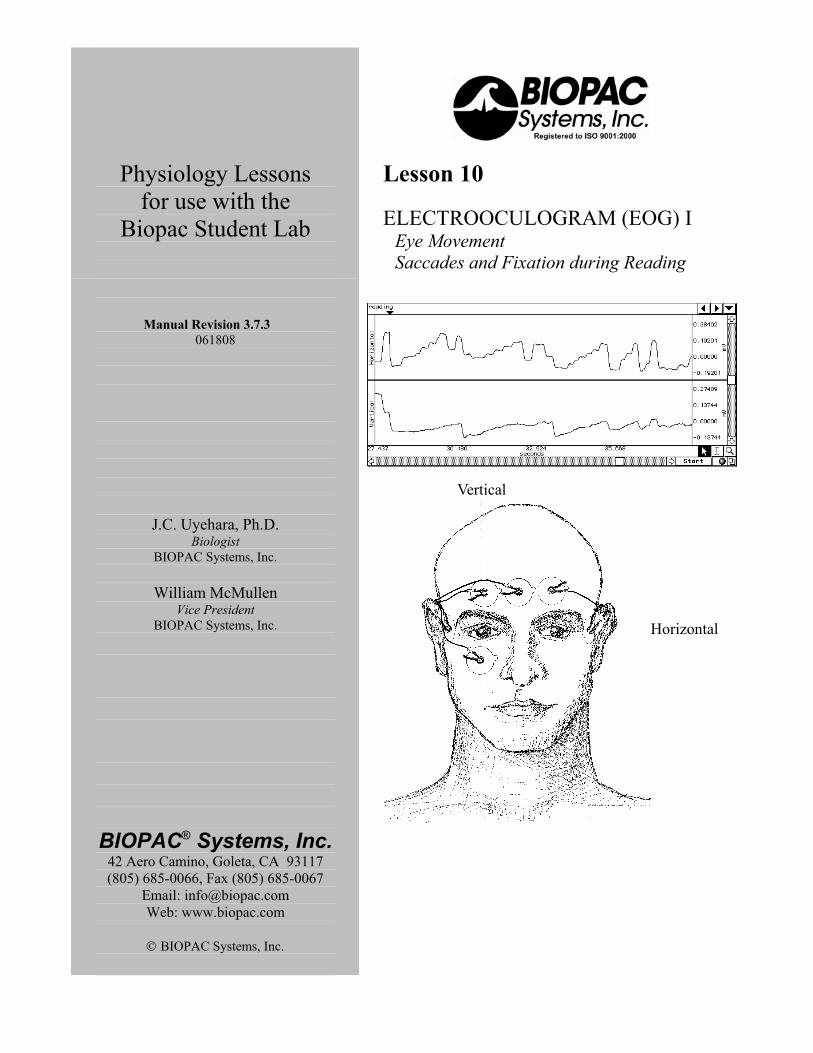
ELECTROOCULOGRAM (EOG) I Eye Movement Saccades and Fixation during Reading
Manual Revision 3.7.3 061808
J.C. Uyehara, Ph.D. Biologist
BIOPAC Systems, Inc.
William McMullen Vice President
BIOPAC Systems, Inc.
BIOPAC® Systems, Inc. 42 Aero Camino, Goleta, CA 93117 (805) 685-0066, Fax (805) 685-0067
Email: [email protected] Web: www.biopac.com
© BIOPAC Systems, Inc.
Horizontal
Vertical
Lesson 10: EOG I Page 3
II. EXPERIMENTAL OBJECTIVES 1) Compare eye movements while fixated on a stationary object and tracking objects.
2) Measure duration of saccades and fixation during reading.
3) Instructor’s option: Record spatial position of eye movements during visual examination of materials.
III. MATERIALS • BIOPAC electrode lead set (SS2L), Qty-2
• BIOPAC disposable vinyl electrodes (EL503), 6 electrodes per subject
• BIOPAC electrode gel (GEL1) and abrasive pad (ELPAD) or skin cleanser or alcohol prep
• Adhesive Tape (TAPE 2)
• Computer system
• Biopac Student Lab 3.7
• BIOPAC data acquisition unit (MP36, MP35, or MP30 with cable and power)
IV. EXPERIMENTAL METHODS For further explanation, use the online support options under the Help Menu.
A. SET UP FAST TRACK Set Up DETAILED EXPLANATION OF SET UP STEPS
1. Turn the computer ON. The desktop should appear on the monitor. If it does not appear, ask the laboratory instructor for assistance.
2. Make sure the BIOPAC MP3X unit is turned OFF.
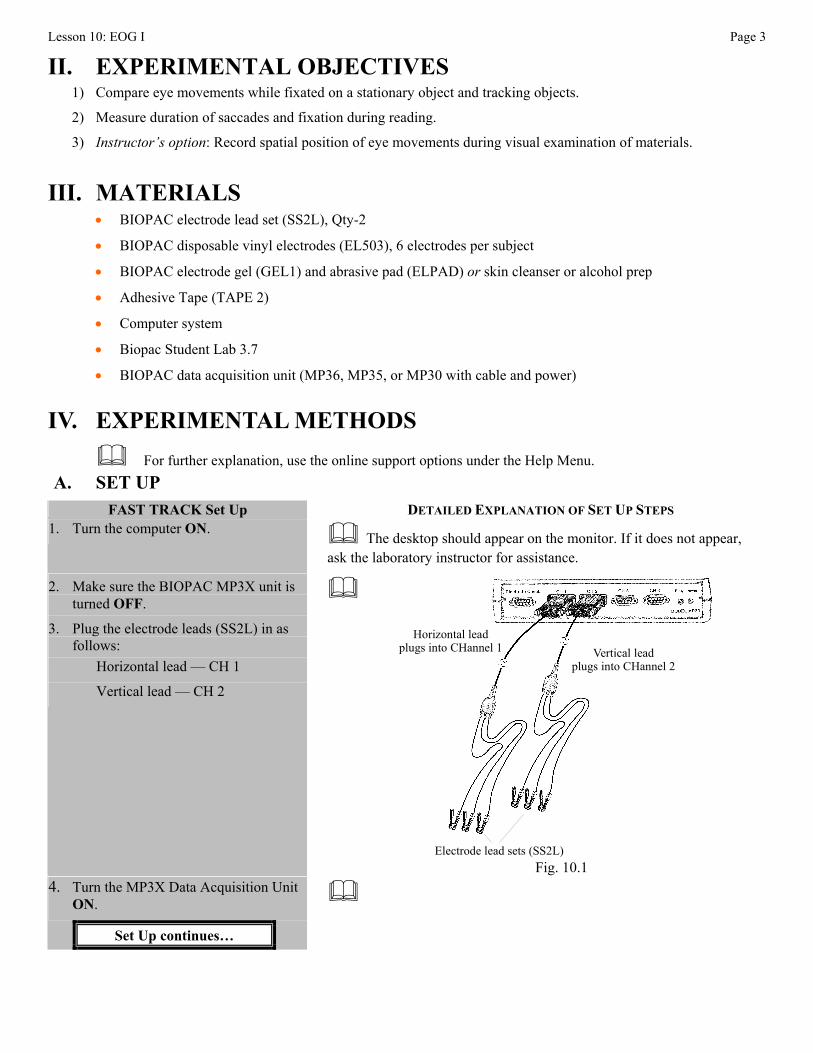
3. Plug the electrode leads (SS2L) in as follows: Horizontal lead — CH 1
Vertical lead — CH 2
Electrode lead sets (SS2L)
Horizontal leadplugs into CHannel 1 Vertical lead
plugs into CHannel 2
Fig. 10.1
4. Turn the MP3X Data Acquisition Unit ON.
Set Up continues…

Page 4 Biopac Student Lab
5. Place 6 electrodes on the Subject as
shown in Fig. 10.2.
IMPORTANT For accurate recordings, attach the electrodes so they are horizontally
and vertically aligned.
Right side Left side
Fig. 10.2 Proper electrode placement
Attach one electrode above the right eye and one below, such that they are aligned vertically.
Attach one electrode to the right of the right eye and one to the left of the left eye, such that they are aligned horizontally.
The other two electrodes are for ground, and it is not critical that they are aligned.
For optimal electrode adhesion, the electrodes should be placed on the skin at least five minutes before the start of the Calibration procedure. Note: Because these electrodes are attached near the eye, be very careful if using alcohol to clean the skin.
6. Attach the vertical electrode lead set (SS2L) from Channel 2 to the electrodes, following Fig. 10.3.
Setup continues…
Follow Fig. 10.3 to ensure that you connect each colored cable to the proper electrode. It is recommended that the electrode leads run behind the ears, as shown, to give proper cable strain relief.
Right side Left side
BLACK lead(Ground)
RED lead
WHITE lead
Verti
cal
Lead Placement for Channel 2 (Vertical) Fig. 10.3

Lesson 10: EOG I Page 5
7. Attach the horizontal electrode lead set (SS2L) from Channel 1 to the electrodes, following Fig. 10.4.
Follow Fig. 10.4 to ensure that you connect each colored cable to the proper electrode. It is recommended that the electrode leads run behind the ears, as shown, to give proper cable strain relief.
Right side Left side
BLACK lead(Ground)
RED lead WHITE lead
Horizontal
Lead Placement for Channel 1 (Horizontal) Fig. 10.4
8. Have the Subject adjust the seating position such that his/her eyes are in line with the center of the computer screen.
The Subject should be positioned to see the computer screen easily without moving his/her head. Supporting the head to minimize movement is recommended.
Connect the electrode cable clip (where the cable meets the three individual colored wires) to a convenient location (can be on the Subject’s clothes). This will relieve cable strain.
The Subject should not be in contact with nearby metal objects (faucets, pipes, etc.), and should remove any wrist or ankle bracelets.
9. Note the distance from the eyes to the computer screen.
Note the distance from the eyes to the computer screen, as it will be needed in Recording Step 26.
10. Start the BIOPAC Student Lab Program.
11. Choose Lesson L10-EOG-1. 12. Type in your filename. Use a unique identifier.
13. Click OK.
END OF SET UP
This ends the Set Up procedure.
Page 6 Biopac Student Lab
B. CALIBRATION The Calibration procedure establishes the hardware’s internal parameters (such as gain, offset, and scaling) and is critical for optimum performance. Pay close attention to the Calibration procedure.
FAST TRACK Calibration DETAILED EXPLANATION OF CALIBRATION STEPS
1. Make sure the Subject is seated in the same position as directed in Set Up Step 8.
Note: It is very important that the Subject does not move his/her head during the calibration procedure.
2. Click Calibrate. After the Calibrate button is pressed, a new window will be established and a dialog box will pop up (Fig.10.5).
Fig. 10.5
The journal will be hidden from view during calibration.
3. Prepare for the next step. In the next step, after the OK button is pressed, a dot will begin a counterclockwise rotation around the screen. The Subject is to track the dot with his/her eyes without moving his/her head.
4. Click OK. This will begin the Calibration procedure.
5. Subject should follow the dot on the screen with eyes only.
The Subject should follow the dot around the screen with eyes only and should not move his /her head.
This procedure will continue for about 10 seconds and will stop automatically.
6. Check the calibration data:
If similar, proceed to Data Recording.
If different, Redo Calibration.
END OF CALIBRATION
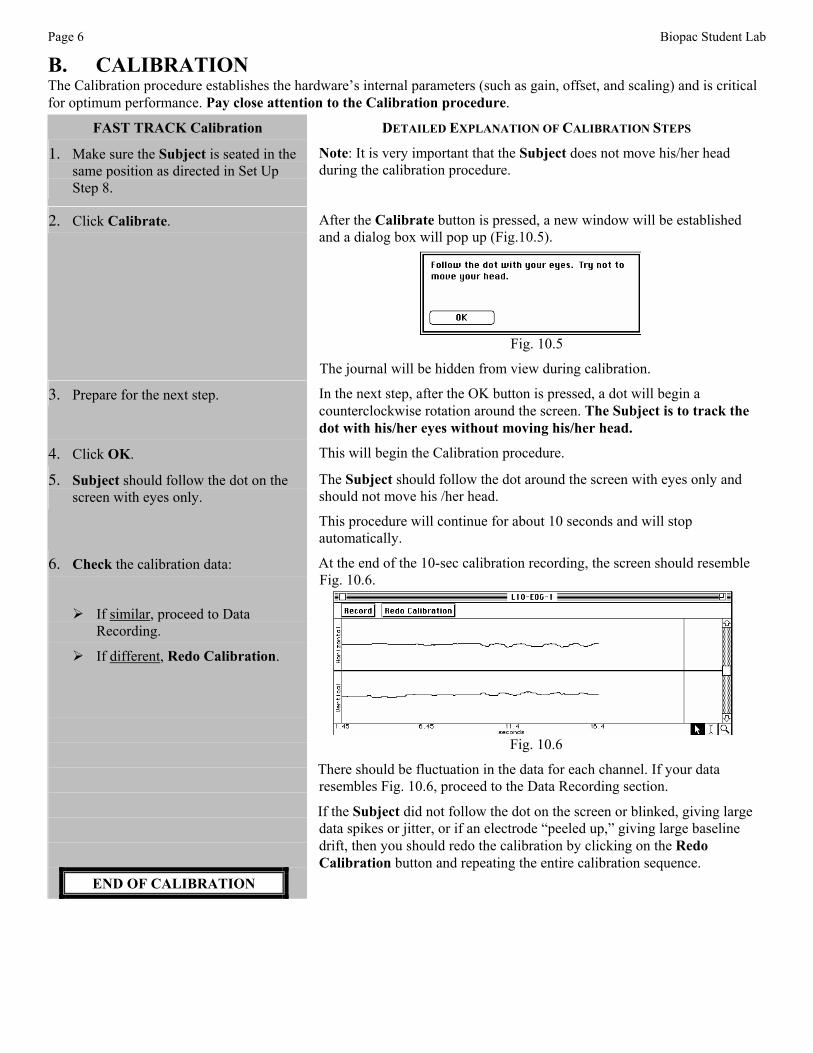
At the end of the 10-sec calibration recording, the screen should resemble Fig. 10.6.
Fig. 10.6
There should be fluctuation in the data for each channel. If your data resembles Fig. 10.6, proceed to the Data Recording section.
If the Subject did not follow the dot on the screen or blinked, giving large data spikes or jitter, or if an electrode “peeled up,” giving large baseline drift, then you should redo the calibration by clicking on the Redo Calibration button and repeating the entire calibration sequence.

Lesson 10: EOG I Page 7
C. RECORDING LESSON DATA FAST TRACK Recording DETAILED EXPLANATION OF RECORDING STEPS
1. Prepare for the recording. In order to work efficiently, read this entire section so you will know what to do before recording.
Check the last line of the journal and note the total amount of time available for the recording. Stop each recording segment as soon as possible so you don’t use an excessive amount of time (time is memory).
Hints for obtaining optimal data:
a) Always track the object with your eyes and not your head.
b) Subject should focus on one point of the object, and maintain that focus while following it around.
c) The Subject needs to sit so that head movement is minimized during recording.
d) There should be enough space near the Subject so that an object can be moved around the head at a distance of about 10” (25 cm).
e) When moving the object, the Director should try to keep it at the same distance from the Subject’s head.
f) During recording, the Subject should not blink. If unavoidable, the Recorder should mark the data.
g) Make sure electrodes do not “peel up.”
h) The larger the monitor, the better the data results from the eye tracking portion of this lesson.
2. Subject and Director should face each other.
Subject should not be looking at the computer screen.
3. Director should hold a pen in front of the Subject.
The Director should hold a pen in front of the Subject’s head at a distance of about 10” (25 cm). The pen should be centered with the Subject’s head, so that the Subject’s eyes are looking straight ahead.
4. Subject should pick a focal point on the pen so that the eyes remain horizontal.
Recording continues…
The Subject’s eyes should not move up or down. Ideally, they will only move laterally to follow the object.

Page 8 Biopac Student Lab
Segment 1
5. Click Record. When you click Record, the recording will begin and an append marker labeled “Eyes tracking horizontal” will automatically be inserted “.
6. Record for 20 seconds.
Subject fixates and tracks object.
Director holds object center and still for about 5 seconds, then moves object laterally ±70° and back to center in about 3 seconds.
Recorder inserts event markers with each change of direction:
∇ “L” for left ∇ “R” for right
The Subject should fixate and track the object. Subject should try not to blink during recording, though it may be unavoidable.
Director should hold object 10” (25 cm) in front of Subject for about 5 seconds, then move the object laterally to Subject’s left, then right, then back to center in about 3 seconds.
Director should verbalize the directions so that the Recorder knows when to place markers and what direction to label them.
To insert Markers, press the F9 key. Markers and labels can be edited after the data is recorded.
7. Click Suspend. The recording will halt, and you can review the data.
8. Review the data on the screen.
If correct, go to Step 10.
If all went well, your data should look similar to Fig. 10.7.
Fig. 10.7 End of Segment 1 (Horizontal tracking)
a) Data should show that the horizontal EOG (CH 1) had large deflections, and the vertical EOG (CH 2) had very little deflection.
b) Data should show a positive peak when Subject looked right, and a negative peak when the Subject looked left.
If incorrect, go to Step 9. The data would be incorrect if: a) Channel connections were incorrect. b) Lead connections were incorrect (i.e., red lead was not connected
to the Subject’s right temple.) c) The Suspend button was pressed prematurely d) An electrode peeled up, giving a large baseline drift e) The Subject looked away or the head moved.
Note: A few blinks may be unavoidable in the data and would not necessitate redoing the recording.
9. If data was incorrect, click Redo.
Click Redo and repeat Steps 2-8. Note that once you press Redo, the data you have just recorded will be erased.
Recording continues…

Lesson 10: EOG I Page 9
Segment 2
10. Subject and Director should face each other.
Subject should not be looking at the computer screen.
11. Director should hold a pen in front of the Subject.
The Director should hold a pen in front of the Subject’s head at a distance of about 10” (25 cm). The pen should be centered with the Subject’s head, so that the Subject’s eyes are looking straight ahead.
12. Subject should pick a focal point on the pen so that the eyes are looking straight ahead (not up or down).
Subject may need to blink before resuming recording.
13. Click Resume. When you click Resume, the recording will continue and an append marker labeled “Eyes tracking vertically” will be automatically inserted.
14. Record for 20 seconds.
Subject should follow object with eyes only.
Director should hold object stationary and center, then move object up, down, and return to center.
Recorder should insert event markers:
∇ “U” Object moved up
∇ “D” Object moved down
The Subject should follow the object with is/her eyes without moving his/her head. Subject should try not to blink during the recording, although it may be unavoidable.
The Director should begin with the object about 10” (25 cm) in front of the Subject for 5 seconds, and move the object vertically to the edge of the Subject’s field of vision.
To insert Markers, press the F9 key. Markers and labels can be edited after the data is recorded.
15. Click Suspend. The recording should halt, giving you time to review the data.
16. Review the data on the screen.
If correct, go to Step 18.
If all went well, your data should look similar to Fig. 10.8.
Fig. 10.8 Segment 2 Vertical Tracking
a) Data should show that the vertical EOG (CH 2) recording had
large deflections, and the horizontal EOG (CH 1) had very little deflection.
b) Data should show a positive peak when Subject looked up and a negative peak when the Subject looked down.
If incorrect, go to Step 17. The data would be incorrect for the reasons from Step 8.
17. If data was incorrect, click Redo.
Click Redo and repeat Steps 10-16. Note that once you press Redo, the data you have just recorded will be erased.
Recording continues…
Page 10 Biopac Student Lab
Segment 3
18. Prepare for Segment 3 reading:
Director selects reading and positions it in front of Subject.
Subject prepares to read.
A sample reading is provided at the end of the lesson. Hold the page in front of the Subject at a distance of about 10” (25 cm), centered within his/her line of sight.
19. Click Resume. When you click Resume, the recording will continue and an append marker labeled “Reading” will be automatically inserted
20. Subject should read for about 20 seconds.
∇ Optional: Recorder can insert a marker when Subject starts reading each line.
Subject should read silently to minimize EMG artifact.
Optional: The Subject may signal the Recorder (verbally or with hand signals) when starting each new line and the Recorder can insert event markers.
To insert Markers, press the F9 key. Markers and labels can be edited after the data is recorded.
21. Click Suspend. The recording should halt, giving you time to review the data.
22. Review the data on the screen.
If correct, go to Step 24.
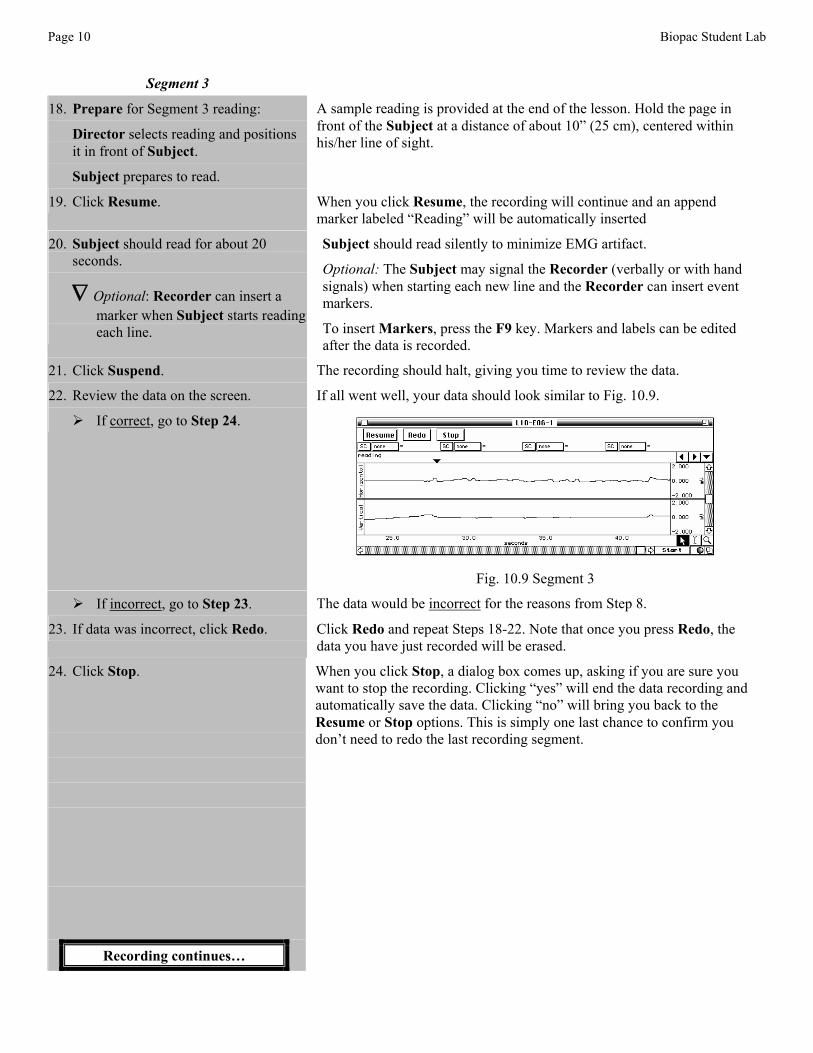
If all went well, your data should look similar to Fig. 10.9.
Fig. 10.9 Segment 3
If incorrect, go to Step 23. The data would be incorrect for the reasons from Step 8.
23. If data was incorrect, click Redo. Click Redo and repeat Steps 18-22. Note that once you press Redo, the data you have just recorded will be erased.
24. Click Stop.
Recording continues…
When you click Stop, a dialog box comes up, asking if you are sure you want to stop the recording. Clicking “yes” will end the data recording and automatically save the data. Clicking “no” will bring you back to the Resume or Stop options. This is simply one last chance to confirm you don’t need to redo the last recording segment.

Lesson 10: EOG I Page 11
Optional Segment 4 Tracking demonstration
25. If you want to see an example of eye tracking, go to Step 26.
or
If you want to end the recording, go to Step 31.
Note: This part of the recording is for general interest only and data will not be saved. It shows how well the EOG can be used as an eye-tracking device.
26. Reposition the Subject per Set Up Step 8.
IMPORTANT — The distance from the eyes to the screen must be the same as it was in Set Up.
Have the Subject adjust the seating position such that his/her eyes are in line with the center of the computer screen, and the distance from the eyes to the screen is as recorded.
Refer to the distance noted in Set Up Step 9 to ensure that the distance from the Subject’s eyes to the screen is the same as was used for the calibration procedure.
27. Click DOT PLOT. A new window will appear, similar to the calibration window.
28. Subject should focus on the center of the screen and move his or her head until the dot is also at the center of the screen.
Subject should maintain this position throughout the DOT PLOT segment.
29. Subject should look at different points within the data window.
The dot on the screen should track the focal point of the Subject’s eyes.
Subject should maintain the head position from Step 26, and should look at different points on the screen with eyes only.
Note that because of amplifier limitations, the dot can not hold its position for very long and will tend to move toward the center point.
30. Click Stop. When you click Stop, the screen will change to simultaneously display all the dot positions from the last 30 seconds of the dot plot. This segment of data will not be saved.
You may redo the dot plot by clicking Redo.
31. Click Done. After you press Done, a pop-up window with options will appear. Make your choice, and continue as directed.
If choosing the “Record from another Subject” option: a) Attach electrodes per Set Up Steps 5-7 and continue the entire
lesson from Set Up Step 11. b) Each person will need to use a unique file name
32. Remove the electrodes.
END OF RECORDING
Remove the electrode cable pinch connectors, and peel off the electrodes. Throw out the electrodes (BIOPAC electrodes are not reusable). Wash the electrode gel residue from the skin, using soap and water. The electrodes may leave a slight ring on the skin for a few hours. This is normal, and does not indicate that anything is wrong.
Page 12 Biopac Student Lab
V. DATA ANALYSIS FAST TRACK Data Analysis DETAILED EXPLANATION OF DATA ANALYSIS STEPS
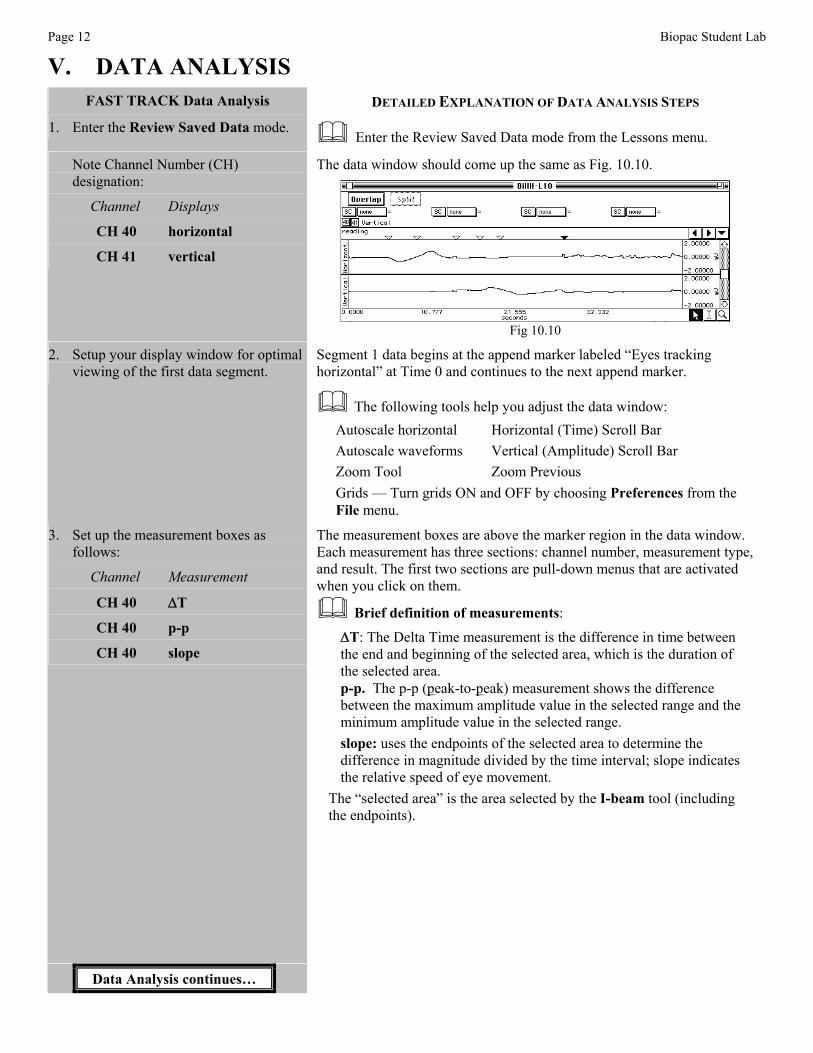
1. Enter the Review Saved Data mode. Enter the Review Saved Data mode from the Lessons menu.
Note Channel Number (CH) designation:
Channel Displays
CH 40 horizontal
CH 41 vertical
The data window should come up the same as Fig. 10.10.
Fig 10.10
2. Setup your display window for optimal viewing of the first data segment.
Segment 1 data begins at the append marker labeled “Eyes tracking horizontal” at Time 0 and continues to the next append marker.
The following tools help you adjust the data window: Autoscale horizontal Horizontal (Time) Scroll Bar Autoscale waveforms Vertical (Amplitude) Scroll Bar Zoom Tool Zoom Previous Grids — Turn grids ON and OFF by choosing Preferences from the File menu.
3. Set up the measurement boxes as follows:
Channel Measurement
CH 40 ΔT
CH 40 p-p
CH 40 slope
The measurement boxes are above the marker region in the data window. Each measurement has three sections: channel number, measurement type, and result. The first two sections are pull-down menus that are activated when you click on them.
Brief definition of measurements:
ΔT: The Delta Time measurement is the difference in time between the end and beginning of the selected area, which is the duration of the selected area. p-p. The p-p (peak-to-peak) measurement shows the difference between the maximum amplitude value in the selected range and the minimum amplitude value in the selected range. slope: uses the endpoints of the selected area to determine the difference in magnitude divided by the time interval; slope indicates the relative speed of eye movement.
The “selected area” is the area selected by the I-beam tool (including the endpoints).
Data Analysis continues…
Lesson 10: EOG I Page 13
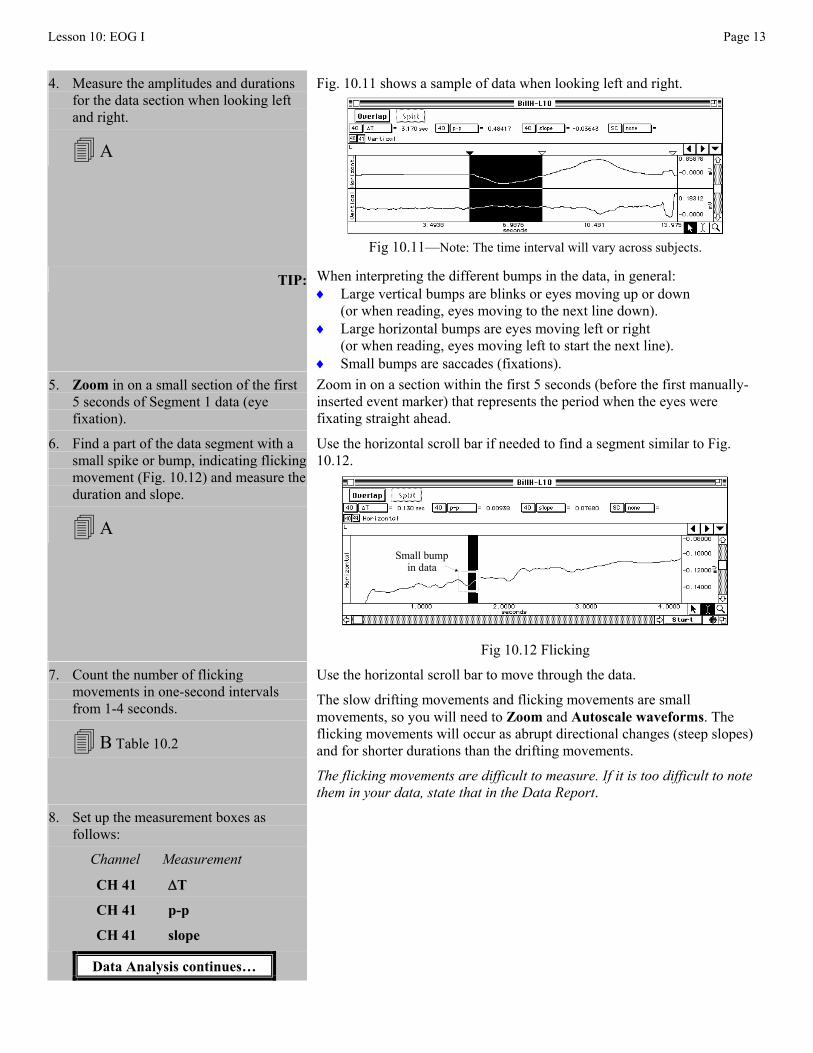
4. Measure the amplitudes and durations
for the data section when looking left and right.
A
Fig. 10.11 shows a sample of data when looking left and right.
Fig 10.11—Note: The time interval will vary across subjects.
TIP: When interpreting the different bumps in the data, in general: ♦ Large vertical bumps are blinks or eyes moving up or down
(or when reading, eyes moving to the next line down). ♦ Large horizontal bumps are eyes moving left or right
(or when reading, eyes moving left to start the next line). ♦ Small bumps are saccades (fixations).
5. Zoom in on a small section of the first 5 seconds of Segment 1 data (eye fixation).
Zoom in on a section within the first 5 seconds (before the first manually-inserted event marker) that represents the period when the eyes were fixating straight ahead.
6. Find a part of the data segment with a small spike or bump, indicating flicking movement (Fig. 10.12) and measure the duration and slope.
A
Use the horizontal scroll bar if needed to find a segment similar to Fig. 10.12.
Small bumpin data
Fig 10.12 Flicking
7. Count the number of flicking movements in one-second intervals from 1-4 seconds.
B Table 10.2
Use the horizontal scroll bar to move through the data.
The slow drifting movements and flicking movements are small movements, so you will need to Zoom and Autoscale waveforms. The flicking movements will occur as abrupt directional changes (steep slopes) and for shorter durations than the drifting movements.
The flicking movements are difficult to measure. If it is too difficult to note them in your data, state that in the Data Report.
8. Set up the measurement boxes as follows:
Channel Measurement
CH 41 ΔT
CH 41 p-p
CH 41 slope
Data Analysis continues…

Page 14 Biopac Student Lab
9. Take the measurements on Segment 2
data as needed.
C
Take measurements in the first five seconds for flicking during fixation.
10. Set up the display window to view Segment 3 “Reading” data.
Segment 3 data begins with the append marker labeled “Reading.” Identify the data section when the Subject moved his/her eyes to read the next line. The horizontal EOG will show the eyes moving left, and at the same time, the vertical EOG will show the eyes moving down.
11. Find the saccades in the data (Fig. 10.13).
D
You can paste measurements into the Journal to record the results of each saccade per line of reading.
Fig 10.13
12. Save or print the data file. You may save the data to a drive, save notes that are in the journal, or print the data file.
13. Exit the program.
END OF DATA ANALYSIS
END OF LESSON 10
Complete the Lesson 10 Data Report that follows.
Lesson 10: EOG I Page 15
ELECTROOCULOGRAM EOG
DATA REPORT Student’s Name:
Lab Section:
Date: I. Data and Calculations
Subject Profile
Name Height
Age Weight
Gender: Male / Female
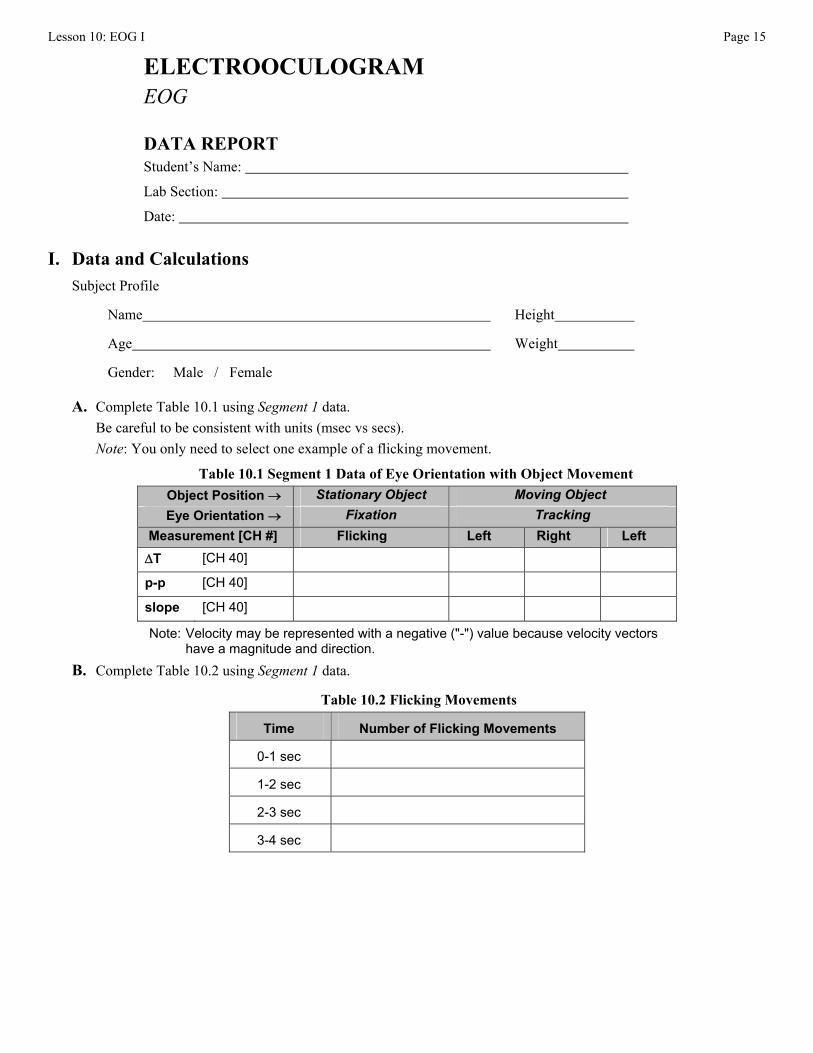
A. Complete Table 10.1 using Segment 1 data. Be careful to be consistent with units (msec vs secs). Note: You only need to select one example of a flicking movement.
Table 10.1 Segment 1 Data of Eye Orientation with Object Movement Object Position → Stationary Object Moving Object Eye Orientation → Fixation Tracking
Measurement [CH #] Flicking Left Right Left ΔT [CH 40]
p-p [CH 40]
slope [CH 40]
Note: Velocity may be represented with a negative ("-") value because velocity vectors have a magnitude and direction.
B. Complete Table 10.2 using Segment 1 data.
Table 10.2 Flicking Movements
Time Number of Flicking Movements
0-1 sec
1-2 sec
2-3 sec
3-4 sec

Page 16 Biopac Student Lab
C. Complete Table 10.3 using Segment 2 data.
Note: You only need to select one example of a flicking movement.
Table 10.3 Segment 2 Data of Eye Orientation with Object Movement Eye Orientation
→ Stationary
Object Moving Object
Tracking Measurement Flicking Up Down Up
ΔT [CH 41] p-p [CH 41]
Slope [CH 41]
D. Complete Table 10.4 with Segment 3 data. (Note: You may not have seven saccades per line.)
Table 10.4 Segment 3 Reading data Measurement First Line Second Line Number of saccades Duration of saccade: #1
#2
#3
#4
#5
#6
#7
Total duration of saccades/line
Total reading time/line
% time of saccades/total reading time
II. Questions
E. Refer to Table 10.1 data and compare duration (T), relative changes in eye position (Δ), and speed of eye movement (slope) of flicking and tracking movements.
F. What is the stimulus for reflex flicking movements?
G. Refer to Table 10.3 data and compare duration (T), relative changes in eye position (Δ), and speed of eye movement (slope) of flicking and tracking movements.

Lesson 10: EOG I Page 17
H. Refer to Table 10.3 data and compare your results with at least three others in your class. What is the range of variation in % time of saccades per line?
I. Describe three types of involuntary movements during fixation on a stationary object.
J. Explain how an electrooculogram is recorded.
K. Define visual field.
L. Define saccade.
End of Lesson 10 Data Report

Page 18 Biopac Student Lab

Lesson 10: EOG I Page 19
Sample Reading
Saccadic movements jump from place to place.
Alas, poor Yorick, I knew him well.
What do these three things have in common? Two young lovers whose eyes meet across a crowded room. A Michael Crichton novel. The final scene of Casablanca.