physiological links of growth stage and nutrient needs-alfalfa
TRANSCRIPT

Physiological Links of Growth Stage and Nutrient Needs-Alfalfa
Kess BergBrad Joern, Keith Johnson, Sylvie
Brouder, Jeff VolenecDepartment of Agronomy
Purdue UniversityPartial Financial Support Provided byThe Potash and Phosphate Institute
IMC GlobalFoundation for Agronomic Research
PotashCorp

GoalsConfirm that P and K fertilizer enhances alfalfa growth and yieldDetermine how yield components change in response to improved fertilityExamine the link between root physiology and alfalfa performanceDetermine critical tissue nutrient levels

Experimental Details
Fertilizer treatments: 0, 100, 200, 300, 400 kg K/ha/year0, 25, 50, 75 kg P/ha/year Factorial arrangement: 20 treatments½ applied in May; rest in September
Four forage harvests/yearRoots dug in May and December
CountsLab analyses


Conventional Wisdom Regarding the Impact of P and K on Alfalfa
Addition of P and K will improve alfalfa yield by increasing plant persistence, and as stands thin, increased shoots/plant.Alfalfa plants die primarily during the winter.Addition of K (and P?) increases root reserves, which enhances winter hardiness.Critical values of P and K in alfalfa herbage are 2.5 mg P/g and 20 mg K/g.

24
27
30
33
36
0100
200300
400
050
100150D
ry M
atte
r Yie
ld, t
ons/
acre
Pounds K 2O applied/acre
Pounds P2 O
5 applied/acre
Yield 1998-2002

Potassium, kg/ha0 100 200 300 400
Phos
phor
us, k
g/ha
0
25
50
754000 4500 5000 5500 6000
Potassium, kg/ha0 100 200 300 400
Phos
phor
us, k
g/ha
0
25
50
753400 3600 3800 4000 4200 4400 4600
Potassium, kg/ha0 100 200 300 400
Phos
phor
us, k
g/ha
0
25
50
752800 3000 3200 3400 3600 3800
Potassium, kg/ha0 100 200 300 400
Phos
phor
us, k
g/ha
0
25
50
751600 1800 2000 2200 2400 2600 2800
Harvest 1Harvest 2
Harvest 3 Harvest 4

400 K, 0 P
0 K, 75 P 200 K, 50 P
300 K, 0 P

Concentration, % K1.0 1.5 2.0 2.5 3.0
Yiel
d, %
of m
axim
um
30
40
50
60
70
80
90
100
110
Tissue K and Harvest 1 Yield Response

Concentration, % K0.5 1.0 1.5 2.0 2.5
Yiel
d, %
of m
axim
um
50
60
70
80
90
100
110
Tissue K and Harvest 4 Yield Response


Phosphorus Critical Value
Phophorus Concentration, mg P/g tissue0.5 1.0 1.5 2.0 2.5 3.0 3.5 4.0
Yiel
d, %
of m
axim
um y
ield
20
40
60
80
100
120

How Does P/K Alter Forage Yield?
Yield=plants/area x shoots/plant x mass/shoot
Conventional Wisdom:“Addition of P and K will improve alfalfa yield by
increasing plant persistenceand as stands thin, increased shoots/plant.”
40 shootsper square
foot

Stems/m2
0 200 400 600 800 1000 1200 1400 1600 1800
Yiel
d kg
/ha
0
1000
2000
3000
4000
5000
6000
7000
8000
200020012002
40 shoots/ft2
Forage Yield is Not Associated with Stems/Area

Mass/shoot, g0.0 0.5 1.0 1.5 2.0
Yiel
d, k
g/ha
0
1000
2000
3000
4000
5000
6000
7000
80001998 y=5500x.84
R2=0.84
1999 y=4897x.56 R2=0.94
2000 y=4230x.78 R2=0.90
2001 y=3430x.37 R2=0.24
2002 y=3531x.62 R2=0.58
Forage Yield is Associated with High Mass/Shoot

Mass/shoot Increases with K and P

Rapid Shoot Initiation After Harvest
200 K, 0 P 300 K, 0 P
200 K, 25 P 400 K, 50 P

Dec-97May-98
Dec-98May-99
Dec-99May-00
Mar-01May-01
Dec-01May-02
Dec-02
Plan
ts p
er m
2
0
100
200
300
400
500
Plant populations decline over summer (May to Dec.) and not over winter (Dec. to May)
"Critical" densityof 4 plants/ft2

May-99Dec.-99
May-00May-01
Dec.-01May-02
Dec.-02
Plan
ts p
er ft
2
0
5
10
15
20
0 P 25 P50 P75 P

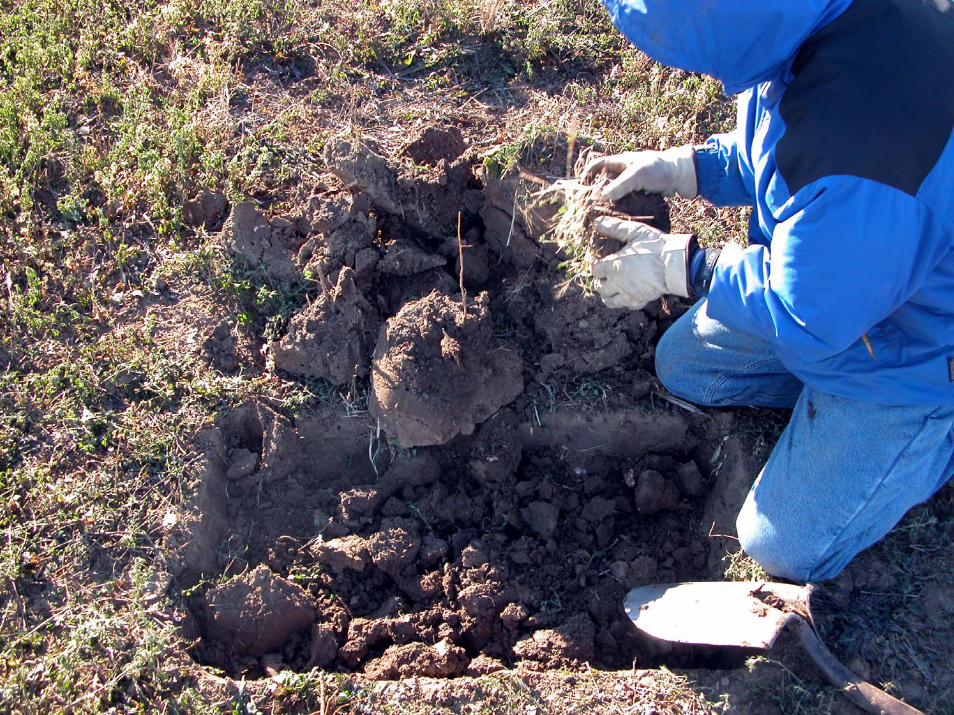
Alfalfa Taproot – Crown Complex
Low P and K High P and K

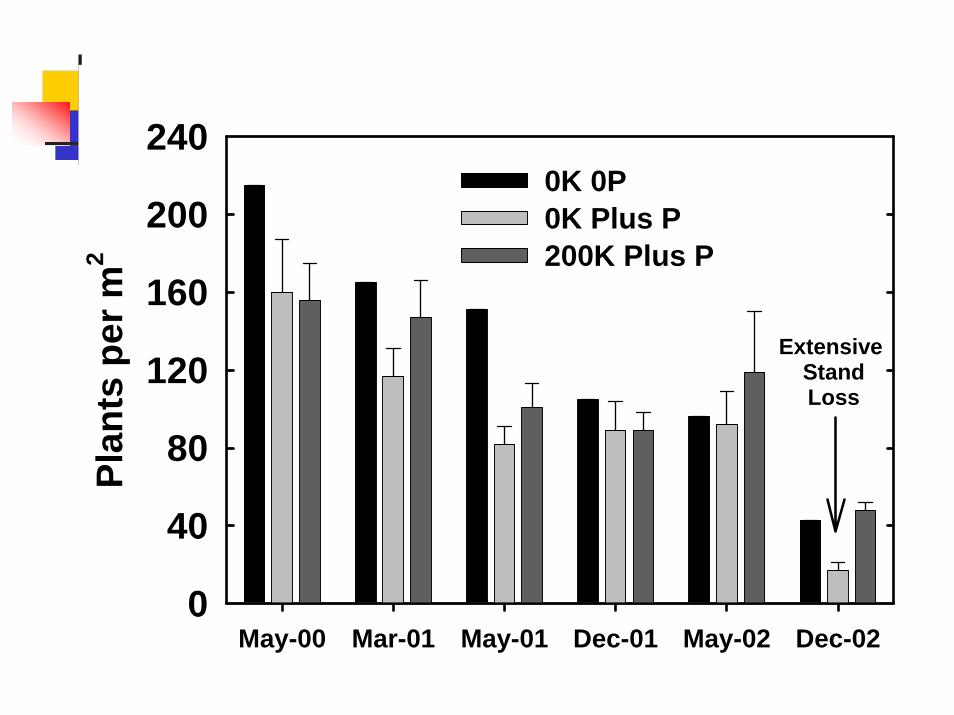
May-00 Mar-01 May-01 Dec-01 May-02 Dec-02
Plan
ts p
er m
2
0
40
80
120
160
200
2400K 0P0K Plus P200K Plus P
Extensive StandLoss

No K Plus P

May-00 Mar-01 May-01 Dec-01 May-02
Roo
t Sug
ar, m
g/g
dry
wt.
0
40
80
120
160
200
2400K 0P0K Plus P200K Plus P

May-00 Mar-01 May-01 Dec-01 May-02
Roo
t Sta
rch,
mg/
g dr
y w
t.
0
50
100
150
200
250
300
3500K 0P0K Plus P200K Plus P

May-00 May-01 Dec-01 May-02
Roo
t Am
ino
Aci
ds, m
g/g
dry
wt.
0.00
0.05
0.10
0.15
0.20
0.25
0.300K 0P0K Plus P200K Plus P

ConclusionsYield Increased With Added P and K
- Seasonal K Response- Enhanced Mass/shoot- No Change in Shoots/area- Decline in Plants/area With P
Critical Tissue P and K Levels- 2.5 mg/g (0.25%) for P (OK)- 15 mg/g (1.5 %) for K (Low)

ConclusionsPlant Persistence
- Plants Die Over Summer- No K Effect- P Enhances Stand Losses- P x K Imbalance Fatal- Low Starch and Amino Acid
Levels in Taproots

Next PhaseLarger Plots
Frequent Summer SamplingDetailed Root Analyses 0K 0P
0K 75P
0K 0P
400K 75P