physics introduction - linville's science classes ... introduction.pdf · science 10 physics...
TRANSCRIPT

Science 10 Physics Introduction
Real smart physics guy
Real tough physics equations
What is Physics?► Investigates the relationship between matter and
energy
► “How the universe works”


Measurements & Units
► fundamental units are the building blocks of all other measurements
►Use SI (le Système International d'unités )
► the common SI fundamental units are metre, kilogram, second
► derived units are units made from combinations of fundamental units: speed, acceleration, force, etc.

Derived units
► Speed m/s, km/h
► Energy Joule
►Acceleration m/s2

Accuracy & Precision
►Accuracy refers to how closely a measured value agrees with the correct value.
►precision of a measurement is refers to how close the agreement is between repeated measurements
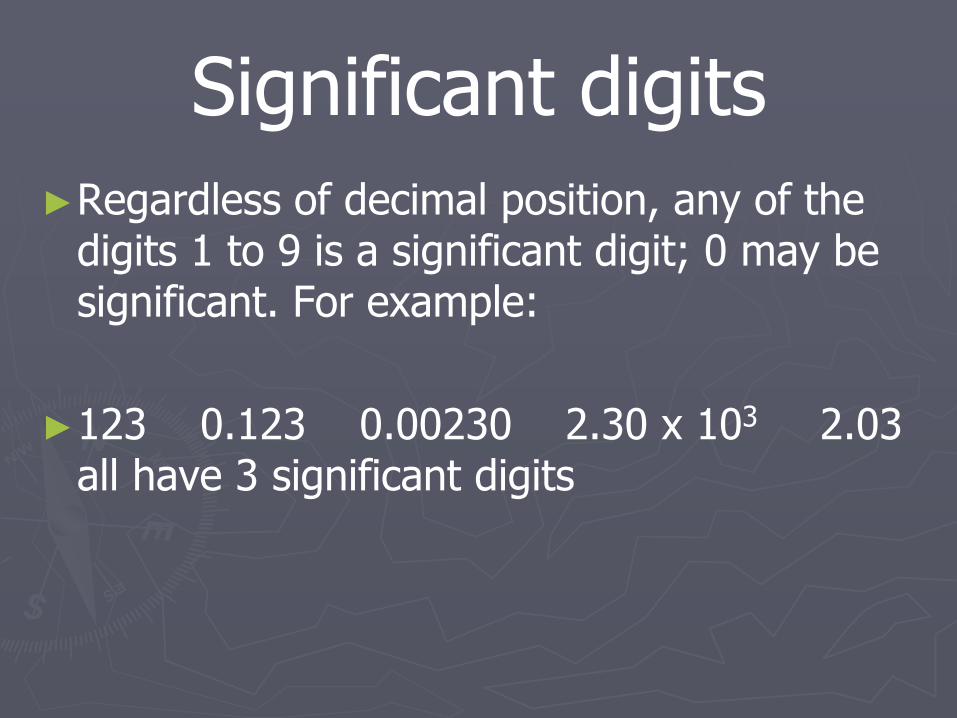
Significant digits
►Regardless of decimal position, any of the digits 1 to 9 is a significant digit; 0 may be significant. For example:
►123 0.123 0.00230 2.30 x 10³ 2.03all have 3 significant digits
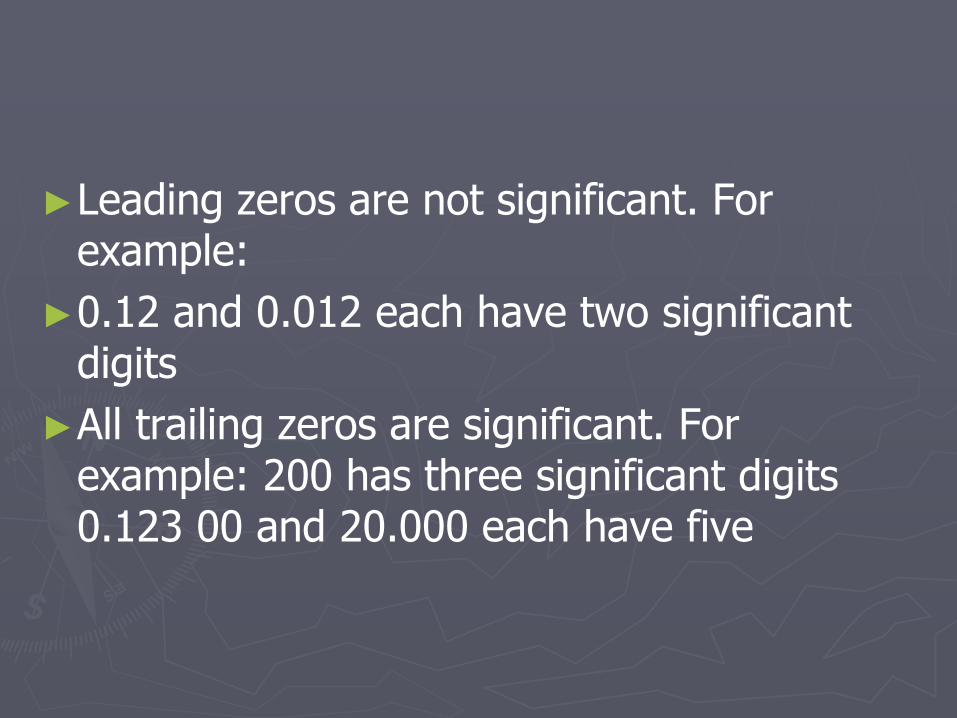
►Leading zeros are not significant. For example:
►0.12 and 0.012 each have two significant digits
►All trailing zeros are significant. For example: 200 has three significant digits0.123 00 and 20.000 each have five
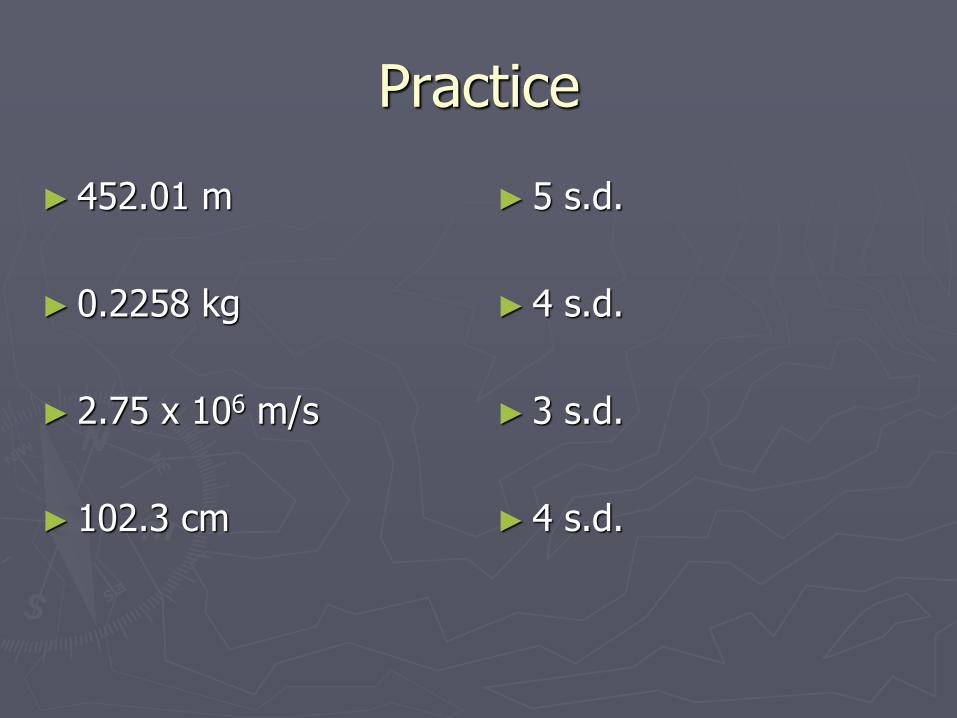
Practice
► 452.01 m
► 0.2258 kg
► 2.75 x 10⁶ m/s
► 102.3 cm
► 5 s.d.
► 4 s.d.
► 3 s.d.
► 4 s.d.

Final Answers & Sig Digs
►When multiplying or dividing, round your final answer to the least number of s.d.found in the question (don’t forget the units)
►4.20 mol x 18.01 g/mol = 75.6 g

Final Answers & Sig Digs
►When adding or subtracting, round your final answer to the least number of decimal places found in the question (don’t forget the units)
►11.2 cm + 5.27 cm = 16.47 cm (16.5 cm is correct)
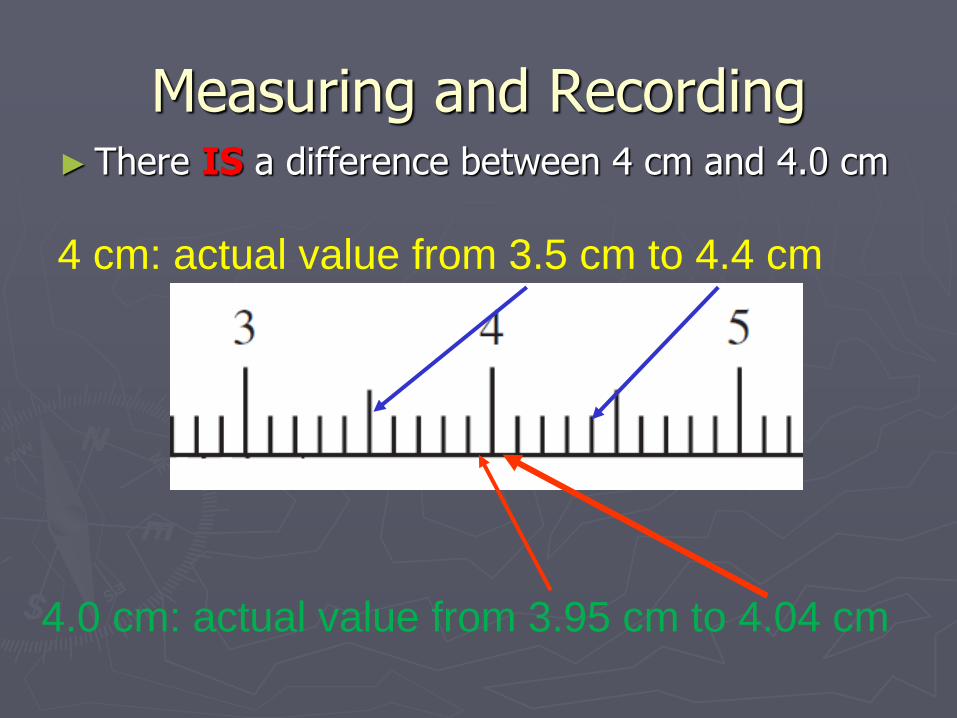
Measuring and Recording►There IS a difference between 4 cm and 4.0 cm
4 cm: actual value from 3.5 cm to 4.4 cm
4.0 cm: actual value from 3.95 cm to 4.04 cm

Scientific Notation
►A number between 1 and 10 multiplied by some power of 10
►4159.25 = 4.15923 x 10³
►0.02654 = 2.654 x 10⁻²
Common SI Prefixes
►kilo = 103
►milli = 10-3

Scientific Notation
►3.00 x 10⁸ m/s
►9.11 x 10⁻³¹ kg

Practice
►Express each of the following to 3 significant digits.
►
2.928 x 10⁴ m/s
►
25.139 N
►
0.3800 kg
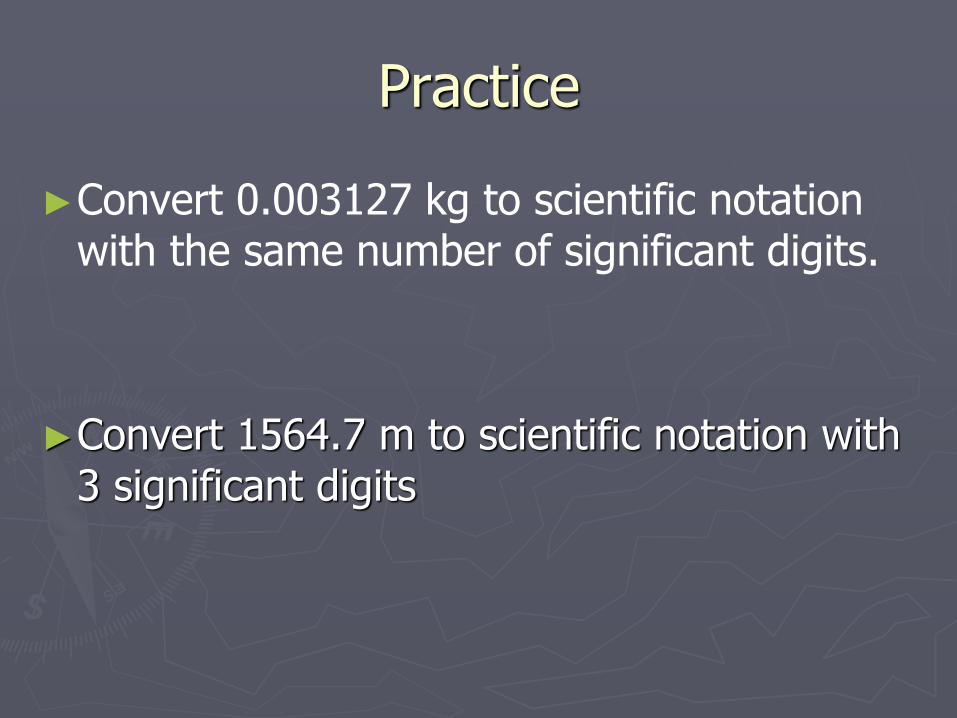
Practice
►Convert 0.003127 kg to scientific notation with the same number of significant digits.
►Convert 1564.7 m to scientific notation with 3 significant digits

►Convert the following measurements to the indicated units.
►
246.9 g _______kg
►
67.99 km _______ m
►
2.54 m ________ mm
►

Practice
►Convert 58.3 km/h to m/s

Practice
►2.50 moles x 6.02 x 10²³ atoms/mol = ?
►How to use scientific notation on your calculator
►1.505 x 1024 atoms
►1.51 x 1024 atoms

Practice
►Light travels at 3.00 x 10⁸ m/s, how km does light travel in 22.0 s?
►d = vt
►d = 3.00 x 10⁸ m/s x 22.0 s
►d = 6.60 x 10⁹ m
►d = 6.60 x 10⁶ km
Units
►Think about the number AND units of your answer:
►is it logical for a car to take 3.55 x 10¹⁷ s to drive to Calgary at 123 km/h?
►NO! Just how many years is this much time? The age of the universe is 14 billion years (1.4 x 10¹⁰ a)
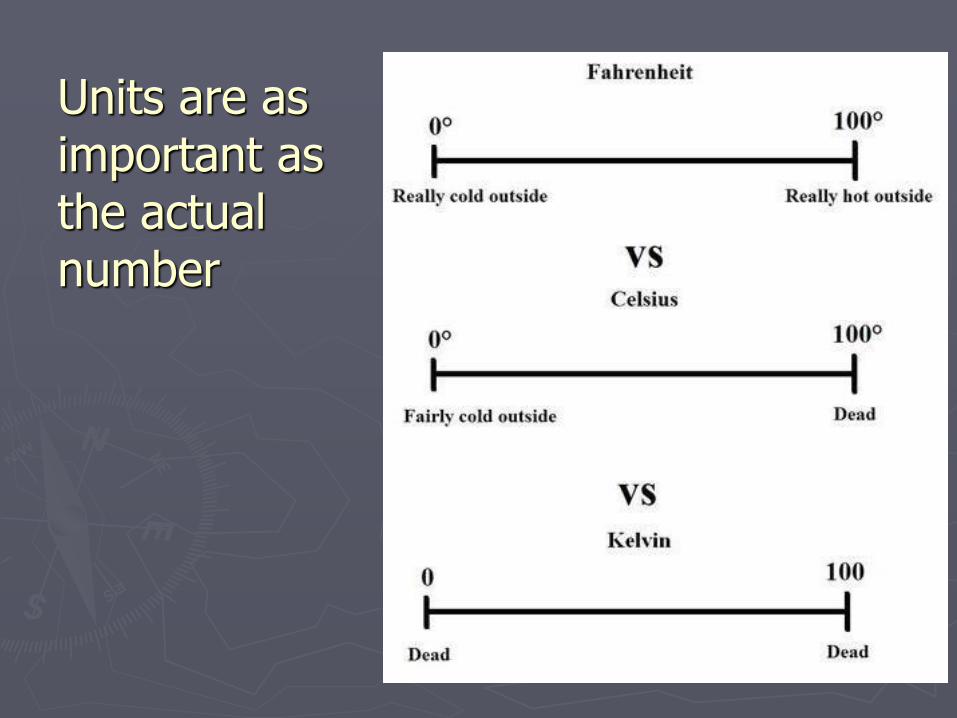
Units are as important as the actual number

► Speed of a falling object 340 m/s (speed of sound, 1224 km/h)
►Any speed close to or faster than 3.00 x 10⁸ m/s (speed of light! There’s NOTHING FASTER!)
►Distance of 1.50 x 10¹¹ m (Distance from Earth to sun)
►A distance of 2 x 10-15 m(size of a proton)
Answers to think about
Graphing
► graphing data is part of data analysis
►The manipulated variable should be plotted on the horizontal axis, and the responding variable should be plotted on the vertical axis
►The scale for each axis should be set so that it evenly distributes the measured data using as much of the graph as possible. Scales should be easy to read and evenly divided.
►

Graphing
►All axes must be labelled with the variable used and with complete units.
►The graph must have a clear title. This is usually stated as “Responding versus Manipulated” variable, with a further descriptor to help identify the data.
►Each data point must be plotted. A small circle may be drawn around each plotted point to indicate that it is a data point.

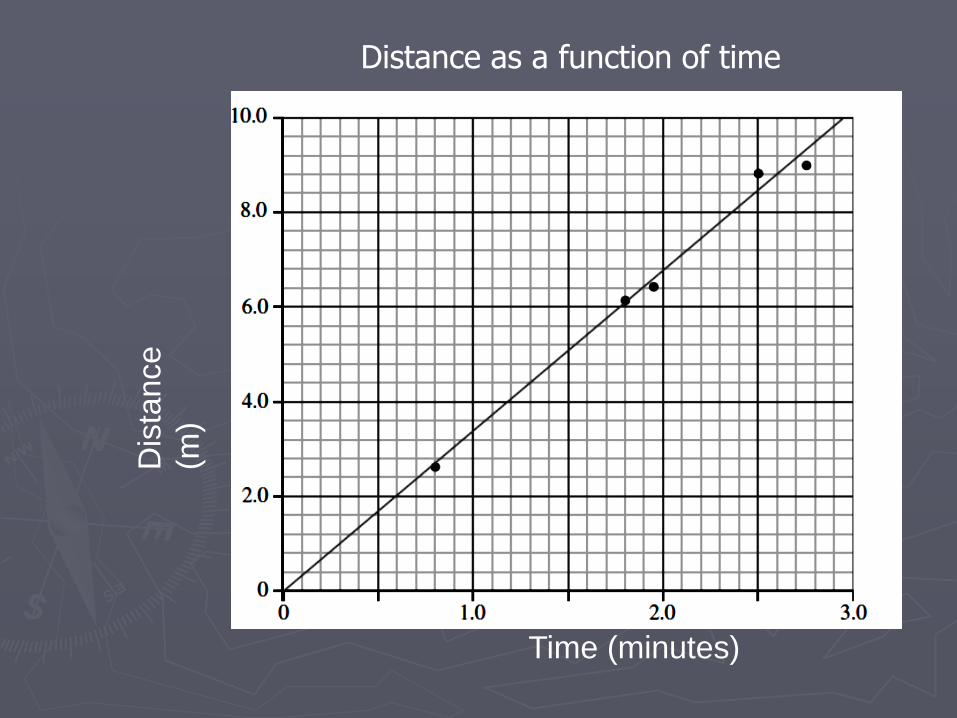
Lines of Best Fit
►Best-fit lines or curves pass through or as close to as many data points as possible.
►Best-fit lines do not necessarily include the origin.
Time (minutes)
Dis
tance
(m)
Distance as a function of time

Line of best fit that doesn’t go through any data points

Distance as a function of timeD
ista
nce (
m)
Time (minutes)

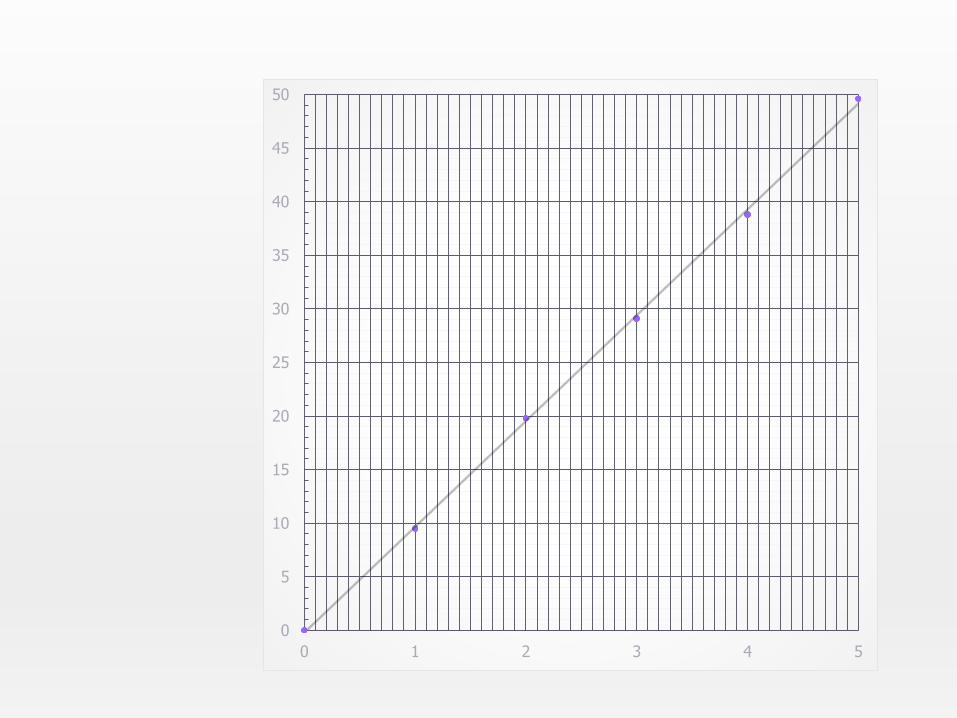
Practice GraphingTime (s) Distance
(m)
0.0 0.0
1.0 9.7
2.0 19.8
3.0 29.1
4.0 38.8
5.0 49.2

0
5
10
15
20
25
30
35
40
45
50
0 1 2 3 4 5
0
5
10
15
20
25
30
35
40
45
50
0 1 2 3 4 5

Slope
►𝑠𝑙𝑜𝑝𝑒 =𝑟𝑖𝑠𝑒
𝑟𝑢𝑛=
𝑦2−𝑦1
𝑥2−𝑥1=
∆𝑦
∆𝑥
►Always use points on the line that can be read easily.
►The points selected should be far apart on the line of best fit
►The origin should not be assumed to be a suitable point.
►Units and powers of 10 given on the axes MUST be included in the calculation and final answer.

►Significant digits for the slope are determined by the precision of the observations recorded in the data table

Slope Example
Time (s)
Would these points be good for a slope calculation?
x
y
x1, y1
x2, y2

Slope Example
Time (s)
Would these points be good for a slope calculation?
x1, y1
x2, y2

Solution
►𝑠𝑙𝑜𝑝𝑒 =𝑦2−𝑦1
𝑥2−𝑥1
►𝑠𝑙𝑜𝑝𝑒 =1.10𝑚−0.30𝑚
3.80𝑠−1.00𝑠
►Slope = 0.29 m/s
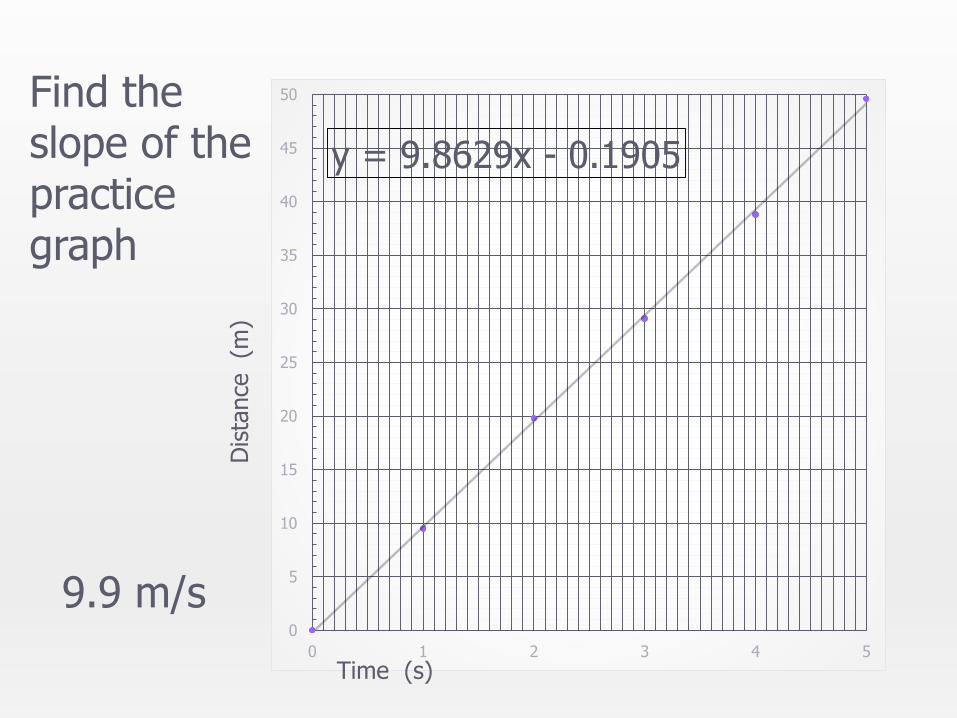
y = 9.8629x - 0.1905
0
5
10
15
20
25
30
35
40
45
50
0 1 2 3 4 5
Find the slope of the practice graph
9.9 m/s
Time (s)
Dis
tance
(m
)

y = 9.8629x - 0.1905
0
5
10
15
20
25
30
35
40
45
50
0 1 2 3 4 5
How far was the object at t = 2.2 s?
About 22 m
Time (s)
Dis
tance
(m
)

►Interpolation: obtaining a value between know data points
►Extrapolation: the extension of a graph, curve, or range of values by inferring unknown values from trends in the known data.