physics at rhic results from the rhic star experiment
DESCRIPTION
Physics at RHIC Results from the RHIC STAR Experiment. Motivation for studying Relativistic Heavy Ion Collisions RHIC and the STAR experiment Soft Physics from STAR Hard Physics from STAR Summary. Outline. Why heavy ion collisions?. The “little bang”. - PowerPoint PPT PresentationTRANSCRIPT

STAR
Tom HumanicThe Ohio State
University
FNAL --Feb 2003
Physics at RHIC
Results from the RHIC STAR Experiment

Outline
• Motivation for studying Relativistic Heavy Ion Collisions
• RHIC and the STAR experiment
• Soft Physics from STAR
• Hard Physics from STAR
• Summary

Why heavy ion collisions?
• Study bulk properties of nuclear matter
The “little bang”
• Extreme conditions (high density/temperature) expect a transition to new phase of matter…
• Quark-Gluon Plasma (QGP)• partons are relevant degrees of freedom over
large length scales (deconfined state)
• believed to define universe until ~ s
• Heavy ion collisions ( “little bang”)• the only way to experimentally probe
deconfined state
• Study of QGP crucial to understanding QCD• low-q (nonperturbative) behaviour
• confinement (defining property of QCD)
• nature of phase transition

The “little bang”
Stages of the collision
• pre-equilibrium (deposition of initial energy)• rapid (~1 fm/c) thermalization (?)• high-pT observables probe this stage
QGP formation (?)
hadronic rescattering
hadronization transition(very poorly understood)
Chemical freeze-out: end of inelastic scatteringsKinetic freeze-out: end of all scatterings
• low-pT hadronic observables probe this stage
Does “end result” look about the samewhether a QGP was formed or not???
tim
etem
perature
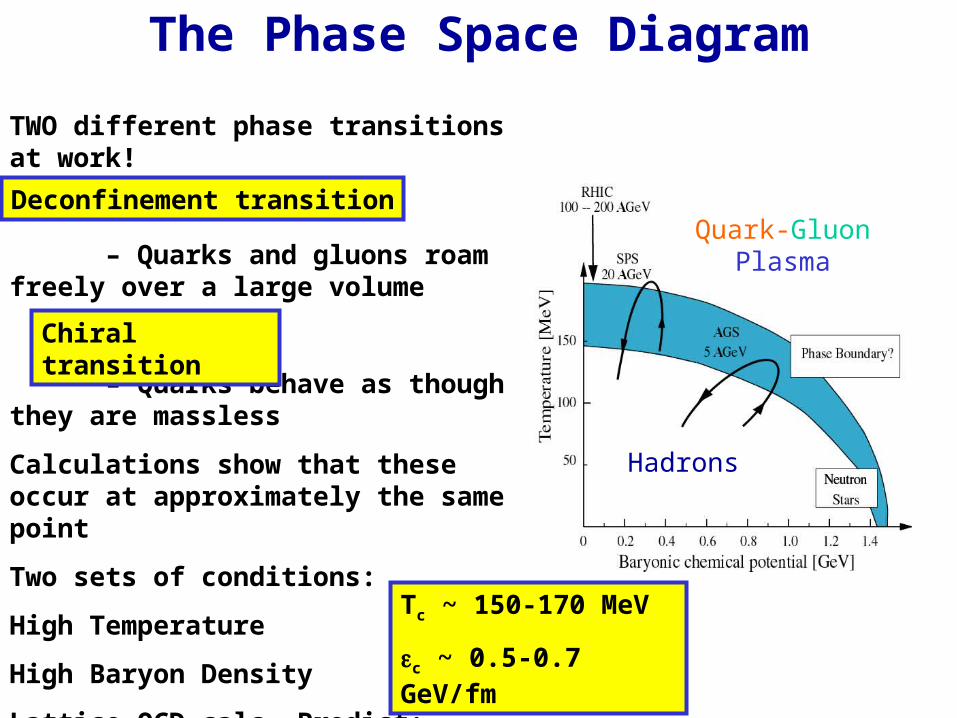
The Phase Space Diagram
TWO different phase transitions at work!
– Quarks and gluons roam freely over a large volume
– Quarks behave as though they are massless
Calculations show that these occur at approximately the same point
Two sets of conditions:
High Temperature
High Baryon Density
Lattice QCD calc. Predict:
Tc ~ 150-170 MeV
c ~ 0.5-0.7 GeV/fm
Deconfinement transition
Chiral transition
Quark-GluonPlasma
Hadrons
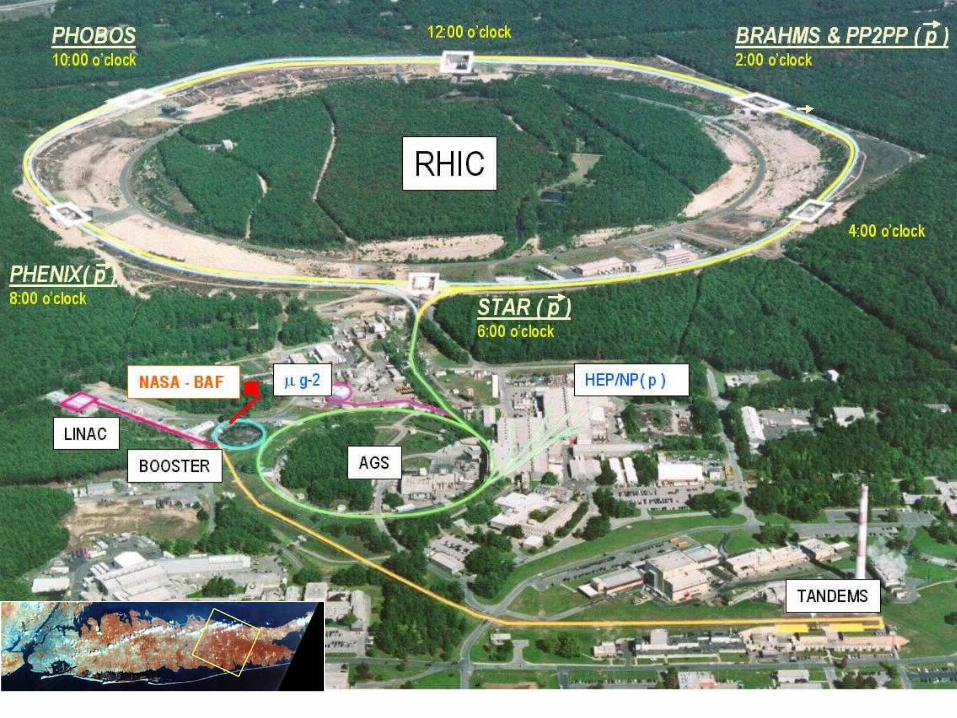

• Beam energy up to 100 GeV/A (250 GeV for p);
• Two independent rings (asymmetric beam collisions are possible);
• Beam species: from proton to Au;
• Six interaction points: STAR, PHENIX, PHOBOS and BRAHMS
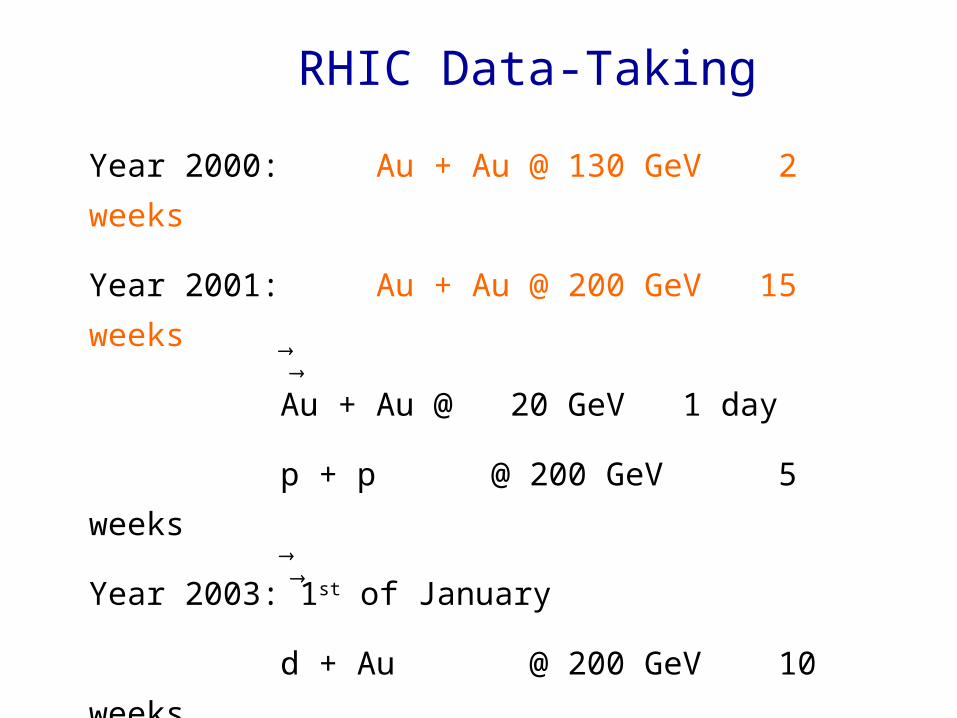
RHIC Data-Taking
Year 2000: Au + Au @ 130 GeV 2 weeks
Year 2001: Au + Au @ 200 GeV 15 weeks
Au + Au @ 20 GeV 1 day
p + p @ 200 GeV 5 weeks
Year 2003: 1st of January
d + Au @ 200 GeV 10 weeks
p + p @ 200 GeV (5) + 3 weeks

Russia: MEPHI – Moscow, LPP/LHE JINR–Dubna, IHEP-Protvino
U.S. Labs: Argonne, Berkeley, Brookhaven National Labs
U.S. Universities: Arkansas, UC Berkeley, UC Davis, UCLA, Carnegie Mellon, Creighton, Indiana, Kent State, MSU, CCNY, Ohio State, Penn State, Purdue,Rice, Texas A&M, UT Austin, Washington, Wayne State, Yale
Brazil: Universidade de Sao Paolo
China: IHEP - Beijing, IPP - Wuhan
England: University of Birmingham
France: Institut de Recherches Subatomiques Strasbourg, SUBATECH - Nantes
Germany: Max Planck Institute – Munich University of Frankfurt
Poland: Warsaw University, Warsaw University of Technology
Institutions: 36 Collaborators: 415
The Ohio State U. GroupProfs: PostDocs: Students:T.Humanic D.Majestro S.Bekele M.Lisa B. Nilsen M.Lopez-
NoriegaE.Sugarbaker I. Kotov R.Wells
R.Willson
The STAR Collaboration
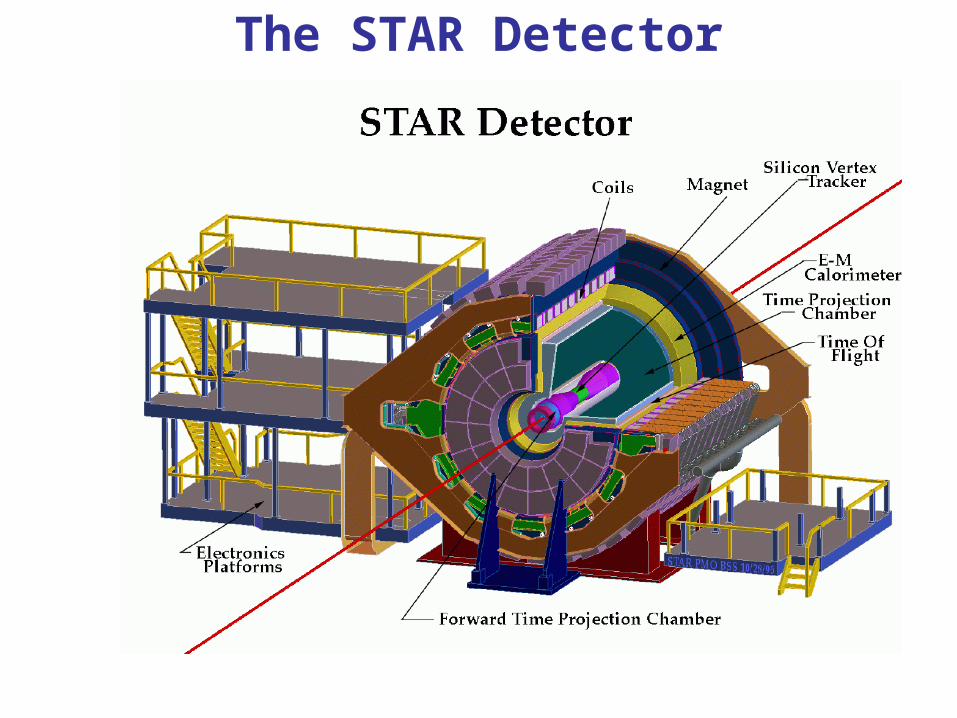
The STAR Detector

The STAR Detector
• Year 2000, year 2001, year-by-year until 2003, installation in 2003
ZCal
Silicon Vertex Tracker *
Central Trigger Barrel+ TOF patch
FTPCs (1 + 1)
Time Projection Chamber
Vertex Position Detectors
Magnet
Coils
RICH * yr.1 SVT ladder
Barrel EM Calorimeter
TPC Endcap & MWPC
Endcap Calorimeter
ZCal
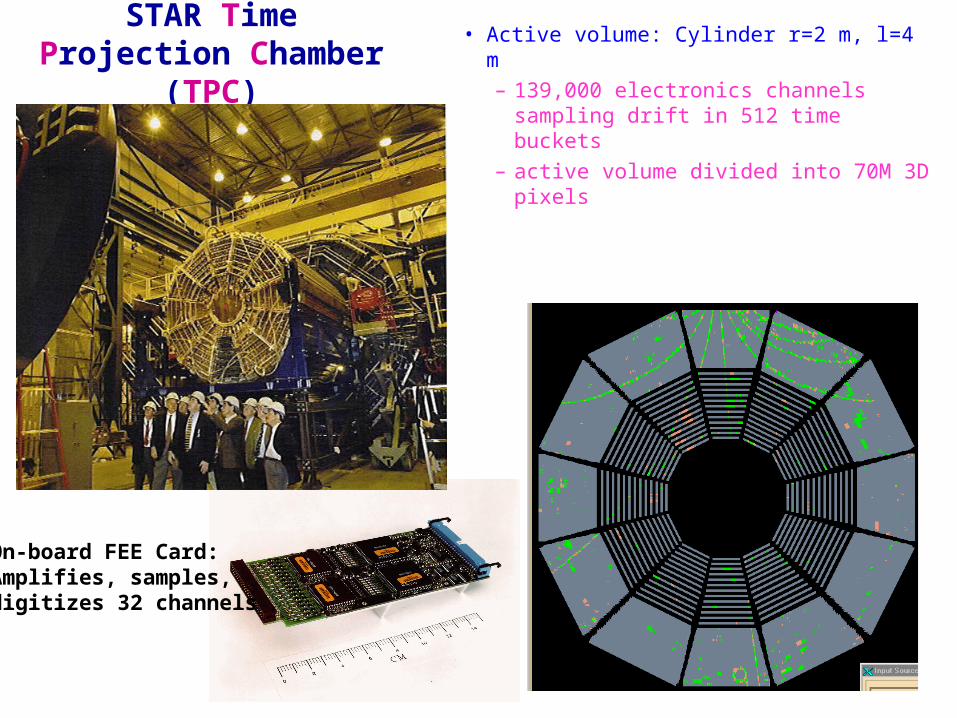
STAR Time Projection Chamber
(TPC)
• Active volume: Cylinder r=2 m, l=4 m
– 139,000 electronics channels sampling drift in 512 time buckets
– active volume divided into 70M 3D pixels
On-board FEE Card:Amplifies, samples, digitizes 32 channels

Spectators – Definitely going down the beam line
Participants – Definitely created moving away from beamline
Triggering/Centrality
ImpactParameter
Spectators
Spectators
Zero-Degree Calorimeter
Participants
Several meters

Spectators – Definitely going down the beam line
Participants – Definitely created moving away from beamline
Triggering/Centrality
ImpactParameter
Spectators
Spectators
Zero-Degree Calorimeter
Participants
Several meters
• “Minimum Bias”ZDC East and West thresholds set to lower edge of single neutron peak.
REQUIRE:Coincidence ZDC East and West
• “Central”CTB threshold set to upper 15%
REQUIRE: Min. Bias + CTB over threshold
~30K Events |Zvtx| < 200 cm
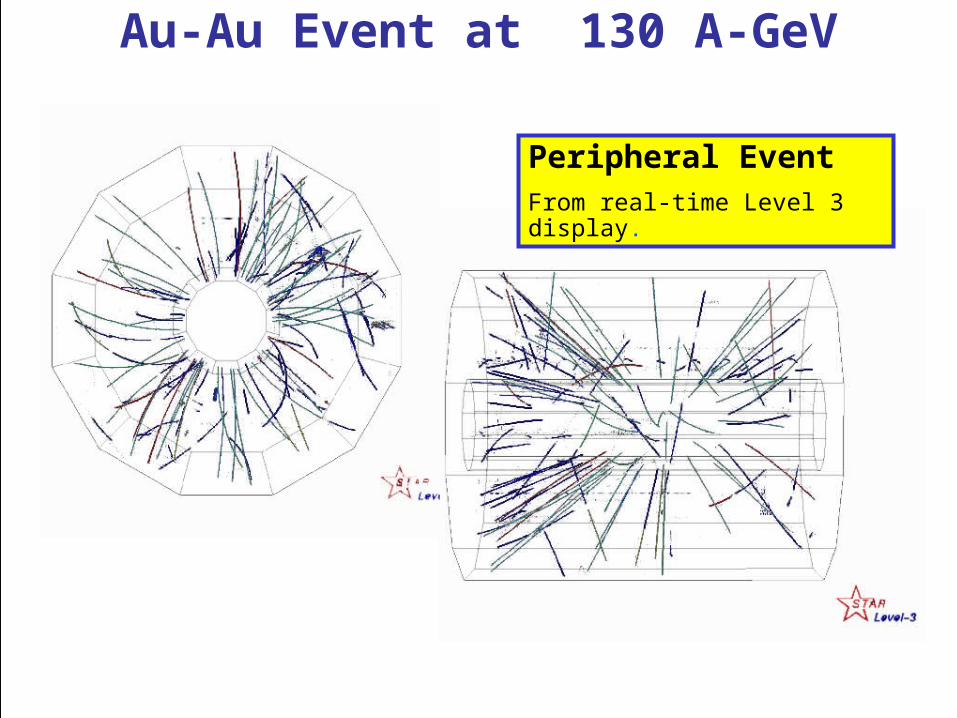
Au-Au Event at 130 A-GeV
Peripheral EventFrom real-time Level 3 display.
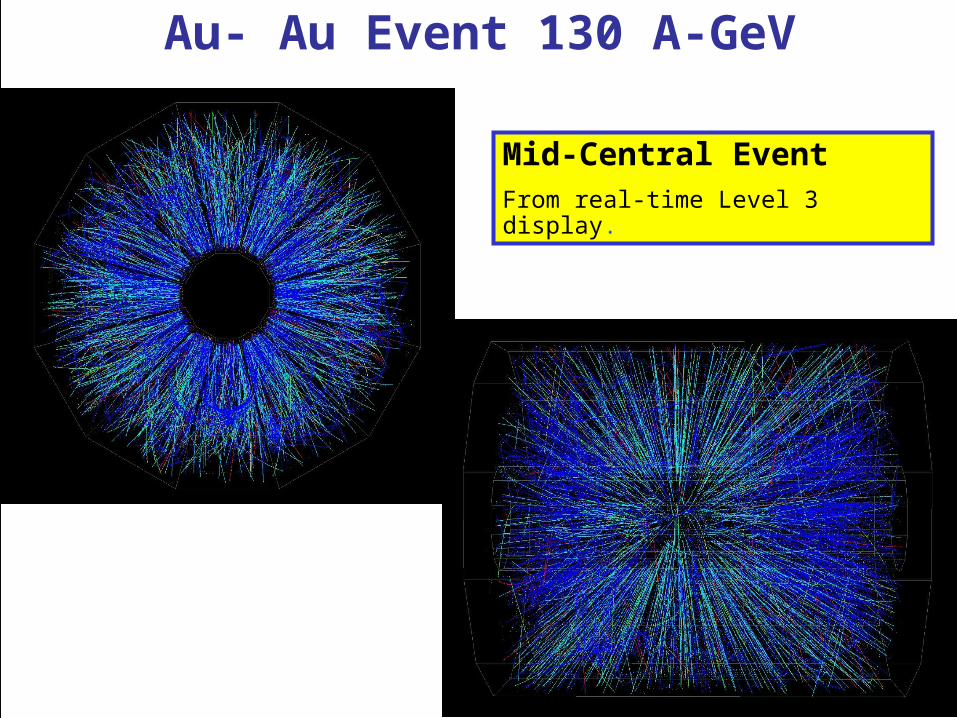
Au- Au Event 130 A-GeV
Mid-Central EventFrom real-time Level 3 display.
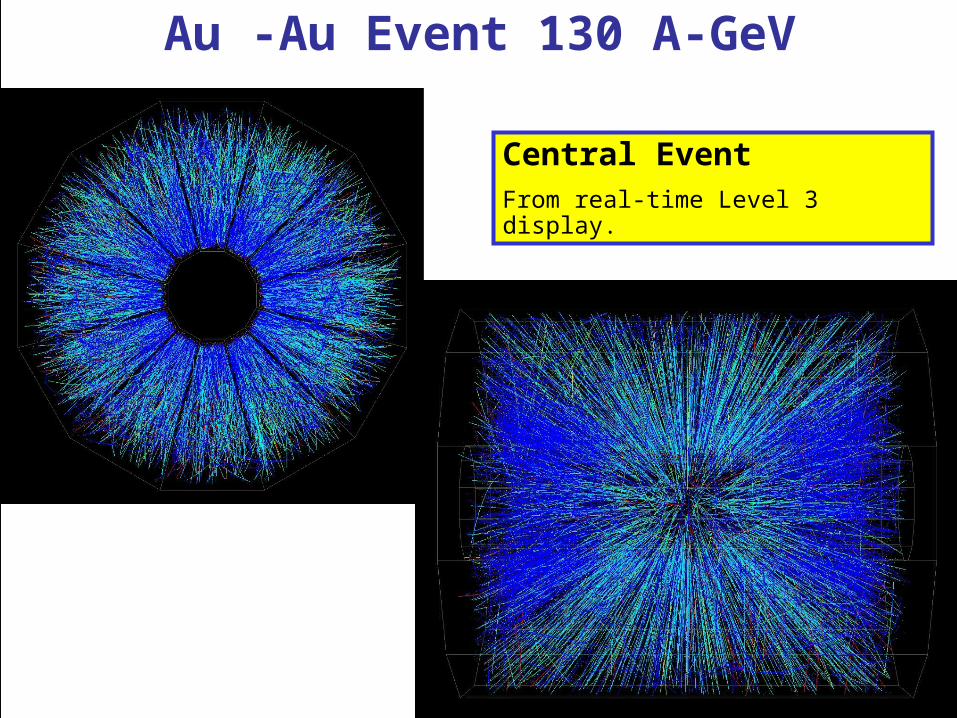
Au -Au Event 130 A-GeV
Central EventFrom real-time Level 3 display.

STAR Pertinent Facts (130 GeV)
Field:
0.25 T (Half Nominal value)
worse resolution at higher p
lower pt acceptance
TPC:
Inner Radius – 50cm
(pt>75 MeV/c)
Length – ± 200cm
( -1.5 1.5)
Events:
~300,000 “Central” Events –top 8% multiplicity
~160,000 “Min-bias” Events

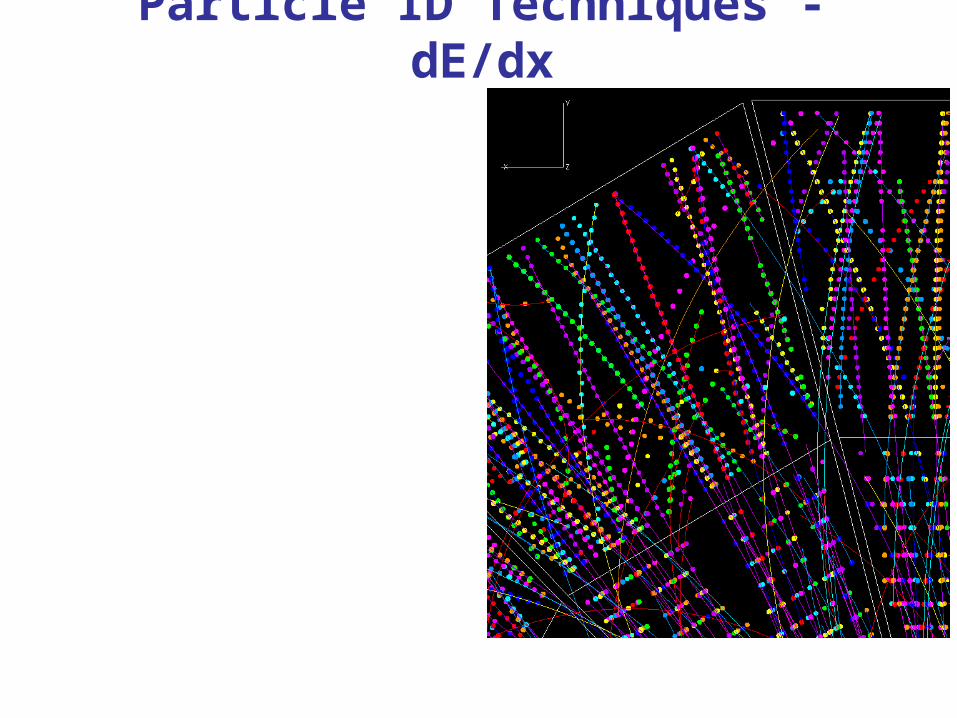
Needle in the Hay-Stack!
How do you do tracking in this regime?
Solution: Build a detector so you can zoom in close and “see” individual tracks
Good tracking efficiency
Clearly identify individual tracks
high resolution
Pt (GeV/c)
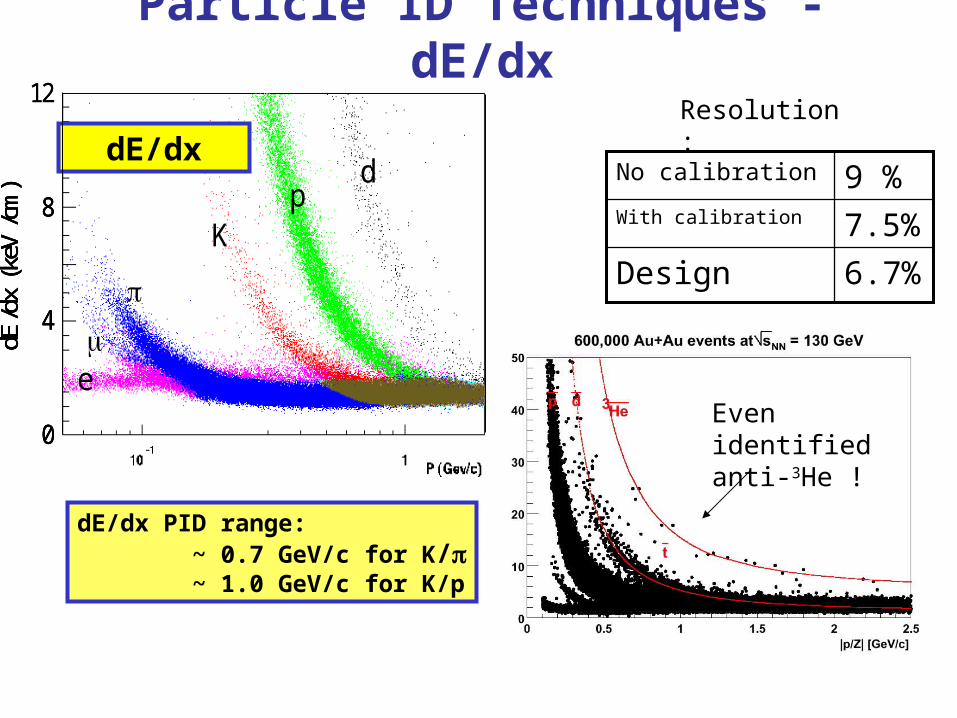
Particle ID Techniques - dE/dx

Particle ID Techniques - dE/dx
dE/dx PID range: ~ 0.7 GeV/c for K/ ~ 1.0 GeV/c for K/p
12
Kp
d
edE
/dx
(keV
/cm
)
0
8
4
12
Kp
d
edE
/dx
(keV
/cm
)
0
8
4
Kp
d
edE
/dx
(keV
/cm
)
0
8
4
dE/dx
Particle ID Techniques - dE/dx
dE/dx PID range: ~ 0.7 GeV/c for K/ ~ 1.0 GeV/c for K/p
12
Kp
d
edE
/dx
(keV
/cm
)
0
8
4
12
Kp
d
edE
/dx
(keV
/cm
)
0
8
4
Kp
d
edE
/dx
(keV
/cm
)
0
8
4
dE/dx
6.7%Design
7.5%With calibration
9 %No calibration
Resolution:
Even identified anti-3He !

Particle ID Techniques - Topology
Decay vertices
Ks + + -
p + -
p + +
- + -
+ + +
+ K -
“kinks”:
K +
Vo
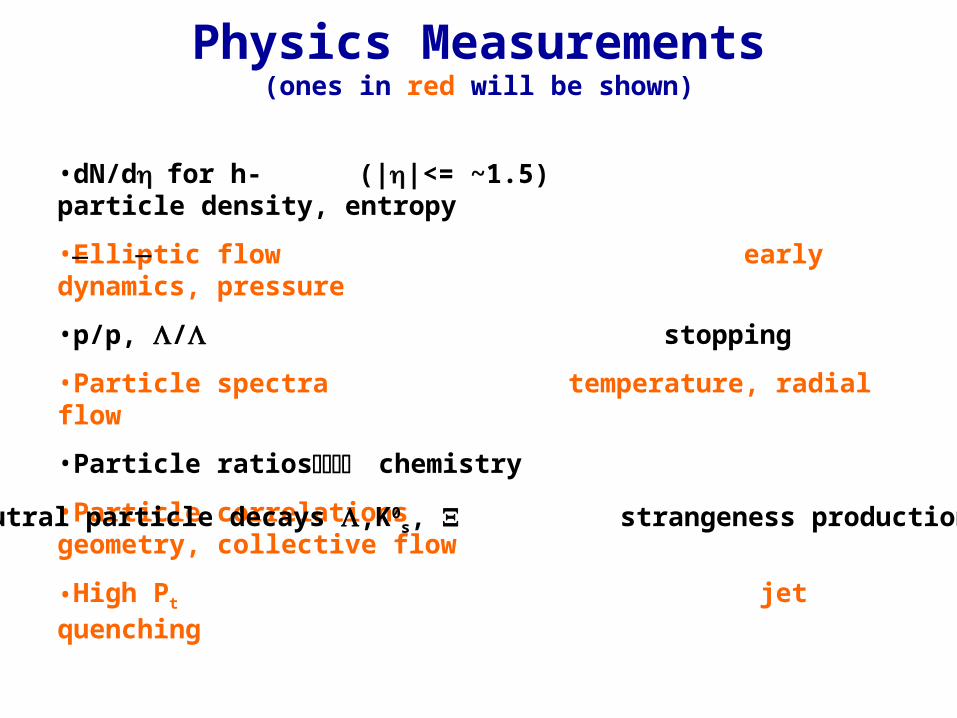
Physics Measurements(ones in red will be shown)
•dN/dfor h- (||<= ~1.5) particle density, entropy
•Elliptic flow early dynamics, pressure
•p/p, / stopping
•Particle spectra temperature, radial flow
•Particle ratioschemistry
•Particle correlations geometry, collective flow
•High Pt jet quenching
__
•Neutral particle decays ,K0s, strangeness production
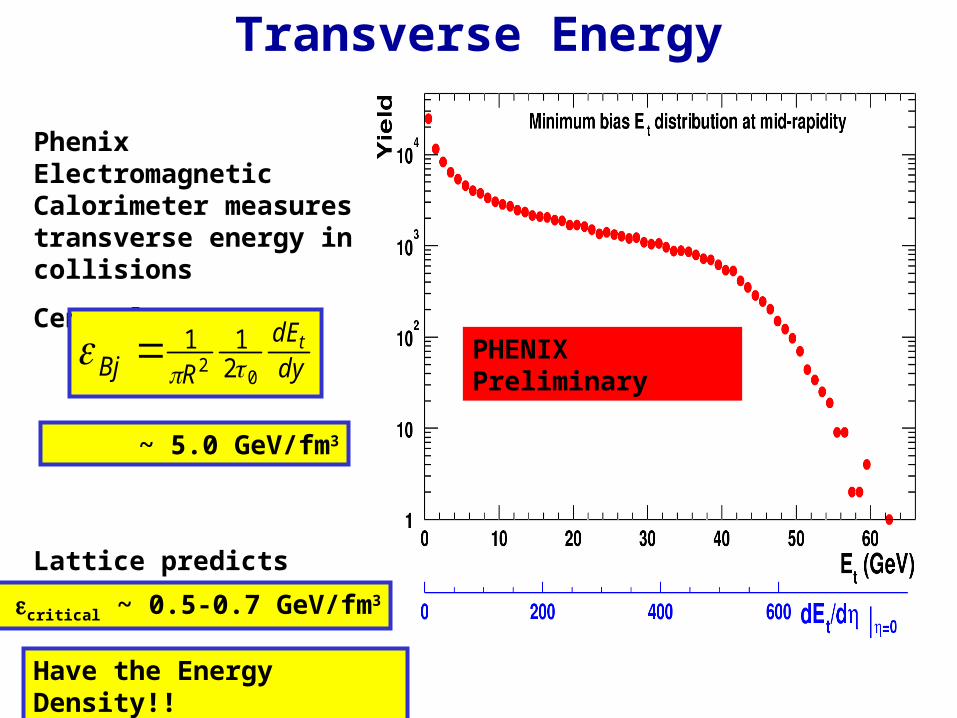
Transverse Energy
PHENIX Preliminary
Phenix Electromagnetic Calorimeter measures transverse energy in collisions
Central Events:
Lattice predicts transition at
~ 5.0 GeV/fm3
critical ~ 0.5-0.7 GeV/fm3
Have the Energy Density!!
dydE
RBjt
02 2
11

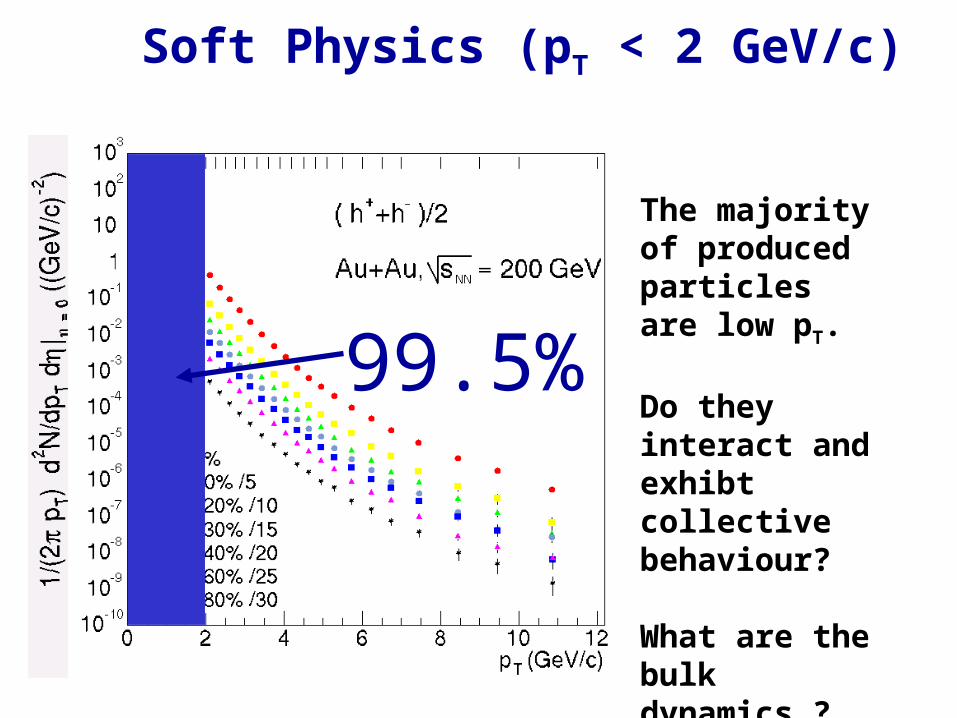
Soft Physics (pT < 2 GeV/c)
Soft Physics (pT < 2 GeV/c)
99.5%
The majority of produced particlesare low pT.
Do they interact and exhibt collective behaviour?
What are the bulk dynamics ?

Is there Thermalization?
Almond shape overlap region in coordinate space
y2 x2 y2 x2
2cos2 v
x
y
p
patan
Origin: spatial anisotropy of the system when created and rescattering of evolving systemprobe of the early stage of the collision
Look at “Elliptic” Flow

Elliptic Flow of Pions and Protonsfrom STAR (130 GeV)
• Hydrodynamic calculations: P. Huovinen, P. Kolb and U. Heinz
Mass dependence of v2(pt) shows a
behavior in agreement with hydro calculations,
which assumes a system in equilibrium

Charged particle elliptic flow 0< pt< 4.5 GeV/c from STAR(130
GeV)
Around pt > 2
GeV/c the data starts to deviate from hydro.
However, v2 stays
large.
Only statistical errors
Systematic error 10% - 20% for pt = 2 – 4.5 GeV/c

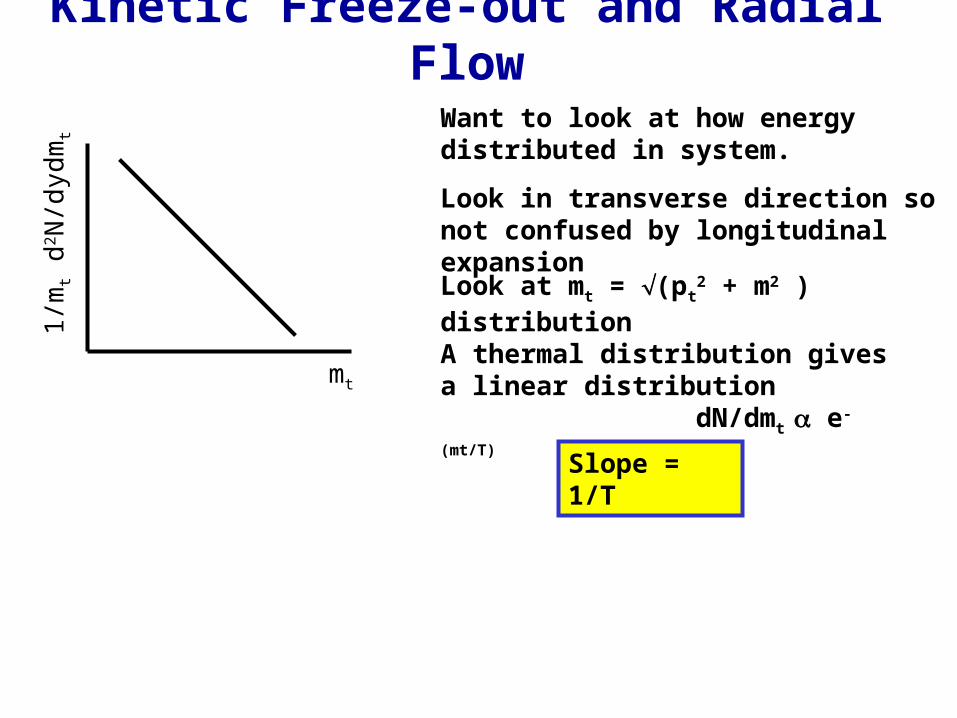
Kinetic Freeze-out and Radial Flow
Want to look at how energy distributed in system.
Look in transverse direction so not confused by longitudinal expansion
Kinetic Freeze-out and Radial Flow
Look at mt = (pt2 + m2 )
distributionA thermal distribution gives a linear distribution dN/dmt e-(mt/T)
mt
1/m
t d2N
/dyd
mt
Slope = 1/T
Want to look at how energy distributed in system.
Look in transverse direction so not confused by longitudinal expansion

Kinetic Freeze-out and Radial Flow
If there is transverse flow
Look at mt = (pt2 + m2 )
distributionA thermal distribution gives a linear distribution dN/dmt e-(mt/T)
mt
1/m
t d2N
/dyd
mt
Slope = 1/T
Slope = 1/Tmeas
~ 1/(Tfreeze out + 0.5moflow2)
Want to look at how energy distributed in system.
Look in transverse direction so not confused by longitudinal expansion
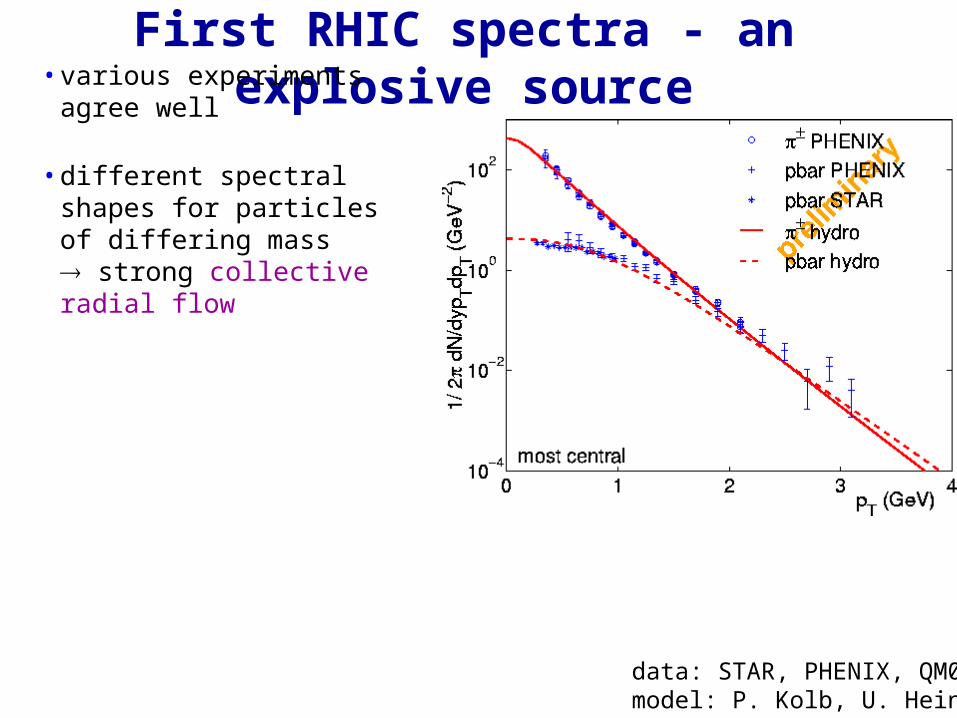
First RHIC spectra - an explosive source
data: STAR, PHENIX, QM01model: P. Kolb, U. Heinz
• various experiments agree well
• different spectral shapes for particles of differing mass strong collective radial flow

First RHIC spectra - an explosive source
data: STAR, PHENIX, QM01model: P. Kolb, U. Heinz
• various experiments agree well
• different spectral shapes for particles of differing mass strong collective radial flow
mT1/m
T d
N/d
mT
light
heavyT
purely thermalsource

First RHIC spectra - an explosive source
data: STAR, PHENIX, QM01model: P. Kolb, U. Heinz
• various experiments agree well
• different spectral shapes for particles of differing mass strong collective radial flow
mT1/m
T d
N/d
mT
light
heavyT
purely thermalsource
explosivesource
T,mT1/
mT d
N/d
mT
light
heavy

First RHIC spectra - an explosive source
data: STAR, PHENIX, QM01model: P. Kolb, U. Heinz
• various experiments agree well
• different spectral shapes for particles of differing mass strong collective radial flow
mT1/m
T d
N/d
mT
light
heavyT
purely thermalsource
explosivesource
T,mT1/
mT d
N/d
mT
light
heavy• good agreement with hydrodynamic
calculations

T = 190 MeV
T = 300 MeV
Tp = 565 MeV
mid-rapidity
mt slopes vs. Centrality
• Increase with collision centrality
consistent with radial flow: Tfreeze out=0.12 GeV, flow=0.6c
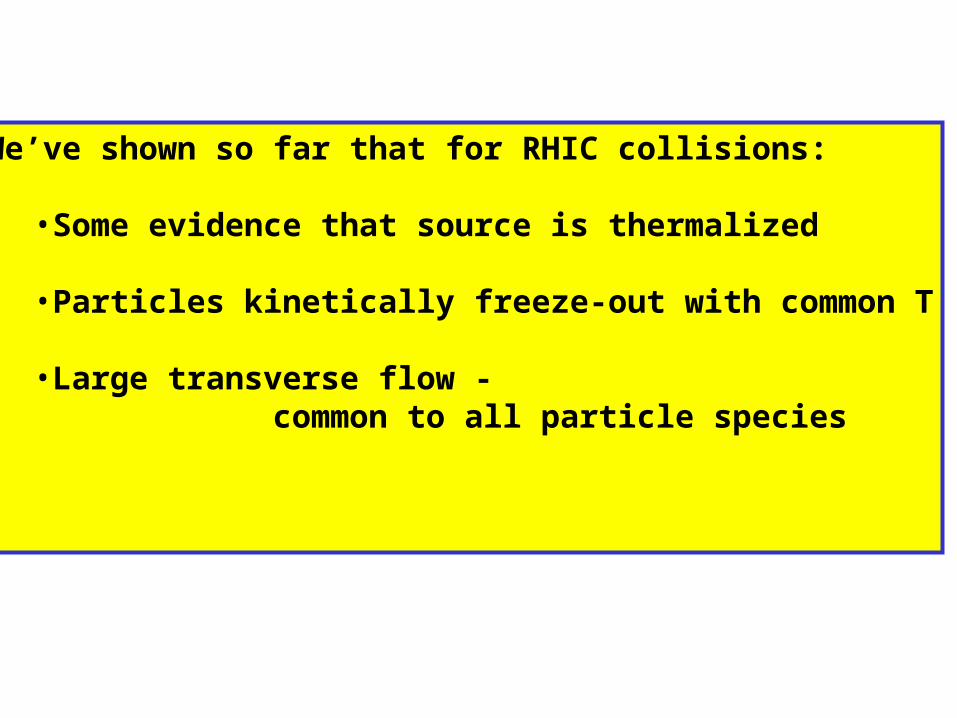
We’ve shown so far that for RHIC collisions:
•Some evidence that source is thermalized
•Particles kinetically freeze-out with common T
•Large transverse flow - common to all particle species

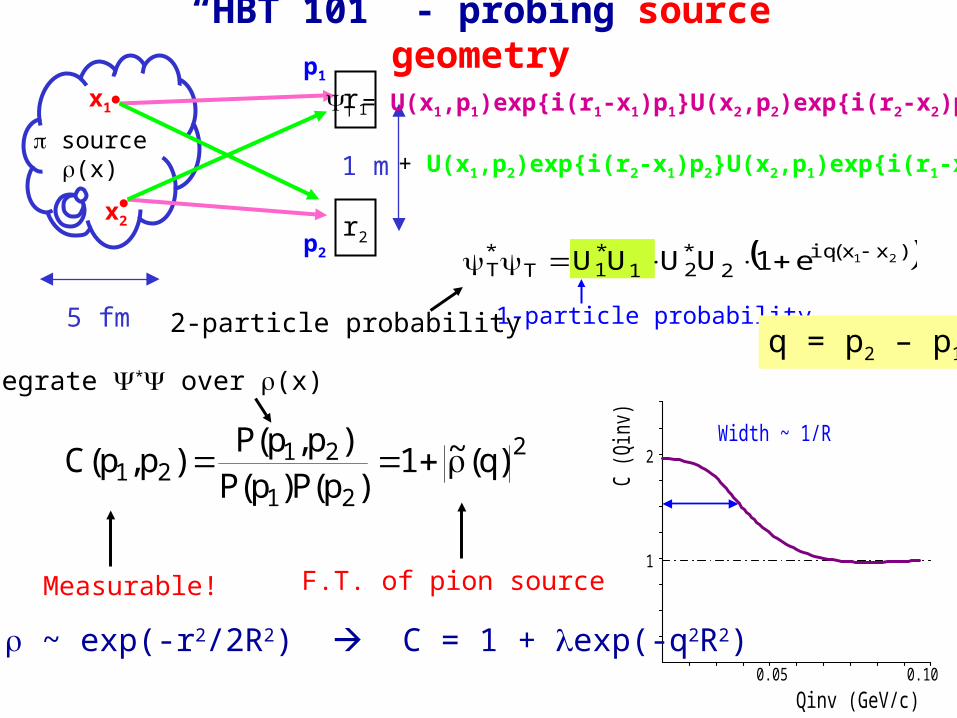
“HBT 101” - probing source geometry
5 fm
1 m source(x)
r1
r2
x1
x2
p1
p2
q = p2 – p1
T = U(x1,p1)exp{i(r1-x1)p1}U(x2,p2)exp{i(r2-x2)p2}
+ U(x1,p2)exp{i(r2-x1)p2}U(x2,p1)exp{i(r1-x2)p1}
Integrate * over (x)
e.g. ~ exp(-r2/2R2) C = 1 + exp(-q2R2)

“HBT 101” - probing source geometry
5 fm
1 m source(x)
r1
r2
x1
x2
p1
p2
12 ppq
1-particle probability
)xx(iq2
*21
*1T
*T
21e1UUUU
2-particle probabilityq = p2 – p1
T = U(x1,p1)exp{i(r1-x1)p1}U(x2,p2)exp{i(r2-x2)p2}
+ U(x1,p2)exp{i(r2-x1)p2}U(x2,p1)exp{i(r1-x2)p1}
Integrate * over (x)
e.g. ~ exp(-r2/2R2) C = 1 + exp(-q2R2)
“HBT 101” - probing source geometry
2
21
2121 )q(~1
)p(P)p(P)p,p(P
)p,p(C
C (Q
inv)
Qinv (GeV/c)
1
2
0.05 0.10
Width ~ 1/R
Measurable! F.T. of pion source
5 fm
1 m source(x)
r1
r2
x1
x2
p1
p2
12 ppq
1-particle probability
)xx(iq2
*21
*1T
*T
21e1UUUU
2-particle probabilityq = p2 – p1
T = U(x1,p1)exp{i(r1-x1)p1}U(x2,p2)exp{i(r2-x2)p2}
+ U(x1,p2)exp{i(r2-x1)p2}U(x2,p1)exp{i(r1-x2)p1}
Integrate * over (x)
e.g. ~ exp(-r2/2R2) C = 1 + exp(-q2R2)

“HBT 101” - probing the timescale of emission
K
RoutRside y,xx,x sideout
Decompose q into components:qLong : in beam directionqOut : in direction of transverse momentumqSide : qLong & qOut
(beam is into board) 22
s2o RR
beware this “helpful” mnemonic!
2l
2l
2s
2s
2o
2o RqRqRq
lso e1)q,q,q(C
RO2 = <(xOut - Tt)2>
RS2 = < xSide
2 >RL
2 = <(xLong – Lt)2>
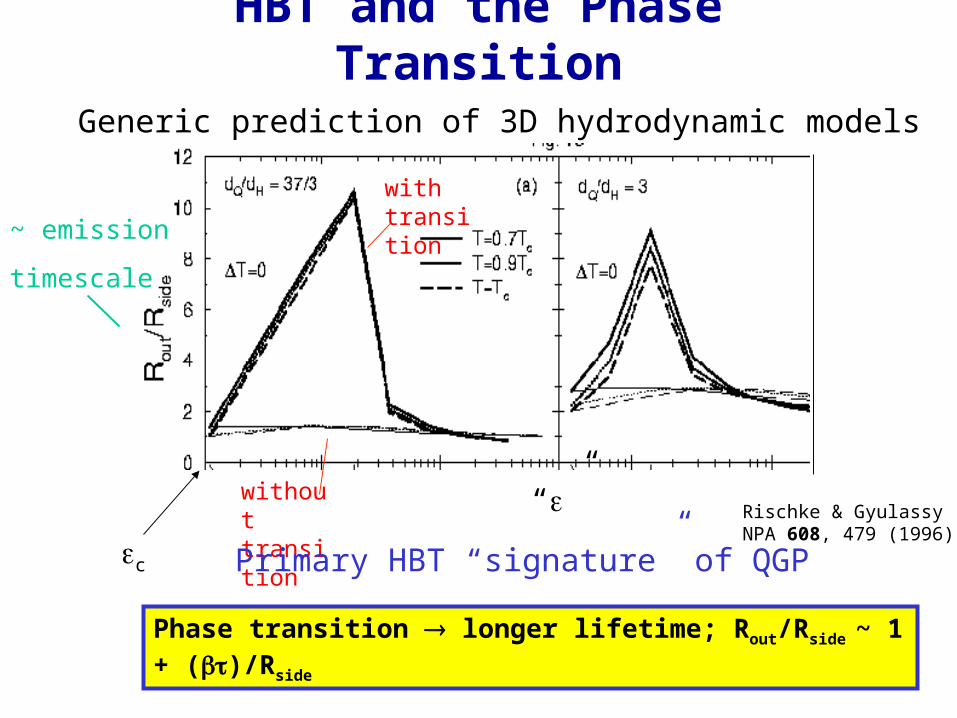
HBT and the Phase Transition
withouttransition
“”
withtransition
c
Rischke & GyulassyNPA 608, 479 (1996)
Generic prediction of 3D hydrodynamic models
Primary HBT “signature” of QGP
~ emission
timescale
Phase transition longer lifetime; Rout/Rside ~ 1 + ()/Rside
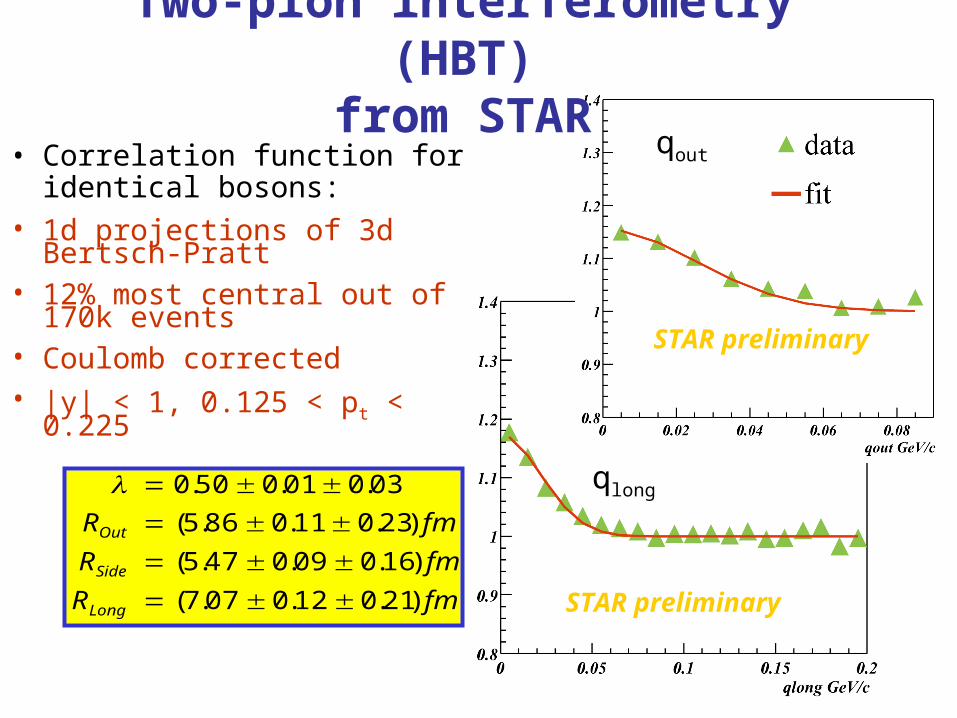
Two-pion interferometry (HBT)
from STAR• Correlation function for identical
bosons:• 1d projections of 3d Bertsch-Pratt• 12% most central out of 170k
events• Coulomb corrected• |y| < 1, 0.125 < pt < 0.225
qout
STAR preliminary
STAR preliminary
qlong
fmR
fmR
fmR
Long
Side
Out
)21.012.007.7(
)16.009.047.5(
)23.011.086.5(
03.001.050.0
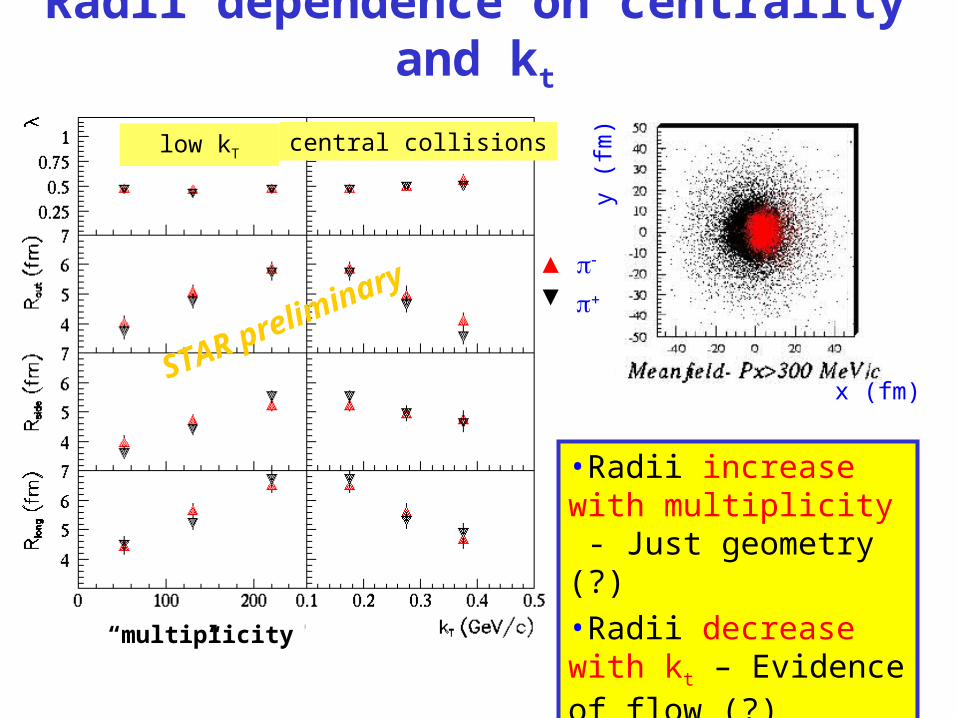
Radii dependence on centrality and kt
•Radii increase with multiplicity - Just geometry (?)
•Radii decrease with kt – Evidence of flow (?)
low kT central collisions
“multiplicity”
STAR preliminary
x (fm)
y (f
m)
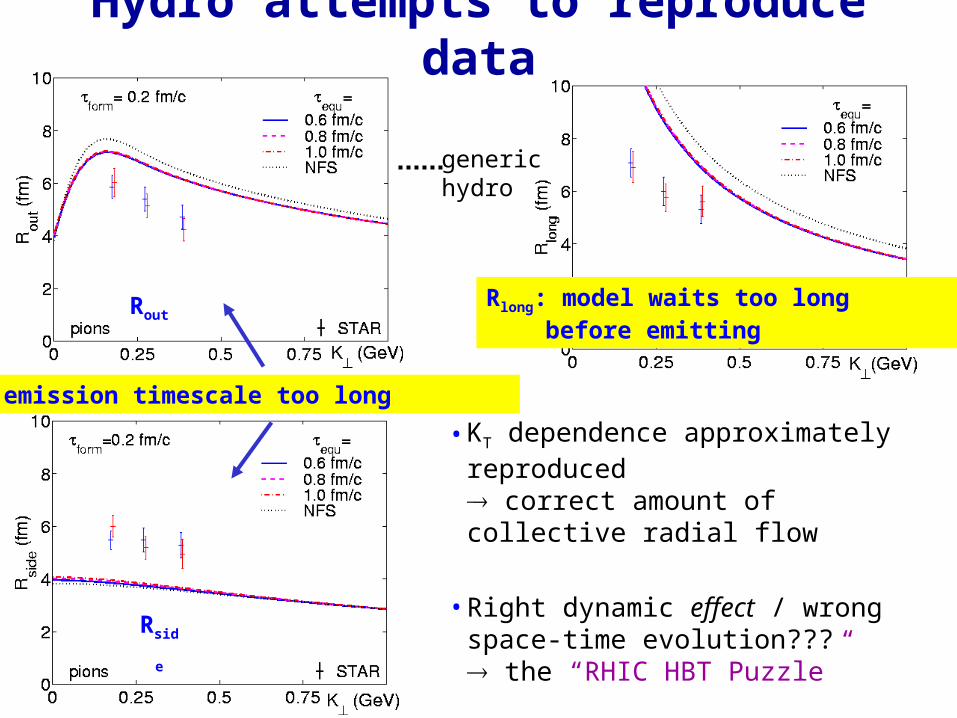
Hydro attempts to reproduce data
Rout
Rside
Rlong: model waits too longbefore emitting
• KT dependence approximately reproduced correct amount of collective radial flow
• Right dynamic effect / wrong space-time evolution??? the “RHIC HBT Puzzle”
generichydro
model emission timescale too long

HBT excitation function
STAR Collab., PRL 87 082301 (2001)
•decreasing parameter partially due to resonances
•saturation in radii
•geometric or dynamic (thermal/flow) saturation
•the “action” is ~ 10 GeV (!)
•no jump in effective lifetime
•NO predicted Ro/Rs increase(theorists: data must be wrong)
•Lower energy running needed!?
midrapidity, low pT -
from central AuAu/PbPb

timeEvolution ofa heavy-ion
collision
Before collision(heavy nuclei)After collision:
QM formation??Hadronization
Strong hadronicrescattering
“Freezeout”(hadrons freely
stream to detectors)
In order to studyQM/hadronizationstage of collision
from freezeout hadrons, need to understand
rescattering stage first!

Hadronic rescattering model
(T. J. Humanic, Phys.Rev.C 57, 866, (1998))1) Assume a simple hadronization picture to set the initial geometry and momenta.
2) Put in a bunch of hadrons whose multiplicities are consistent with RHIC experiments (or predictions).
3) Let hadrons undergo strong binary collisions until the system gets so dilute (since it is expanding) that all collisions cease.
4) Record the time, mass, position, and momentum of each hadron when it no longer scatters. freezout condition.
5) Calculate hadronic observables pT distributions, elliptic flow, HBT, …
1/mTdN/dmT = mTexp(-mT/T)T = 300 MeV
parameters: initial temperature (T), hadronization proper time ()
(cylindrical)(thermal)
K, N, ’…..
(i,j)
z
r
z = sinh y ; t = cosh y = 1 fm/c

Comparison of the Rescattering model with RHIC data for pT distributions
As seen above, the qualitative shapes are the same forpT < 3 GeV/c !
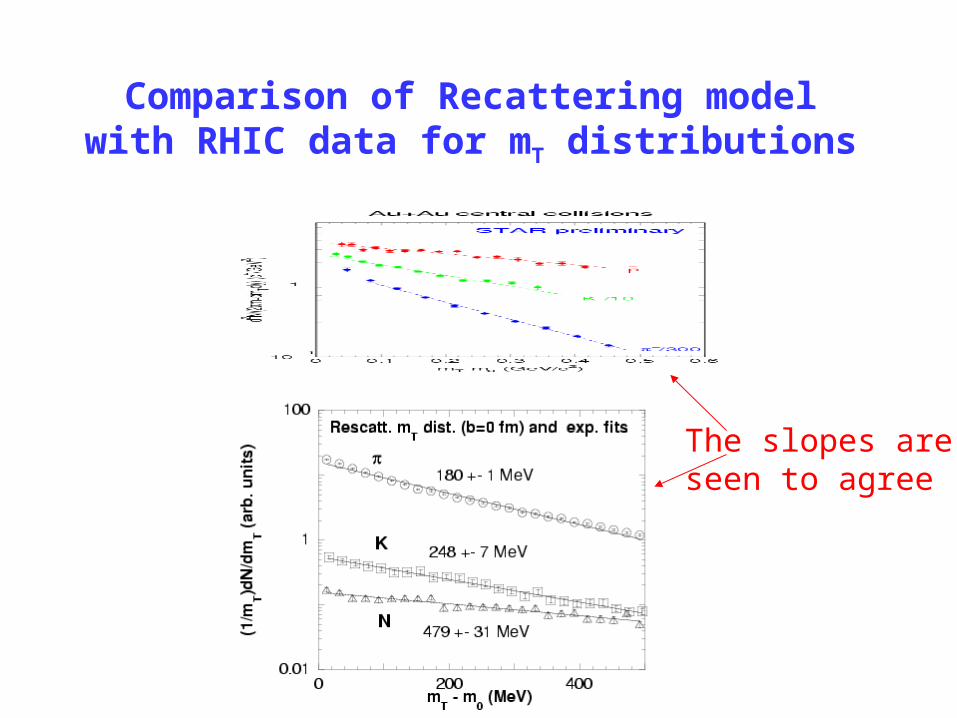
Comparison of Recattering model with RHIC data for mT distributions
The slopes areseen to agree !

Elliptic Flow vs. pT from rescattering model
compared with STAR
Figure4.eps
Figure5.eps
flattening at high pT as in data

STAR HBT vs Rescattering Model
Figure6.eps
Rescattering qualitatively describes the centrality andmomentum dependences of the pion HBT data!!
*
*
*
*
*
*
*
*
*
*
*
*
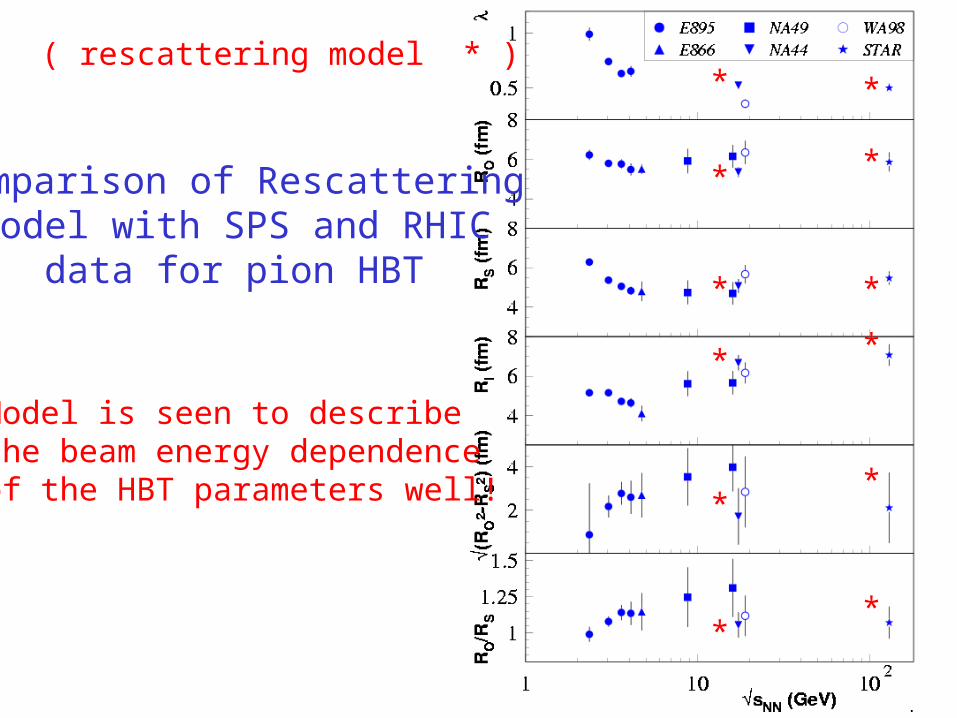
Comparison of Rescatteringmodel with SPS and RHIC
data for pion HBT
( rescattering model * )
Model is seen to describethe beam energy dependenceof the HBT parameters well!
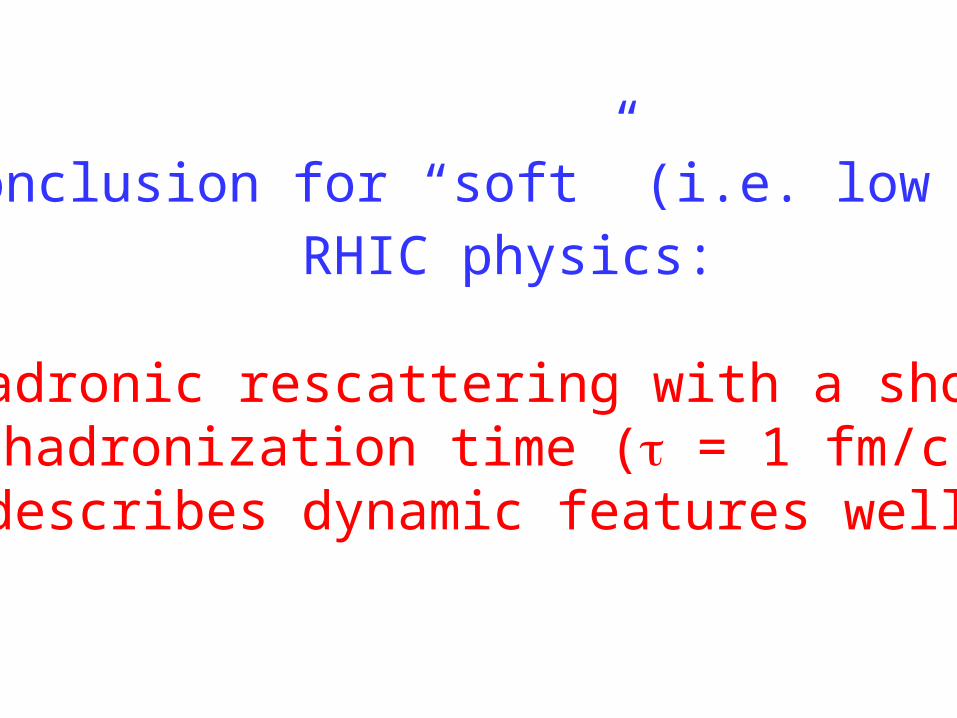
Conclusion for “soft” (i.e. low pT) RHIC physics:
Hadronic rescattering with a shorthadronization time ( = 1 fm/c)
describes dynamic features well!

Hard Physics: pT > 2GeV/c
Goal: Use jets to probe properties of medium
Some Basic Observables:
- Inclusive Spectra and RAA
- Azimuthal Anisotropy, v2
- Statistical & Correlations
STAR p+p Di-Jet
hadronsleadingparticle suppressed
q
q
?

The Experimental Challenge
p+p dijet Central Au+Au Event
Find this ………………………………………………….in
here
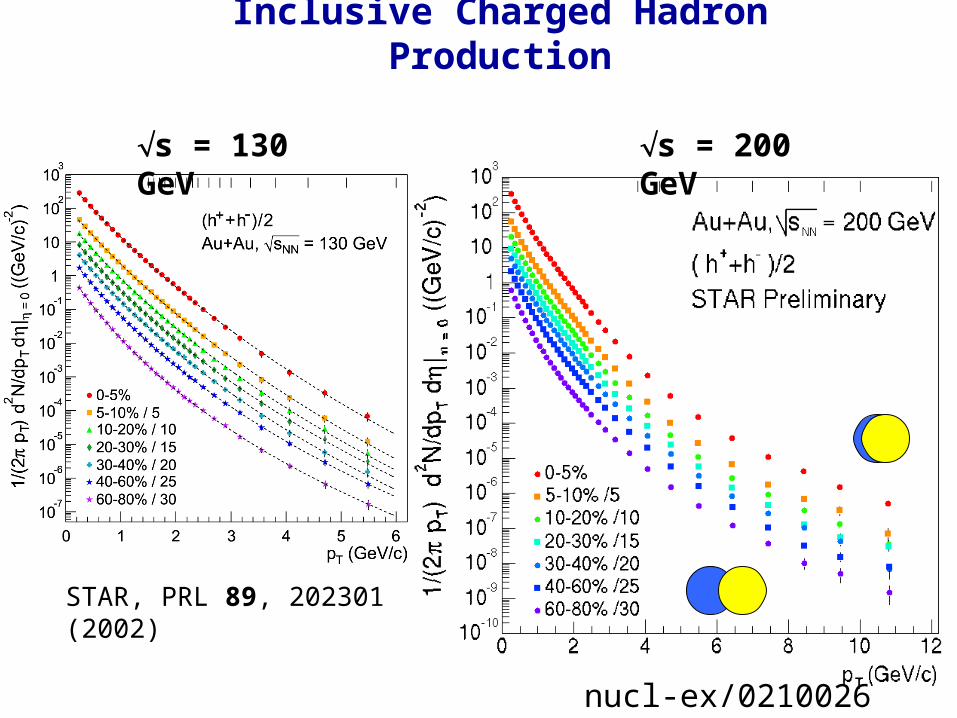
Inclusive Charged Hadron Production
STAR, PRL 89, 202301 (2002)
s = 130 GeV
s = 200 GeV
nucl-ex/0210026

Leading Particle Suppression: Theory
ddpdT
ddpNdpR
TNN
AA
TAA
TAA /
/)(
2
2
leadingparticle
Wang and Gyulassy: partonic energy loss proportional to gluon density, glue
effective softening of fragmentation suppression of leading hadron yield
Nuclear Modification Factor:
<Nbinary>/inelp+p
Partonic Energy loss in high density matter
hadrons
q
q
hadrons
leading particle
hadrons
hadronsleadingparticle suppressed
leading particle suppressed
q
q
(Nuclear Geometry)

Leading Hadron Suppression: Data
STAR p+p reference in the works…
Suppression saturates at 3~5 for pT > 6 GeV/c
RCP Central/Peripheral
RAA using UA1 NN Reference s = 200 GeV Preliminary
Suppression similar at 130 GeV (PRL 89, 202301 (2002))
nucl-ex/0210026

Azimuthal Correlations
Px (GeV/c)
Py
(GeV
/c)
-4 -3 -2 -1 0 1 2 3 4
-4
-3
-2 -
1
0 1
2
3
4
Pt
• Correlation with respect to leading particle (pT>4 GeV/c)
• Consider only particles above 2 GeV/c
• Small difference in relative pseudorapidity
|

Peripheral Au + Au
Central Au + Au
Ansatz: Au+Au = p+p + Elliptic Flow
High pT Azimuthal Correlations
nucl-ex/0210033
Near-side correlation shows jet-like signal in central/peripheral Au+Au Away-side correlation suppressed in central Au+Au

Surface Emission of Jets ?
?
• This is in accordance with 1) the measured suppresion of the inclusive spectra with respect to binary collisions, and 2) high-pT azimuthal correlations.– We only ‘see’ jets
emitted from the surface?

Suppression of away-side jet consistent with strong absorption in the bulk, with emission dominantly from
the surface

Summary of Au+Au Collisions at RHIC
Hard physics:• Strong suppression of inclusive yields• Azimuthal anisotropy at high pT
• Suppression of back-to-back hadron pairs
Soft physics:• System appears to be thermalized• Rapid hadronization, strong rescattering• Large radial flow, elliptic flow, and HBT results all explainable as resulting from hadronic rescattering
Large parton energy loss with surface
emission?
?

STAR STRANGENESS!
K0s
K+
(Preliminary)

The Collisions
The End Product