physics 4a lab exercises -...
TRANSCRIPT

Physics 4ALab Exercises
De Anza CollegeVersion 2.0
Additional equipment is required.
See the preface inside.
By David NewtonCopyright 1996 ©

2
TABLE OF CONTENTS
PREFACE . . . . . . . . . . . . . . . . . . . . . . . . . . . . . . . . . . . . . . . . . . . . . . . . . . . . . . . . . . . . . . . . . . . 3
LAB BOOK EVALUATION FORM . . . . . . . . . . . . . . . . . . . . . . . . . . . . . . . . . . . . . . . . . . . . . . 4
1. THE VERNIER SCALE . . . . . . . . . . . . . . . . . . . . . . . . . . . . . . . . . . . . . . . . . . . . . . . . . . . . . . 5
2. DENSITY AND MEASUREMENT . . . . . . . . . . . . . . . . . . . . . . . . . . . . . . . . . . . . . . . . . . . 11
3a. THE BEHR FREE FALL EXPERIMENT . . . . . . . . . . . . . . . . . . . . . . . . . . . . . . . . . . . . . . . 14
3b. THE BEHR FREE FALL EXPERIMENT . . . . . . . . . . . . . . . . . . . . . . . . . . . . . . . . . . . . . . 20
4. INTRODUCTION TO THE AIR TRACK . . . . . . . . . . . . . . . . . . . . . . . . . . . . . . . . . . . . . . . 21
5. NEWTON'S SECOND LAW AND THE AIR TRACK . . . . . . . . . . . . . . . . . . . . . . . . . . . . . 27
6. THE AIR TRACK AS AN INCLINED PLANE . . . . . . . . . . . . . . . . . . . . . . . . . . . . . . . . . . . 30
7. KINETIC ENERGY AND CONSERVED QUANTITIES . . . . . . . . . . . . . . . . . . . . . . . . . . . 32
8. CENTRIPETAL ACCELERATION . . . . . . . . . . . . . . . . . . . . . . . . . . . . . . . . . . . . . . . . . . . . 36
9. SIMPLE HARMONIC MOTION (WITH AN AIRTRACK) . . . . . . . . . . . . . . . . . . . . . . . . . 40
10. SIMPLE HARMONIC MOTION (NO AIR TRACK) . . . . . . . . . . . . . . . . . . . . . . . . . . . . . 42
11. SIMPLE HARMONIC MOTION AND A VERTICAL SPRING . . . . . . . . . . . . . . . . . . . . . 44
12. ENERGY CONSERVATION AND MOMENT OF INERTIA . . . . . . . . . . . . . . . . . . . . . . 46
3
PREFACE
The following set of lab exercises provide a starting point for the exploration of labprocesses in a physics environment. The exercises are not all necessarily just one week long;some may take two weeks or more. At the instructors discretion some labs may be deleted.The order of the labs may also be changed. This booklet is designed to be used in conjunctionwith the "LAB SKILLS MANUAL" which must be purchased separately. It is in the LABSKILLS MANUAL that laboratory procedure is defined. This work is only a collection ofexperiments, not an explanation of techniques. The experiments should be read and studied bythe student before the lab commences.
The first two labs (VERNIER and DENSITY) may be performed on the same day,time allowing. There is a detailed and substantial explanation of the air track before any of theair track labs. It is imperative that this introduction be thoroughly read and studied by thestudent and instructor before any air track labs are performed. Failure to do so may result indamaging the air track equipment. A short multiple choice quiz is available for the instructorto give to students to check their having read the air track introduction. Please see DavidNewton to obtain this quiz.
LAB EQUIPMENT REQUIREMENTS:
Every student must bring to the lab a minimum of required equipment:
1. A lab note book (which may or may not be kept in the laboratory for the entire quarter).The note book must be of the size: 10" X 7 7/8", be "quadrille ruled", and either one of twostyle numbers: 26-151 or 26-251 or 43-475.
2. A ruler. A #36 "C-thru" ruler (or anything else that is better) is acceptable.
3. A scientific calculator. Trig and log functions required. (Statistical functions up tostandard deviation are recommended)
4. A pen and pencil.
5. The LAB SKILLS MANUAL and this book, 4A LAB EXERCISES.
Please refer to the LAB SKILLS MANUAL for more detail about laboratory procedure.

4
Physics Lab Record Evaluation
Name________________________ Course___________ Section____
Lab Recording Skills 1 2 3 4 5 6
1. Establish Experimental Objective Devise Tentative Plan
2. Draw Detailed Diagrams and Discuss Theory
3. Collect and Organize Data
4. Thoroughly Analyze Data Sample Calculations
5. Make Good Graphs with Title Label Axes, Proper Scales & Size
6. Discuss Results Error Analysis
7. Compare Results with Theory Draw Valid Conclusions
8. Compose a Readable, Sequential, Detailed, Direct-Recorded Record
LAB BOOK EVALUATION FORM
At your instructor's request, please tape the form below into the front inside cover of your labbook.
5
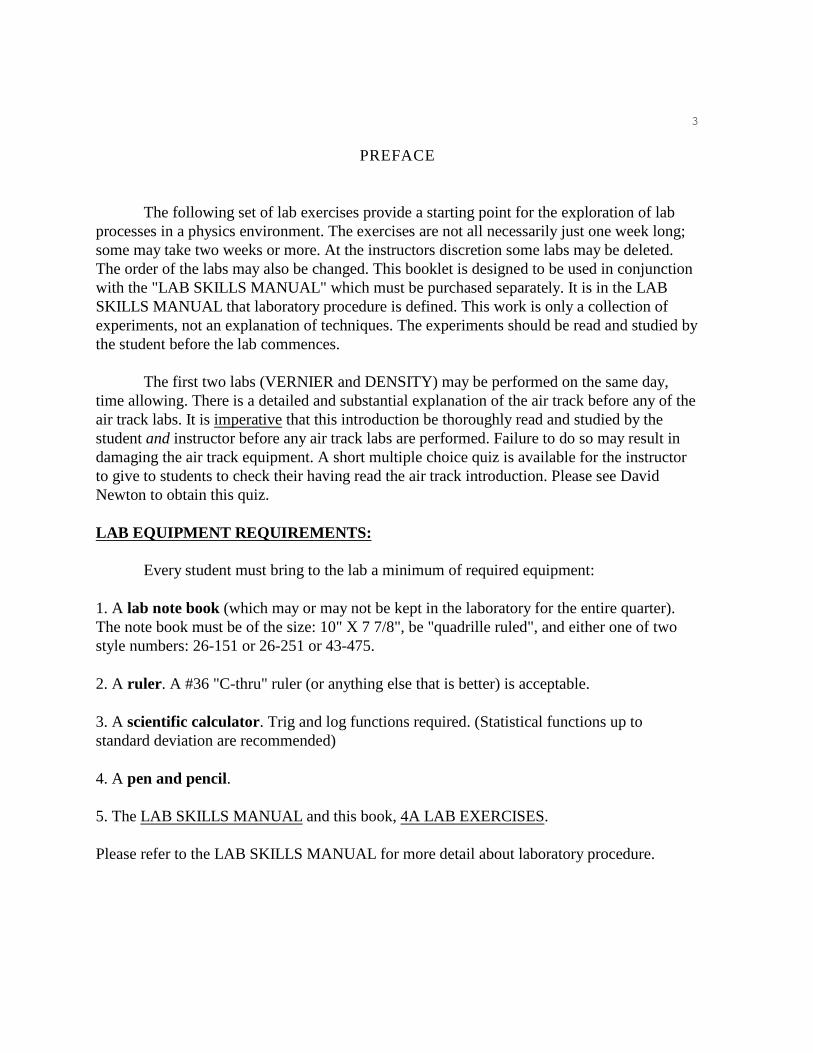
Figure 1: Ten vernier divisions in the space of ninemain scale divisions, a scale ratio of 10:9.
1. THE VERNIER SCALEEquipment List:C 3 X 5 cardC one vernier caliperC one ruler incremented in millimeters
What you will learn:This lab teaches how a vernier scale works and how to use it.
I. Introduction: A vernier scale (Pierre Vernier, ca. 1600) can be used on any measuring device with a
graduated scale. Most often a vernier scale is found on length measuring devices such asvernier calipers or micrometers. A vernier instrument increases the measuring precisionbeyond what it would normally be with an ordinary measuring scale like a ruler or meter stick.
II. How a vernier system works:A vernier scale slides across a fixed main scale. The vernier scale shown below in
figure 1 is subdivided so that ten of its divisions correspond to nine divisions on the mainscale. When ten vernier divisions are compressed into the space of nine main scale divisionswe say the vernier-scale ratio is 10:9. So the divisions on the vernier scale are not of astandard length (i.e., inches or centimeters), but the divisions on the main scale are alwayssome standard length like millimeters or decimal inches. A vernier scale enables anunambiguous interpolation between the smallest divisions on the main scale.
Since the vernier scale pictured above is constructed to have ten divisions in the spaceof nine on the main scale, any single division on the vernier scale is 0.1 divisions less than adivision on the main scale. Naturally, this 0.1 difference can add up over many divisions. For
6
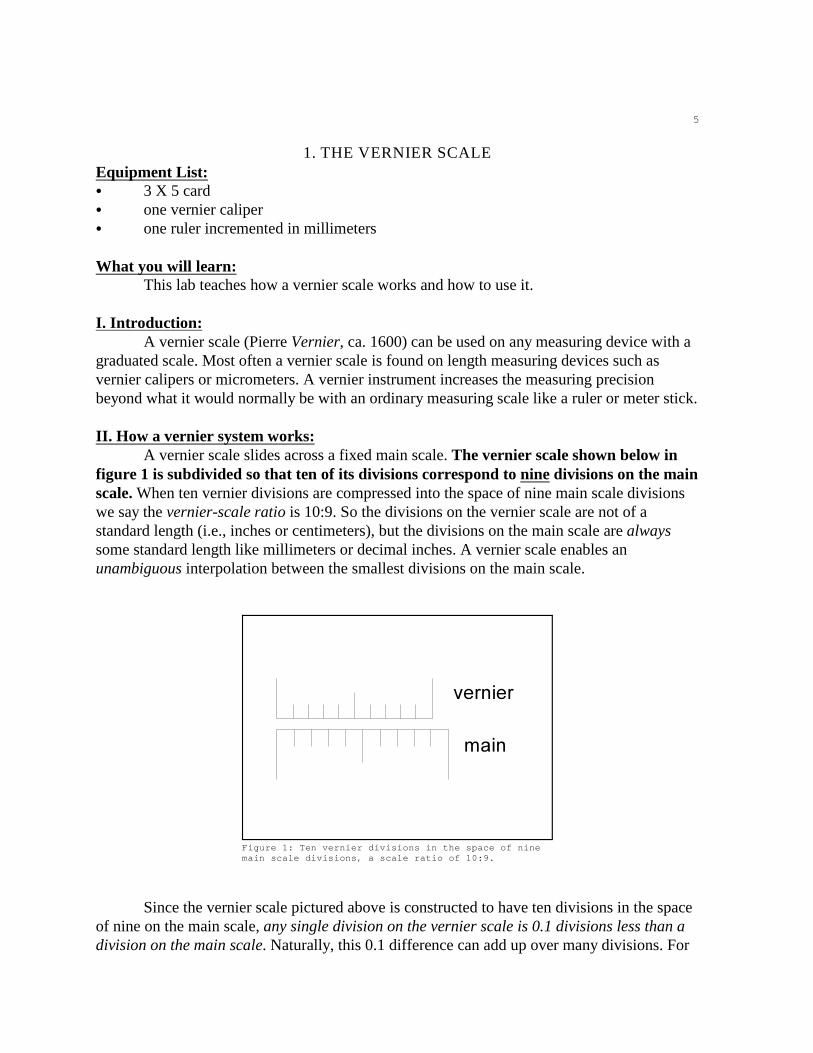
Figure 2: In the span of six divisions, the differencebetween the vernier and main scale is 0.6 divisions.
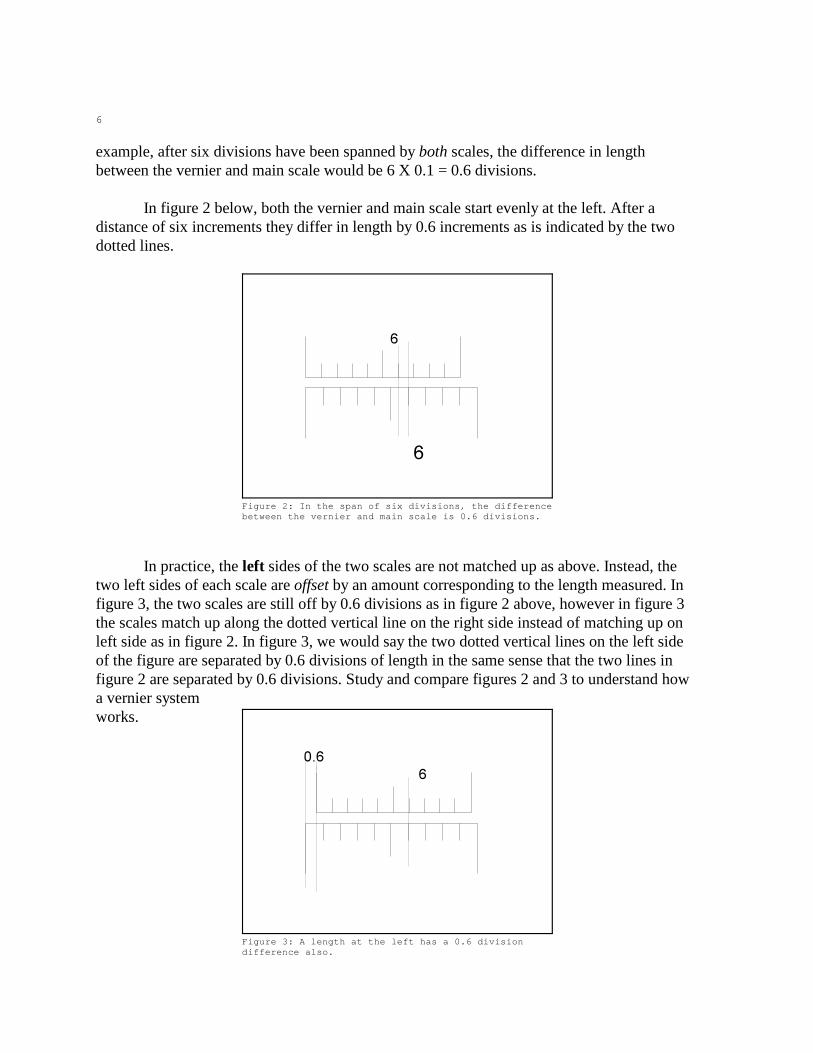
Figure 3: A length at the left has a 0.6 divisiondifference also.
example, after six divisions have been spanned by both scales, the difference in lengthbetween the vernier and main scale would be 6 X 0.1 = 0.6 divisions.
In figure 2 below, both the vernier and main scale start evenly at the left. After adistance of six increments they differ in length by 0.6 increments as is indicated by the twodotted lines.
In practice, the left sides of the two scales are not matched up as above. Instead, thetwo left sides of each scale are offset by an amount corresponding to the length measured. Infigure 3, the two scales are still off by 0.6 divisions as in figure 2 above, however in figure 3the scales match up along the dotted vertical line on the right side instead of matching up onleft side as in figure 2. In figure 3, we would say the two dotted vertical lines on the left sideof the figure are separated by 0.6 divisions of length in the same sense that the two lines infigure 2 are separated by 0.6 divisions. Study and compare figures 2 and 3 to understand howa vernier systemworks.

7
Figure 4: The box is 2.74 units long.
III. Measuring an object's length the vernier way:
In measuring the length of an object with vernier calipers, the first two significantfigures are read from the main scale. Find where the left edge of the vernier scale crosses themain scale and record the corresponding values immediately so you don't forget them. Infigure 4 on the next page, you should confirm that the first two significant figures of themeasurement are 2.7 units. This information could be obtained without using a vernier; this isjust standard measuring procedure. It is the third significant figure that must be obtained usingthe vernier scale.
In figure 4, see that the vernier and main scale divisions align where the vernier scalereads 0.4. Actually, in terms of the total instrument this corresponds to a value of 0.04 units,not 0.4. Thus, the measurement of the box's length would 2.74 units.
See that the first two numbers are read from the main scale and the third number fromthe vernier. Confirm the full measurement in figure 4.

8
Figure 5: The calipers you will use have 20 divisions
in the space of 19. The scale ratio is 20:19.
Figure 6: This value is 4.26 cm to three sig figs or4.259 to four sig figs.
IV. Using the vernier calipers provided: In figure 5 below, the relation between the vernierand main scale is not one of ten in the space of nine but of twenty in the space of nineteen.This increases the precision of the instrument.
V. The absolute uncertainty of your verniercalipers: You will note a 1/20 mm (onetwentieth of a millimeter) printed on the rightside of the main scale. 1/20 mm corresponds to1/200 of a centimeter or in decimals, 0.005 cm.Take this value to be the absolute uncertainty inyour scale reading, although some people preferto use 0.003 cm instead, the choice is yours.Below in figure 6, the reading to threesignificant figures would be 4.26 cm. But noticethe two increments between the vernier andmain scale are not perfectly aligned. You shouldinterpolate the vernier scale to read to threedecimal places. Confirm the reading to be about(4.259 ± 0.005) cm and see that it is not 4.261cm since the left-side zero mark on the vernierscale is closer to the left side zero on the mainscale and so the reading is smaller in value than 4.260.

9
Figure 7: Your own personal verniercalculator. You should number your divisionsas well.
VI. Making your own vernier scale:
1. Take two 3 X 5 cards provided by your instructor.
2. Using your ruler and a sharp pencil, mark the top edge of one card once every centimeterstarting from the left edge of the card all the way to the right side. The very left edge of thiscard will be the "zero". Every centimeter mark after the zero will be labelled 1, 2, 3, and so on.Write at the bottom of this card: "MAIN SCALE". Examine figure 7 for a rough idea of whatyou are to do.
3. Take the second card and place it before you on the lab table. At the bottom of this cardmark an increment every nine millimeters starting at the left most edge. Mark ten incrementsonly, each separated by nine millimeters. Label each increment with a 1, 2, 3, and so on untilyou reach 10. Label this card "VERNIER SCALE".
4. You have made your first (and last?) vernier scale which will measure an interpolation ofthe main scale to a tenth of a centimeter (one millimeter). For one more significant figure, youcould interpolate the vernier scale as well.
Use your hand made vernier to measure the two lines found below, and confirm yourmeasurement with your ruler to the nearest millimeter. Place the left edge of your MAINSCALE card at the left edge of the line. Then place the left edge of your VERNIER SCALE at

10
the right edge of the line. Record the length of the line to two decimal places in centimeters(i.e., 2.34 cm).
1. ))))) 2. ))))))))))
The correct answers are written upside down at the bottom of this page. Measure the lines firstbefore you look at the answers.
1. 2.

11
2. DENSITY AND MEASUREMENT
Equipment list: C One aluminum block (record its number)C Vernier Caliper (record its serial number)C Triple beam mass balance (record the number)C A squared brass block (optional)C One digital balance
How to use the triple beam balance: The balance should be "zeroed" before each use. Makesure the pointing arm at the right side of the scale oscillates evenly up and down about thereference mark on its right. You should gently push the arm to induce the oscillations. Nevertake a reading without moving the arm; static friction might hold the arm in place and preventan accurate reading.
The two larger sliding weights should each be placed securely in the notches along thebalance's arm when taking a measurement. The smallest sliding weight has no notches butmoves continuously along its arm; this allows a precise reading.
By examining the scale, you should confirm that the least count of the balance is 0.1grams. You should interpolate to values less than this and since the absolute uncertainty isequal to one half the least count, a typical reading from this balance would be interpolated tothe hundredth of a gram for a value of say, (154.23 ± 0.05) grams.
How to use the vernier calipers: The vernier calipers provided have two different scales,decimal inches and centimeters, we will use the centimeter scale only.
Before measuring an object, you should push the jaws of the caliper completelyclosed and confirm that the vernier measures a zero length. If it does not measure zero, asystematic error will be introduced into all your measurements and you should correct all yourmeasurements by this amount. When measuring the length on an object, you should cinch upthe jaws onto the object securely and snugly. Your vernier calipers have beveled (angled)edges at the tip of its "jaws". Use these beveled edges to take your length measurements.Don't slide the vernier scale across the main scale unless you are pressing in the "thumbstop". Not pressing the thumb stop increases the friction of the vernier against the main scaleso the vernier will not slip when you are taking a measurement.
Theory: All matter has mass, the measure of inertia. Any object has its mass contained in adefinable volume. Density (D) is the measure of how much mass is contained in an object'svolume:
Density = Mass/VolumeD = M/V

12
Al Known value: D = 2.699 g/cm at room temperature.1 3
Purpose: The purpose of part I is to measure the mass of your aluminum block three differentways and compare the values. The purpose of part I is not to measure the density ofaluminum.
Procedure: Part I: The Aluminum block
Attention: Aluminum is a soft metal and can easily be scratched or nicked if handledcarelessly. Please be careful not to drop or bang your aluminum block, since this may changeits dimensions and effect the accuracy of your measurements.
In this part of the lab you are to determine the mass of the aluminum block threedifferent ways and then compare the three different calculated masses and their absoluteuncertainties.
1. Measure the mass of the block on the pan balance five different times. Use the statisticalmethod discussed in the LAB SKILLS MANUAL to find the most probable value and itsabsolute uncertainty for the mass of your block.
2. Measure the mass of the block on the digital balance. Record the absolute uncertainty aswell.
3. Solving the density equation given above for mass, we see the mass of a body can becomputed if we know its density and volume. Measure the volume of your block. To do this,measure the length, height, and width of your block with the vernier calipers provided. Eachmeasurement will have an uncertainty; record the uncertainty in your lab book with themeasurement. Justify the uncertainty's value. Given the density of aluminum and the volume1
determined by computation, compute the mass of the block and its absolute uncertainty.
Analysis: Discuss how all three calculations of mass overlap when their uncertainties areconsidered. Discuss your confidence in the accuracy of each calculation. Which of the threemass values has the greatest precision?

13
Part II: Measuring the density of brass.
Note: Brass, like aluminum, is also soft. Please be careful not to drop or bang your brassblock as it may change its dimensions.
Obtain a brass block from the lab cart. Measure its mass and volume with the greatestprecision based on previous results. Calculate its density with an absolute uncertainty.Determine, if possible, what kind of brass you have. Defend your assertion.
Yellow Brass (70% Copper, 30% Zinc):
cast: 8.44 g/cm ; 3
rolled: 8.56 g/cm ; 3
drawn: 8.70 g/cm3

14
3a. THE BEHR FREE FALL EXPERIMENT
Note: An alternative Behr free fall lab can be found at the end of this one. It is less involvedand may be more approachable than the following. See your instructor to find which of thetwo labs you are to do.
Equipment List:C One Behr Free Fall Apparatus and spark timer (A back-up unit is desirable).C One two-meter stick per table.C Masking tape.C Red wax paper tape with Behr Free Fall data on it produced by the apparatus.
What you will do: By a graphical method, you will find the instantaneous speed of a falling object at
three different times during its flight (this is part I). Then, by a different graphical method, youwill find each of those three speeds with three other graphs, one graph for each speed (parts II,III, and IV). The three speeds in part I should match the corresponding speeds found in partsII, III, and IV.
Introduction: The Behr Free Fall apparatus produces a written record of a freely falling object's
position at equal intervals of time. The falling object is called the "bob". The bob falls adistance of about five or six feet. Falling from rest this would allow for a total time of flightof: t = [2@)y/g] � 0.6 seconds (derive and confirm this). Since the bob is in flight for about½
half a second, for the bob to leave a trace of its position at equal intervals of time, the intervalsof time must be very short. These small time intervals are produced by a "spark timer".
A spark timer is a high voltage mechanism that produces a spark which, as the bobfalls, arcs across the bob and through a waxed paper tape making a small burn hole (a dot) inthe paper. To produce the thirty or so total dots in the paper when only a total time of 0.6seconds is allowed, sparks must be generated every one sixtieth of a second. We will assumethe spark timer produces a spark exactly every one sixtieth of a second. So each dot isseparated by an equal interval of time.
Although the initial speed of the bob is zero (it does fall from rest), the first dotproduced on your paper tape is not created while the bob is at rest. Since the bob has to travelsome distance from its rest position to where the first dot is made, the bob must have a non-zero speed when the first dot is created. We will determine this initial speed.
15
Some instructors prefer to circle every third dot or every other dot; check with your instructor to2
see if you should modify any procedures.
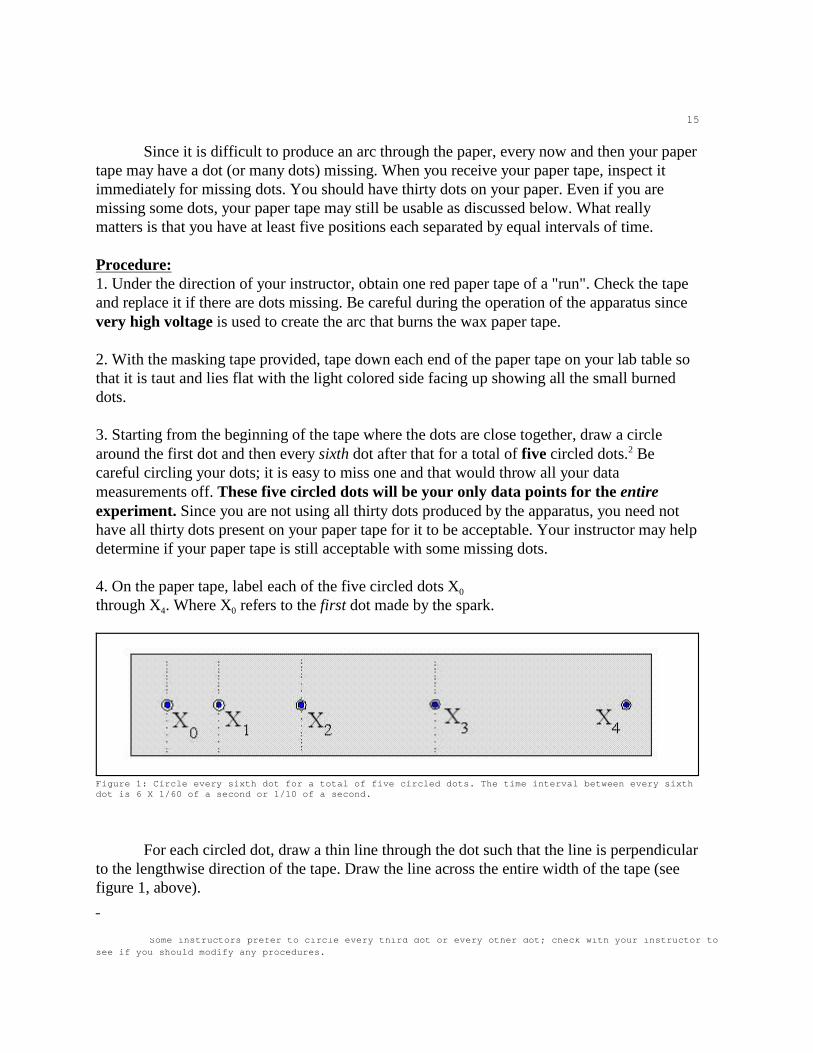
Figure 1: Circle every sixth dot for a total of five circled dots. The time interval between every sixthdot is 6 X 1/60 of a second or 1/10 of a second.
Since it is difficult to produce an arc through the paper, every now and then your papertape may have a dot (or many dots) missing. When you receive your paper tape, inspect itimmediately for missing dots. You should have thirty dots on your paper. Even if you aremissing some dots, your paper tape may still be usable as discussed below. What reallymatters is that you have at least five positions each separated by equal intervals of time.
Procedure: 1. Under the direction of your instructor, obtain one red paper tape of a "run". Check the tapeand replace it if there are dots missing. Be careful during the operation of the apparatus sincevery high voltage is used to create the arc that burns the wax paper tape.
2. With the masking tape provided, tape down each end of the paper tape on your lab table sothat it is taut and lies flat with the light colored side facing up showing all the small burneddots.
3. Starting from the beginning of the tape where the dots are close together, draw a circlearound the first dot and then every sixth dot after that for a total of five circled dots. Be2
careful circling your dots; it is easy to miss one and that would throw all your datameasurements off. These five circled dots will be your only data points for the entireexperiment. Since you are not using all thirty dots produced by the apparatus, you need nothave all thirty dots present on your paper tape for it to be acceptable. Your instructor may helpdetermine if your paper tape is still acceptable with some missing dots.
04. On the paper tape, label each of the five circled dots X
4 0through X . Where X refers to the first dot made by the spark.
For each circled dot, draw a thin line through the dot such that the line is perpendicularto the lengthwise direction of the tape. Draw the line across the entire width of the tape (seefigure 1, above).
16
5. Please read this next section entirely before recording any data.
Take your two-meter stick and place it on edge (to minimize parallax error) aligning itwith the length of the paper tape. Place the meter stick near the dots but do not cover the dots.The meter stick should be kept parallel to the line made by all thirty dots. If no two-metersticks are available, you will have to use a one-meter stick and move it as necessary. Do notplace the meter stick at a pre-chosen position like its end edge or the one centimeter mark,doing so merely prejudices your data measurements, something to be avoided. Place the meterstick down at an arbitrary position so the position of the first dot will be the smallest value ofyour five positions but not some "even" or easy-to-read value.
Draw a position versus time graph while you take each data point and check to seeif you have skipped any dots. Before you start taking your data, plan the scale of your graphso that it will cover at least a half page of your lab book. Relative to the meter stick, note thepositions of the first and last circled dots so you can approximate the vertical axis scaling, andfor the horizontal axis scaling, recall that the time interval between each circled dot is 0.1seconds. You will know if you skipped any dots if the curve described by the data pointsbecomes non-parabolic. Record and graph the position of the five circled dots. You shouldinterpolate the measurement on your meter stick to read positions to the one hundredth of acentimeter. Write down the absolute uncertainty associated with your measurement. Let thefirst position be graphed at time t = 0; the first position itself should not be a zero value butshould be the value you measured on your meter stick.
Analysis: Part I: Finding instantaneous speeds from a tangent line on a position versus timegraph. On your position versus time graph drawn while you took your data, use your ruler to
0 2 4draw an "eyeball" tangent line to the parabolic curve at each position X , X , and X . Measurethe slope of each of your three straight lines. Interpret the physical meaning of each line.
0 0Part II: Finding the instantaneous speed V at the initial position X and calculating g.
The following method is important to understand as it forms the basis for the analysisof parts II, III, and IV.
The goal of this analysis is to show a limit process by graphical methods and, byextrapolating the graph, to find an instantaneous speed. In this part we will also determine thevalue of g from the graph.
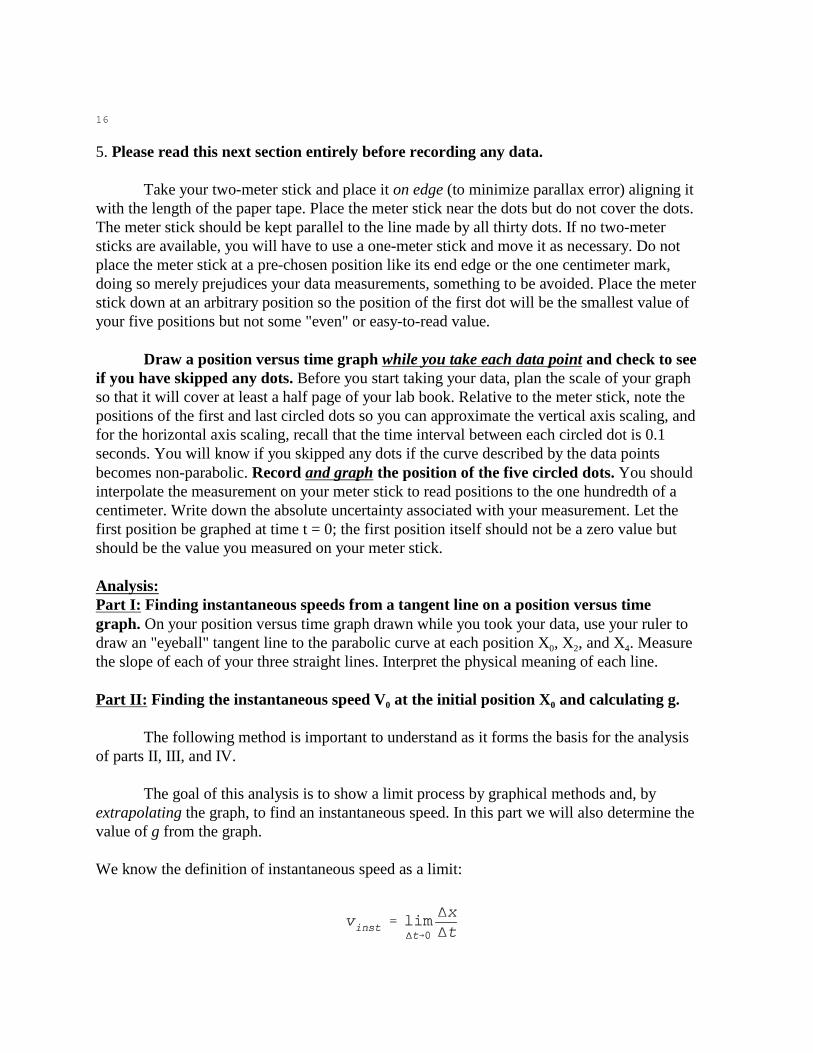
We know the definition of instantaneous speed as a limit:

17
If we plot average speeds on the y-axis and corresponding time intervals on the x-axis, then it is possible to see that the average speed approaches an instantaneous speed as thetime intervals approach zero. On the graph the time intervals approach zero as the data pointsapproach the vertical axis. Understand that this kind of graph is not the classic instantaneousspeed versus time graph that is typically discussed in kinematics; the graph we will use is anaverage speed versus a time interval. Study the graph on the next page to help understandthis.
As an example, a sample data/calculation table for a hypothetical Behr Free Fallexperiment is given on the next page. The acceleration that produced this data is not equal to gand the time interval between dots is 0.5 seconds not 0.1, but the calculations used areidentical to those needed in constructing your graphs. These calculations would be used to
0 0 ij ijfind the initial instantaneous speed V at the position X . When you graph &V versus )t (youwill have four data points to graph from five measured positions) a linear relation should beobserved.
From the table, you should observe that the first average speed is calculated betweenthe first two circled dots at positions 2.25 and 2.53 cm. Since the time interval between thesepositions is half a second, the average speed is:
01 1 0 01&V = (X -X )/)t = (2.53-2.25)/0.5 = 0.56 cm/s
You should confirm the other calculations in the table to test your understanding. Your
ij ijgraph is a graph of &V versus )t . Notice that in calculating the different average speeds theposition of the dot where we want to find the instantaneous speed is always part of thecalculation. Notice also that the average speeds increase as the position between the dotsincreases and the time interval between the dots increases; this is natural since the bob isspeeding up as it falls - its average speed is increasing.
To further aid your understanding, the next data point in the graph would be calculatedas follows:
02 2 0 02&V = (X -X )/)t = (3.35-2.25)/1.0 = 1.10 cm/s
18
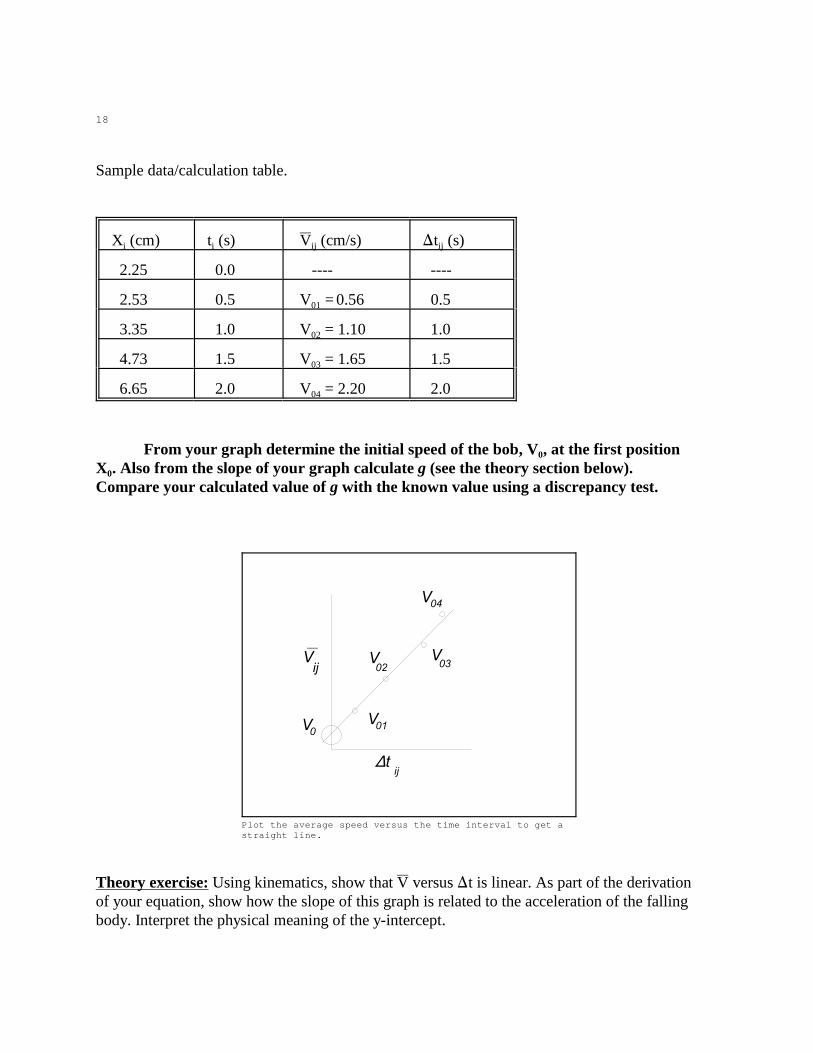
Plot the average speed versus the time interval to get astraight line.
Sample data/calculation table.
i i ij ij X (cm) t (s) &V (cm/s) )t (s)
2.25 0.0 ---- ----
01 2.53 0.5 V = 0.56 0.5
02 3.35 1.0 V = 1.10 1.0
03 4.73 1.5 V = 1.65 1.5
04 6.65 2.0 V = 2.20 2.0
0From your graph determine the initial speed of the bob, V , at the first position
0X . Also from the slope of your graph calculate g (see the theory section below).Compare your calculated value of g with the known value using a discrepancy test.
Theory exercise: Using kinematics, show that &V versus )t is linear. As part of the derivationof your equation, show how the slope of this graph is related to the acceleration of the fallingbody. Interpret the physical meaning of the y-intercept.

19
Part III: Finding the instantaneous speed of the bob at its final position. Repeat the
4 4methods of part II to find the instantaneous speed V at the position X . To find theinstantaneous speed at the final position, hold the final position constant while varying theother position and time values.
2 2Part IV: Find the instantaneous speed V of the bob at the time midpoint t at the
2position X . Again use the methods previously developed. In this part however, as you shrinkyour time intervals no positions are held constant. Think symmetry, and see if you can figureit out.
Part V: Compare the three instantaneous speeds found in part I to those found in parts II, III,and IV. Also, can you calculate g from the graphs in parts III and IV? Error analysis has beenignored, how could you apply it meaningfully to this experiment?
Part VI: Show mathematically (i.e., algebraically with no numbers) that the averagespeed over a time interval is equal to the instantaneous speed at the midpoint of that timeinterval if the acceleration is constant. Confirm this principle by taking the average speed
0 4 2(V + V )/2 and comparing the result to the instantaneous speed value V at the time midpointas calculated in Part I and Part IV.
20
3b. THE BEHR FREE FALL EXPERIMENT
Equipment List:C One Behr Free Fall Apparatus and spark timer (A back-up unit is desirable).C One two-meter stick per table.C Masking tape.C Red wax paper tape with Behr Free Fall data on it produced by the apparatus.
Procedure:In this lab you will draw two graphs. The first graph will be a position versus time graph forall the dots on your wax tape. Remember, each individual dot is separated by 1/60th of asecond. You will then draw a tangent line to every fifth dot for a total of five tangent lines.You will measure the slope of each tangent line. Recall, in this case, a tangent line representsthe instantaneous speed of the bob at that point where the tangent line is drawn.
For the second graph, using the slope of each tangent line from the first graph, plot theinstantaneous speed of the bob as a function of time. This graph will have five data points onit. From kinematics we know the slope of this graph is equal to the acceleration of the bob.
Analysis and Conclusion:Take the value of g to be 9.81 m/s and compare your slope value to this accepted value using2
uncertainties and/or a discrepancy test. Discuss sources of systematic uncertainties in yourresults and how they could be eliminated.

21
4. INTRODUCTION TO THE AIR TRACK
I. What is an air track? An air track is an experimental apparatus that allows the study of motion with minimal
interference by frictional forces. To see a typical air track setup, look at the diagram at thebottom of page 26.
By allowing the air track gliders to move on a cushion of air, frictional effects arereduced. A blower adjusted to the correct output level forces air inside a piece of aluminumextrusion. The high air pressure inside the track forces air out of the track through small holesdrilled into the upper surface of the track. The air track glider rides on this surface of air.
To make effective use of eliminating friction from our experiments we need tomeasure speeds with great accuracy. This is accomplished with the use of "photogates".Combined with these sophisticated timing devices, low friction air tracks enable theexperimenter to make high accuracy confirmations of fundamental motion studies.
Before you start experimenting with the air track, you must learn how to avoiddamaging them. The tracks are made of aluminum which is a soft metal and easily scratched,nicked, and damaged if not handled carefully. Any irregularity in the track surface willincrease frictional effects and reduce the accuracy of your results. Please be considerate of ourequipment, take care not to damage these tracks as they are expensive and must last the DeAnza physics department a long time.
II. How to avoid abusing the air tracks:1. Never place a glider on a track unless there is air blowing out through the track'sholes. Never slide a glider along the track unless there is air blowing out through the small airtrack holes. Before putting the glider on the track, feel the air blowing out of the track withyour hand. The glider must slide on a layer of air and must never slide touching the aluminumtrack. Contact between the glider and track will scratch and ruin the track's surface.
2. Remove and replace the track from the storage rack slowly with great care making sure thetrack does not collide with other objects. The track is long so that removing and replacing it isa two person procedure where each person is in charge of one end of the track to ensure it hitsnothing. Hitting the track will throw it out of alignment. These tracks are straight to within0.02 millimeters over their entire length. Deviations from this tolerance will reduce theaccuracy of your results.
3. Never put any kind of tape on the track or glider. Do not write on the glider with pen orpencil. It is also a good idea not to excessively touch the track with your hands since finger oilwill eventually gum up the track's surface.

22
4. Never push down on a glider. On or off the air track, pushing downward on a glider maybend the delicate sides of the glider. The angle between the sides of the glider must match theninety degree angle of the track surface.
III. Preparing the air track, glider(s), and photogates for an experiment:A. Preparing the air track. 1. Carefully remove the air track from its cradle on the storage cart and place it on your labbench. This is a two person job!
2. You will also need the following items:
Necessary items for the air track: one air blower box one blower box power cord one flexible air hose two "end pieces" for each end of the track one flat plastic accessory box
3. Connect the air blower hose to the track and the blower; connect the power cord to theblower. Turn on the blower to a level of about 2 units to allow the track to warm up.
4. In the accessory box you will find four thumb screws used to mount the two end pieces onthe air track. Mount the end pieces on the track. Remember these must be taken off when youare done. 5. Also from the accessory box, remove two end reflectors (they are flat and U-shaped) and insert a rubber band tautly in each one. Insert each end reflector in the end pieceyou already mounted on the air track. Insert the end reflector in the top hole of the end piece.
B. Preparing the glider. The plastic box has many items for the glider. These items can beadded to one side or the other of the glider or the top of the glider. There are also weightsprovided to increase the mass of your glider. For the correct balance, weights should alwaysbe added evenly to both sides of the glider. Your lab experiment equipment list will tell youexactly what accessories are needed for a given lab. You always need at least one glider (seeyour experiment equipment list) and the accessory box from above.
You will always need an accessory in the top of the glider to act as a "flag" (see below,section IV). The flag triggers the photogate. Typically the flag will be one of the cylindricalplugs found in the accessory box. You will also need an accessory inserted into both ends ofthe glider. Often this will be a cylindrical plug with a flat end on it (two of these are in oneaccessory box). Insert one of these cylindrical plugs with a flat end in each end of the glider.Use the upper of the two holes in the glider end to insert the cylindrical plug. The flat end onthe glider should be oriented vertically so that it will push against the rubber-band reflector onthe end of the air track.

23
The correct position of thephotogate and cart.End View
You are asked to hold the glider in your hand when adding accessories to it and notadd accessories while the glider is on the lab bench, or the air track, to prevent having thesides of the glider bent from pushing down on it while it rests on a hard surface. Your handholding the glider will "give" when pushing an accessory into the glider and therefore thesides of the glider will not be bent or damaged.
C. Preparing the photogate timers. You will need at least one photogate timer (see yourexperiment equipment list). You will also need a power cord for the photogate. The powercord will have a transformer end that plugs into the power outlet; you may also need anadaptor to plug the transformer into the lab bench power strips. The photogate timer is turnedon by turning the slide switch to gate, pulse, or pendulum mode. To correctly position thephotogate see sections IV and V below.
Note: When finished with your experiment, the "break-down" of the apparatus is the reverseof the above. Make sure you take the glider off the track before you turn off the air blower.
IV. How to adjust the air track and photogates for optimum accuracy in measurements:
1. Photogate placement. For accurate results the photogates must be correctly placed. See thediagram below and notice how close one side of the photogate is to the glider. This eliminatesso-called parallax error. The glider has a "flag" that triggers the timer.
A flag is an object placed on the top ofthe glider that interrupts the photogatebeam and activates the timer.Use a cylindrical plug on the top ofyour glider as a flag. Using thecylindrical plug means that the crosssectional length the beam senses isindependent of the rotation of thecylinder. This is important so you don'thave to worry about the rotationalposition of the flag affecting yourmeasurements.

24
The Photogate
2. Blower output level. The blower output may be too low or too high. If the blower output levelis too low then the glider may scrape the track and damage could result. If the blower output levelis too high, the glider may be blown one way or the other and your results will be less accurate. Itis better to have the blower output too high than too low! Note that the air output through thesmall holes is higher near the blower input end of the track and air output is lower at the end ofthe track far from the blower input.
Make sure air output is high enough to keep the glider from scraping the track at the endof the track farthest away from the blower input. A blower output level of at least 2.5 is correctwhen one unweighted glider is on the track. You will have to increase the output level whentwo gliders are used or when a more massive glider is on the track. As long as a glider does notnoticeably slow down from a gentle push, the output level is high enough.
3. How to level the air track. Unless your experiment involves tilting the track for an inclinedplane experiment, you must make sure your track is level. Place one glider near the center of thetrack. If the track is level, the glider will drift back and forth randomly but will not pick up muchspeed traveling either to the left or to the right. The track is leveled at oneend only using the adjusting screws found on its long "foot". Leveling may take time, be patient.
V. Understanding the photogate timer:
A narrow infra-red beam isemitted from the arm close to thevertical positioning pole. Thisbeam strikes a detector in theopposite end of the arm away fromthe vertical positioning pole. Atimer circuit is connected to thedetector that allows four types oftiming modes to be used. Whenthe beam is blocked a red LED(Light Emitting Diode) lights upon the top of the photogate arm.
Be careful not to over tighten the clamp screws on the photogate arm and notice the small metallever switch (the memory switch) on the photogate timer cannot be turned in the left and rightdirection but up and down only.

25
The four timing modes:
1. Gate Mode: Use this mode to calculate speeds. The timer is activated when the beam isblocked. When the beam is unblocked the timer switches off. If you know the length, L, of anobject (e.g. your glider's flag) and the time it takes for the object to go through the photogate thenyou can compute the average speed of the object as it passes through the photogate. Note, inreality you must not use the "physical" length of the object but the so-called "effective" length,
effL , of the object. See the effective length section found below for more details.
2. Pulse Mode: Use this mode to calculate the time one object moves between two differentphotogates placed some distance apart (a second accessory photogate is necessary). Timingbegins when the beam is first blocked and continues after the beam is unblocked; timingterminates when the beam is blocked again a second time at the second photogate.
3. Pendulum Mode: Use this mode to calculate the period of one full oscillation. The timerstarts when the beam is first interrupted and the timer continues through one more interruptionand then finally stops on the third interruption.
4. Manual Stopwatch: In Pulse mode the START/STOP button makes the timer act as aconventional stopwatch. In Gate mode the timer starts when the START/STOP button is pressedand the timer stops as soon as the button is released.
Memory switch: Each timer has a memory switch to allow the recall of a previously timedvalue. When you recall the stored time, the time displayed is the sum of both events. Thereforeyou must subtract the two displayed times to find the time of the stored event. Typically, leavethe memory switch in the "off" position.
Resolution switch: The slide switch on the front panel enables the user to set the "resolution" ofthe timer to 1 mS (mS = 10 seconds) or to 0.1 mS. In both cases the timer is accurate to 1-3
percent of its readout. The difference between the two settings is that on the 1 mS setting amaximum time interval of 20 seconds can be measured whereas on the 0.1 mS setting only atime interval of 2 seconds can be measured. Not remembering this can lead to many frustratingmeasurement errors. Unless otherwise told, leave the switch on the 1 mS setting.
VI. Finding the effective length of the flag and calculating its speed: Although it sounds odd,the physical length of the flag you use on the glider is not exactly equal to the length that the
effbeam senses with the photogate! The length the beam senses is called the "effective length", L ,and can be measured with the following procedure.

26
An air track with one glider and one photogate.
A. With the glider off the track and held in your hand, gently place a cylinder into the top of theglider. This cylinder is your flag. Remember, don't push down hard on the glider or you maybend its sides.
B. Make sure the blower is turned on so the glider does not touch the track when placed onit.
C. Place the glider on the track near a photogate timer switched to GATE mode. Make sure thephotogate is correctly positioned as described above in section IV.
D. Adjust the vertical height of the photogate so only the cylinder on the glider will trigger thephotogate. Move the glider in and out of the photogate. See that as soon as the flag on your gliderblocks the photogate the red LED on the top of the photogate arm lights up. Use this red LED asthe indicator of when the flag first blocks the photogate.
E. You are now ready to measure the effective length of the flag. Make sure the timer is notrunning. Slowly move the glider into the photogate until the red LED goes on. Record in your labbook the position the front edge of the glider makes with the ruler on the track just when theglider triggers the photogate. Continue to move the glider through the photogate until the redLED goes off. When the red LED shuts off, record the new position of the glider's front edgewith respect to the air track's ruler. The difference between your two recorded positions is the
effeffective length of your flag, L ; the value should be about 1 cm, you should have the value toone decimal place. Make sure this length is clearly recorded in your lab book. All speedcalculations are made using this length.
F. Calculating the speed of a glider in an experiment. Now that you know the effective lengthof the flag, you can calculate the average speed of the glider as it moves through the photogate by
effdividing the effective length of the flag, L , by the time the flag keeps the timer activated, )t.

27
Your setup will look like this.
5. NEWTON'S SECOND LAW AND THE AIR TRACK
Equipment List:C One air track, blower, blower hose and power cordC One digital photogate and one accessory photogateC One gliderC One flat plastic accessory boxC StringC Electronic Pan Balance
Introduction:In this experiment we examine the acceleration of a mass, m (the air track glider), under
hthe influence of a tension force due to the weight of a hanging mass, M . We assume that the onlyhorizontal force acting on the glider is the tension force from the string. For this to be true, thetrack must be level and friction should be negligible. Remember, it is the force from the tensionin the string connecting the two masses that accelerates the glider, not the weight of the hangingmass itself.
Theory:1. Using Newton's Laws, derive an expression for the acceleration of the glider in terms of themass of the glider and the mass of the hanging weight.
2. Using kinematics, derive an expression for the acceleration given an initial and final velocity,and the distance over which the velocity changes.

28
Procedure: 1. Following the methods from the INTRODUCTION TO THE AIR TRACK section, set up yourair track and prepare one glider and two photogates for your experiment. From your accessorybox, take the pulley and connect it to the end of the track that does not have the blower hose in it.
2. Set the two photogates apart by a distance of about 60 or 70 centimeters. Measure precisely(interpolating to the hundredth of a centimeter) the distance between the two photogates by usingthe front edge of the glider as it triggers each photogate as a reference mark. Record youruncertainties and compute the distance between the photogates. By using uncertaintypropagation, compute the absolute uncertainty in the distance (the distance is found by asubtraction) between the two photogates.
3. Using the methods detailed in your air track introduction, compute the "effective length" of theflag on your glider. Do this for each photogate. Do not assume the effective length of the flag isthe same for the two photogates. Again, by uncertainty propagation, find the absolute uncertaintyin the effective length. Set your timer resolution to 0.1 mS.
4. Connect the glider to the hanging weight (found in your accessory box) with the stringprovided.
5. For your first run, use the hanging weight with about seven grams. Confirm the mass of thehanging weight and the mass of the glider (with all attachments in place) on the balanceprovided. Ignore the mass of the string. Record the absolute uncertainty of each mass using themethod of an absolute uncertainty obtained from a digital readout (if you use the electronic panbalance).
6. On the air track with blower on, hold the glider by hand completely clear of the first photogate.Record this initial position for repeat trials. Let the glider go and allow it to accelerate movingthrough each photogate. Record the two times by using the memory switch and subtracting onedisplayed time from the other (which time should be bigger?). Record the absolute uncertainty inthe time using the digital readout method. Take care not to let you glider bounce back through aphotogate as this could change your time readout. Your first run is now complete. Repeat thisprocedure for a total of five runs. For each run you should let the glider go from the same initialposition. You should have five time values for each of the two photogates.
Analysis:
tYou now have the data to compare your theoretical acceleration, a , to the calculated
cacceleration, a . The theoretical value is obtained from the measurement of the two masses and
athe known value of g (let g = 9.80 m/s exactly so that * g = 0). The calculated acceleration is2
obtained from the distance between the two photogates, the times and effective lengths.
You should derive the absolute uncertainties of each acceleration by the uncertaintypropagation methods.
29
Repeat the above for a different hanging weight value varying the distance between thetwo photogates. What effect would varying the distance between the photogates have on theabsolute uncertainty in the calculated acceleration?
State each acceleration with an absolute uncertainty. Do the most probable ranges of the
t ctwo accelerations (a and a ) overlap? If so, then on the basis of your experiment, the values are
c tequal; if not, speculate as to why this is so. Would you expect a to be larger or smaller than abased on the presence of systematic uncertainties?
Conclusion: Discuss the presence of systematic uncertainties and any ways in which these errors may
be eliminated.

30
Your setup should look like this.
6. THE AIR TRACK AS AN INCLINED PLANE
Equipment List:C One air track, blower, blower hose and power cordC One digital photogate and one accessory photogateC One gliderC Five different riser blocksC One flat plastic accessory boxC One meter stick
Introduction:You will calculate the acceleration of a body on an inclined, near-frictionless plane (the
glider on the air track). From this acceleration you can figure the angle of the inclined plane. Youwill then compare this calculated angle to your actual measurement of the angle and see howclose the two results are using a discrepancy test.
Theory:Derive an equation that gives the angle of an inclined plane, 2, as a function of the
acceleration of a body down the plane and g.Also, from kinematics derive an equation that yields the acceleration of a body given its
initial and final speeds and the distance between the points where it has those speeds. You willneed this equation to calculate the acceleration of the glider along the track.
Procedure:
1. Set up your air track equipment following the procedures in the INTRODUCTION TO THEAIR TRACK. Remember, you need notworry about leveling your air track since this experiment uses the air track as an inclined plane.
2. Using some combination of the small riser blocks provided, raise the end of the air track thathas one foot only (the other end has two feet) about one centimeter.
31
3. Experiment to determine good placement of the photogates when one end of the track iselevated. Place the two photogates as far apart as possible. Measure the distance between the twophotogates. To measure this distance, use the leading edge of the glider and record the position ofthe glider as it triggers each photogate. To see if the photogate has been triggered, check the redLED on the top of the photogate arm. Subtract the position of the glider at each photogate andyou will have the distance between the two photogates.
4. For your runs, have the timer set to GATE mode, and have the resolution switch set to 0.1 mS(use the 0.1 mS setting only if the time the glider is between the photogates is less than twoseconds). The memory switch should be turned on so that the small red LED next to the switch islit. The number on the LCD display is always the time measured in seconds.
5. Release your glider and let it accelerate moving through both photogates. Record the time foreach photogate. The first photogate time is read directly from the LCD display on the timer. Thesecond time is found by subtracting the first time displayed from the time displayed after theMEMORY READ switch is pushed. Understand on a physical basis which time should besmaller. Make sure the glider doesn't bounce back through the second photogate for a secondtime; this may change your time readings.
6. Repeat the same procedure for a total of five trials. This will allow you to calculate fiveaccelerations which, in principle, should all be the same. Of course, due to random fluctuationsthe accelerations won't be identical. Apply the statistical method to calculate an averageacceleration with an absolute uncertainty.
7. From the above acceleration, compute the angle of the incline.
8. Now calculate the angle of the plane. Use right triangle trigonometry to calculate the angle as afunction of the arctangent (or arcsine if appropriate) of two measured sides. It is for you to figurewhat two sides need to be measured.
Analysis: Compare your two angles using a discrepancy test.
Optional Graphical Analysis Repeat steps 3-7 for four more angles for a total of five different angles and 25 timing runs.Calculate g from the slope of a straight line graph that relates the angle 2 to your calculatedacceleration. Your graph will have five data points.
Conclusion: Discuss methods that would minimize the discrepancy calculated above. Whichangle would you expect to be larger most of the time due to systematic errors? See if you candiscover any systematic errors and suggest ways in which they could be eliminated or at leastminimized. At the discretion of your instructor, hand in an abstract written by you and yourpartner. The structure of an abstract is discussed in your lab skills manual.

32
Glider 2 is initially at rest and closer to photogate 2.
7. KINETIC ENERGY AND CONSERVED QUANTITIES
Equipment List:C One air track, blower, blower hose and power cordC One digital photogate and one accessory photogateC One Pasco counter-timer (optional)C Two glidersC One flat plastic accessory boxC One set of riser blocks (if enough time is allowed)C Digital Pan Balance
Introduction:
In this lab we examine the kinetic energy of two bodies before and after they collide intwo different types of collisions:
1. An elastic collision: The bodies bounce away from one another with no energyloss.
2. A totally inelastic collision: The bodies stick together after the collision.
You will calculate the kinetic energy of each body before and after each type of collision
total 1and compare the total kinetic energy of both bodies before and after the collisions (KE = KE
2+ KE ).
If the total kinetic energy remains unchanged after the collision, then we say the kineticenergy is "conserved". In this experiment you will test whether kinetic energy is conserved in thetwo types of collisions discussed above.

33
Procedure: 1. Experiment to determine appropriate placement of the photogates. Measure the distance usingthe glider as a reference. Place your two photogates about fifty centimeters apart or even closer ifyou can still take accurate measurements. You should explain the advantage of having thephotogates as close together as possible.
2. Prepare your two gliders for an elastic collision (i.e., they will bounce apart) by placing onerubber band bumper on each glider so that the sides of each glider that touch during the collisionmeet with bumpers. The other end of each glider should have cylinders put into them so that thegliders are balanced. Increase the mass of one glider (call it glider 2) by slipping one weight(from your accessory box) onto the post found on each of its two sides; one weight on each side.Measure the mass of each glider complete with all accessories on the digital pan balance.Measure the effective length of each glider through each photogate.
3. Place glider 2 at rest between the two photogates but close to the second photogate. Place theother glider (glider 1) outside the two photogates and prepare to launch glider 1 through the firstphotogate so that it collides with glider 2 before either glider goes back (or forward) through aphotogate. When the collision occurs, make sure glider 2 is initially at rest so that you know theinitial speed of glider 2 is zero.
You will have three time measurements from your photogates. The first time will yieldthe initial speed of glider 1. The other two times will allow you to calculate the speeds of bothgliders after the collision. With just the LED photogate timer and one accessory photogate, thismay require some practice. The times will have to be recorded and quickly erased for new times.You may opt to use a Pasco counter-timer with an accessory photogate for greater accuracy,check with your instructor. Best of all would be the Pasco counter-timer with two accessoryphotogates plug into the back of the counter with no LED photogate timer. This method is theeasiest way, but if the lab has too many people, there may not be enough accessory photogatetimers so everyone can have two.
4. From the effective length measurements and the photogate measurements as well as themeasurements of the mass of each glider, calculate the total initial kinetic energy and comparethat value to the total final kinetic energy after the collision. Determine within experimental errorwhether the two values, the total initial and final kinetic energies, are equal. That is, does thetotal initial kinetic energy equal the total final kinetic energy? On the basis of your experiment, iskinetic energy conserved in this type of collision?
5. Repeat the above procedures varying certain parameters. For example: A. Make both gliders equally massive (the result is surprising and not trivial to
correctly explain).B. Make glider 1 more massive than glider 2. Categorize your results as a function of
different initial speeds of glider 1.

34
6. Totally inelastic collisions. Prepare your gliders so that they do not bounce away from oneanother after the collision but so that they stick together after the collision. To do this, remove therubber band bumpers from each glider and replace with the needle and wax cylinders describedbelow.
In your accessory box, one of your cylinders has a cork on one end. Carefully remove thiscork and see the needle. The cork exists to protect you from stabbing yourself or someoneelse (the teacher?) with the needle. Please leave the cork on the needle when you are notusing this cylinder to avoid puncturing yourself.
Another cylinder in your box has some ear wax in one end. Together, the needle and thewax cylinders allow two gliders to stick together when they collide. It doesn't matter which gliderhas which type of cylinder.
7. With the needle and wax cylinders, repeat the relevant procedures from above to examine thevalues of the total kinetic energy before the collision to the total kinetic energy after the collision.From the basis of your experimental results, conclude whether the total kinetic energy of bothgliders is a conserved quantity in this type of collision. If not, why not? Is the initial energygreater or less than the final energy? What happens to the missing energy?
Other energy experiments: 1. Energy conservation: Using the riser blocks, raise the single footed end of your air track sothat it becomes an inclined plane. Using one glider and two photogates, measure the change inthe kinetic energy of the glider as it accelerates down the track. Experimentally relate thisincrease in kinetic energy to the decrease in gravitational energy within theglider-earth system. You will need to measure the change in the vertical height of the glider at thetwo positions of each photogate as well as some other parameter left for you to determine.
2. The work done by friction: Level your track. Put your two photogates as far from oneanother as possible. Launch one glider through the first photogate. If the track is perfectly leveland there is no friction, the glider should have the same speed through the first photogate as it hasthrough the second photogate. Calculate the kinetic energy of the glider at each of the twophotogates and compare the initial and final values. If the two kinetic energies are not equal, thenby the work-energy theorem, the change in the kinetic energy must equal the work done on theglider by the friction force.
Compute the coefficient of kinetic friction between the glider and the air track. You mayneed to measure other values to accomplish this. Work out the theory first then you will need toknow what to measure. Repeat for different glider masses to see if the coefficient of kineticfriction is independent of the mass of the glider (should it be?). Also, repeat the experiment fordifferent initial glider speeds and see if the coefficient changes with these different speeds.

35
3. The energy loss in an end reflection: You only need one photogate and one glider for thisone. Put the photogate near one end of a leveled air track. The track end and glider should bothhave rubber band bumpers attached to them. With the photogate close to the bumper (but not tooclose!), calculate the kinetic energy of the glider after the reflection and compare it to the kineticenergy before the reflection. Discover how the energy loss due to an end reflection is a functionof the incident speed of the glider. Would you expect the energy loss to be constant, linear, or apower curve as a function of incident speed? A graph would help you see this.

36
See Tipler's Physics, 3rd edition, pages 65-67.3
8. CENTRIPETAL ACCELERATION
Equipment list: C Circular motion apparatusC Pan Balances C Weight setsC String (the string is stored by wrapping it around the "vertical pointer")C Counter-timers
Purpose: In this lab you will calculate a centripetal acceleration and confirm the value of the force
necessary to cause this acceleration.
Theory: Any body undergoing circular motion must be accelerating even if it is moving at
constant speed since the direction of its velocity vector is continuously changing. Sinceacceleration is a vector it has a magnitude and a direction. It can be shown that the magnitude of3
the centripetal acceleration is v /r, where r is the radius of the circle the body is moving in, and v2
is the body's speed. The direction of the acceleration vector at any instant is always toward thecenter of the circle.
By Newton's 2nd Law, any body that is accelerating necessarily has a non-zero net forceacting on it. In circular motion, the net force is often called the centripetal force, but it isimportant to understand that the centripetal force is the name of the net force acting on a bodyand always represents the vector sum of "real" forces acting on the body. The centripetal force isnot itself a single, "real" force but the name given to the net force acting on a body causing it tomove in a circle.
Leave at least one page in your theory section for further derivations.
Introduction: This lab is performed in two parts. In the first part a "bob" undergoes circular motion
when spun by hand (see the diagram on page 2). By knowing the radius of the bob's circular pathand the time it takes to complete one revolution, you can compute the magnitude of the
ccentripetal acceleration of the bob, a .
In the second part of the lab, in a non-accelerating static situation, you will measure aforce equivalent in magnitude (but not conceptually equivalent!) to the net force required to make
hangingthe bob accelerate in the first part. This force is the weight of a hanging mass, W .
37
The setup for part 1. It isimportant the stringholding up the bob be keptabsolutely vertical whilespinning.
hanging bob cThe analysis consists of comparing W to M @ a . These two values should be equal.
hanging bob cNote: The following paragraph is an in-depth explanation of why W is equal to M @ a .
To see that the magnitude of the static force measured in the second part of the lab isequal to the mass of the bob multiplied by the resultant acceleration of the bob in the first part ofthe lab, see that the spring is stretched by the same amount in both the dynamic and static parts,and see that if a spring is stretched by the same amount in any case, then the same magnitude offorce is acting on it. However in the dynamic part of the lab (part 1), the spring exerts an inwardforce on the bob to keep the bob accelerating and this is the only horizontal force acting on thebob. By Newton's 3rd Law then, the bob exerts a force back on the spring outward therebystretching the spring. In the second part of the lab (part 2), there are no accelerations, the bob isin static equilibrium. The hanging weight pulls out on the bob via the connecting string (note: thetension in the connecting string is only equal to the hanging weight since there is no acceleration)and the spring pulls inward on the bob. Since the acceleration of the bob is zero, the net forceacting on the bob is zero, so the force of the hanging weight on the bob is equal in magnitude tothe force of the spring on the bob.
Procedure: Part 1. The dynamic part. Preparation: Setting the radius of the circle. With the springnot attached to the bob, allow the bob to freely hang withoutmoving. Position the vertical pointer underneath the bob sothe rod and bob match exactly. You now have set the radiusof the circle. Measure the radius and record its value. Youmight have to move the horizontal position of the counter-weight and bob assembly in addition to the vertical pointer toachieve the correct alignment. Re-attach the spring to thebob. Use the leveling screws on the base of the apparatus tolevel the platform. You are now ready to "run" the dynamicpart of the experiment.
Running part 1. Practice rotating the bob (while the spring is attached to it) by turning the vertical shaft.
Make absolutely certain that the bob is swinging directly over the pointer at all times. If the bobis not directly over the pointer as it swings in its circle, then the string holding up the bob willhave a horizontal component. The horizontal component of the string's tension force will alter thespring's force on the bob and your results will be inaccurate. Position your hand near the bottomof the shaft where it is roughened for a good grip. You must rotate the shaft and therefore the bobat a constant speed. You can check to see if you are doing this because if you turn the shaft at the

38
Your setup for the static part.
"correct" speed then the bob will always be just over the vertical pointer. You may have to holdon to the bottom section of the whole apparatus to keep it from turning with the bob.
When you have gained confidence in turning the shaft at constant speed, have your labpartner use the counter-timer to time at least fifty total rotations. Call this time the total time,
totalT . You now have the necessary data to calculate the centripetal acceleration of the bob.
Record all your measured values in the data section of your lab book.
In the theory section of your lab book (you do have the space, right?), derive an equation
cfor the centripetal acceleration, a , in terms of the radius of the circle you measured and the total
totaltime of all fifty turns. Your final equation should be a function of r and T only, no speed v!Hint: the circumference of a circle is 2Br and the speed of a body moving in a circle is 2Br/t,
cwhere t is time for one revolution. Use your final equation to find the numerical value of a inyour calculation section.
Part 2. The static part. Leave the spring attached to the bob.As shown in the diagram at the right,place an amount of mass on thehanger that stretches the spring so thatthe bob moves over the verticalpointer. The value of the hangingmass's weight (include the hanger!) isequal in magnitude to the force thatwas required to make the bobaccelerate in part 1. This equivalenceis actually far from obvious but isworth some effort on the student's partto fully explain it.
Part 3. The last thing to do is to measure the mass of the bob. From Newton's 2nd Law, to equatethe net force and the acceleration of a body, the mass of the body must be known. A question toanswer is whether you should measure the mass of the spring as well as the bob.
39
You should repeat the above procedure for one more radii. Switch jobs with your partner.
hanging bob cCompare your two values, W and M @ a , and discuss the results including theuncertainties. If your agreement is reasonable you are ready to go on and complete the lab.
Analysis: With this equation in mind, take five sets of data varying in radius and period. Knowing
the equation that relates the radius and the period, construct a graph with the appropriate axis thatgives a straight line whose slope can be related to the mass of the bob. Use linear regression tofind the best slope and calculate the mass of the bob with an uncertainty. Compare the mass ofthe bob to its measured value found earlier. Use a full uncertainty analysis.
Questions to consider.Speculate on possible sources of systematic errors that could be eliminated in future labs.
hanging bob cIn terms of systematic errors, would you expect W or M @a to be consistently larger? Ifyou can think of a reason, explain why.
What is the experimental value of using fifty total rotations rather than just one or ten? What typeof error does this technique minimize?
In the dynamic part of the lab, if the string tension force on the bob has a horizontal componentpulling out on the bob, will this make the spring force on the bob larger than it should be orsmaller than it should be? How would this change if the string tension force had a horizontalcomponent pulling in on the bob? (Remember, there should be no horizontal component of thestring tension force.)

40
9. SIMPLE HARMONIC MOTION (WITH AN AIRTRACK)
Equipment List:C Air track and accessoriesC digital balanceC weight set and hangers
Introduction; This lab involves a graphical analysis of data taken during the simple harmonicmotion of a glider when under the action of a spring's restoring force.
Theory: By examining the forces acting on the glider and using Newton's second law, a solutionof the resulting differential equation is obtained with the condition that the angular frequency, o,of the oscillating mass, m, is:
o = [k/m]½
where k is the stiffness coefficient of the spring.
Since the period of the oscillation is defined as T / 1/f and the angular frequency is defined aso = 2Bf, the relation between the period, the mass, and the stiffness can be found. Do this.
Note: Your photogate timer should be set for a 1ms resolution. Also, don't use the small hangingweight set found in the accessory box, use the weight and hanger set provided.
Procedure: Refer to the diagram below for the set up.

41
Take sufficient data to analyze the relation between T and m. Use this data to draw agraph and find the stiffness of the spring k. Your graph should be linear but the relation betweenT and m is not linear. Construct the axes of your graph such that a linear graph will result. Relatethe slope of the line to the value of k. Find the correct axes before you begin your data taking sothat you can draw a rough graph while you take the data, point for point. This technique will helpto see if your axes are indeed correct and if your data yields a straight line. Measure the slope ofthe graph and determine k.
More: Perform a linear regression for the value of k and a full uncertainty analysis for theabsolute uncertainty in k. Include error bars on your data in the graph. Use the computer to drawa quality graph and tape the graph in your lab book.

42
10. SIMPLE HARMONIC MOTION (NO AIR TRACK)
Equipment List:C An ample supply of string and scissors to cut it.C Hanger and weight setsC Photogate timersC Connecting rod assemblies to form an "L" shape over the lab bench
Introduction: In this lab a simple pendulum is investigated in terms of its periodic motion. The
parameters involved are the length of the pendulum, l, the period of one oscillation, T, and themass of the "bob", m. These three parameters are related by an equation derived from Newton'slaws.
Theory: Derive the simple pendulum equation that relates the period of one oscillation to thelength of the string. Make the necessary approximations. Examine the theoretical dependence ofthe period on the mass of the bob, on the length of the string, and on the amplitude of theswing, 2.
Procedure:
1. Construct the apparatus approximately asshown to the right. All that matters is that youget something that does not "sway" as the bobmoves back and forth; you need a stableplatform.
2. With one and only mass, measure thedependence of the length of the string on theperiod of the motion. This means you musttake several runs (the more the better) with asingle length of string, then change the lengthand perform some more runs. Take data for atleast five different lengths.

43
Analysis:1. Graph the length versus the period for your data such that the resulting curve is a straight line.Which variable should be on the x axis?
2. Perform a linear regression to find the value of g from your data. Include an absoluteuncertainty for your measurement found from the statistical methods of linear regression.
3. Compare your calculated value of g with the expected value, 9.81 m/s . 2
More:
1. Investigate the dependence of the period of the pendulum on the amplitude of the swing.
2. Investigate the dependence of the period of the pendulum on the mass of the bob.

44
11. SIMPLE HARMONIC MOTION AND A VERTICAL SPRING
Equipment List:C Vertical spring apparatusC Weight sets and hangersC Timers
Introduction:
This lab examines the relationship between the period of the oscillation of a verticalspring and the mass of the hanging bob. As well, the stiffness of the spring must be determined.
Theory:
From Newton's Laws derive a formula that relates the period of the motion of the mass ona spring to the mass of the hanging weight and the stiffness of the spring.
Procedure:
Finding the stiffness of the spring (method 1):
1. Set up the apparatus as shown in thediagram to the right.
2. Increase the mass of the hanging weight and measure the resultant change in the position of thepointer against the mirrored background ruler provided with the apparatus. Use the mirrorqualities of the ruler to align the actual pointer to the image of the pointer in the mirror. by
45
moving your head back and forth and up and down you can align the two images. When thesetwo images are aligned, parallax error has been minimized.
Will this reduce the systematic uncertainty or the random uncertainty in the measurements takenwith the ruler?
3. Construct a graph where, from your examination of the theoretical formula already derived,will yield a straight line. From the same formula, relate the stiffness of the spring to the slope ofthe graph. Use linear regression.
Finding the stiffness of the spring (method 2):
1. Measure the period for at least five different masses. That's five periods for fivemasses. Graph the results as a linear function. Perform a linear regression on the data and find the valueof the stiffness of the spring with an uncertainty.
Analysis:
With uncertainties in both values, compare the stiffness of the spring in terms of aconfidence level.

46
Ignore the rotational inertia of the pulley, but don'tforget to include the increasing kinetic energy of thehanging mass as it falls.
12. ENERGY CONSERVATION AND MOMENT OF INERTIA
Equipment List: C The "rotating platform", its disk, and hoopC Pulleys and long rods C One hanging weight setC StringC One Pasco counter-timer and two-meter sticksC Electronic pan balanceC Vernier Calipers
Introduction: Given an appropriately defined and isolated system, the total energy of that systemwill remain unchanged; this is an expression of energy conservation. When rotational velocitiesare involved in some process, we must expand the concept of kinetic energy and now distinguishbetween two forms of kinetic energy, linear and rotational. Let the rotational kinetic energy be defined as follows:
RKE / ½ I@o 2
Where I is called the "moment of inertia" or "rotational inertia" of the body and o is the body'sangular velocity.

47
Conceptually, the moment of inertia of a body describes its resistance to having itsangular velocity changed; it is analogous to "linear" inertia in describing how a body resistshaving its linear velocity changed. The rotational inertia of a body depends on its mass and howits mass is distributed relative to the axis of rotation.
Thus, we now expand the work-energy theorem to include these two forms of kineticenergy.
extW = )KE + )RKE + )U
In this experiment, we will use this equation to solve for the moment of inertia of variousbodies, some with known theoretical values allowing a check of your experimental technique,and some bodies with unknown rotational inertia values.
Theory:
Consider the diagram of your apparatus shown on page 46, define the correct system,invoke energy conservation, and solve the work-energy theorem for the moment of inertia of therotating body.
As the hanging weight falls, the rotating platform starts to spin. The gravitationalpotential energy between the earth and hanging mass decreases and the linear kinetic energy ofthe hanging weight and the rotational kinetic energy of the rotating platform both increase. Thetotal energy is conserved if there is no work done by friction to decrease the system's energy.
Clearly define all the values that need to be measured experimentally.
Procedure:
1. Set up your apparatus as shown.
2. Let the hanging mass fall from rest so its linear velocity is initially zero and the angularvelocity of the rotating platform is initially zero.
3. From kinematics, derive an expression for the final velocity of the mass after it has fallen fromrest through a vertical distance you measure with the meter stick during a time measured by thecounter-timer.
4. Perform your first run with the rotating platform alone (don't use the hoop or the disk) so youcan calculate the moment of inertia of the rotating platform. There is no theoretical value for themoment of inertia of the rotating platform since it is irregular in shape, so its rotational inertiamust be determined empirically. This must be done before the moment of inertia of the otherobjects can be calculated.

48
5. Calculate the moment of inertia of the rotating platform.
6. You will need to measure the radius of the drum of the rotating platform. Use the verniercalipers.
7. Now run the experiment with the disk on the rotating platform and then with the hoop on therotating platform. Calculate the moment of inertia of the hoop and disk. Compare your calculatedvalues to the theoretical values.
8. Run the experiment with both the hoop and disk on the rotating platform and confirm that themoment of inertia of the sum of the two is equal to the moment of inertia of each addedseparately.
9. Time allowing, try some other object and calculate its moment of inertia. See if you canestimate its values by reasoning and approximations before you actually calculate it.
A refinement: See if the systematic error introduced by the bearing friction of the rotatingplatform's drum can be eliminated by first measuring this friction value and then subtracting itfrom your calculations.