physico-chemical study of soil from selected maize farms .... anthoney swamy, et al.pdf ·...
TRANSCRIPT

Int.J.Curr.Microbiol.App.Sci (2015) 4(10): 438-447
438
Original Research Article
Physico-Chemical Study of Soil from Selected Maize Farms in Kamelilo, Kericho County
T. Anthoney Swamy*, Terer Erick Kipngetich, Barasa Exevier and Magut Hillary
Department of Chemistry, University of Eastern Africa, Baraton P.O. Box. 2500-30100, Eldoret, Kenya
*Corresponding author
A B S T R A C T
Introduction
Soil analysis is an important aspect of agricultural activities. It is significant to the production of sufficient food and the need for sustainable agriculture. Kenya is largely dependent on agriculture, and this dependence has led to continuous use of arable land for many years. Physico-chemical study of soil is important to determine the suitability of soil to different types of crops, the type of fertilizers to be applied and the management practices to be utilized to improve the soil production
ability in order to make it productive.
Maize (Zea mays) is a staple food crop crown in major parts of Kenya with much concentration in Rift Valley and it requires high levels of available nitrogen and phosphorus for maximum yield. The presence of plant nutrients in the right proportion and in the right form to support plant growth is a concern for agriculturalists. The shift from conventional agriculture to modern agricultural techniques has seen the
ISSN: 2319-7706 Volume 4 Number 10 (2015) pp. 438-447 http://www.ijcmas.com
Physico-chemical study of soil was performed in this study to determine the levels of different physical and chemical parameters in seven selected maize farms. A total of 21 samples were collected in ploughed maize farms in Kamelilo Village in Kericho County for physico-chemical study. Samples were obtained from seven selected maize farms in triplicates. The physical parameters that were studied are pH and organic carbon while the chemical parameters like phosphorus, Sulphur and Nitrogen were determined. From the study, 71% of the soil samples had a low pH which makes the soil unsuitable for maize farming. The recommended pH for maize growing is 5 7 which has a positive effect on the availabilty of nitrogen and other plant nutrients. The percentage of organic carbon was rated as high in 90% of the soil samples with a minimum value of 1.03% organic carbon to a maximum value of 2.85% except in two sampling sites, sample 3a with 0.45% and sample 5a with 0.49% respectively exhibiting a low organic carbon value. It is the recommendation of the researchers that regular soil testing should be done to determine if the soil is in the ideal condition for a specific crop.
K e y w o r d s
Physico-chemical, Kamelilo, Soil, Maize
Int.J.Curr.Microbiol.App.Sci (2015) 4(10): 438-447
439
introduction of inorganic fertilizers to improve crop performance and enhance the yield. Maize production in Kenya has been constrained by the low levels of available phosphorus and nitrogen in soils (Sanchez, 2002; Bunemann, 2003; FAO, 2004). The presence of good levels of nitrogen, sulphur, organic matter and phosphorus in soil in good proportion is indicative of good crop yield. Nitrogen is an essential plant nutrient that is required by plants in abundance. Nitrogen is an essential element of all amino acids; it is the building block for proteins. Nitrogen also is a component of chlorophyll. Therefore, it can be inferred that nitrogen concentration in soil is directly proportional to the crop yield. Proper management of nitrogen is important because it is often the most limiting nutrient in crop production and easily lost from the soil system.
Farmers local knowledge of soil fertility and management strategies plays a significant role in fertility maintenance of farmlands and also contributes to the participatory development of interventions to sustain farm productivity. Farmers have an intimate and a well-developed knowledge system about their soils, nutrient provision through decomposition of plant organic litter, and nutrient loss and cycling processes. This knowledge system is made up of experiences and phenomena that they can visualize and information retained from colleague farmers and extension officers. Though farmers knowledge and perceptions of soil fertility are purely qualitative, they tended to match the scientific assessment of fertile or infertile soils (Dawoe et al., 2012). With increasing use of participatory research approaches, it has become clear that farmers knowledge and perceptions of soils as well as local indicators of soil quality are important for the development of technologies and management interventions and therefore the need for effective
collaboration between farmers, scientists and extension workers (Desbiez et al., 2004; Niemeijer and Mazzucato, 2003; Shrestha et al., 2004; Dawoe et al., 2012).
Plant s nitrogen (N) requirement that is not fulfilled by available N in soil has to be supplied externally through chemical fertilizers. A reliable estimate of soil N-supplying capacity (NSC) is therefore essential for efficient fertilizer use. The two commonly used indices of N availability in India, namely Corg and alkaline KMnO4-N did not perform satisfactorily when tested for acidic soils. Therefore, PBB-N as a better alternative index of N-availability for the acidic soils of India and the other regions with similar soils (Bordoloi et al., 2013).
Soil is a complex matrix made up of different chemical, physical, and biological constituents. This characteristic gives soil its unique behavior to be a media for plant growth. Soil acts as plant nutrient reservoir. Human activities over the years have had a negative impact on the soil. According to Pidwirny (2006), human activities have severely altered the nitrogen cycle (Figure 1). Some of the major processes which have brought these alterations include: the application of nitrogen fertilizers to crops has cause increased rates of denitrification and leaching of nitrate into groundwater, increased deposition of nitrogen from atmospheric sources such as forest burning and fossil fuel combustion, livestock ranching which releases a lot of ammonia and sewage waste and septic tank leaching.
Soil can lose gaseous nitrogen in two different forms, i.e., denitrification and volatilization. Denitrification is a biological process where nitrates are converted to atmospheric nitrogen. The process is mediated by denitrifying bacteria. According to a study by University of
Int.J.Curr.Microbiol.App.Sci (2015) 4(10): 438-447
440
Hawaii (2014), for denitrification to occur, organic carbon ought to abundant for the bacteria to thrive; low pH is also sensitive to denitrifying bacteria. Denitrification is optimal at a soil pH of 6.0 6.5. The second path on nitrogen gas loss is through volatilization; which is the gaseous loss of ammonia. At high pH, half of ammonium is basically converted to ammonia
Continuous application of nitrogen-based fertilizers has an effect on the soil pH. According to Singleton (2006), soil bacteria oxidize ammonium to nitrate through the nitrification process, which in turn produces two hydrogen ions. These hydrogen ions are responsible for soil acidity. Phosphorus is very important for seed germination and root development. Fields with low phosphorus levels may not have well-developed root systems, leading to heavily-stressed plants during droughts (Nova, 2010). The aim of the present study is to determine the levels of different physical and chemical parameters in seven selected farms.
Materials and Methods
A total of 21 samples were collected in ploughed maize farms in Kamelilo Village in Kericho County for physico-chemical study. Samples were obtained from seven selected maize farms in triplicates.
Analysis of pH:
The pH of the soil samples was measured using Jenway pH meter model. The pH meter was first calibrated with two buffer solutions; pH buffer 4 and pH buffer 7. To measure the pH of the soil samples, 10 g of well mixed dry soil sample was weighed into a 100 mL beaker. To this 25 mL of distilled water was added, stirred well by a glass rod and left to stand for 30 minutes. After 30 minutes, the soil solutions were
stirred and the pH taken using an electrode.
Organic carbon
The percentage organic carbon was determined according to Walkley and Black (1934). In this method, 1 gram of the soil sample was weighed into 250 mL Erlenmeyer flasks, 10 mL of 1N potassium dichromate solution was added using a pipette. To this 20 mL of conc. Sulphuric acid was added using a measuring cylinder. The flasks were swirled and left to stand for 30 minutes. After 30 minutes, 200 mL of distilled water was added slowly followed by the addition of orthophosphoric acid. To the flasks, 1 mL of diphenylamine indicator was added and titrated against 0.5N ferrous ammonium sulphate to a green colour end point. A blank was prepared following the same procedure with the exception of soil addition.
Available nitrogen (alkaline potassium permanganate method)
To a distillation flask, 20 g of well mixed dry soil samples were placed, 20 mL of distilled water and 100 mL of 0.32% potassium permanganate solution was added. In a 250 mL of conical flask, 20 mL of 2% boric acid solution was taken and few drops of mixed indicator was added (3 parts of Bromocresol green and 1 part of methyl red indicator). The end of the delivery unit was dipped into the conical flask. A 100 mL of 2.5% solution of sodium hydroxide was poured into the distillation flask and corked immediately.
Distillation of ammonia was done and collected approximately 50 mL of the distillate into the boric acid solution. The distillate was titrated against 0.02N sulphuric acid till the green colour disappeared (Subbiah and Asiza, 1956).

Int.J.Curr.Microbiol.App.Sci (2015) 4(10): 438-447
441
Available phosphorus
Depending on the pH of the samples, the Bray and Kurtz method was used, however, for soil samples with high pH, Olsen s method of P estimation was recommended (Bray and Kurtz, 1945; Olsen and Sommers, 1982; Olsen et al., 1954):
Reagents
Bray s P1 solution: 0.03M NH4F + 0.025N HCl
Reagent A:
i. 12 g of ammonium molybdate was dissolved in about 250 mL of warm distilled water.
ii. In a separate beaker, 0.291 g of antimony potassium tartarate was dissolved in 100 mL of warm distilled water. After cooling, both solutions were mixed.
iii. 1 L of 5N H2SO4 was prepared by diluting 140 mL of conc. sulphuric acid to one litre. After cooling, ammonium molybdate, antimony potassium tartarate and 5N sulphuric acid were mixed in 2 liter volumetric flask and the volume made to 2 litres.
iv. Paranitrophenol indicator was prepared by dissolved 0.5 g of Paranitrophenol in 100 mL of distilled water.
v. 2% ammonia solution: 2 mL of ammonia solution was diluted to 100 mL.
vi. 5N H2SO4: 14 mL of conc. Sulphuric acid was diluted to 100 mL.
Reagent B (Ascorbic acid solution): 1.056 g of ascorbic acid was dissolved in 200 mL of the molybdate solution (Reagent A) and mixes it well.
Method
The soil samples were prepared by weighing
2.5 g of soil in 250 mL Erlenmeyer flask followed by the addition of 25 mL of Bray s P1 Solution and shaken for 5 minutes on a mechanical shaker. After 5 minutes, filter the solutions and pipette 2 mL into 25 mL volumetric flask. The pH is then adjusted with the aid of paranitrophenol indicator, 2% ammonia and 5N sulphuric acid. To these solutions 2 mL of reagent B was added and made up to volume with distilled water. A blank was prepared following the same procedure without soil. The absorbance of the solutions was measured at 660 nm using a UV Spectrophotometer.
Preparation of standard curve
A 100 ppm P-solution was prepared by weighing 0.439 g of potassium dihydrogen phosphate (KH2PO4) in a 1 litre volumetric flask and 5 mL of concentrated sulphuric acid was added. To prepare 2 ppm solution, pipette 2 mL of 100 ppm solution and diluted to 100 mL with distilled water.
A calibration curve was prepared by pipetting 1, 2, 3, 4, and 5 mL of 2 ppm solution into 50 mL volumetric flasks to make 0.04, 0.08, 0.12, 0.16 and 0.20 ppm respectively and 2 mL of reagent B was added and the volumes made up to 50 mL. After 10 minutes, the readings were taken at 660 nm on a UV spectrophotometer.
Available sulphur
Reagents
CaCl2 solution (0.15%): 1.5 g of CaCl2..2H2O was dissolved in about 500 mL of distilled water and made up to 1 litre.
Gum acacia solution (0.25%): 2.5g of gum acacia was dissolved in 200 mL of warm distilled water and diluted it to one litre.

Int.J.Curr.Microbiol.App.Sci (2015) 4(10): 438-447
442
Experimental
A 5g soil sample each was weighed into a 250 mL conical flask, 25 mL of 0.15% CaCl2 solution was added and shaken on a mechanical shaker for 30 minutes. The solution was then filtered into a reagent bottle. An aliquot of 10 mL was pipette out in a 25 mL volumetric flask, then 0.25% gum acacia solution and approximately 1g of Barium chloride was added and finally made up to 25 mL with distilled water. The readings were taken at 440 nm by using UV spectrophotometer. A blank determination was performed and the similar procedure was carried out for the soil sample.
Standard sulphur (2000ppm)
This solution was prepared by dissolving 1.089 g potassium sulphate in 100 mL of distilled water. To prepare 10 ppm of the working standard, 5 ml of 2000 ppm stock solution was pipette out and made up the volume of the solution to 1 L by using distilled water. To prepare the standard curve, 2.5, 5, 7.5, 10 and 12.5 ml of 10 ppm was pipetted out into a 25 mL volumetric flask. This is equivalent to 1, 2, 3, 4, and 5 ppm sulphur solution. To these solutions, 1 mL of 0.25% gum acacia solution and approximately 1g of Barium chloride was added and the volume made up to 25 mL. The readings were taken at 440 nm using a UV Spectrophotometer.
Results and Discussion
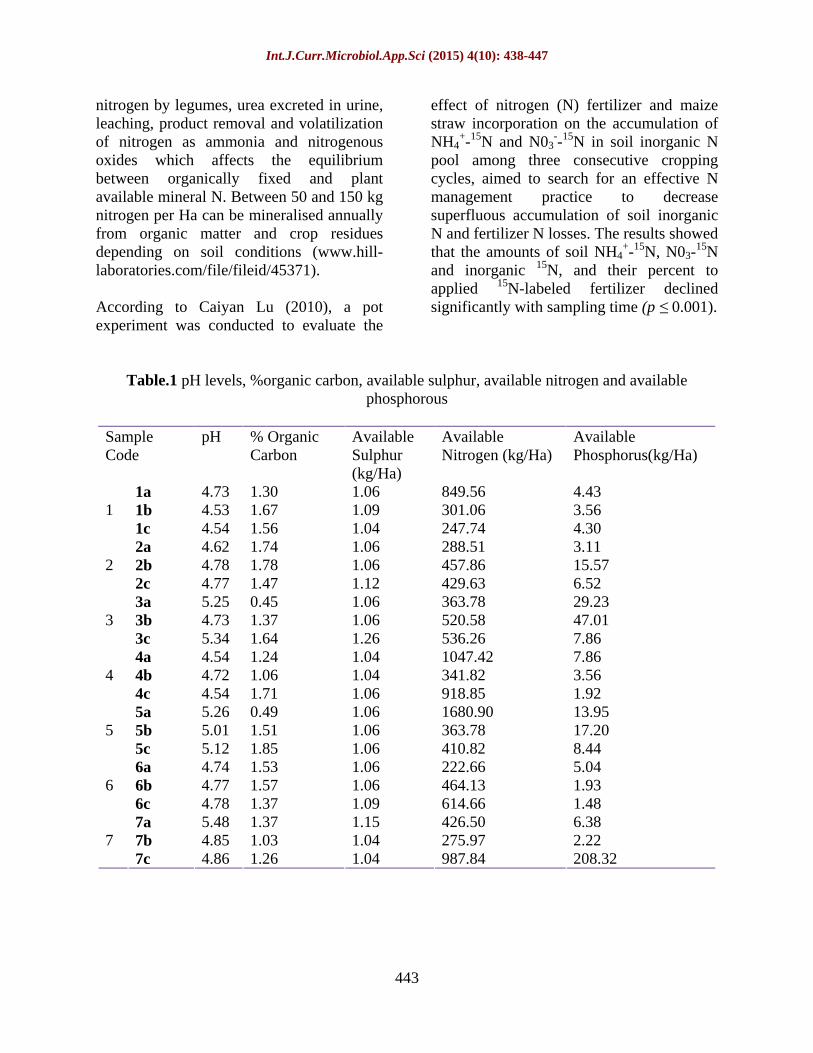
The results (Table 1 and Figure 4) shows that the pH of the soil was low, ranging from a minimum value of 4.53 to a maximum value of 5.48, recorded in samples 4a and 7c respectively. The results rate the type of soil to be acidic and are below the recommended optimum pH of 6.5 for good plant growth and make maximum use of fertilizers. The
continuous application of Diammonium Phopshate (DAP) fertilizer has an impact on the soil pH and the eventual effect on the availability of other plant nutrients (Nova, 2010).
The results (Figure 5) show that organic carbons ranged from 0.45% to 1.85%, lowest and highest values were observed in samples 3a and 5c respectively, the rest fall within that range. The results are almost similar to those obtained by Chan (2008), who found an average of 1,5% organic carbon in soil that were under tillage and average of 2.5% in soil that had no tillage for 19 years. Nova (2010) recommended a minimum level of organic carbon is 3.5% in soil. This is due to organic matter being an important soil health indicator as it contributes to the biological, chemical, and physical properties of the soil.
For available sulphur, there was not much variation among the samples, the lowest values was at in sample 1c with 1.04 kg/Ha while sample 7a recorded the highest at 1.15kg/Ha as shown in figure 6. The results indicate that the soil samples had very low levels of sulphur, inadequate to convert to sulphates for the plants to use it. This is based on the recommended sulphur level 40 kg/Ha (Nova, 2010). Fatemeh et al. (2012) observed that soil with sufficient sulphur facilitated the solubility of the P, Fe and Zn by soil microorganisms.
Figure 7 shows the graphical results of the available nitrogen. It was highest in sample 7c (208.32 KG/Ha) and lowest in sample 6b (1.93 kg/Ha) as shown in the results in figure 3. In comparing with other studies, Hill laboratories found a maximum of 5000 kg/Ha nitrogen in soil sampled in New Zealand. The low varying levels of available nitrogen among the samples could be attributed to use of fertilizers, fixation of
Int.J.Curr.Microbiol.App.Sci (2015) 4(10): 438-447
443
nitrogen by legumes, urea excreted in urine, leaching, product removal and volatilization of nitrogen as ammonia and nitrogenous oxides which affects the equilibrium between organically fixed and plant available mineral N. Between 50 and 150 kg nitrogen per Ha can be mineralised annually from organic matter and crop residues depending on soil conditions (www.hill-laboratories.com/file/fileid/45371).
According to Caiyan Lu (2010), a pot experiment was conducted to evaluate the
effect of nitrogen (N) fertilizer and maize straw incorporation on the accumulation of NH4
+-15N and N03--15N in soil inorganic N
pool among three consecutive cropping cycles, aimed to search for an effective N management practice to decrease superfluous accumulation of soil inorganic N and fertilizer N losses. The results showed that the amounts of soil NH4
+-15N, N03-15N
and inorganic 15N, and their percent to applied 15N-labeled fertilizer declined significantly with sampling time (p 0.001).
Table.1 pH levels, %organic carbon, available sulphur, available nitrogen and available phosphorous
Sample Code
pH % Organic Carbon
Available Sulphur (kg/Ha)
Available Nitrogen (kg/Ha)
Available Phosphorus(kg/Ha)
1a 4.73 1.30 1.06 849.56 4.43 1b 4.53 1.67 1.09 301.06 3.56 1 1c 4.54 1.56 1.04 247.74 4.30 2a 4.62 1.74 1.06 288.51 3.11 2b 4.78 1.78 1.06 457.86 15.57 2 2c 4.77 1.47 1.12 429.63 6.52 3a 5.25 0.45 1.06 363.78 29.23 3b 4.73 1.37 1.06 520.58 47.01 3 3c 5.34 1.64 1.26 536.26 7.86 4a 4.54 1.24 1.04 1047.42 7.86 4b 4.72 1.06 1.04 341.82 3.56 4 4c 4.54 1.71 1.06 918.85 1.92 5a 5.26 0.49 1.06 1680.90 13.95 5b 5.01 1.51 1.06 363.78 17.20 5 5c 5.12 1.85 1.06 410.82 8.44 6a 4.74 1.53 1.06 222.66 5.04 6b 4.77 1.57 1.06 464.13 1.93 6 6c 4.78 1.37 1.09 614.66 1.48 7a 5.48 1.37 1.15 426.50 6.38 7b 4.85 1.03 1.04 275.97 2.22 7 7c 4.86 1.26 1.04 987.84 208.32

Int.J.Curr.Microbiol.App.Sci (2015) 4(10): 438-447
444
Figure.1 Nitrogen cycle courtesy of Pidwirny (2006)
Figure.2 Graphical representation of average physico-chemical data
Figure.3 Available phosphorus in kg/Ha

Int.J.Curr.Microbiol.App.Sci (2015) 4(10): 438-447
445
Figure.4 pH
Figure.5 % Organic carbon
Figure.6 Available sulphur (kg/Ha)

Int.J.Curr.Microbiol.App.Sci (2015) 4(10): 438-447
446
Figure.7 Available nitrogen (kg/Ha)
Compared to low N application rate (44.64 mg N kg-1 soil), high N application rate (89.28 mg N kg-1 soil) enhanced significantly the amounts of soil NH4
+-15N, N03
--15N and inorganic 15N by 238.6%, 132.9% and 197.3%, respectively (p
0.001). In contrast, maize straw addition declined significantly the amounts of soil NH4
+-15N and inorganic 15N by 21.4% and 16.1% compared to without maize straw (p
0.001). The results suggested that a combined application of chemical fertilizer and maize straw with a wide C/N ratio is an important means for reducing the superfluous accumulation of fertilizer N as soil inorganic N to subsequently lower its loss.
In conclusion, the soil samples were of low pH, inadequate levels of available sulfur, nitrogen, phosphorus and organic carbon. Maize and other crops absorb the nutrients required from soil in order to grow, so ensuring that the soil meeting the crops need is critical. Having the proper level of nutrients in the soil will help to produce optimum quality yields. However, for nitrogen, it is unlikely that its levels would stay the same from one season to another since seasonal climatic differences, farming
practices and crop removal will affect residual soil nitrogen levels and the ability of the soil to provide plant available nitrogen. It is the recommendation of the researchers that regular soil testing should be done to determine if the soil is in the ideal condition for a specific crop. Also, soil samples should be submitted immediately to test after collection (or chilled <4ºC) for the Mineral N test, to prevent mineralisation in transit. Freezing may be required if transit overnight is necessary.
Acknowledgement
The authors of this paper are very much thankful to the Department of Chemistry and Department of Medical Laboratory Science, University of Eastern Africa, Baraton for creating space and chemicals to contact this study.
Reference
Bordoloi, L.J., Singh, A.K., Manoj, K., Patiram, Hazarika, S 2013. Evaluation of nitrogen availability indices and their relationship with plant response on acidic soils of India. Plant Soil Environ., 59(6): 235 240.
Int.J.Curr.Microbiol.App.Sci (2015) 4(10): 438-447
447
Bray, R.H., Kurtz, L.T. 1945. Determination of total, organic, and available forms of phosphorus in soils. Soil Sci., 59: 39 45.
Bunemann, E.K. 2003. Phosphorus dynamics in a ferrasol under maize-fallow rotations: the role of the soil microbial biomass. PhD Thesis, Swiss Federal Institute of Technology Zurich. Pp.162.
Caiyan Lu, Jian Ma, Xin Chen, Xudong Zhang, Yi Shi, Bin Huang, 2010. Effect of Nitrogen fertilizer and maize straw incorporation on NH4
+15N and N03-15N
accumulation in black soil of Northeast China among three consecutive cropping cycles. J. Soil Sci. Plant Nutr., 10(4): 444 453.
Dawoe, E.K., Quashie-Sam, J., Isaac, M.E., Oppong, S.K. 2012. Exploring farmers local knowledge and perceptions of soil fertility and management in the Ashanti Region of Ghana. Geoderma, 96(8): 96103.
Desbiez, A., Matthews, R., Tripathi, B., Ellis-Jones, B.J. 2004. Perceptions and assessment of soil fertility by farmers in the mid-hills of Nepal. Agricult. Ecosys. Environ., 103: 191 206.
FAO, 2004 (Food and Agriculture Organization). Gateway to Land and Water Information, Kenya
National Report; http://www.fao.org/ ag/agl/swlwpnr/reports/y_sf/z_ke/ke.htm.
Fatemeh, H., Parisa, S., Hassan, S.V., Hossein, B. 2012. Influence of elemental sulfur and sulfur oxidizing bacteria on some nutrient deficiency in calcareous soils. Int. J. Agri. Crop Sci., 4 (12): 735739.
Hill Laboratories Technical notes (n.d). Retrieved 8th May 2015, www.hill laboratories.com/file/fileid/45371
Niemeijer, D., Mazzucato, V. 2003. Moving beyond indigenous soil taxonomies: local theories of soils for sustainable development. Geoderma, 111: 403 424.
Nova, S. 2010 Understanding the soil test report. Retrieved from
novascotia.ca/agri /.../lab.../analytical-lab-understand-soil.pdf
Olsen, S.R., Cole, C.V., Watanabe, F.S., Dean, L.A. 1954. Estimation of available phosphorus in soils by extraction with sodium bicarbonate. USDA Circular, 939: 1 19. Gov. Printing Office Washington, D.C.
Olsen, S.R., Sommers, L.E. 1982. Phosphorus. In: Page, A.L., et al. (Ed.), Methods of soil analysis, Part 2. Agron. Mongr. 9. 2nd edn. ASA and SSSA, Madison, WI. Pp. 403 430.
Pidwirny, M. 2006. The nitrogen cycle. Fundamentals of physical geography, 2nd
edn. Sanchez, P.A. 2002. Soil fertility and Hunger
in Africa, Science, 295: 2019 2020. Shrestha, P., Sinclair, F.L., McDonald, M.
2004. Bridging gaps between farmers' and scientists' soil classification: revisiting the methodology used in documentation and analysis of farmers' knowledge. Paper presented in the International Conference on "Bridging Scales and Epistemologies: Linking Local Knowledge with Global Science in Multi-Scale Assessments" in Alexandria, Egypt.
Singleton, P. 2006. Nutrient management concepts: pH and nutrient formulation, University of Hawaii Cooperative Extension Service, Hilo, Jul. 25, 2006.
Subbiah, B.V., Asija, G.L. 1956. A rapid procedure for estimation of available nitrogen in soils. Curr. Sci., 25: 259260.
University of Hawaii, College of Tropical Agriculture and Human Resources, 2014.
Walkley, A.J., Black, I.A. 1934. Estimation of soil organic carbon by the chromic acid titration method. Soil Sci., 37: 29 38.
Yin Chan, 2008. Increasing soil or organic carbon of agricultural land. Prime Fact 735, 5 Pp.