physical setting earth science - jmap · 2017-01-01 · ps/earth science ps/earth science the...
TRANSCRIPT

PS/EARTH SCIENCEPS/EARTH SCIENCE
The University of the State of New York
REGENTS HIGH SCHOOL EXAMINATION
PHYSICAL SETTING
EARTH SCIENCEWednesday, August 18, 2010 — 12:30 to 3:30 p.m., only
This is a test of your knowledge of Earth science. Use that knowledge to answerall questions in this examination. Some questions may require the use of the 2010 Edition Reference Tables for Physical Setting/Earth Science. The reference tablesare supplied separately. Be certain you have a copy of the 2010 Edition of thesereference tables before you begin the examination.
The answers to all questions are to be written in your separate answer booklet.Be sure to fill in the heading on the front of your answer booklet.
You are to answer all questions in all parts of this examination according to thedirections provided in the examination booklet. All work should be written in pen,except for graphs and drawings, which should be done in pencil. You may use scrappaper to work out the answers to the questions, but be sure to record all your answersin your answer booklet.
When you have completed the examination, you must sign the statement printedon the first page of your answer booklet, indicating that you had no unlawfulknowledge of the questions or answers prior to the examination and that you haveneither given nor received assistance in answering any of the questions during theexamination. Your answer booklet cannot be accepted if you fail to sign thisdeclaration.
Notice. . .
A four-function or scientific calculator and a copy of the 2010 Edition Reference Tables forPhysical Setting/Earth Science must be available for you to use while taking this examination.
The use of any communications device is strictly prohibited when taking thisexamination. If you use any communications device, no matter how briefly, yourexamination will be invalidated and no score will be calculated for you.
DO NOT OPEN THIS EXAMINATION BOOKLET UNTIL THE SIGNAL IS GIVEN.

Part A
Answer all questions in this part.
Directions (1–35): For each statement or question, write in your answer booklet the number of the word orexpression that, of those given, best completes the statement or answers the question. Some questions mayrequire the use of the 2010 Edition Reference Tables for Physical Setting/Earth Science.
1 Evidence of mass extinctions of life-forms is preserved in the fossil record. It is inferred thatsome of these extinctions occurred because of(1) earthquakes (3) solar eclipses(2) asteroid impacts (4) tsunamis
2 By which process do stars convert mass into greatamounts of energy?(1) nuclear fusion (3) gravitational pull(2) heat transfer (4) radioactive decay
3 The diagram below represents the development ofour universe from the time of the Big Bang untilthe present. Letter A indicates two celestial objects.
The present-day celestial objects labeled A arebest identified as(1) asteroid belts (3) spiral galaxies(2) terrestrial planets (4) eccentric comets
4 The constellation Pisces changes position duringa night, as shown in the diagram below.
Which motion is mainly responsible for thischange in position?(1) revolution of Earth around the Sun(2) rotation of Earth on its axis(3) revolution of Pisces around the Sun(4) rotation of Pisces on its axis
5 The diagram below represents the bright-linespectrum for an element.
The spectrum of the same element observed inthe light from a distant star is shown below.
The shift in the spectral lines indicates that thestar is moving(1) toward Earth(2) away from Earth(3) in an elliptical orbit around the Sun(4) in a circular orbit around the Sun
Big Bang
Tim
e
Present A
Violet Red
Violet Red
Pisces
Pisces
Pisces
East West
P.S./E. Sci.–August ’10 [2]

P.S./E. Sci.–August ’10 [3] [OVER]
6 Compared to the other planets in our solar system, Jupiter, Saturn, and Neptune have(1) shorter periods of rotation(2) shorter periods of revolution(3) greater eccentricities(4) greater densities
7 Air pressure is usually highest when the air is(1) cool and humid (3) warm and humid(2) cool and dry (4) warm and dry
8 Weather data is normally recorded at positions A, B, C, and D on the weather station modelshown below.
At which position should the measurements froma rain gauge be recorded?(1) A (3) C(2) B (4) D
9 Heat energy from the lower latitudes is transferred to colder Earth regions by planetarywind circulation mainly through the process of(1) conduction (3) convection(2) radiation (4) reflection
10 The Coriolis effect is a result of Earth’s(1) tilted axis (3) revolution(2) orbital shape (4) rotation
11 For weeks after a series of major volcanic eruptions,Earth’s surface air temperatures are often(1) warmer because ash and dust decrease
atmospheric transparency(2) warmer because ash and dust increase
atmospheric transparency(3) cooler because ash and dust decrease
atmospheric transparency(4) cooler because ash and dust increase
atmospheric transparency
12 The table below shows how the radioactive decayof potassium-40 can be used to determine the ageof a rock.
How old is a sample of granite that contains 8 grams of radioactive potassium-40 and 56 gramsof its nonradioactive decay products?(1) 1.3 � 109 years old (3) 3.9 � 109 years old(2) 2.6 � 109 years old (4) 5.2 � 109 years old
13 Which gas became part of Earth’s atmospheremainly as a result of the evolution of life-forms?(1) oxygen (3) helium(2) nitrogen (4) hydrogen
14 Devonian-age fossils found in New York Statebedrock, such as Manticoceras and Mucrospirifer,provide evidence that parts of New York Statewere once(1) under a shallow sea containing tropical waters(2) higher in elevation and eroded extensively by
glaciers(3) covered by extensive lava flows(4) impacted by comets and asteroids
15 Which two types of organisms both survived themass extinction that occurred at the end of thePermian Period?(1) trilobites and nautiloids(2) corals and vascular plants(3) placoderm fish and graptolites(4) gastropods and eurypterids
Ratio of RadioactivePotassium-40 toNonradioactiveDecay Products
Age of Rock(years)
1:0 0
1:1 1.3 � 109
1:3 2.6 � 109
1:7 3.9 � 109
1:15 5.2 � 109
1:31 6.5 � 109C
D
A B

16 Antarctica’s location and climate changed overthe last 200 million years because Antarcticamoved(1) southward, resulting in a warmer climate(2) southward, resulting in a colder climate(3) northward, resulting in a warmer climate(4) northward, resulting in a colder climate
17 The cross section below shows a portion ofEarth’s crust.
Which observation provides the most direct evidence that crustal plate collision has occurrednear this region?(1) alternating layers of shale and limestone
bedrock(2) absence of an igneous intrusive rock(3) different thicknesses of the sedimentary layers(4) folding of the sedimentary layers
18 In New York State, both the Delaware River andthe Susquehanna River flow over landscapesclassified as(1) mountain regions (3) lowlands(2) coastal plains (4) plateaus
19 A river’s velocity slows from 100 to 50 centimetersper second at a point in its channel. Which statement best describes the transport and deposition of particles at this point?(1) Clay, silt, sand, pebbles, and smaller cobbles
stay in transport; some cobbles are deposited.(2) Clay, silt, sand, and smaller pebbles stay in
transport; some pebbles are deposited.(3) Clay, silt, and smaller sand stay in transport;
some sand is deposited.(4) Clay and smaller silt stay in transport; some
silt is deposited.
20 The photograph below shows farm buildings partially buried in silt.
Which erosional agent most likely piled the siltagainst these buildings?(1) glacial ice (3) wind(2) ocean waves (4) mass movement
21 The generalized cross section below shows the sedimentary rock layers at Niagara Falls in western New York State.
Which rock layer appears to be most resistant toweathering and erosion?(1) Lockport dolostone (3) Grimsby sandstone(2) Rochester shale (4) Queenston shale
NiagaraRiver
Lockportdolostone
Rochestershale
Thorold sandstoneClinton limestone
Whirlpool sandstone
Queenston shale
Grimsby sandstone
Power Glen shale
P.S./E. Sci.–August ’10 [4]

P.S./E. Sci.–August ’10 [5] [OVER]
22 The flowchart below illustrates the change frommelted rock to basalt.
The solidification of the melted rock occurred(1) slowly, resulting in fine-grained minerals(2) slowly, resulting in coarse-grained minerals(3) rapidly, resulting in coarse-grained minerals(4) rapidly, resulting in fine-grained minerals
23 Soil that contains large quantities of calcium wasmost likely formed by the weathering of(1) rock salt (3) coal(2) quartzite (4) limestone
24 Which mineral is commonly used as a food additive?(1) calcite (3) halite(2) talc (4) fluorite
Meltedrock Basalt
Solidification

P.S./E. Sci.–August ’10 [6]
25 Which graph best shows the length of a shadow cast from sunrise to sunset by a flagpole in New York State?
26 The diagram below represents possible stages in the life cycle of stars.
Which star has the greatest probability of producing a supernova explosion?(1) Barnard’s Star (3) Procyon B(2) Betelgeuse (4) Sun
Starformation
Supergiantor
giant
Supernovaexplosion
Neutron star
Black dwarf(dead star)
White dwarf
Black hole
Low mass
Sun
Red dwarf
Mai
n se
quen
ce
(Not drawn to scale)
Less massive
Massive Massive
Less massive(Sun)
Very high mass
High mass
Sunrise Noon Sunset
Leng
th o
f Sha
dow
( 1 )Sunrise Noon Sunset
( 3 )
Sunrise Noon Sunset
Leng
th o
f Sha
dow
( 2 )Sunrise Noon Sunset
Leng
th o
f Sha
dow
( 4 )
Sunrise Noon Sunset
Leng
th o
f Sha
dow
( 3 )

27 The diagram below shows three identical plastic tubes filled to the same level with spherical beads of different diameters. Each tube was filled with water to the top of the beads. The clamps were then openedto allow water to drain into the beakers.
Which graph best represents the relative amount of water retained by the beads ineach tube?
28 Data from two weather instruments have been recorded on the graph below. Line A on the graph represents air-temperature data. Line B was plotted using the scale for variable B.
Line B on the graph represents data from which weather instrument?(1) thermometer (3) psychrometer(2) barometer (4) anemometer
2 a.m. 4 a.m. 6 a.m. 8 a.m. 10 a.m. noon 2 p.m. 4 p.m. 6 p.m. 8 p.m. 10 p.m.
7060504030
30.130.029.929.829.7 Va
riabl
e B
(in)
Time
Air temperature
Line ALine B
Variable B
Ret
aine
d W
ater
Particle Size (mm)
( 1 ) ( 2 ) ( 3 ) ( 4 )
4 7 12
Ret
aine
d W
ater
Particle Size (mm)4 7 12
Ret
aine
d W
ater
Particle Size (mm)4 7 12
Ret
aine
d W
ater
Particle Size (mm)4 7 12
Beaker
Clamp
Tube containing4-mm beads
Beaker
Clamp
Tube containing7-mm beads
(Not drawn to scale)
Beaker
Clamp
Tube containing12-mm beads
P.S./E. Sci.–August ’10 [7] [OVER]

29 The map below shows four coastal locations labeled A, B, C, and D.
The climate of which location is warmed by a nearby major ocean current?(1) A (3) C(2) B (4) D
30 Which fossil sequence is in order from oldest to youngest?
31 The diagram below shows a glacial landscape feature forming over time from a melting block of ice.
This glacial landscape feature is best identified as(1) a kettle lake (3) a finger lake(2) an outwash plain (4) a moraine
Block of ice dropped bya glacier
Water
Ice block melts
Ice
Ice block becomessurrounded by sediment
Ice
( 1 ) ( 3 )
( 2 ) ( 4 )
A
B C
D
NorthAmerica
Europe
AtlanticOcean
Africa
P.S./E. Sci.–August ’10 [8]

32 The block diagram below shows a landscape region.
Which stream drainage pattern would most likely develop at the surface of thisregion?
33 The diagram below shows a laboratory stream table. A mixture of sediment was placed on the stream table.A short time after the faucet was turned on, a deposit of sediment began forming at location X at the lowerend of the stream table.
What is the name of the stream feature forming at location X?(1) V-shaped valley (3) delta(2) meander (4) floodplain
Water faucet
Mixture of sediment
Water
Outlet
X
( 2 ) ( 3 ) ( 4 )( 1 )
Key
Igneous rock
P.S./E. Sci.–August ’10 [9] [OVER]

34 The diagram below shows three stages in the formation of a specific rock.
Which rock is formed as a result of these three stages?(1) limestone (3) schist(2) gneiss (4) coal
35 The diagram below shows the temperature readings on a weather instrument.
Based on these readings, the relative humidity of the air is closest to (1) 8% (3) 32%(2) 11% (4) 60%
20151050–5–10 353025
–15 20151050–5–10 353025
–15
Wet bulb
Dry bulb
Stage 1 Stage 2 Stage 3
Remainsof partiallydecayedplants
Burial producespressure from overlyingsediments.
Further burial createsmore pressure.
P.S./E. Sci.–August ’10 [10]

P.S./E. Sci.–August ’10 [11] [OVER]
Part B–1
Answer all questions in this part.
Directions (36–50): For each statement or question, write in your answer booklet the number of the wordor expression that, of those given, best completes the statement or answers the question. Some questions mayrequire the use of the 2010 Edition Reference Tables for Physical Setting/Earth Science.
Base your answers to questions 36 and 37 on the diagram below, which represents the greenhouse effect inwhich heat energy is trapped in Earth’s atmosphere.
36 Which type of radiation from Earth is the long-wave radiation absorbed by greenhouse gases?(1) ultraviolet (3) infrared(2) visible light (4) radio waves
37 The Earth surface that best absorbs short-wave solar radiation has which characteristics?(1) black and rough (3) white and rough(2) black and smooth (4) white and smooth
Sun
Short-wave (visible)radiation readilypasses throughthe atmosphere.
Earth
(Not drawn to scale)
Long-waveradiation from Earthis partially absorbedby greenhouse gasesin the atmosphere.

Base your answers to questions 38 through 41 on the contour map below, which shows a hill formed byglacial deposition near Rochester, New York. Letters A through E are reference points. Elevations are in feet.
38 This glacial deposit is best identified as(1) a U-shaped valley (3) a drumlin(2) a sand dune (4) an outwash plain
39 Which description best compares the gradients of this hill?(1) AE and EB have the same gradient. (3) CE has a steeper gradient than ED.(2) AE has a steeper gradient than EB. (4) CE and AE have the same gradient.
40 Which set of characteristics most likely describes the sediment in this glacial deposit?(1) sorted and layered (3) unsorted and not layered(2) sorted and not layered (4) unsorted and layered
41 The hill shown on this map is found in which New York State landscape region?(1) Adirondack Mountains (3) Atlantic Coastal Plain(2) Catskills (4) Erie-Ontario Lowlands
A
D
C
BE
220
240260
Contour Map
N
P.S./E. Sci.–August ’10 [12]

Base your answers to questions 42 through 45 on the cross section below, which shows the boundarybetween two lithospheric plates. Point X is a location in the continental lithosphere. The depth below Earth’ssurface is labeled in kilometers.
42 Between which two lithospheric plates could this boundary be located?(1) South American Plate and African Plate(2) Scotia Plate and Antarctic Plate(3) Nazca Plate and South American Plate(4) African Plate and Arabian Plate
43 Compared to the continental crust, the oceanic crust is(1) less dense and thinner (3) more dense and thinner(2) less dense and thicker (4) more dense and thicker
44 The temperature of the asthenosphere at the depth where melting first occurs isinferred to be approximately(1) 100°C (3) 4200°C(2) 1300°C (4) 5000°C
45 Point X is located in which Earth layer?(1) rigid mantle (3) asthenosphere(2) stiffer mantle (4) outer core
Continental crust Continentallithosphere
Asthenosphere
X100 km
200 km
100 km
200 km
Oceanic crust
(Not drawn to scale)
Melting
Trench
Oceaniclithosphere
P.S./E. Sci.–August ’10 [13] [OVER]

Base your answers to questions 46 and 47 on the diagrams below. Diagram 1 represents a cross section ofEarth and its interior layers. The asterisk ( ) shows the location of an earthquake epicenter. Letters A through D are seismic stations on Earth’s surface.
Diagram 2 shows four seismograms labeled I, II, III, and IV, which were recorded at seismic stations A, B, C, and D during the same time interval.
P-wavearrival
S-wave arrival
P-wavearrival
S-wave arrival
I
III
P-wavearrivalIV
II
P-wavearrival
S-wave arrival
Diagram 2
A
B
C
D
Mantle
Outer core
Innercore
Diagram 1Earthquakeepicenter
(Not drawn to scale)
P.S./E. Sci.–August ’10 [14]

46 Which list correctly matches the seismograms with the seismic stations where theywere recorded?(1) seismogram I – station A (3) seismogram I – station C
seismogram II – station B seismogram II – station Bseismogram III – station C seismogram III – station Dseismogram IV – station D seismogram IV – station A
(2) seismogram I – station B (4) seismogram I – station Aseismogram II – station D seismogram II – station Dseismogram III – station A seismogram III – station Bseismogram IV – station C seismogram IV – station C
47 Station D is 8000 kilometers from the earthquake epicenter. How long did it take forthe first P-wave to travel from the epicenter to station D?(1) 9 minutes 20 seconds (3) 20 minutes 40 seconds(2) 11 minutes 20 seconds (4) 4 minutes 20 seconds
P.S./E. Sci.–August ’10 [15] [OVER]

Base your answers to questions 48 through 50 on the diagram below, which represents Earth revolvingaround the Sun. Letters A, B, C, and D represent Earth’s location in its orbit on the first day of the four seasons. NP represents the North Pole.
48 Which location in Earth’s orbit represents the first day of summer in New York State?(1) A (3) C(2) B (4) D
49 If the tilt of Earth’s axis were decreased from 23.5° to 15°, New York State’s winterswould become(1) warmer, and summers would become cooler(2) warmer, and summers would become warmer(3) cooler, and summers would become cooler(4) cooler, and summers would become warmer
A
B
C
DSun
(Not drawn to scale)
NP
NP
NPNP
P.S./E. Sci.–August ’10 [16]

50 Which diagram best represents the Sun’s apparent path as seen by an observer at43.5° N latitude on December 21?
Observer
Noon Sun
Dec
21
Observer
Noon Sun
Dec 21
Dec 21 Observer
Noon Sun
Dec 21
N S
W
E
N S
W
E
N S
W
N S
W
E
( 2 ) ( 4 )
( 1 ) ( 3 )
Noon Sun
ObserverE
P.S./E. Sci.–August ’10 [17] [OVER]

Part B–2
Answer all questions in this part.
Directions (51–65): Record your answers in the spaces provided in your answer booklet. Some questionsmay require the use of the 2010 Edition Reference Tables for Physical Setting/Earth Science.
Base your answers to questions 51 through 53 on the diagram below, which represents a north polar view ofEarth on a specific day of the year. Solar times at selected longitude lines are shown. Letter A represents alocation on Earth’s surface.
51 How many degrees apart are the longitude lines shown in the diagram? [1]
52 State the altitude of Polaris as seen by an observer at the North Pole. [1]
53 How many hours of daylight would an observer at location A experience on this day? [1]
A
6 a.m.8 a.m.
10 a.m.
Noon
4 a.m.
2 a.m.
Midnight
10 p.m.
8 p.m. 4 p.m.
2 p.m.
6 p.m.
Sun’srays
Direction of rotation
North Pole
P.S./E. Sci.–August ’10 [18]

Base your answers to questions 54 through 56 on the data table below. Six identical cylinders, A through F,were filled with equal volumes of sorted spherical particles. The data table shows the particle diameters, in centimeters, and the amount of time, in seconds, for water to flow equal distances through each cylinder.
Data Table
54 Use the information in the data table to construct a line graph. On the grid in youranswer booklet, plot the data for the flow time for each of the particle sizes given inthe data table. Connect the plotted data with a smooth, curved line. [1]
55 Determine the flow time in a cylinder containing particles with a diameter of 0.13 centimeter. [1]
56 State one reason why the water flows faster through the cylinders containing largerparticles than through the cylinders containing smaller particles. [1]
Base your answers to questions 57 through 59 on the cross section below, which shows two weather frontsmoving across New York State. Lines X and Y represent frontal boundaries. The large arrows show the general direction the air masses are moving. The smaller arrows show the general direction warm, moist air ismoving over the frontal boundaries.
57 Which type of front is represented by letter X? [1]
58 Explain why the warm, moist air rises over the frontal boundaries. [1]
59 Which type of front forms when front X catches and overtakes front Y? [1]
CylinderParticle
Diameter(cm)
Flow Time(s)
A 0.07 51
B 0.08 39
C 0.10 25
D 0.14 13
E 0.16 10
F 0.18 8
cP mT cP
XY
P.S./E. Sci.–August ’10 [19] [OVER]

Base your answers to questions 60 through 62 on the diagram in your answer booklet, which shows the relative diameter sizes of the planets compared to the radius of the Sun.
60 On the diagram in your answer booklet, circle only the terrestrial planets. [1]
61 On the diagram in your answer booklet, place an X on the planet with the lowestdensity. [1]
62 How many times larger is the diameter of the Sun than the diameter of Jupiter? [1]
Base your answers to questions 63 through 65 on the chart below, which shows some physical properties ofminerals and the definitions of these properties. The letters A, B, and C indicate parts of the chart that havebeen left blank. Letter C represents the name of a mineral.
63 Which physical property of a mineral is represented by letter A? [1]
64 State the definition represented by letter B. [1]
65 Identify one mineral that could be represented by letter C. [1]
Metallic
Minerals
Hardness A
How easilya mineral
is scratched
The waya mineral
reflects lightB
which scratchesolivine
Streak
Some physical properties
whichmeans
whichmeans
whichmeans
Example
C
Example
P.S./E. Sci.–August ’10 [20]

Part C
Answer all questions in this part.
Directions (66–85): Record your answers in the spaces provided in your answer booklet. Some questions mayrequire the use of the 2010 Edition Reference Tables for Physical Setting/Earth Science.
Base your answers to questions 66 through 69 on the diagram in your answer booklet, which shows theMoon’s orbit around Earth.
66 On the diagram in your answer booklet, place a small circle on the Moon’s orbitat the new-Moon phase where none of the lighted portion of the Moon is visiblefrom Earth. [1]
67 Explain why ocean tides are considered to be cyclic. [1]
68 How long does it take the Moon to complete one revolution around Earth? Expressyour answer to the nearest tenth of a day. [1]
69 Explain why lunar eclipses only occur when the Moon and the Sun are on oppositesides of Earth. [1]
Base your answers to questions 70 through 74 on the map in your answer booklet. The map shows the precipitation totals, in inches, from January 2003 through May 2003 for the North Carolina locations represented by dots. Precipitation totals for locations A and B are recorded on the map. The towns of Newportand Beaufort are labeled on the map.
70 On the map in your answer booklet, use a smooth, curved line to draw the 25.00-inchprecipitation isoline. The isoline must extend to the edges of the map. [1]
71 Calculate the rainfall gradient between locations A and B on the map to the nearest hundredth. Label your answer with the correct units. [1]
72 Identify the city shown on the Generalized Bedrock Geology of New York State mapin the Earth Science Reference Tables that is closest to the longitude of Newport,North Carolina. [1]
73 Explain why the intensity of insolation received at Beaufort, North Carolina, on aclear day is greater than the intensity of insolation received at Buffalo, New York, onthe same clear day. [1]
74 On the grid in your answer booklet, draw a line to show the general relationshipbetween the amount of precipitation and the amount of runoff in Beaufort, NorthCarolina, if the ground is saturated. [1]
( )○
P.S./E. Sci.–August ’10 [21] [OVER]

Base your answers to questions 75 through 79 on the passage and map below. The map shows the averageyearly precipitation in New York State measured in inches.
Landscapes and Precipitation
Moisture from the Gulf of Mexico and the Atlantic Ocean is carried to New YorkState by storm systems and air currents. Rain and snowfall amounts vary by region.Heavy snow belts are located near Lake Erie and Lake Ontario as well as in the plateauregions of eastern and northern New York State. Long Island and New York City usually experience lighter snowfalls. Snowfall amounts are converted to inches of waterto determine yearly precipitation.
75 Identify two bodies of water that are major sources of moisture for the precipitationthat occurs in New York State. [1]
76 Identify the New York State landscape region that has the greatest average yearlyamount of precipitation. [1]
77 Identify one process that occurs in rising air that produces clouds from water vapor. [1]
78 On the map in your answer booklet, draw one arrow to show the path that air travels to produce heavy lake-effect snowfall in Oswego, New York. [1]
79 Describe two actions that could be taken to prepare for a forecasted severe snowevent. [1]
48
56
48
28
40
36
44
44
4044
4444
36
44
32
48 484448
60
48
4444
40
36
N
36
5240
44
32
52
4436
Average Yearly Precipitation in Inches
44
48
3240
52
P.S./E. Sci.–August ’10 [22]
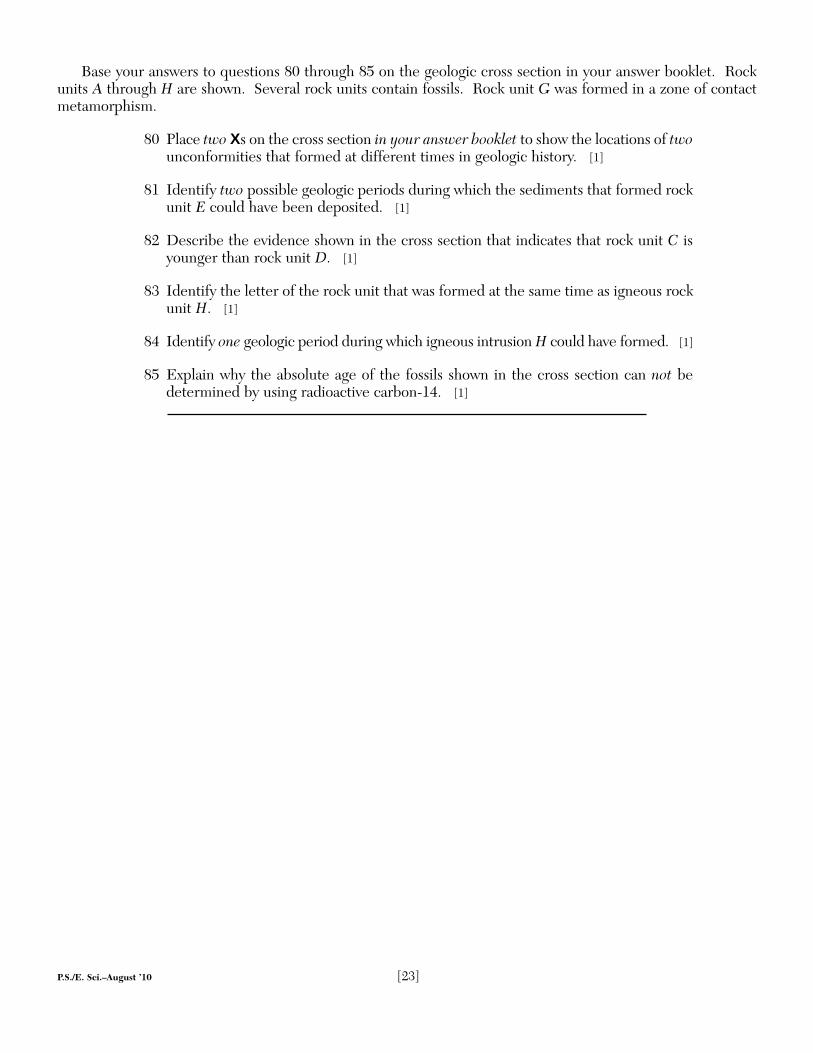
Base your answers to questions 80 through 85 on the geologic cross section in your answer booklet. Rockunits A through H are shown. Several rock units contain fossils. Rock unit G was formed in a zone of contactmetamorphism.
80 Place two Xs on the cross section in your answer booklet to show the locations of twounconformities that formed at different times in geologic history. [1]
81 Identify two possible geologic periods during which the sediments that formed rockunit E could have been deposited. [1]
82 Describe the evidence shown in the cross section that indicates that rock unit C isyounger than rock unit D. [1]
83 Identify the letter of the rock unit that was formed at the same time as igneous rockunit H. [1]
84 Identify one geologic period during which igneous intrusion H could have formed. [1]
85 Explain why the absolute age of the fossils shown in the cross section can not bedetermined by using radioactive carbon-14. [1]
P.S./E. Sci.–August ’10 [23]

PS/EARTH SCIENCEPS/EARTH SCIENCE
Printed on Recycled Paper

Performance Test Score(Maximum Score: 16)
Maximum Student’sPart Score Score
A 35
B–1 15
B–2 15
C 20
Total Written Test Score(Maximum Raw Score: 85)
Final Score(from conversion chart)
Raters’ Initials:
Rater 1 . . . . . . . . . . Rater 2 . . . . . . . . . .
The University of the State of New York
REGENTS HIGH SCHOOL EXAMINATION
PHYSICAL SETTINGEARTH SCIENCE
Wednesday, August 18, 2010 — 12:30 to 3:30 p.m., only
ANSWER BOOKLET
Student . . . . . . . . . . . . . . . . . . . . . . . . . . . . . . . . . . . . . . Sex: � Female
Teacher . . . . . . . . . . . . . . . . . . . . . . . . . . . . . . . . . . . . . . . . . . . . . . . . . . . . . .
School . . . . . . . . . . . . . . . . . . . . . . . . . . . . . . . . . . . . . . . Grade . . . . . . . . .
Answer all questions in this examination. Record your answers inthis booklet.
� Male
The declaration below must be signed when you have completed the examination.
I do hereby affirm, at the close of this examination, that I had no unlawful knowledge of the questions or answers prior tothe examination and that I have neither given nor received assistance in answering any of the questions during the examination.
Signature
Part A
1 . . . . . . . . . . . . 13 . . . . . . . . . . . . 25 . . . . . . . . . . .
2 . . . . . . . . . . . . 14 . . . . . . . . . . . . 26 . . . . . . . . . . .
3 . . . . . . . . . . . . 15 . . . . . . . . . . . . 27 . . . . . . . . . . .
4 . . . . . . . . . . . . 16 . . . . . . . . . . . . 28 . . . . . . . . . . .
5 . . . . . . . . . . . . 17 . . . . . . . . . . . . 29 . . . . . . . . . . .
6 . . . . . . . . . . . . 18 . . . . . . . . . . . . 30 . . . . . . . . . . .
7 . . . . . . . . . . . . 19 . . . . . . . . . . . . 31 . . . . . . . . . . .
8 . . . . . . . . . . . . 20 . . . . . . . . . . . . 32 . . . . . . . . . . .
9 . . . . . . . . . . . . 21 . . . . . . . . . . . . 33 . . . . . . . . . . .
10 . . . . . . . . . . . . 22 . . . . . . . . . . . . 34 . . . . . . . . . . .
11 . . . . . . . . . . . . 23 . . . . . . . . . . . . 35 . . . . . . . . . . .
12 . . . . . . . . . . . . 24 . . . . . . . . . . . .
Part B–1
36 . . . . . . . . . . . . 44 . . . . . . . . . . . .
37 . . . . . . . . . . . . 45 . . . . . . . . . . . .
38 . . . . . . . . . . . . 46 . . . . . . . . . . . .
39 . . . . . . . . . . . . 47 . . . . . . . . . . . .
40 . . . . . . . . . . . . 48 . . . . . . . . . . . .
41 . . . . . . . . . . . . 49 . . . . . . . . . . . .
42 . . . . . . . . . . . . 50 . . . . . . . . . . . .
43 . . . . . . . . . . . .
Part A Score
Part B–1 Score

For Raters Only
51 °
52 °
53 h
54
55 s
56
60
50
40
30
20
10
00.05 0.10 0.15 0.20
Particle Diameter (cm)
Flo
w T
ime
(s)
[2]
Part B–2
52
53
54
51
55
56

For Raters Only
57 front
58
59 front
60–61
62
Outer Edge of the Sun
Center of the Sun
Sun’sradius
Jupiter
Saturn
Mars
Earth Venus
Mercury
NeptuneUranus
60
[3] [OVER]
62
61
58
57
59

63
64
65
For Raters Only
[4]
63
64
65
Total Score for Part B–2

66
67
68 d
69
Sun’srays
(Not drawn to scale)
NorthPole
Earth
Moon’s orbit
For Raters Only
[5] [OVER]
Part C
66
67
68
69

70
71 Gradient = ___________________________
72
73
For Raters Only
[6]
71
70
72
73

For Raters Only
[7] [OVER]
74
75 __________________________________ and ___________________________________
76
77
78
79 (1) _______________________________________________________________________
(2) _______________________________________________________________________
Oswego
Amount of Precipitation
Am
ou
nt
of
Ru
no
ff
75
77
76
78
79
74

Total Score for Part C
80
82
81
84
83
85
80
81 ______________________________ Period or ___________________________ Period
82
83
84 Period
85
Key
Igneous rock
Contactmetamorphism
Coral(Devonian Period)
Crinoid(Mississippian Period)
B
A
C
D
E
F
HG
Ammonoid(Cretaceous Period)
[8]
For Raters Only
PS/EARTH SCIENCEPS/EARTH SCIENCE
Printed on Recycled Paper

Part A
1 . . . . . . . . . . . . 13 . . . . . . . . . . . . 25 . . . . . . . . . . .
2 . . . . . . . . . . . . 14 . . . . . . . . . . . . 26 . . . . . . . . . . .
3 . . . . . . . . . . . . 15 . . . . . . . . . . . . 27 . . . . . . . . . . .
4 . . . . . . . . . . . . 16 . . . . . . . . . . . . 28 . . . . . . . . . . .
5 . . . . . . . . . . . . 17 . . . . . . . . . . . . 29 . . . . . . . . . . .
6 . . . . . . . . . . . . 18 . . . . . . . . . . . . 30 . . . . . . . . . . .
7 . . . . . . . . . . . . 19 . . . . . . . . . . . . 31 . . . . . . . . . . .
8 . . . . . . . . . . . . 20 . . . . . . . . . . . . 32 . . . . . . . . . . .
9 . . . . . . . . . . . . 21 . . . . . . . . . . . . 33 . . . . . . . . . . .
10 . . . . . . . . . . . . 22 . . . . . . . . . . . . 34 . . . . . . . . . . .
11 . . . . . . . . . . . . 23 . . . . . . . . . . . . 35 . . . . . . . . . . .
12 . . . . . . . . . . . . 24 . . . . . . . . . . . .Part A Score
Part B–1
36 . . . . . . . . . . . . 44 . . . . . . . . . . . .
37 . . . . . . . . . . . . 45 . . . . . . . . . . . .
38 . . . . . . . . . . . . 46 . . . . . . . . . . . .
39 . . . . . . . . . . . . 47 . . . . . . . . . . . .
40 . . . . . . . . . . . . 48 . . . . . . . . . . . .
41 . . . . . . . . . . . . 49 . . . . . . . . . . . .
42 . . . . . . . . . . . . 50 . . . . . . . . . . . .
43 . . . . . . . . . . . .Part B–1 Score
FOR TEACHERS ONLYThe University of the State of New York
REGENTS HIGH SCHOOL EXAMINATION
PHYSICAL SETTING/EARTH SCIENCE
Wednesday, August 18, 2010 — 12:30 to 3:30 p.m., only
SCORING KEY AND RATING GUIDE
PS–ES
Directions to the Teacher:Refer to the directions on page 2 before rating student papers.
Updated information regarding the rating of this examination may be posted on the New YorkState Education Department’s web site during the rating period. Check this web sitehttp://www.emsc.nysed.gov/osa/ and select the link “Examination Scoring Information” for anyrecently posted information regarding this examination. This site should be checked before the rating process for this examination begins and several times throughout the Regents examinationperiod.
Part A and Part B–1Allow 1 credit for each correct response.
2
1
3
2
2
1
2
4
3
4
3
3
3
1
3
2
3
4
3
3
2
1
4
2
2
1
4
1
1
2
2
4
4
2
3
1
4
4
3
4
2
3
2
3
4
1
1
3
4
3
Part B–1

Directions to the Teacher
Follow the procedures below for scoring student answer papers for the Physical Setting/EarthScience examination. Additional information about scoring is provided in the publicationInformation Booklet for Scoring Regents Examinations in the Sciences.
Use only red ink or red pencil in rating Regents papers. Do not correct the student’s work bymaking insertions or changes of any kind.
For Part A and Part B–1, indicate by means of a check mark each incorrect or omitted answer.In the box provided at the end of each part, record the number of questions the student answeredcorrectly for that part.
At least two science teachers must participate in the scoring of each student’s responses to thePart B–2 and Part C open-ended questions. Each of these teachers should be responsible for scoring a selected number of the open-ended questions on each answer paper. No one teacher is toscore all the open-ended questions on a student’s answer paper.
Students’ responses must be scored strictly according to the Scoring Key and Rating Guide. Foropen-ended questions, credit may be allowed for responses other than those given in the ratingguide if the response is a scientifically accurate answer to the question and demonstrates adequateknowledge as indicated by the examples in the rating guide. In the student’s answer booklet, recordthe number of credits earned for each answer in the box printed to the right of the answer lines orspaces for that question.
Fractional credit is not allowed. Only whole-number credit may be given to a response. Unitsneed not be given when the wording of the questions allows such omissions.
Raters should enter the scores earned for Part A, Part B–1, Part B–2, and Part C on the appropriate lines in the box printed on the answer booklet, and then should add these four scoresand enter the total in the box labeled “Total Written Test Score.” The student’s score for theEarth Science Performance Test should be entered in the space provided. Then, the student’sraw scores on the performance test and written test should be converted to a scale score by using the conversion chart that will be posted on the Department’s web sitehttp://www.emsc.nysed.gov/osa/ on Wednesday, August 18, 2010. The student’s scale score shouldbe entered in the labeled box on the student’s answer booklet. The scale score is the student’s finalexamination score. On the front of the student’s answer booklet, raters must enter their initials onthe lines next to “Rater 1” or “Rater 2.”
All student answer papers that receive a scale score of 60 through 64 must be scored a secondtime. For the second scoring, a different committee of teachers may score the student’s paper orthe original committee may score the paper, except that no teacher may score the same open-endedquestions that he/she scored in the first rating of the paper. The school principal is responsible forassuring that the student’s final examination score is based on a fair, accurate, and reliable scoringof the student’s answer paper.
Because scale scores corresponding to raw scores in the conversion chart may change from oneexamination to another, it is crucial that for each administration, the conversion chart provided forthat administration be used to determine the student’s final score.
[2]
PHYSICAL SETTING/EARTH SCIENCE – continued

Part B–2
Allow a maximum of 15 credits for this part.
51 [1] Allow 1 credit for 15°.
52 [1] Allow 1 credit for 90°.
53 [1] Allow 1 credit for 12 h.
54 [1] Allow 1 credit for a correctly drawn line that passes within all of the circles shown below.
Note: It is recommended that an overlay be used to ensure reliability in rating.
55 [1] Allow 1 credit for any value from 14 to 16 s or a response based on the student-drawn graph ± 1 s.
56 [1] Allow 1 credit. Acceptable responses include, but are not limited to:
— Larger particles have larger pore spaces between them.
— Larger particles have less total surface area than smaller particles, and, therefore, less frictionwith the moving water.
60
50
40
30
20
10
00.05 0.10 0.15 0.20
Particle Diameter (cm)
Flo
w T
ime
(s)
[3] [OVER]
PHYSICAL SETTING/EARTH SCIENCE – continued

57 [1] Allow 1 credit for cold front.
58 [1] Allow 1 credit. Acceptable responses include, but are not limited to:
— The warm, moist air is less dense.
— The warm, moist air is lighter.
— Warm air is overriding the more dense cold air.
59 [1] Allow 1 credit for occluded front.
60 [1] Allow 1 credit for circling Mercury, Venus, Earth, and Mars.
61 [1] Allow 1 credit for placing an X on Saturn.
Example of a 2-credit response for questions 60 and 61:
62 [1] Allow 1 credit for any value from 9.5 to 11.5.
Outer Edge of the Sun
Center of the Sun
Sun’sradius
Jupiter
Saturn
Mars
Earth Venus
Mercury
NeptuneUranus
PHYSICAL SETTING/EARTH SCIENCE – continued
[4]

PHYSICAL SETTING/EARTH SCIENCE – continued
63 [1] Allow 1 credit. Acceptable responses include, but are not limited to:
— luster
64 [1] Allow 1 credit. Acceptable responses include, but are not limited to:
— the color of the dust or powdered form of the mineral
— the color of the mark left when a mineral is rubbed on an unglazed porcelain tile
65 [1] Allow 1 credit. Acceptable responses include, but are not limited to:
— quartz
— garnet
— diamond
— pyrite
[5] [OVER]

[6]
66 [1] Allow 1 credit if the center of the student-drawn circle is within the brackets shown.
67 [1] Allow 1 credit. Acceptable responses include, but are not limited to:
— The change from high tide to low tide repeats in a pattern.
— Tides occur in a regularly repeating pattern.
68 [1] Allow 1 credit for 27.3 d.
69 [1] Allow 1 credit. Acceptable responses include, but are not limited to:
— During a lunar eclipse, Earth blocks the sunlight from reaching the Moon.
— Earth’s shadow must fall on the Moon.
— The Moon must move into Earth’s shadow.
Sun’srays
(Not drawn to scale)
NorthPole
Earth
Moon’s orbit
PHYSICAL SETTING/EARTH SCIENCE – continued
Part C
Allow a maximun of 20 credits for this part.

[7] [OVER]
PHYSICAL SETTING/EARTH SCIENCE – continued
70 [1] Allow 1 credit for a correctly drawn 25.00-inch isoline that extends to the edges of the map. If morethan one isoline is drawn, all isolines must be correct to receive credit.
Example of a 1-credit response:
71 [1] Allow 1 credit for any value from 0.11 to 0.13 that is labeled with correct units. Acceptable unitsinclude, but are not limited to:
— in/mi
— inches/mile
— inches of precipitation/mile
72 [1] Allow 1 credit for Elmira.
73 [1] Allow 1 credit. Acceptable responses include, but are not limited to:
— The angle of insolation is greater for Beaufort, North Carolina.
— Beaufort is at a lower latitude.
— The Sun is higher in the sky at Beaufort.
— Beaufort is closer to the equator.

74 [1] Allow 1 credit for a graph showing a direct relationship. A straight or curved line may be used.
Example of a 1-credit response:
75 [1] Allow 1 credit for two correct responses. Acceptable responses include, but are not limited to:
— Gulf of Mexico
— Atlantic Ocean
— Lake Erie
— Lake Ontario
76 [1] Allow 1 credit for Catskills.
77 [1] Allow 1 credit. Acceptable responses include, but are not limited to:
— cooling
— condensation
— Air expands.
78 [1] Allow 1 credit for one arrow that crosses Lake Ontario and generally points toward Oswego.
79 [1] Allow 1 credit for two correct responses. Acceptable responses include, but are not limited to:
— have an ample supply of food
— purchase an electric generator in case of a power failure
— keep snow removal equipment in good condition and in a convenient location
— have an updated medicine kit (buy needed medicines)
— stockpile water supplies
— purchase flashlights and/or candles
Amount of Precipitation
Am
ou
nt
of
Ru
no
ff
[8]
PHYSICAL SETTING/EARTH SCIENCE – continued

80 [1] Allow 1 credit if two Xs are located on two of the three boundaries shown below. Do not allow credit if both Xs are along the same unconformity.
81 [1] Allow 1 credit if both periods are correct. Acceptable responses include, but are not limited to:— Devonian Period or Mississippian Period
— Carboniferous Period or Devonian Period
82 [1] Allow 1 credit. Acceptable responses include, but are not limited to:— C is on top of D.
— C metamorphosed D.
83 [1] Allow 1 credit for G.
84 [1] Allow 1 credit. Acceptable responses include, but are not limited to:
— Cretaceous Period
— Paleogene Period
— Neogene Period
— Quaternary Period
85 [1] Allow 1 credit. Acceptable responses include, but are not limited to:
— The fossils are too old for 14C dating.
— Carbon-14 has a very short half-life.
Key
Igneous rock
Contactmetamorphism
Coral(Devonian Period)
Crinoid(Mississippian Period)
X
B
A
C
D
E
F
HXX
G
Ammonoid(Cretaceous Period)
[9] [OVER]
PHYSICAL SETTING/EARTH SCIENCE – concluded

[10]
The Chart for Determining the Final Examination Score for the August 2010Regents Examination in Physical Setting/Earth Science will be posted onthe Department’s web site http://www.emsc.nysed.gov/osa/ onWednesday, August 18, 2010. Conversion charts provided for previousadministrations of the Regents Examination in Physical Setting/Earth Sciencemust NOT be used to determine students’ final scores for this administration.
Regents Examination in Physical Setting/Earth Science
August 2010
Chart for Converting Total Test Raw Scores toFinal Examination Scores (Scale Scores)
Submitting Online Teacher Evaluations of the Test to the Department
Suggestions and feedback from teachers provide an important contribution to the test development process. The Department provides an online evaluation form for State assessments. It contains spaces for teachers to respond to several specific questions and tomake suggestions. Instructions for completing the evaluation form are as follows:
1. Go to http://www.emsc.nysed.gov/osa/exameval.
2. Select the test title.
3. Complete the required demographic fields.
4. Complete each evaluation question and provide comments in the space provided.
5. Click the SUBMIT button at the bottom of the page to submit the completed form.

Map to Core Curriculum
August 2010 Physical Setting/Earth Science
Question Numbers
Key Ideas/Performance Indicators Part A Part B Part C
Standard 1
Math Key Idea 1 54, 62 71, 74
Math Key Idea 2 12, 19, 25, 27, 28 44, 47, 55
Math Key Idea 3 70
Science Inquiry Key Idea 1 9, 11, 14, 32 69
Science Inquiry Key Idea 2
Science Inquiry Key Idea 3 25
Engineering Design Key Idea 1
Standard 2
Key Idea 1
Key Idea 2
Key Idea 3 79
Standard 6
Key Idea 1 31, 33, 34 37, 40, 49, 56, 58 77, 78
Key Idea 2 3, 4, 5, 8, 12, 17, 20, 21, 22, 26, 27, 28, 29, 30, 31, 32, 33, 34, 35
36, 38, 39, 40, 41, 42, 43, 44, 45, 46, 47, 48, 50, 51, 52, 53, 57, 59, 60, 61, 63, 64, 65
66, 67, 68, 69, 70, 71, 72, 73, 75, 76, 78, 80, 81, 82, 83, 84, 85
Key Idea 3 62
Key Idea 4
Key Idea 5 4 48, 49, 50, 55, 59 66, 67, 68, 69, 71, 77, 82, 83, 84
Key Idea 6
Standard 7
Key Idea 1 79
Key Idea 2 79
Standard 4
Key Idea 1 1, 2, 3, 4, 5, 6, 10, 12, 13, 14, 15, 25, 26, 27, 30
48, 49, 50, 51, 52, 53, 54, 55, 56, 60, 61, 62
66, 67, 68, 69, 72, 74, 80, 81, 82, 83, 84, 85
Key Idea 2 7, 8, 9, 11, 16, 17, 18, 19, 20, 21, 25, 28, 29, 31, 32, 33, 35
36, 37, 38, 39, 40, 41, 42, 43, 44, 45, 46, 47, 57, 58, 59
70, 71, 73, 75, 76, 77, 78, 79
Key Idea 3 22, 23, 24, 34 63, 64, 65 83
Reference Tables
ESRT 2010 Edition 6, 8, 12, 13, 14, 15, 16, 18, 19, 22, 23, 24, 26, 28, 29, 30, 34, 35
36, 39, 41, 42, 43, 44, 45, 47, 57, 59, 60, 61, 62, 63, 65
68, 71, 72, 73, 75, 76, 77, 78, 81, 83, 84, 85
[11]


Regents Examination in Physical Setting/Earth Science – August 2010
Chart for Converting Total Test Raw Scores to Final Examination Scores (Scale Scores) (Not to be used for the Braille Edition)
To determine the student’s final score, locate the student’s Total Performance Test Score across the top of the chart and the Total Written Test Score down the side of the chart. The point where the two scores intersect is the student’s final examination score. For example, a student receiving a Total Performance Test Score of 10 and Total Written Test Score of 71 would receive a final examination score of 90.
Total Performance Test Score 16 15 14 13 12 11 10 9 8 7 6 5 4 3 2 1 0
85 100 99 99 99 98 98 97 96 96 95 94 93 91 90 88 87 85 84 99 99 98 98 98 97 96 96 95 94 93 92 91 89 88 86 84 83 99 99 98 98 98 97 96 96 95 94 93 92 91 89 88 86 84 82 98 98 98 97 97 96 95 95 94 93 92 91 90 88 87 85 83 81 98 98 98 97 97 96 95 95 94 93 92 91 90 88 87 85 83 80 97 97 97 96 96 95 95 94 93 92 91 90 89 88 86 84 82 79 97 96 96 95 95 94 94 93 92 91 90 89 88 87 85 83 82 78 97 96 96 95 95 94 94 93 92 91 90 89 88 87 85 83 82 77 96 95 95 95 94 94 93 92 91 91 89 88 87 86 84 83 81 76 95 95 94 94 93 93 92 91 91 90 89 88 86 85 83 82 80 75 95 95 94 94 93 93 92 91 91 90 89 88 86 85 83 82 80 74 94 94 93 93 92 92 91 90 90 89 88 87 86 84 83 81 79 73 93 93 92 92 92 91 90 90 89 88 87 86 85 83 82 80 78 72 93 93 92 92 92 91 90 90 89 88 87 86 85 83 82 80 78 71 92 92 92 91 91 90 90 89 88 87 86 85 84 82 81 79 77 70 92 91 91 90 90 89 89 88 87 86 85 84 83 82 80 78 77 69 91 90 90 89 89 88 88 87 86 85 84 83 82 81 79 77 76 68 90 90 89 89 88 88 87 86 85 85 84 82 81 80 78 77 75 67 90 90 89 89 88 88 87 86 85 85 84 82 81 80 78 77 75 66 89 89 88 88 87 87 86 85 85 84 83 82 80 79 77 76 74 65 88 88 87 87 86 86 85 85 84 83 82 81 80 78 77 75 73 64 87 87 87 86 86 85 84 84 83 82 81 80 79 77 76 74 72 63 86 86 86 85 85 84 84 83 82 81 80 79 78 77 75 73 71 62 86 85 85 84 84 83 83 82 81 80 79 78 77 76 74 72 71 61 86 85 85 84 84 83 83 82 81 80 79 78 77 76 74 72 71 60 85 84 84 84 83 82 82 81 80 79 78 77 76 75 73 72 70 59 84 84 83 83 82 82 81 80 80 79 78 77 75 74 72 71 69 58 83 83 82 82 81 81 80 79 79 78 77 76 74 73 71 70 68 57 82 82 81 81 81 80 79 79 78 77 76 75 74 72 71 69 67 56 81 81 81 80 80 79 78 78 77 76 75 74 73 71 70 68 66 55 80 80 80 79 79 78 78 77 76 75 74 73 72 71 69 67 65 54 80 79 79 78 78 77 77 76 75 74 73 72 71 70 68 66 65 53 79 78 78 78 77 77 76 75 74 74 72 71 70 69 67 66 64 52 78 78 77 77 76 76 75 74 74 73 72 71 69 68 66 65 63 51 77 77 76 76 75 75 74 73 73 72 71 70 69 67 66 64 62 50 76 76 75 75 75 74 73 73 72 71 70 69 68 66 65 63 61 49 75 75 75 74 74 73 73 72 71 70 69 68 67 65 64 62 60 48 75 74 74 73 73 72 72 71 70 69 68 67 66 65 63 61 60 47 74 73 73 72 72 71 71 70 69 68 67 66 65 64 62 60 59 46 72 72 71 71 70 70 69 68 68 67 66 65 63 62 60 59 57 45 71 71 70 70 69 69 68 68 67 66 65 64 63 61 60 58 56
Tota
l Writ
ten
Test
Sco
re
44 70 70 70 69 69 68 67 67 66 65 64 63 62 60 59 57 55
Page 1

Final Examination Scores August 2010 Examination in Physical Setting/Earth Science – continued
Total Performance Test Score
16 15 14 13 12 11 10 9 8 7 6 5 4 3 2 1 0 43 69 69 69 68 68 67 67 66 65 64 63 62 61 60 58 56 54 42 69 68 68 67 67 66 66 65 64 63 62 61 60 59 57 55 54 41 68 67 67 67 66 65 65 64 63 62 61 60 59 58 56 55 53 40 67 67 66 66 65 65 64 63 63 62 61 60 58 57 55 54 52 39 65 65 64 64 64 63 62 62 61 60 59 58 57 55 54 52 50 38 64 64 64 63 63 62 61 61 60 59 58 57 56 54 53 51 49 37 63 63 63 62 62 61 61 60 59 58 57 56 55 54 52 50 48 36 63 62 62 61 61 60 60 59 58 57 56 55 54 53 51 49 48 35 61 61 60 60 59 59 58 57 57 56 55 54 52 51 49 48 46 34 60 60 59 59 58 58 57 56 56 55 54 53 52 50 49 47 45 33 59 59 58 58 58 57 56 56 55 54 53 52 51 49 48 46 44 32 58 57 57 56 56 55 55 54 53 52 51 50 49 48 46 44 43 31 57 56 56 55 55 54 54 53 52 51 50 49 48 47 45 43 42 30 56 56 55 55 54 54 53 52 51 51 50 48 47 46 44 43 41 29 54 54 53 53 52 52 51 51 50 49 48 47 46 44 43 41 39 28 53 53 53 52 52 51 50 50 49 48 47 46 45 43 42 40 38 27 52 52 52 51 51 50 50 49 48 47 46 45 44 43 41 39 37 26 51 50 50 50 49 48 48 47 46 45 44 43 42 41 39 38 36 25 50 50 49 49 48 48 47 46 46 45 44 43 41 40 38 37 35 24 48 48 47 47 47 46 45 45 44 43 42 41 40 38 37 35 33 23 47 47 47 46 46 45 44 44 43 42 41 40 39 37 36 34 32 22 46 45 45 44 44 43 43 42 41 40 39 38 37 36 34 32 31 21 45 44 44 44 43 43 42 41 40 40 38 37 36 35 33 32 30 20 43 43 42 42 41 41 40 39 39 38 37 36 35 33 32 30 28 19 42 42 41 41 41 40 39 39 38 37 36 35 34 32 31 29 27 18 41 40 40 39 39 38 38 37 36 35 34 33 32 31 29 27 26 17 40 39 39 38 38 37 37 36 35 34 33 32 31 30 28 26 25 16 38 38 37 37 36 36 35 34 34 33 32 31 29 28 26 25 23 15 37 37 36 36 35 35 34 34 33 32 31 30 29 27 26 24 22 14 35 35 35 34 34 33 33 32 31 30 29 28 27 26 24 22 20 13 34 33 33 33 32 31 31 30 29 28 27 26 25 24 22 21 19 12 33 33 32 32 31 31 30 29 29 28 27 26 24 23 21 20 18 11 31 31 30 30 30 29 28 28 27 26 25 24 23 21 20 18 16 10 29 29 29 28 28 27 27 26 25 24 23 22 21 20 18 16 14 9 29 28 28 27 27 26 26 25 24 23 22 21 20 19 17 15 14 8 27 27 26 26 25 25 24 23 23 22 21 20 18 17 15 14 12 7 25 25 24 24 24 23 22 22 21 20 19 18 17 15 14 12 10 6 24 24 24 23 23 22 22 21 20 19 18 17 16 14 13 11 9 5 23 22 22 21 21 20 20 19 18 17 16 15 14 13 11 9 8 4 21 21 20 20 19 19 18 17 17 16 15 14 12 11 9 8 6 3 19 19 19 18 18 17 16 16 15 14 13 12 11 9 8 6 4 2 18 18 18 17 17 16 16 15 14 13 12 11 10 9 7 5 3 1 17 16 16 16 15 14 14 13 12 11 10 9 8 7 5 4 2
Tota
l Writ
ten
Test
Sco
re
0 15 15 14 14 13 13 12 11 11 10 9 8 6 5 3 2 0
Page 2