physical separation of hemopoietic … medium (cmrl 1066 q- 100/~g/ml of penicillin and...
TRANSCRIPT

PHYSICAL SEPARATION OF HEMOPOIETIC STEM CELLS DIFFER- ING IN T H E I R CAPACITY FOR SELF-RENEWAL*
BY R. G. WORTON$ PH.D., E. A. McCULLOCH, M.D., AND J. E. TILL, PH.D.
(From the Department of Medical Biophysics, University of Toronto, and The Ontario Cancer Institute, Toronto, Ontario, Canada)
(Received for publication 27 February 1969)
Two key properties of hemopoietic stem cells are their capacity for self- renewal and their capacity for differentiation. The stem ceils in mouse hemo- poietic tissues that may be detected by their ability to form macroscopic splenic colonies possess both these properties, but express them to widely vary- ing degrees. For example, colonies derived from single stem cells may differ greatly in their content of differentiated cells (1-4). Individual colonies are also very heterogenous in their content of new stem cells (5). The basis for these differences in the composition of individual colonies has not been de- termined, but it has been suggested that self-renewal and differentiation oc- curring at random during colony growth might account for the observed variation. Alternatively, influences from the local environments of individual colonies might affect their development (4). Both of these models are based on the assumption that the stem cells form a homogeneous population in respect to their intrinsic potentialities for differentiation and seE-renewal. Indirect evidence has indicated that this may not be the case (6), and the possibility must be considered that the colonies derived from individual stem cells differ in composition because of intrinsic differences in the stem cells themselves.
We have tested this possibility directly by utilizing a physical technique of cell separation, velocity sedimentation, to fractionate populations of hemo- poietic stem cells into subpopulations possessing different sedimentation rates. Tests were made of the capacity for self-renewal of the stem cells present in the different fractions. Stem cells from different fractions were found to renew themselves to different degrees, providing strong evidence that stochastic processes and environmental factors are not the sole sources of heterogeneity in the composition of splenic colonies.
* This work was supported by grants from the National Cancer Institute of Canada, the Medical Research Council of Canada, (MA-1420), the De.fence Research Board, Canada (grant 9350-14 G&C) and the Jane Coffin Childs Memorial Fund for Medical Research.
Fellow of the National Cancer Institute of Canada.
91

92 SEPARATION OF H E M O P O I E T I C STEM CELLS
Materials and Methods
Preparation of Cell Suspensions.--Bone marrow cells from the femurs of at least five mice were suspended in ice cold tissue culture medium (CMRL 1066) (7) or in phosphate buffered saline (8).
Mice.--In most experiments, the mice were (C3H/HeOci)< C57BL/6JOei) F1 from the breeding colony of the Ontario Cancer Institute. In one experiment (Table I) mice of geno- type W/W ~ were used; these animals serve as recipients for marrow graft without requiring heavy irradiation, and their use avoids losses because of radiation death. The genetically defective mice were derived from a cross between W'B-W/+ and C57BL/6--b/W~; this yields normal mice (W/q-) and heterozygotes (W/-b and q-/W") to serve as donors for normal cells, and anemic mice of genotype W/W ~ to serve as recipients. All mice were 8-10 wk of age. Donors were male and recipients were male and female. Renal tubules used in the liquid culture experiments were obtained from C57BL/6 mice.
Radiation Procedure.--MAce were irradiated using a lSrCs irradiator designed by Cunning- ham et al. (9). Recipients of normal genotype received 950 fads, and recipients of genotype W/W v received 150 rads whole body irradiation.
Cell Sedimentation T~hnique.--The rate at which a cell sediments through a 15-30% fetal calf serum gradient is related to the square of its radius (10) and hence velocity sedi- mentation provides an analysis of a heterogeneous cell population based on cell size. The technique used was very similar to the "sheer step gradient" technique of Miller and Phillips (10). The only two modifications were the use of a glass sedimentation chamber instead of lucite, and the use of culture medium (CMRL 1066) in place of phosphate buffered saline. Briefly, the procedure was as follows: a 20 ml sample of washed bone marrow cells (4 X 10⁶ total cells/mi) in 5% fetal calf serum (FCS) (Flow Laboratories, Inc., Rockville, Md.) in culture medium was introduced into the base of the chamber (a glass cylindrical chamber 11.3 cm in diameter, 7 cm high, with a conical base tapering to a 2 mm diameter opening at the bottom) under a 30 ml layer of culture medium. A linear 15-30% FCS gradient (total volume about 500 ml) was introduced under the cell band. After the cells had sedimented through the FCS gradient for about 3.5 hr the chamber was drained. The fluid from the cone was discarded and the remainder of the gradient was collected in 15 mi fractions. Each frac- tion was assayed for its content of total cells, nucleated cells, and colony-forming units (CFU).
Cell Counts.--The cell concentration in each fraction from a sedimentation experiment was determined with an electronic cell counter (Model F Coulter counter, Coulter Electronics, Hialeah, Fla.). Saponin (0.01% in phosphate buffered saline) was used to lyse erythrocytes to obtain nucleated cell counts in fractions from the region of the red cell peak. The cell con- centration in unfractionated marrow suspensions was determined from counts in a hemo- cytometer by diluting the suspension into saline for total cell counts and into 2% acetic acid for nucleated cell counts.
CFU Assay. Spleen colonies were obtained by injection of an appropriate number of bone marrow cells into lethally irradiated normal mice or lightly irradiated genetically anemic (W/W") hosts. Colonies were counted 10-13 days later.
Bone Marrow Cell Cultures.--Bone marrow cells were cultured for 2 days in 1 ml of tissue culture medium (CMRL 1066 q- 100/~g/ml of penicillin and streptomycin) containing 10% FCS and 20/zg/ml r.-asparagine (General Biochemicals, Chagrin Falls, Ohio) over a semi- solid bottom layer. The bottom layer contained 0.5% agar in culture media with 10% FCS, 20 #g/mi asparagine, and in some cases 3 X 10⁴ renal tubules (11). The cultures were incubated at 37°C in a humidified atmosphere continually flushed with 7.50"/o carbon dioxide in air.
PdlgSULTS
Measurement of the Capacity of CFU for Sel f-RenewaL--Any m e a s u r e m e n t
of t he se l f - renewal c a p a c i t y of spleen co lony- fo rming cells necessar i ly requ i res

R. G. WORTON, E. A. ~cCULLOCH, AND ]. E. TILL 93
a double transplant. Spleen colonies are obtained in primary irradiated recipient mice; cell suspensions are prepared from these colonies and are assayed for their CFU content by injection into secondary irradiated recipients. This allows one to calculate a value for CFU per primate colony, and hence a value for the self-renewal capacity of the original CFU. The cells transplanted into the secondary recipients may be obtained in three different ways: (a) individual colonies may be excised and the cells suspended; (b) colonies may be excised, pooled, and the cells suspended; or (c) entire spleens, each containing several colonies, may be pooled and the cells suspended. The "individual-colony" design was used previously to demonstrate the heterogeneity in CFU content of single colonies (5). In the work reported here, both the "pooled-colony" and "whole-spleen" designs were used; the following experiment compares the results obtained with these methods.
Three groups of lethally irradiated mice were injected with 1.5 X 10⁴, 7 X 10⁴, and 4 X 10⁵ nucleated bone marrow cells, respectively. On day 10 after trans- plant, a few spleens from the second group of mice were fixed in Bouin's solu- tion and colonies were counted. On day 13, cell suspensions were prepared from pooled colonies or from whole spleens, as listed in Table I, and an aliquot of each suspension was injected into secondary irradiated recipients. The results are shown in Table I. From the last column of the table it is clear that the whole-spleen design gave the same value for self-renewal capacity, in- dependent of the number of colonies on the primary spleens, over a wide range. When the primary spleens contained only 3.1 colonies per spleen, the pooled- colony design gave a similar result (14.2 CFU/colony) to the whole-spleen design (16.1 CFU/colony). In contrast, when the primary spleens contained 14.6 colonies per spleen , the pooled-colony method overestimated self-renewal by a factor of about 3 (39.6 CFU per colony versus 13.8 CFU per colony). This was probably because in unfixed spleens containing as many as 15 colonies per spleen it may be di~cult to dissect out a single colony without taking portions of several others. On this basis, the pooled-colony design was used when few colonies were present in primary spleens, while the whole-spleen design was used for spleens containing many colonies.
Separation of CFU into Fractions of Varying Capacity for Self-Renewal.- Cell sedimentation at unit gravity has proved a useful technique for charac- terization of hemopoietic cells (12), including CFU (13)*. The following experi- ments were designed to see if CFU with differing sedimentation rates (differ- ing sizes) also differed in their capacity for self-renewal.
Fig. 1 shows a typical sedimentation profile of total ceils, nucleated cells and CFU after 3.5 hr sedimentation as described in the Methods. The peak at 2.1 mm/hr contains mostly erythrocytes with a few nucleated ceils, many of which are small lymphocytes The nucleated cell peak at 3.0 mm/hr contains
* Worton, R. G., E. A. MeCulloeh, and J. E. Till. 1969. Physical separation of hemopoiefic stem cells from cells forming colonies in culture. In preparation.

94 SEPARATION OF HEMOPOIETIC STEM CELLS
many cells of the erythropoietic series whereas fractions near the peak at 4.5 mm/hr contain mostly granulocytes. (95 % of the cells at the peak were peroxi- dase positive (14).) The CFU distribution (lower part of Fig. 1) had a peak at 3.8 mm/hr, between the two major peaks of nucleated cells, and was asym- metrical, being skewed towards higher sedimentation velocities. The shape and the peak position of this distribution was reproduced in a number of experiments.
TABLE I
Comparison of Pooled-Colony and Whole-Spleen Designs for the Measurement of Sdf-Renewal of CFU
Nucleated cells iniected into primary recipient
1.5 × l o ~
7.0 × 10 4
4.0 X 10 5
Colonies per primary spleen*
(3.1 4- 0,5)II
14.6 4- 2.2
(83.5 -+- 12.6) II
Source of transplanted
cells
29 pooled colonies
21 whole spleens
48 pooled colonies
10 whole spleens
10 whole spleens
Amount trans- planted to see- ondary recipient
colony
~o spleen
~,~ colony
~ 0 spleen
~ 6 o spleen
Colonies per
spleen*
7.1 q- 1.1
5.04- 1.1
19.84- 1.9
6.74- 1.0
10.2 -4- 1.5
CFU/colony$ (self-renewal)
pooled- whole-spleen colony design§ design
14.2 4-2.2
16.1 ± 6.1
39.6 +3.8
13.8 4- 4.1
1 9 . 6 4 - 5.9
* Errors are standard errors of the mean for colony counts. ~t Primary colonies were examined after 13 days of growth. § Calculated from CFU recovered from primary spleen divided by colonies per primary
spleen. [[ Calculated from 14.6 colonies per spleen in second group assuming a linear relationship
between colonies per spleen and cell number injected.
In order to determine the self-renewal capacity of CFU of different sedi- mentation velocities, another sedimentation was carried out. This yielded a distribution of total cells similar to that of Fig. 1, and on the basis of the CFU distribution of Fig. 1, fractions were chosen for the self-renewal test. The locations of these fractions relative to the distribution are indicated in Fig. 1 by arrows labeled A to H.
Cells from these fractions were injected into primary irradiated recipients. In those instances (D and E) where more than three colonies were found in the spleens of these recipients, the whole-spleen design was used to measure

~. O. WORTON~ ]L A. MCCT.TI, LOCH, AND J. ]~, TTT.T. 95
IC
9 8
,%. 6
3
I 0
I I • | | I I l I I I l I U
RBC
(2.1mm/hr)
! ~,z/ToIoI Cells
4"5 mlm/hr ~ L Cellular f p/ ~ ~ Debris
JD Nucleoted ~c~ ~
I I I O I I I I I I I I I I
Sedimentation , ~.8 mT/hr 4
_~'~ 14 s2 / I0 ~= 8 D
" W 0 ° ' °~ • I I I I I I I I I I I I I I
0 2 4 6 8 tO 12 14 16 18 20 22 24 26 28
Fraction number
FIO. 1. Sedimentation distribution profiles for total and nucleated cells (upper part of figure) and for colony-forming units (lower part of ~gure) after 3.5 hr sedimentation as de- scribed in the Methods. Total and nucleated cell counts were identical for fractions 1-15. The position of the ceil band before sedimentation is indicated. The fractions are numbered in order of collection (i.e. fraction I contains ceils of highest sedimentation velodty) and the sedimentation velocities of the various peaks are indicated. The arrows labeled A to H in- dicate the positions of the various fractions tested for self-renewal in a subsequent experiment (see text).

96 SEPARATION OF HEMOPOIETIC STEM CELLS
self-renewal. In the other instances, colonies were excised and pooled for the self-renewal measurement. The results of the self-renewal test are shown in Table II . The last column of the table dearly demonstrates that CFU found in fractions A, B, C, and D showed a reduced capacity for self-renewal in comparison with the CFU found in fractions E, F, G, and H.
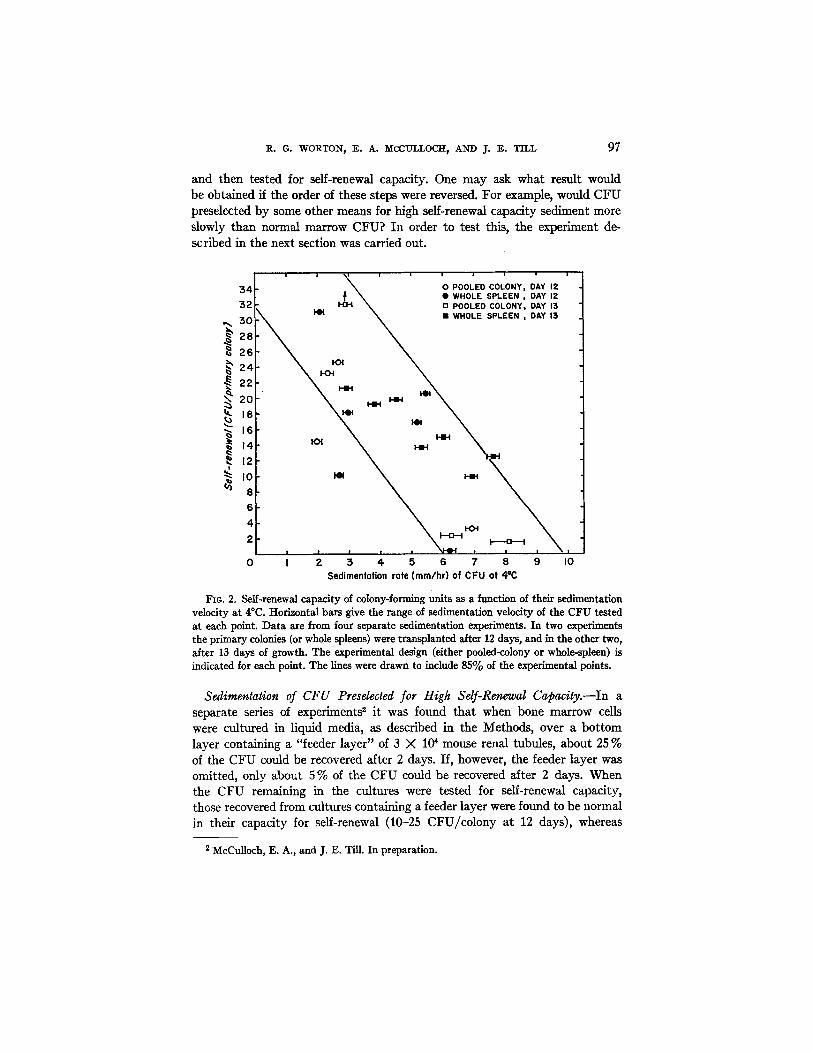
This type of experiment was repeated three times testing fractions throughout the CFU distribution. The results of all four experiments are summarized in Fig. 2. The horizontal bats give the range of sedimentation rate of the CFU tested at each point. The point with the upward arrow represents a measured
TABLE II Self-Renewal of CFU of Different Sedimentation Velocities
Fmc- tion
tested
A B C D
F G H
Sedi- men- ration velocity mm/hr
8.4 7.7 6.9 6.2
3.0
2.7 2.4 2.0
Dilution of
[raction
None None
½
½
½ None
None
Colonies per
primary spleen
4.9 4-0.7*
6.5 4-0.7*
Pooled- =olony or
whole- spleen aesign
PC PC PC WS
WS
PC PC PC
Number of colo-
nies sus-
pended
10
11
15 18 12
Number of
spleens sus-
pended
4
Amotmt trsnsplanted to secondary
recipient
~ colony
colony ~2 spleen
~2 spleen
~ colony colony colony
Colonies per secondary
spleen*
0.8 4- 0.3
1.7 4- 0.4 0.2 4- 0.2
10.2 4- 1.0
12.3 4- 1.0 11.6 4- 1.1 7.2 4- 0.7
CFU/eolony day 12
(self-renewal) *
1.6 -4- 0.6
3.4 4- 0.8 0.5 4- 0.5
18.9 4- 4.0
24.6 4- 2.0 23.2 -4- 2.2 14.4 4- 1.4
* Errors are standard errors of the mean for colony counts. Less than three colonies per spleen estimated at the time of excision of
unfixed spleens. colonies from
value for self-renewal of greater than 64 CFU per colony (the secondary spleens were confluent), but the primary colonies were picked (pooled-colony design) from spleens containing 4-8 colonies. Thus, on the basis of the data given in Table I, the value of 64 may be an overestimate. I t is very unlikely that the value is in error by more than a factor of 2, so it was taken to be at least 32 CFU per colony.
I t appears that there is a definite trend for CFU in fractions containing cells of low sedimentation velocity to have a larger capacity for self-renewal than CFU in fractions containing cells of high sedimentation velocity. Calculation of Spearman's rank-difference correlation coefficient (15) from the data shown in Fig. 2 yielded a value of --0.73. Application of Hotelling and Pabst's test for rank-order correlation (15) indicated that the negative correlation between sedimentation rate and self-renewal capacity is highly significant (P <0.001).
In these experiments, marrow cells were first separated by sedimentation
R . G . W O R T O N , E . A . M c C U L L O C t t , A N D ] . E . T I L L 97
and then tested for self-renewal capacity. One may ask what result would be obtained if the order of these steps were reversed. For example, would CFU preselected by some other means for high self-renewal capacity sediment more slowly than normal marrow CFU? In order to test this, the experiment de- scribed in the next section was carried out.
| i i i i i i i i ,
' ~ 0 POOLED COLONY, DAY 12 34 ~ ~ 0 WHOLE SPLEEN, DAY 12 :32 u-1 \ O POOLED COLONY~ DAY 13
} a8 ~ 26 ~" 24
10 8
6
4
! I
0 I 2 5 4- 5 6 7 8 9 I0 Sedimenfotion rote (mm/hr) of CFU ot 4°C
Fro. 2. Self-renewal capadty of colony-forming units as a function of their sedimentation velocity at 4°C. Horizontal bars give the range of sedimentation velocity of the CFU tested at each point. Data are from four separate sedimentation experiments. In two experiments the primary colonies (or whole spleens) were transplanted after 12 days, and in the other two, after 13 days of growth. The experimental design (either pooled-colony or whole-spleen) is indicated for each point. The lines were drawn to include 85% of the experimental points.
Sedimentation of CFU Preselected for High Self-Renewal Capacity.--In a separate series of experiments 2 it was found that when bone marrow ceils were cultured in liquid media, as described in the Methods, over a bot tom layer containing a "feeder layer" of 3 X 10⁴ mouse renal tubules, about 25 % of the CFU could be recovered after 2 days. If, however, the feeder layer was omitted, only about 5 % of the CFU could be recovered after 2 days. When the CFU remaining in the cultures were tested for self-renewal capacity, those recovered from cultures containing a feeder layer were found to be normal in their capacity for self-renewal (10-25 CFU/colony at 12 days), whereas
2 McCuUoch, E. A., and J. E. Till. In preparation.

98 SEPARATION OF HEMOPOIETIC STEM CELLS
the 5 % remaining in cultures without a feeder layer were found to be unusually high in self-renewal capacity (up to 125 CFU/colony).
The sedimentation results of the last section would predict tha t the CFU derived from cultures not containing a feeder layer should sediment in a narrow band with low sedimentation rate. On the other hand, CFU derived from cul- tures containing a feeder layer should have a sedimentation profile similar to tha t of CFU from normal bone marrow. This hypothesis was tested in the following experiment.
Bone marrow was cultured in liquid medium over a semisolid layer under two conditions: some dishes contained a bottom layer consisting of renal tubules immobilized ill agar; other cultures contained an agar bottom layer without tubules. After 2 days, the marrow cells in the liquid layer of each set of dishes were harvested, washed once, and resuspended in culture medium. An aliquot from each type of culture was injected into irradiated mice for measute- ment of seN-renewal. Another aliquot of each was sedimented in the usual way; two sedi- mentation chambers were used side by side in a cold room, one for cells cultivated over feeders, the other for cells cultivated without feeders. After about 3.5 hr fractions were collected from each chamber. All fractions were assayed for total and nucleated cells, and every second frac- tion was assayed for CFU. On day 11 after harvest of the cultures, the primary recipients of u~ractionated cells from the two sets of cultures were sacrificed; some of the spleens were fixed for colony counts; others were suspended for transplantation into secondary recipients (whole-spleen test for self-renewal).
A tabulation of the data obtained from the various stages of the experiment is presented in Table I I I . The results of the self-renewal test appear in the last line of the table. As expected, the CFU from the cultures without feeders showed a greater capacity for self-renewal than the CFU from the cultures with feeders.
The sedimentation profile of total and nucleated cells after 2 days in culture (upper par t of Fig. 3) was similar to a normal marrow distribution except tha t the cells were somewhat reduced in size and therefore sedlmented more slowly. There was also more cell debris than from normal marrow, probably because of the degeneration of some cells during the period in culture. The distribution of CFU (lower par t of Fig. 3) from the cultures with feeders was similar to a normal marrow distribution in that it was skewed toward higher sedimentation velocities. I t was also shifted slightly to the left, indicating some increase in cell size for CFU. The CFU from the cultures without feeders formed, as pre- dicted, a narrow band at the right hand edge of the control (with feeders) distribution. This result provides further evidence for a relationship between seN-renewal capacity and sedimentation velocity.
DISCUSSION
The work presented in this paper provides evidence for a correlation be- tween the sedimentation rate of a marrow cell subpopulation, and the self- renewal capacity of the CFU within that subpopulation. The most rapidly sedimenting cell populations contained the CFU with the least extensive re- newal capacity.

R. G. WORTON, E. A. McCULLOCH, AND J'. E. TILL 99
Determination of the properties of hemopoietic stem cells by examining their progeny in spleen colonies is based on the assumption that such colonies are clones, each developing independently. The latter component of this as- sumption has been investigated recently by Schofield and La j tha (16) and they have found that, in the interval from day 6 to day 10, the rate of self-renewal
TABLE HI Tabulation of Data from a Sedimentation Experiment Using Cultured Marrow Cells
Without feeders With feeders
Marrow cultures
Sedimentation
Se~-rcnewal
Input (nucleated cells/dish) Number of dishes (1 ml/dish) Total volume recovered (ml) Total nucleated cells recovered % recovery of nucleated cells
5 X 10⁶ 68 58
2.3 X l0 s 68%
% recovery of total cells % recovery of nucleated cells % recovery of CFU
Primary recipients
Secondary recipients
Nucleated cell number injected
Colonies per spleen
Fraction of primary spleen injected
Colonies per spleen
CFU recovered per primary spleen
CFU per primary colony, day 11 (self- renewal)
85%* 58%* 66%
3 X 10 s
15.0 4- 1.9~
0.013
12.8 4- 0.9:~
985 4- 70~
65.6 4- 13.0~
5 X 10⁶ 65 48
2.7 X 10 s 82%
51%* 52%*
>50%
10 5
16.1 4- 0.5~
0.017
6.s 4- 035
3844-41~
23.8 4- 3.3~
* Calculated from integral under cell curves (Fig. 3) and subject to error because of the large peak of cellular debris which was not included in the integral.
:~ Errors are standard errors of the mean for colony counts.
of colony-forming cells is the same in spleens containing many colonies as in spleens containing few colonies. The data presented in Table I of this paper were obtained on the 13th day of growth, and are consistent with the view that over the range from 3 to 80 colonies per spleen, self-renewal is not strongly dependent on colony number. This finding is also in agreement with the results of Lahiri and van Put ten 8 who found that the growth of CFU is independent of the initial size of a marrow graft.
3 Lahiri, S. K., and L. M. van Putten. 1969. Distribution and multiplication of colony- forming units from bone marrow and spleen after injection in irradiated mice. Cell Tissue Ki- net. 2:21.

100 S E P A R A T I O N O~F H E M O P O I E T I C STEM CELLS
The fact tha t CFU derived from cell populations with a low sedimentation rate showed an increased capacity for seLf-renewal, in comparison with other
CFU derived from cell populations with a high sedimentation ~ t e , may be explained in either of two ways. First, the stem cells themselves could possess
II I0 9
~ 8
2
i I i ¢ i i , i B C ' = . ' . i ' ' i
~/ ii~l' k °~o ' i~l/,~1" Feeders # '='-<'
.,._...-." I I I I I t I I , I I I I I I
SEDIMENTATION 4.2 mmlhr ( 8 ~/l&~ 3.Trnm/hr
~.~ 6 ~ , ~ • II No feeders
0 •
" ' ' ' . . . . . 2'o ' 2 2 ' 4 1 . 1 8 0 2 4 6 8 I0 12 14 16 18 2 Froction number
FIO.!.3. Sedimentation analysis of marrow cells after 2 days in culture. Upper: Distributions of total cells (solid lines) and nucleated cells (dashed lines) after 3.5 hr of sedimentation as described in the Methods (el. Fig. 1). Lower: Distributions of CFU. Distributions are given for ceils cultured in the presence of a feeder layer and for cells cultured in the absence of a feeder layer. The curves for cells cultured without feeders were shifted to the left by 1.5 fractions in order to align the input cell bands from the 2 sedimentation runs, thus making the curves for the 2 types of cultures directly comparable.

R. G. V~ORTON, E. A. MCCULLOCH, AND ~'. E. TILL 101
different potentialities for self-renewal, smaller CFU having a greater inherent self-renewal capacity than larger CFU. This viewpoint would explain the results obtained after sedimentation of normal marrow cells (Table I I and Fig. 2). I t would also predict that CFU selected for high self-renewal capacity by the culture method described should be relatively small cells, more homogene- ous in size than either normal marrow CFU or CFU of normal self-renewal ability from control cultures. This prediction was confirmed in experiments where CFU from cultures without feeders were found to sediment in a narrow band at the trailing edge (small cell side) of the control CFU distribution (Fig. 3).
Alternatively, the observed differences in the self-renewal capacity of CFU from different fractions of a normal marrow cell sedimentation could be the result of an interaction between the CFU and some other cell type. For exam- ple, a population of rapidly sedimenting ceils which inhibits the self-renewal of CFU, or a population of slowly sedimenting cells which stimulates the self- renewal of CFU, would produce the observed differences. Such a model, how- ever, would not lead to the prediction that a relatively homogeneous population of small CFU should be obtained from the cultures without feeders. Some other mechanism would have to be postulated to explain the latter result (Fig. 3). Thus, the view that there are intrinsic differences between individual stem cells is the simplest explanation for our results. Experiments are being carried out to test for the presence of cells capable of inhibiting or promoting the self-renewal of CFU.
The CFU content of splenic colonies derived from unfractionated marrow cell suspensions is known to vary considerably from colony to colony (5). The results presented in this paper may contribute to our understanding of this variability. Two models have been proposed previously to explain the differences observed among spleen colonies. The two models are not mutually exclusive so that one or both of them may play a role in determining the com- position of colonies.
(a) The stochastic model: This model is based on the view that the pattern of development of colonies derived from individual stem cells is strongly governed by the balance between two competing properties of stem cells, self-renewal and differentiation (17). I t was assumed that each division of a stem cell involves a choice between these two alternatives, and that a cell, once it initiates differentiation, ceases to be a stem cell. The variable composi- tion of hemopoietic colonies was assumed to be a reflection of random fluctua- tions in the frequency of occurrence of self-renewal and differentiation events during the formation of the colonies. This model was originally developed to account for differences in the number of new stem cells from one colony to another (5), but it can be extended to account for differences in numbers of differentiated cells as well.
This model must now be revised somewhat in the fight of the results reported

102 SEPAKATION OF HE•OPOIETIC STEM CELLS
here. Stochastic processes cannot be the only source of heterogeneity in colony composition since our results reveal a new source of variation. As described above, this additional variation could arise from intrinsic differences between individual CFU, or from interactions between CFU and other cells present in the injected cell suspensions.
(b) The HIM model: Curry and Trentin (4) have proposed that the "hemo- poiefic inductive microenvironments" (HIM) surrounding a stem cell and its progeny determine their choice of a differentiation pathway. By analogy, one may extend their model to include the possibility that the microenvironment also influences the frequency of self-renewal divisions in a developing colony.
This model must also be modified in the light of the present data. If the concept of stem cells with different potentialities is correct, then the micro- environment is not the sole source of variations in the pattern of colony de- velopment. If, on the other hand, the cell-cell interaction concept is correct the microenvironment must be affected by the cellular composition of the injected cell suspension.
Our experimental approach has been based on an analysis of the complex cell population of bone marrow by a physical method (velocity sedimentation) and a biological method (the spleen-colony technique). In this way, an associa- tion has been found between cell size and the self-renewal of stem cells--the property on which regeneration of the hemopoietic system depends. I t is possi- ble that other properties of stem cells, such as their potential for differentiation, may also be correlated with their physical properties. If so, physical techniques of cell separation and characterization provide a powerful new approach to the analysis of cellular differentiation in the hemopoietic system.
S ~ M ~ R Y
Bone marrow ceils in suspension were separated into a number of fractions on the basis of cell size by sedimentation at unit gravity through gradients of fetal calf serum. The colony forming units (CFU) from the various fractions were tested for their self-renewal capacity using a double transplantation technique. The results indicate that the CFU in the fractions containing slowly sedimenting cells have an increased capacity for self-renewal in comparison with CFU in fractions containing rapidly sed{menting cells. In addition, a culture method was used to select populations contaln~ng CFU with increased self-renewal capacity, and these CFU were shown to sediment slowly in com- parison with CFU of lower self-renewal capacity obtained from control cultures. I t may be concluded that at least part of the heterogeneity observed in the CFU content of individual spleen colonies arises from the composition of the initial cell suspension, probably from intrinsic differences between the stem cells themselves.
The authors wish to acknowledge the excellent technical assistance of Miss K. Benzing, Mrs. C. Spencer, R. Course, A. Galberg, R. Howell, and D. Reynolds.

R. G. WORTON, E. A. McCUI~LOCH, AND ~. E. TILL 103
BIBLIOGRAPHY
1. Fowler, J. H., A. M. Wu, J. E. Till, E. A. McCulloch, and L. Siminovitch. 1957. The cellular composition of hemopoietic spleen colonies. J. Cell. Physiol. 69:65.
2. Lewis, J. P., and F. E. Trobaugh, Jr. 1964. Haematopoietic stem cells. Nature (London). 204:589.
3. Jur~kova, V., L. Tkadie~ek, and V. Dr~il. 1964. Note on the differentiation of colonies of haematopoietic tissue cells in the spleen of irradiated mice. Folia Biol. (Praha) 10:381.
4. Curry, J. L., and J. J. Trentin. 1967. I-Iemopoiefic spleen colony studies. I. Growth and differentiation. Develop. Biol. 15:395.
5. Siminovitch, L., E. A. McCulloch, and J. E. Till. 1963. The distribution of colony- forming cells among spleen colonies. Y. Cell. Comp. Physiol. 69.:327.
6. Siminovitch, L., J. E. Till, and E. A. McCulloch. 1964. Decline in colony-forming ability of marrow cells subjected to serial transplantation into irradiated mice. Y. Cell. Comp. Physiol. 64:23.
7. Parker, R. C. 1961. Methods of Tissue Culture. Hoeber-Harper New York. 3rd edition. 77.
8. Dulbecco, R., and M. Vogt. 1954. Plaque formation and isolation of pure lines with poliomyelitis viruses. J. Exp. Med. 99:167.
9. Cunnlngham, J. R., W. R. Bruce, and H. P. Webb. 1965. A convenient mCs unit for irradiating cell suspensions and small laboratory animals. Phys. Meal. Biol. 1.0:381.
10. Miller, R. G., and R. A. Phillips. 1969. Separation of cells by velocity sedimenta- tion. Y. Ceg. Physiol. 74:1.
11. Abrahams, S., J. E. Till, E. A. McCuUoch, and L. Siminovitch. 1968. Assessment of viability of frozen bone marrow cells using a cell-culture method. Cell Tissue Kiuet. 1.'255.
12. Peterson, E. A., and W. H. Evans. 1967. Separation of bone marrow cells by sedimentation at unit gravity. Nature (London). 9.14:824.
13. Md, H. C., and J. C. Schooley. 1965. Stable-flow free boundary fractionation of spleen colony-forming cells from mouse bone marrow. In La Greffe des Cellules H~matopoittiques Allogtniques. G. Matht, J. L. Amid, and L. Schwarzenberg, editors. Centre National de ia Recherche Scientifique. Paris. 221.
14. Fowler, J. H., J. E. Till, E. A. McCulloch, and L. Siminovitch. 1967. The cellular basis for the defect in haemopoiesis in flexed-tailed mice. II. The specificity of the defect for erythropoiesis. Brit. J. Haematol. 13:256.
15. Bradley, J. V. 1968. Distribution-free statistical tests. Prentice-Hall, Inc. Eagle- wood Cliffs, N. J. 91.
16. Schofield, R., and L. G. Lajtha. 1969. Graft ~ considerations in the kinetics of spleen colony development. Cell Tissue Kinet. 2:147.
17. Till, J. E., E. A. McCttlloch, and L. Siminovitch. 1964. A stochastic model of stem cell proliferation based on the growth of spleen colony-forming cells. Proc. Nat. Acad. Sci. U.S.A. 51:29.