physical review accelerators and beams 23, 121001 (2020)
TRANSCRIPT

Tune modulation effects for colliding beamsin the High Luminosity Large Hadron Collider
S. Kostoglou ,1,2,* H. Bartosik ,1 Y. Papaphilippou ,1 G. Sterbini ,1 and N. Triantafyllou 1,3
1CERN, Geneva 1211, Switzerland2National Technical University of Athens, Athens 15780, Greece3University of Liverpool, Liverpool L69 3BX, United Kingdom
(Received 3 March 2020; accepted 2 December 2020; published 15 December 2020)
Several transverse noise sources, such as power supply ripple, can potentially act as an importantlimiting mechanism for the luminosity production of the Large Hadron Collider (LHC) and its futureHigh-Luminosity upgrade (HL-LHC) [High Luminosity Large Hadron Collider (HL-LHC): TechnicalDesign Report V0.1, CERN-2017-007-M [http://cds.cern.ch/record/782076?ln=en]]. In the presence ofnon-linearities, depending on the spectral components of the power supply ripple spectrum and thenature of the source, such a mechanism can increase the tune diffusion of the particles in thedistribution through the excitation of sideband resonances in the vicinity of the resonances driven by thelattice nonlinearities. For the HL-LHC, due to the reduction of the beam size in the interaction points(IP) of the high luminosity experiments (IP1 and 5), increased sensitivity to power supply ripple isanticipated for the quadrupoles of the inner triplets. The modulation that may arise from the powersupply ripple will be combined with the tune modulation that intrinsically emerges from the coupling ofthe transverse and longitudinal plane for off-momentum particles through chromaticity. This paper aimsto study the impact of tune modulation effects on the transverse beam motion resulting from theinterplay between quadrupolar power supply ripple and synchro-betatron coupling in the presence ofstrong head-on and long-range beam-beam interactions. A power supply ripple threshold for acceptableperformance is estimated with single-particle tracking simulations by investigating the impact ofdifferent modulation frequencies and amplitudes on the dynamic aperture. The excitation of sidebandresonances due to the tune modulation is demonstrated with frequency maps and the higher sensitivityto specific modulation frequencies is explained. Finally, a power supply ripple spectrum consisting ofseveral tones is considered to determine whether their presence will limit the luminosity production inthe HL-LHC era.
DOI: 10.1103/PhysRevAccelBeams.23.121001
I. INTRODUCTION
In order to optimize the performance of a high-energyparticle collider such as the Large Hadron Collider (LHC)[1] and its future High-Luminosity upgrade (HL-LHC) [2],a thorough understanding of all the phenomena that candegrade the luminosity is required. A major concern for thetransverse single-particle beam dynamics is the presenceof power supply ripple, i.e., a periodic perturbation in thestrengths of the lattice magnets, a mechanism that canimpact the long term stability of the circulating particlesand prove detrimental to the beam lifetime.
Harmonics of the mains power frequency (50 Hz) inthe power supply voltage result in magnetic field pertur-bations through the magnet’s transfer function that isexpressed as [3]:
ΔBðfÞ ¼ TBm→Bb× TI→Bm
× TV→I × VðfÞ; ð1Þ
where f is the frequency, VðfÞ the voltage ripple,TV→I the magnet’s circuit impedance, TI→Bm
the transferfunction from the current to the magnetic field and TBm→Bb
the magnetic field seen by the beam including the shieldingeffect of the vacuum chamber and the beam screen.The present paper investigates the implications of
power supply ripple in the quadrupoles located at thehigh β-function regions of the accelerator. These magneticfield fluctuations ΔB induce a modulation in the normal-ized focusing strength of the quadrupoles Δk. Thesegradient errors lead to a modulation of the betatron tunethat is equal to:
Published by the American Physical Society under the terms ofthe Creative Commons Attribution 4.0 International license.Further distribution of this work must maintain attribution tothe author(s) and the published article’s title, journal citation,and DOI.
PHYSICAL REVIEW ACCELERATORS AND BEAMS 23, 121001 (2020)
2469-9888=20=23(12)=121001(17) 121001-1 Published by the American Physical Society

ΔQ ¼ 1
4π
Xi
βiΔkil; ð2Þ
where βi is the β-function at the location of the ithperturbation and Δkil ¼ ΔBi
Bρ with Bρ representing thebeam rigidity. The modulation depth is defined as themaximum variation of the tune from its unperturbedvalue in the absence of a tune modulation. If present,this effect is combined with the tune modulation thatintrinsically emerges for off-momentum particles fromthe coupling of the longitudinal and transverse planethrough chromaticity [4].Tune modulation effects have been reported in the past
from several hadron synchrotrons and colliders includingthe Tevatron [5–7], the Super Proton Synchrotron (SPS)[8–10], the Relativistic Heavy Ion Collider (RHIC) [11–13]and the Hadron-Electron Ring Accelerator (HERA)[14–18]. In the SPS, the combined effect of two modulationfrequencies was experimentally proven to be more severecompared to a single frequency with an equivalentmodulation depth [8,9]. The increase of losses and emit-tance growth was correlated with the overlap of multipleresonances [10].In HERA, a dependence of the particles’ diffusion on the
modulation frequency was shown [18]. In particular, a lossrate increase by one order of magnitude was reported whena tune modulation in the frequency range of 600 Hz to1.2 kHz was applied, an effect that was not observed forother modulation frequencies. A tune ripple feedback wassuccessfully employed for the compensation of the powersupply ripple [15,16].Previous HL-LHC studies have revealed a sensitivity of
the dynamic aperture (DA) on the modulation frequency.Specifically, a DA reduction was reported for a modulationfrequency at 300 Hz and 600 Hz and a modulation depth of10−4, an effect that was not observed with other modulationfrequencies. Table I summarizes the maximum modulationdepth to avoid an impact on the beam performance forvarious accelerators as reported from previous studies.A detailed discussion on experimental observations ofpower supply ripple in the LHC is presented in [19].In the presence of nonlinearities such as sextupoles,
octupoles and beam-beam interactions, tune modulationeffects may lead to the excitation of sideband resonances.Depending on the modulation frequency, the resonancescan either overlap, leading to chaotic trajectories [23–26],
or reach the tune footprint, thereby acting as a diffusionmechanism for the particles in the distribution in addition tothe resonances driven by the lattice nonlinearities [15]. Inthe latter case, the existence of such resonances criticallylimits the available space in frequency domain for anoptimized, resonance-free working point.Subsequently, it is important to investigate whether the
combination of the tune modulation induced by powersupply ripple and synchro-betatron coupling will pose alimitation to the luminosity production of the HL-LHC, aswell as other present and future hadron colliders suchas RHIC, the Electron-Ion Collider (EIC) [27] and theFuture Circular Collider (FCC) [28]. Single-particletracking simulations are performed in the element-by-element HL-LHC lattice including chromatic sextupoles,Landau octupoles and both head-on and long-range beam-beam interactions. The two tune modulation sourcesconsidered in the present paper, power supply ripple andchromatic tune modulation, are first, studied individuallyand then, their combined impact is estimated.
II. A SIMPLIFIED FORMALISM OF TUNEMODULATION EFFECTS
In the presence of a tune modulation, the variation of thetune, referred to as the instantaneous tune, as a function ofthe turn number n is
QinstðnÞ ¼ Q0 þ ΔQ · cosð2πQmnÞ; ð3Þ
where Q0 is the unperturbed tune in the absence of the tunemodulation and ΔQ and Qm are the modulation depthand modulation tune, respectively. In the case of a tunemodulation induced by power supply ripple in quadrupolemagnets, the modulation depth is the maximum value ofEq. (2). In the presence of synchro-betatron coupling, themodulation tune is the synchrotron tune (Qm ¼ Qs) and themodulation depth is [29]:
ΔQ ¼ Q0 Δpp
; ð4Þ
whereQ0 is the chromaticity and Δpp the relative momentum
deviation of the particle. The modulation index isdefined as:
βm ¼ ΔQQm
: ð5Þ
By integrating Eq. (3), the linear betatron oscillation of aparticle with an action J is
xðnÞ ¼ffiffiffiffiffiffiffiffi2Jβ
pcos ð2πQ0nþ βm sinð2πQmÞnÞ; ð6Þ
where β is the β-function. As in every frequency modulatedsignal, considering the betatron motion as the carrier and
TABLE I. The critical modulation depth ΔQ as reported fromprevious studies in several accelerators [11,14,20–22].
Study ΔQ Study ΔQ
RHIC <10−3 LHC <5 × 10⁻⁴
SPS <10−3 HL-LHC <10−4
HERA <10−4
S. KOSTOGLOU et al. PHYS. REV. ACCEL. BEAMS 23, 121001 (2020)
121001-2

the power supply ripple as the modulator, the particle’strajectory is represented in time domain by a sum ofsinusoidal signals, weighted by the Bessel functions ofthe first kind [30]. The frequency-domain representationof the betatron motion, after normalizing by the maximumamplitude, is:
jXðQÞj ¼X∞p¼−∞
JkðβmÞ½δðQ −Q0 − p ·QmÞ
þ δðQþQ0 þ p ·QmÞ�; ð7Þ
where p is an integer, Jk are the Bessel functions of the firstkind and δ is the Dirac function. The spectrum consists ofinfinite harmonics atQ0 � p ·Qm with a relative amplitudethat depends on the modulation index. In particular, thek-order Bessel function for a modulation index βm deter-mines the amplitude of the k sideband, with J0 representingthe betatron tune. Decreasing the modulation frequency fora constant modulation depth leads to the appearance ofhigher-order sidebands with larger amplitudes in thespectrum. For a critical value of the modulation index βcm:
J0ðβcmÞ ¼ J1ðβcmÞ → βcm ¼ 1.41; ð8Þ
the amplitude of the first sideband is equal to the one of thebetatron tune. For βm ¼ 2.4, the amplitude of the betatronpeak is suppressed as J0ð2.4Þ ≈ 0.Non-linear fields are an important aspect of the accel-
erator’s lattice, introduced for the correction or enhance-ment of the chromatic aberrations and the action-dependentdetuning of the particles. A detailed discussion on thetrapping of the particles while crossing high-order non-linear resonances, which is a mechanism that can lead toparticle losses, can be found in [31]. The effect of a tunemodulation in a one-dimensional nonlinear Hamiltoniansystem has been extensively studied in the past [17,32–34].These studies have shown that the impact of a tunemodulation on the transverse motion varies, dependingon the modulation tune, Qm, the modulation depth, ΔQ,and the island tune that is defined as:
QI ¼N2π
JN=4R
ffiffiffiffiffiffiffiffiffiffiffiffi2αVN
p; ð9Þ
where JR is the resonance action, N is the resonance order,α is the amplitude detuning coefficient and VN is theresonance strength. Therefore, the island tune is a repre-sentation of the resonance strength [7,35].Through an analytical formalism, four regimes of interest
were identified in the tune modulation ðQm;ΔQÞ parameterspace [17,32–34]. Figure 1 illustrates the four regimes inthe tune modulation parameter space for the sixth-orderresonance (N ¼ 6).First, a modulation at low amplitude and low frequency
causes a time variation of the particles’ actions, without
affecting their stability (amplitude modulation regime).Second, increasing the frequency leads to the appearanceof sideband islands around the resonance, spaced by themodulation tune at k ·Qþm ·Qm ¼ n with k, m, nintegers. For small modulation depths, the islands occupya limited portion of the phase space (frequency modula-tion). As the modulation depth increases, high-ordersideband islands become significant (strong sidebands).The combination of a strong modulation in terms ofamplitude and a frequency below a critical value, resultsin the overlap of the resonance islands, hence leading tochaotic motion (chaos). The limits of the four regimes arecomputed as [34]:
�ΔQQI
��Qm
QI
�¼ 1
6; ð10aÞ
�ΔQQI
��Qm
QI
�−1
¼ 1
6; ð10bÞ
�ΔQQI
�14
�Qm
QI
�34 ¼ 4
ð6πÞ14 : ð10cÞ
The limits defined by Eq. (10a), (10b), (10c) are indicatedwith blue, red, and green, respectively, in Fig. 1.Figure 1 shows that the transition to a chaotic state occurs
when crossing the boundaries either from the amplitudemodulation regime or through the excitation of side-bands (frequency modulation, strong sidebands regimes).
FIG. 1. The four regimes in the tune modulation parameterspace for a modulation tune Qm, a modulation depth ΔQ, anisland tune QI [Eq. (9)] and the sixth-order resonance (N ¼ 6)[17,32–34]. The blue, red, and green limits are computed fromEq. (10a), (10b), (10c), respectively.
TUNE MODULATION EFFECTS FOR COLLIDING … PHYS. REV. ACCEL. BEAMS 23, 121001 (2020)
121001-3

The present paper investigates the effect of power supplyripple in a frequency range from 50 Hz to 10 kHz.Subsequently, the regimes of interest in the aforementionedparameter space are the frequency modulation, strong side-bands, and chaos, where emittance growth and particlelosses occur through the excitation of sideband islands. Forthis reason, the present paper relies on the investigation ofthe sidebands and their impact on the beam performance,while the transition to chaos from the amplitude modulationregime is not discussed as it mainly refers to low-frequencytune modulation.In two degrees of freedom and in the presence of a tune
modulation Qm, the resonance diagram is computed as:
k ·Qx þ l ·Qy þm ·Qm ¼ n; ð11Þ
where k, l, m, n are integers, N ¼ jkj þ jlj is the resonanceorder and m the sideband order. Figure 2 indicates theworking point (black star-shaped marker) and illustratesEq. (11) for a modulation at 100 Hz (left) and 800 Hz(right). The gray lines represent the nominal resonancesin the absence of a tune modulation. The first sideband(m ¼ 1) of the linear coupling resonance (N ¼ 2, blue) andthe third (N ¼ 3, cyan), fourth (N ¼ 4, green), fifth(N ¼ 5, orange), and sixth (N ¼ 6, red) order resonanceis also depicted. The solid and dashed lines illustrate thenormal (l is an even number) and skew (l is an odd number)resonances, respectively.The sidebands are always parallel to the main resonances
and they are located at a distance that is proportional to themodulation tune, an effect that is clearly shown in Fig. 2(left) with the m ¼ 1 and N ¼ 2 resonance (blue). As themodulation frequency increases, the sidebands, such asm ¼ 1 and N ¼ 2, are driven further away from theworking point. At the same time, sidebands of excitedresonances that are not in the vicinity of the working point
reach the betatron tune spread, such as the sideband of theN ¼ 3 resonance (cyan) in Fig. 2 (right). Consequently,depending on the selected working point, the resonancestrengths and the modulation frequency, the sidebands oflower or higher-order resonances might reach the betatrontune spread.
III. BEAM-BEAM INTERACTION WITHPOWER SUPPLY RIPPLE AND
SYNCHROTRON OSCILLATIONS
In the HL-LHC, luminosity leveling techniques arerequired to achieve a constant luminosity of 5×1034 cm−2s−as envisaged in the nominal scenario [2,36]. The luminositydegradation resulting from the intensity reduction from 2.2 ×10¹¹ to 1.2 × 10¹¹ protons per bunch due to the proton-protoncollisions, will be compensated by reducing the β-functionsat the interaction points (IPs) of the high luminosity experi-ments (IP1 and 5) from β� ¼ 64 cm to the unprecedentedvalue of 15 cm with the achromatic telescopic squeezing(ATS) scheme [37].To reach an integrated luminosity of 250 fb−1 per year,
the HL-LHC will also operate with low beam emittances,high intensities and strong beam-beam interactions. Inaddition to the incoherent effects, the mitigation of collec-tive instabilities requires the operation of the accelerator ina high chromatic and octupolar current regime. A chro-maticity of Q0 ¼ 15 in both transverse planes is currentlyconsidered, controlled by the chromatic arc sextupoles, andstrong Landau octupoles that result in amplitude detuningcoefficients αn1n2 ¼ ∂Qn1=∂ð2Jn2Þ with n1; n2 ∈ fx; ygequal to αxx ¼ −20.5 × 10⁴ m−1, αxy ¼ 6.8 × 10⁴ m−1,αyy ¼ −20.6 × 10⁴ m−1 as computed from the PTC-normalmodule of the MAD-X code [38]. As an alternated horizontaland vertical crossing scheme is used for the twohigh-luminosity experiments, the tune spread induced by
FIG. 2. An illustration of Eq. (11) for the nominal resonances (gray) and the first sideband (m ¼ 1) of the linear coupling resonance(N ¼ jkj þ jlj ¼ 2, blue), the third (N ¼ 3, cyan), fourth (N ¼ 4, green), fifth (N ¼ 5, orange), and sixth (N ¼ 6, red) order resonancefor a tune modulation at 100 Hz (left) and 800 Hz (right). The working point is also illustrated (black). The solid and dashed linesillustrate the normal (even value of l) and skew (odd value of l) resonances, respectively.
S. KOSTOGLOU et al. PHYS. REV. ACCEL. BEAMS 23, 121001 (2020)
121001-4
long-range beam-beam interactions is similar to the oneinduced by an octupole [39]. The amplitude detuningcoefficients due to long-range beam-beam encountersare equal to αxx¼22×104m−1, αxy ¼ −34.6 × 10⁴ m−1,αyy ¼ 24.9 × 10⁴ m−1. This configuration results in sig-nificant nonlinearities.Furthermore, a key component in the HL-LHC project is
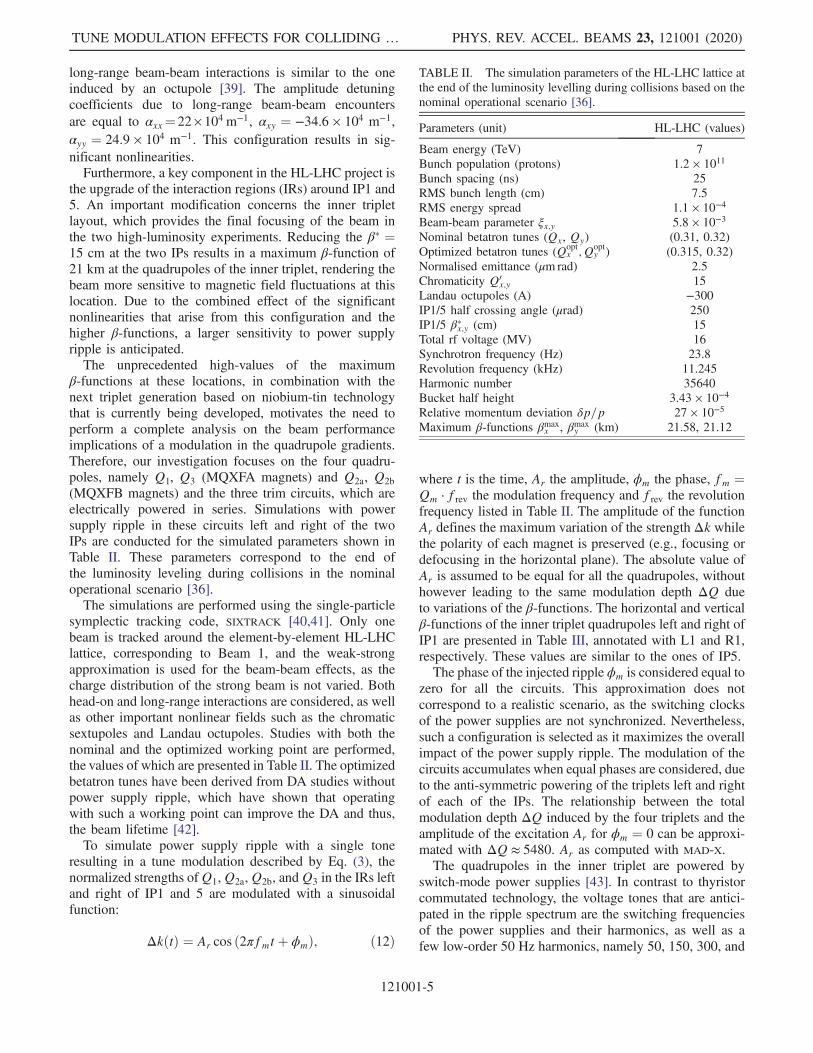
the upgrade of the interaction regions (IRs) around IP1 and5. An important modification concerns the inner tripletlayout, which provides the final focusing of the beam inthe two high-luminosity experiments. Reducing the β� ¼15 cm at the two IPs results in a maximum β-function of21 km at the quadrupoles of the inner triplet, rendering thebeam more sensitive to magnetic field fluctuations at thislocation. Due to the combined effect of the significantnonlinearities that arise from this configuration and thehigher β-functions, a larger sensitivity to power supplyripple is anticipated.The unprecedented high-values of the maximum
β-functions at these locations, in combination with thenext triplet generation based on niobium-tin technologythat is currently being developed, motivates the need toperform a complete analysis on the beam performanceimplications of a modulation in the quadrupole gradients.Therefore, our investigation focuses on the four quadru-poles, namely Q1, Q3 (MQXFA magnets) and Q2a, Q2b(MQXFB magnets) and the three trim circuits, which areelectrically powered in series. Simulations with powersupply ripple in these circuits left and right of the twoIPs are conducted for the simulated parameters shown inTable II. These parameters correspond to the end ofthe luminosity leveling during collisions in the nominaloperational scenario [36].The simulations are performed using the single-particle
symplectic tracking code, SIXTRACK [40,41]. Only onebeam is tracked around the element-by-element HL-LHClattice, corresponding to Beam 1, and the weak-strongapproximation is used for the beam-beam effects, as thecharge distribution of the strong beam is not varied. Bothhead-on and long-range interactions are considered, as wellas other important nonlinear fields such as the chromaticsextupoles and Landau octupoles. Studies with both thenominal and the optimized working point are performed,the values of which are presented in Table II. The optimizedbetatron tunes have been derived from DA studies withoutpower supply ripple, which have shown that operatingwith such a working point can improve the DA and thus,the beam lifetime [42].To simulate power supply ripple with a single tone
resulting in a tune modulation described by Eq. (3), thenormalized strengths ofQ1,Q2a,Q2b, andQ3 in the IRs leftand right of IP1 and 5 are modulated with a sinusoidalfunction:
ΔkðtÞ ¼ Ar cos ð2πfmtþ ϕmÞ; ð12Þ
where t is the time, Ar the amplitude, ϕm the phase, fm ¼Qm · frev the modulation frequency and frev the revolutionfrequency listed in Table II. The amplitude of the functionAr defines the maximum variation of the strength Δk whilethe polarity of each magnet is preserved (e.g., focusing ordefocusing in the horizontal plane). The absolute value ofAr is assumed to be equal for all the quadrupoles, withouthowever leading to the same modulation depth ΔQ dueto variations of the β-functions. The horizontal and verticalβ-functions of the inner triplet quadrupoles left and right ofIP1 are presented in Table III, annotated with L1 and R1,respectively. These values are similar to the ones of IP5.The phase of the injected ripple ϕm is considered equal to
zero for all the circuits. This approximation does notcorrespond to a realistic scenario, as the switching clocksof the power supplies are not synchronized. Nevertheless,such a configuration is selected as it maximizes the overallimpact of the power supply ripple. The modulation of thecircuits accumulates when equal phases are considered, dueto the anti-symmetric powering of the triplets left and rightof each of the IPs. The relationship between the totalmodulation depth ΔQ induced by the four triplets and theamplitude of the excitation Ar for ϕm ¼ 0 can be approxi-mated with ΔQ ≈ 5480. Ar as computed with MAD-X.The quadrupoles in the inner triplet are powered by
switch-mode power supplies [43]. In contrast to thyristorcommutated technology, the voltage tones that are antici-pated in the ripple spectrum are the switching frequenciesof the power supplies and their harmonics, as well as afew low-order 50 Hz harmonics, namely 50, 150, 300, and
TABLE II. The simulation parameters of the HL-LHC lattice atthe end of the luminosity levelling during collisions based on thenominal operational scenario [36].
Parameters (unit) HL-LHC (values)
Beam energy (TeV) 7Bunch population (protons) 1.2 × 10¹¹
Bunch spacing (ns) 25RMS bunch length (cm) 7.5RMS energy spread 1.1 × 10⁻⁴
Beam-beam parameter ξx;y 5.8 × 10⁻³
Nominal betatron tunes (Qx, Qy) (0.31, 0.32)Optimized betatron tunes (Qopt
x ; Qopty ) (0.315, 0.32)
Normalised emittance (μm rad) 2.5Chromaticity Q0
x;y 15Landau octupoles (A) −300IP1/5 half crossing angle (μrad) 250IP1/5 β�x;y (cm) 15Total rf voltage (MV) 16Synchrotron frequency (Hz) 23.8Revolution frequency (kHz) 11.245Harmonic number 35640Bucket half height 3.43 × 10⁻⁴
Relative momentum deviation δp=p 27 × 10−5
Maximum β-functions βmaxx , βmax
y (km) 21.58, 21.12
TUNE MODULATION EFFECTS FOR COLLIDING … PHYS. REV. ACCEL. BEAMS 23, 121001 (2020)
121001-5

600 Hz [44]. A summary of the switching frequencies fswalong with the inductances L and the nominal currents Iratedof the circuits under investigation are depicted in Table IV.Although it is anticipated that the switching frequenciesand their harmonics will act as the main contributors to theripple spectrum, such high frequencies are not expected toperturb the beam motion as they will be strongly attenuatedby the shielding effect of the beam screen [3,45].As a realistic voltage spectrum is not presently available,
the results of the simulations are compared to the powersupply specifications, which are summarized as a functionof the frequency in Table V. The specifications provide themaximum tolerated output voltage for an extended fre-quency bandwidth, without defining the actual amplitudeand the voltage tones in the power supply ripple spectrumof the triplet. These values and the parameters of Table IV,are used to compute the maximum possible modulationdepths of the four quadrupoles and the three trims leftand right of the two IPs. Table VI presents these valuesfor the horizontal plane and for two frequencies, 50 Hzand 600 Hz.In Eq. (1), the transfer function TV→I is approximated by
a simple RL circuit, VðfÞ are the power supply specifica-tions of Table V, TI→Bm
¼ 1 and TBm→Bb¼ 1 as the beam
screen attenuation is not included. This approach leads to
the overestimation of the maximum possible modulationdepths from the power supply specifications as the low-pass filtering of the beam screen is not considered [3,45].
A. Power supply ripple spectrum with a single tone
1. Frequency map analysis with power supply ripple
The existence and the impact of the sideband resonancesdescribed in Eq. (11) is validated with tracking simulationsin the HL-LHC lattice in the presence of a single-tonepower supply ripple in the inner triplets. The particles aretracked for 104 turns at the nominal working point and withthe simulation parameters of Table II. The initial conditionsform a polar grid up to 6.1σ in the configuration space,which in the present paper refers to the initial horizontal xand vertical y displacements of the particles, and with zeroinitial transverse momenta.To disentangle the contribution from the power supply
ripple and the synchro-betatron coupling, the synchrotronoscillations are not considered in this section. Nevertheless,to include the chromatic tune shift, the particles are placedoff-momentum with a relative momentum deviation shownin Table II.The turn-by-turn transverse displacements and momenta
are retrieved and used for the frequency map analysis(FMA) [47–50]. In particular, the tune of each particle iscomputed for the first and last 3000 turns with thenumerical analysis of fundamental frequencies (NAFF)algorithm [51–53]. The variation of the transverse tunesbetween the two time intervals Qj1 ; Qj2 with j ∈ fx; ygdefines the tune diffusion rate D:
D ¼ffiffiffiffiffiffiffiffiffiffiffiffiffiffiffiffiffiffiffiffiffiffiffiffiffiffiffiffiffiffiffiffiffiffiffiffiffiffiffiffiffiffiffiffiffiffiffiffiffiffiffiffiffiffiffiffiðQx1 −Qx2Þ2 þ ðQy1 −Qy2Þ2
q: ð13Þ
Figure 3 depicts the tune determination in the secondtime span color-coded with the logarithm of D for fourstudies: in the absence of a tune modulation [Fig. 3(a)],which is used as a reference, and in the presence of a tunemodulation with a modulation depth of ΔQ ¼ 5.5 × 10⁻⁵
TABLE III. The horizontal and vertical β-functions for theinner triplet quadrupoles left (L1) and right (R1) of IP1 at the endof the luminosity leveling (Table II).
Quadrupole βx (km) βy (km) Quadrupole βx (km) βy (km)
QL11 5.76 4.56 QR1
1 4.73 9.46QL1
2a 14.40 4.43 QR12a 5.21 21.08
QL12b 21.64 5.85 QR1
2b 10.81 17.28QL1
3 9.34 20.50 QR13 21.58 8.21
TABLE IV. The inductance L, the nominal current Irated and theswitching frequency fsw of the inner triplet circuits underconsideration [44,46].
Circuit L (mH) Irated (kA) fsw (kHz)
Q1; Q2a; Q2b; Q3 255 18 20–200Trim Q1 69 2 50Trim Q1a 34.5 0.06 45–200Trim Q3 69 2 50
TABLE V. The power supply specifications as a function of thefrequency [44,46].
Frequency Vrms (mV) Frequency Vrms (mV)
50 Hz 3.2 300 Hz-60 kHz 10500 kHz 1 30 MHz 1
TABLE VI. The horizontal modulation depth of each circuit left(L1) and right (R1) of IP1 for 50 Hz and 600 Hz as computedfrom Eq. (1) and the parameters of Tables IV and V.
Circuit ΔQð50 HzÞ (×10−7) ΔQð600 HzÞ (×10−7)QL
1 ; QL2a; Q
L2b; Q
L3 1.79 0.47
Trim QL1 1.99 0.52
Trim QL1a 2.96 0.77
Trim QL3 3.31 0.86
QR1 ; Q
R2a; Q
R2b; Q
R3 1.39 0.36
Trim QR1 1.48 0.39
Trim QR1a 2.95 0.77
Trim QR3 6.69 1.74
S. KOSTOGLOU et al. PHYS. REV. ACCEL. BEAMS 23, 121001 (2020)
121001-6

at 100 Hz [Fig. 3(b)], 350 Hz [Fig. 3(c)], and 600 Hz[Fig. 3(d)]. The typical values of the tune diffusion rate Dextend from 10−7 (blue) to 10−3 (red). The gray linesrepresent the nominal resonances, while the colored linesillustrate the first sideband (m ¼ 1) of the N ¼ 2 (blue),N ¼ 3 (cyan), N ¼ 4 (green), N ¼ 5 (orange), and N ¼ 6(red) resonance. The ðk; l; m; nÞ parameters of Eq. (11)are also illustrated for each resonance with the samecolor code.The review of the frequency maps shows that there is a
good agreement between Eq. (11) and the tracking results.For a tune modulation at 100 Hz [Fig. 3(b)] the firstsideband of the linear coupling resonance (blue) has a clearimpact on the tune diffusion of the particles. A modulationat 350 Hz [Fig. 3(c)] leads to rapid losses due to the fact thatthe first sideband of the N ¼ 3 resonance (cyan) reacheshigh-amplitude particles and overlaps with the nominalresonances (gray lines), as well as with the m ¼ 1 andN ¼ 4 resonance (green). Finally, for a modulation at600 Hz [Fig. 3(d)] the excitation of the m ¼ 1 andN ¼ 3 resonance (cyan) is visible. As this resonance affectsa large portion of the phase space, a more critical impact isobserved compared to the modulations at 50 or 100 Hz.This explains why previous studies [22] report that theHL-LHC lattice is more sensitive to the higher frequencyharmonics of 300 and 600 Hz than to the lower frequencyharmonics anticipated at 50 and 150 Hz.
Overall, in the presence of a tune modulation, theimpact on the particles’ tune diffusion rate depends onthe resonance strengths, the position of the sidebands, thesideband and resonance order (lower orders have a morecritical impact), the working point, and the actions of theaffected particles. If the sidebands reach high amplitudeparticles rapid losses are observed in a limited amount ofturns. The strong increase of the tune diffusion rate andeventually, of the beam losses depending on the proximityof a resonance has been shown in the past [54]. Tunemodulation effects introduce a frequency-dependent dif-fusion mechanism, the impact of which significantlydepends on the selected working point and the resonancestrengths. Some modulation frequencies are more criticalfor the beam performance than others for the selectedworking point. Power supply ripple in the quadrupoles canaffect the distribution even if the modulation frequency isnot in the vicinity of the working point.
2. Frequency map analysis with synchrotron oscillations
The coupling of the synchrotron and the betatron motionin the presence of a nonvanishing chromaticity leads to atune modulation with a modulation frequency equal to thesynchrotron frequency. As the synchrotron frequency in theLHC (Table II) is lower than the ripple frequencies underconsideration, the tracking is extended to 2 × 10⁴ turns to
FIG. 3. Frequency map analysis without including synchrotron oscillations (a) in the nominal configuration and in the presence of atune modulation with a modulation frequency of (b) 100 Hz, (c) 350 Hz, and (d) 600 Hz and a modulation depth ofΔQ ¼ 5.5 × 10⁻⁵. Acolor code is assigned to the logarithm of the tune diffusion rate [Eq. (13)]. The nominal (gray) lines are illustrated along with them ¼ 1and N ¼ 2 (blue), N ¼ 3 (cyan), N ¼ 4 (green), N ¼ 5 (orange), and N ¼ 6 (red) resonances, annotated with the ðk; l; m; nÞ parametersof Eq. (11). The simulation parameters are listed in Table II.
TUNE MODULATION EFFECTS FOR COLLIDING … PHYS. REV. ACCEL. BEAMS 23, 121001 (2020)
121001-7

average over several modulation periods. The same dis-tribution of particles is tracked including synchrotronoscillations in the nominal HL-LHC lattice without powersupply ripple in the triplet.The modulation index βm ¼ 1.9, as computed from
Eq. (4) and (5) with the parameters of Table II, exceedsthe critical value of 1.41 [Eq. (8)]. Due to the appearance ofstrong sidebands, the NAFF algorithm returns the fre-quency determination of the sideband and not the one ofthe betatron tune. Therefore, to illustrate the frequency mapincluding synchrotron oscillation the chromaticity isreduced to Q0 ¼ 5 in both transverse planes (βm ¼ 0.64).Figure 4 demonstrates the FMA (left) and the initial
configuration space (right) color-coded logarithm ofD. Thefrequency map shows that high-order synchrotron side-bands (m ≤ 8) of the linear coupling resonance (blue) areexcited. This underlines that, for the selected parameters,the chromatic tune modulation is in the strong sidebandsregime of Fig. 1.Although considering a constant relative momentum
deviation δp=p for all the particles in the distribution isessential to compute frequency maps, experimentally theinitial longitudinal distribution extends over the wholebucket area. As the particles have different relative momen-tum deviations, the variation of the modulation index in thedistribution leads to the reduction of the average modula-tion. The next section focuses on the investigation of theintensity evolution in a more realistic configuration.
3. Intensity evolution simulations
Intensity evolution studies require tracking with arealistic distribution of synchrotron oscillation amplitudesthat spans the whole bucket height. Due to the excitation ofadditional resonances from the slow (synchrotron motion)and fast (power supply ripple) modulation, particles at thetails of the distribution diffuse and will eventually be lost.A detailed representation of the high amplitude particles is
achieved by first, overpopulating the tails and then,assigning weights to the particles according to their initialamplitudes.Specifically, the initial conditions form a 4D round
distribution that extends up to 6σ by sampling from auniform distribution both in the initial configuration spaceand also in phase space. Longitudinally, the particles areuniformly placed in the bucket height extending up to itslimit. The required number of particles for these simula-tions is derived from convergence studies (Appendix B).Overall, 9 × 10⁴ particles are tracked for 106 turns and theturn-by-turn transverse displacements and momenta areretrieved every 103 turns.Depending on the initial amplitudes of the particles in
the transverse and longitudinal plane, a weight is assignedto each particle in the post-processing analysis. The weightdefines the importance of each particle in the computa-tions of the intensity. It is determined from the probabilitydensity function (PDF) of the simulated distribution.To simulate a Gaussian distribution in the horizontal andvertical plane, as well as in the longitudinal, the weight of aparticle is computed as:
w ¼Q
3j¼1
1ffiffiffiffi2π
pσje−ðx2
jþp2
jÞ
2σj
Piwi
; ð14Þ
where j iterates over the three planes, xj, pj are the initialnormalized position and momentum coordinates and thedenominator denotes the normalization with the sum ofthe weights of all the particles. A mechanical aperture isdefined in the post-processing at 5σ to simulate the impactof the primary collimators. Particles reaching this limit areconsidered lost and the corresponding weights are setto zero.Although Gaussian distributions are considered in the
present paper, experimental observations show that thetransverse bunch profiles in the LHC have overpopulatedtails compared to the ones of a normal distribution [55,56].The impact of non-Gaussian bunch profiles on the intensityevolution is treated in Appendix C.Figure 5 depicts the intensity evolution as computed
from the weighted distributions. First, the chromaticity andthus, the modulation depth is increased in steps [Fig. 5(a)]from 0 to 15. The intensity evolution shows that theintensity degradation scales roughly linearly with thechromaticity increase. The instantaneous lifetime τ iscomputed from the intensity evolution I as a function oftime t:
IðtÞ ¼ I0ðtÞ · e−t
τðtÞ; ð15Þ
where I0 denotes the initial intensity. It is estimated using asliding window in the intensity with a few thousand turnsin each step. The fit is illustrated for a few cases in Fig. 5
FIG. 4. Frequency map analysis (left) and initial configurationspace (right) including synchrotron oscillations with chromaticityQ0 ¼ 5 in both transverse planes, relative momentum deviationδp=p ¼ 27 × 10−5, modulation depth ΔQ ¼ 1.35 × 10⁻³ andmodulation index βm ¼ 0.64. The blue lines depict the sidebands(m ≤ 8) of the linear coupling resonance.
S. KOSTOGLOU et al. PHYS. REV. ACCEL. BEAMS 23, 121001 (2020)
121001-8

(light green). The first few thousand turns are discardedfrom the computation of the lifetime as fast losses ofparticles close to the aperture limit occur. Increasing thechromaticity from 0 to 15, the average instantaneouslifetime reduces from approximately 1600 h to 1100 h.The fact that the instantaneous lifetime is not estimatedwith a simple single exponential fit but with a slidingwindow to obtain a more accurate representation of itsevolution is illustrated in Fig. 15 of Appendix C.For a constant chromaticity of Q0 ¼ 15 in both planes,
the frequency of the tune modulation induced by powersupply ripple is varied for a constant modulation depthΔQ ¼ 5.5 × 10⁻⁵ [Fig. 5(b)]. Although for a constantmodulation depth the modulation index βm decreases withincreasing frequency, the impact on the intensity is muchmore severe for 600 Hz (red) compared to 50 (cyan), 150(blue), and 300 Hz (green). A reduction of the averagelifetime from ≈1100 h to ≈750 h is computed by increas-ing the modulation frequency from 50 Hz to 300 Hz and to≈130 h for 600 Hz.
4. Power supply ripple thresholds with parametricdynamic aperture scans
Parametric simulations are performed to explore theimpact of various modulation frequencies and depths onthe DA and to compare the tracking results to the powersupply specifications. The duration of the tracking is 106
turns, which corresponds to ≈90 seconds of beam colli-sions. For each study, a different combination of themodulation frequency and depth is selected in order toconduct a scan in the tune modulation parameter space. Thefrequency range spans over all 50 Hz harmonics up to10 kHz. For each frequency, the amplitude of the excitationAr is increased and the total modulation depth ΔQ due to
the contribution of all the circuits is computed. In thesesimulations, the chromatic tune modulation is also includedwith ΔQ ¼ 4 × 10⁻³ as computed from the values ofchromaticity and relative momentum deviation presentedin Table II. The minimum DA across all the angles in theinitial configuration space is computed.Figure 6 presents the modulation frequency as a function
of the modulation depth in a color plot of the minimumDA.The parametric scan defines the modulation depth thresholdfor each modulation frequency beyond which a significantDA reduction is foreseen (white to red). As an average,
FIG. 5. (a) Intensity evolution in the HL-LHC lattice, including beam-beam interactions and with the simulation parameters ofTable II, for a horizontal and vertical chromaticity of Q0 ¼ 0 (black), Q0 ¼ 5 (green), Q0 ¼ 10 (blue), and Q0 ¼ 15 (red). (b) Intensityevolution for Q0 ¼ 15 without power supply ripple (black) and in the presence of a tune modulation with ΔQ ¼ 5.5 × 10⁻⁵ at 50 Hz(cyan), 150 Hz (blue), 300 Hz (green), and 600 Hz (red). An important impact is observed at 600 Hz due to the excitation of the m ¼ 1and N ¼ 3 resonance. The fits for the estimation of the instantaneous lifetime [Eq. (15)] are also illustrated (light green).
FIG. 6. Critical tune modulation depth ΔQ as a function ofmodulation frequency fm color-coded with the minimum DA inthe presence of power supply ripple in the inner triplet quadru-poles. The simulation parameters are listed in Table II and thetracking is performed in the element-by-element HL-LHC lattice,including beam-beam interactions and chromatic tune modula-tion with ΔQ ¼ 4 × 10⁻³. The red and black lines represent thesum and the root mean square of the contribution from all thecircuits, respectively, computed from the power supply specifi-cations of Table VI and Eq. (16).
TUNE MODULATION EFFECTS FOR COLLIDING … PHYS. REV. ACCEL. BEAMS 23, 121001 (2020)
121001-9

a maximum limit in the order of ΔQ ¼ 10−4 in themodulation depths can be defined; however the strongdependency on the modulation frequency is evident and, asexpected from the frequency maps, there are regimes withincreased sensitivity to power supply ripple.Next, the maximum possible modulation depth is com-
puted from the power supply specifications (Table VI).For each triplet, the contribution of the four main powersupplies and the three trim converters are considered. Thesum ΔQmax and the root mean square ΔQrms modulationdepths from all triplets is computed as:
ΔQmax ¼X4a¼1
X4b¼1
ΔQa;b;
ΔQrms ¼ffiffiffiffiffiffiffiffiffiffiffiffiffiffiffiffiffiffiffiffiffiffiffiffiffiffiffiX4a¼1
X4b¼1
ΔQ2a;b
vuut ; ð16Þ
where a, b refer to the four triplets and the four circuits(Table V), respectively. The sum (red dashed) and the rootmean square (black dashed) are illustrated in Fig. 6.A comparison shows that the threshold modulation
depths from simulations exceeds the maximum possibledepths from the power supply specifications by approx-imately two orders of magnitude. Therefore, the muchlarger tolerances defined by the DA simulations suggestthat, by considering individual tones, the ripple in the innertriplet, combined with large chromaticity values, will notpose a limitation for the beam performance.
5. A review of the high-sensitivity powersupply ripple regimes
Based on the color plot of Fig. 6, a more detailedanalysis is performed around the frequency regimes witha higher sensitivity to power supply ripple. Two ripplemodulation depths, ΔQ ¼ 10−4 and ΔQ ¼ 10−3, illustratethe transition from slight to significant DA reduction.
The modulation frequency is 600 Hz in both cases andthe optimized working point is selected (Table II).Figure 7 depicts the FMA in the reference conditions
(left) and with a tune modulation at 600 Hz for ΔQ ¼ 10−4(middle), and ΔQ ¼ 10−3 (right). The first sideband of theN ¼ 3 (cyan), N ¼ 5 (orange), and N ¼ 6 (red) resonanceis depicted. The analysis of the frequency maps demon-strates that the critical impact on the DA when increasingthe modulation depth is observed due to, first, the increaseof the sideband resonance strength and, second, theappearance of higher-order sidebands.Second, a higher sensitivity is observed around the
regime of the betatron frequency (fx ≈ 3.48 kHz) and itsalias, i.e., the folding of the betatron frequency around therevolution frequency (frev − fx ≈ 7.76 kHz). This obser-vation is attributed to the dipolar effect of the tripletsthrough feed-down. In particular, as the particle trajectoriesare not aligned to the magnetic center of the quadrupoles,an orbit modulation is also observed.This is demonstrated by tracking a single particle in the
HL-LHC lattice under the influence of a tune modulationat 600 Hz and 3.4 kHz. From the turn-by-turn data thepower spectrum is computed as demonstrated in Fig. 8.In the former case (top), apart from the sidebands (red)around the betatron tune (black), a dipolar excitation isalso visible (purple). As the excitation frequency is notin the vicinity of the betatron tune spread, the dipolareffect has no impact on the tune diffusion. In the secondcase (bottom), the frequency of one of the sidebands(≈6.89 kHz) exceeds the Nyquist frequency of the turn-by-turn acquisitions (≈5.62 kHz) and it is aliased into thespectrum (≈4.36 kHz). The dipolar excitation (purple)approaches the betatron tune spread and eventually, hasan impact on the betatron motion.The dipolar effect of the triplet eventually leads to
the excitation of additional resonances for modulationfrequencies close to the tune. For the horizontal planethese first-order resonances are
FIG. 7. The frequency maps at the optimized working point ðQx;QyÞ ¼ ð0.315; 0.32Þ, without considering synchrotron oscillations,with the reference conditions (left) and with a tune modulation at 600 Hz with ΔQ ¼ 10−4 (middle), and ΔQ ¼ 10−3 (right). The graylines represent the nominal resonances, while the cyan lines the m ¼ 1 and N ¼ 3 resonance.
S. KOSTOGLOU et al. PHYS. REV. ACCEL. BEAMS 23, 121001 (2020)
121001-10

Qx ¼ n�m ·Qm: ð17Þ
The N ¼ 1 resonances appear as vertical lines in the tunediagram. Figure 9 illustrates the FMA (left) and the initial
configuration space (right) for a tune modulation at afrequency in the vicinity of the working point (3.55 kHz),which shows that the main contributor to the increase ofthe tune diffusion rate is the m ¼ 1 and N ¼ 1 resonance(purple).
6. A visual tool to predict frequency sensitivity
The parametric scan in the tune modulation parameterspace presented in Fig. 6 is computationally challenging asit requires performing 6000 DA simulations. Moreover, thetracking must be repeated if the selected working point ismodified. Although running the simulations up to 106 turnsis essential to determine the minimum modulation depththat leads to a DA reduction, it is not required to identify, ina fast way, the safest modulation frequencies for operation.A computationally simple and visual tool predicts the beamsensitivity to specific modulation frequencies based on theposition of the sideband resonances. Only the knowledge ofthe betatron tune spread is needed for the unperturbed case,i.e., the reference conditions without power supply ripple.The working principle of the method is presented in
Fig. 10, which shows the betatron tune spread (left panel)and the initial configuration space (right panel) in theabsence of power supply ripple (black). Based on the
FIG. 8. Power spectrum of a single particle, which is tracked inthe HL-LHC lattice, in the presence of a tune modulation at600 Hz (top) and 3.4 kHz (bottom) that depicts the sidebands(red) around the betatron tune (black) and the dipolar excitation(purple) due to feed-down.
FIG. 9. Frequency map analysis (left) and initial configurationspace (right) for the simulation parameters in Table II, a tunemodulation at 3.55 kHz and without considering synchrotronoscillations. The purple line represents the m ¼ 1 and N ¼ 1resonance [Eq. (17)], which is the dipolar excitation at 3.55 kHzin the horizontal plane.
FIG. 10. The footprint (left panel) and the initial configurationspace (right panel) for the simulation parameters of Table II andin the absence of power supply ripple (black). The first sideband(m ¼ 1) of N ¼ 1 (purple), N ¼ 2 (blue) N ¼ 3 (cyan), N ¼ 4(green), N ¼ 5 (orange) and N ¼ 6 (red) resonance is illustratedfor a modulation at 600 Hz (top) and 3.55 kHz (bottom) in bothtune domain and configuration space.
TUNE MODULATION EFFECTS FOR COLLIDING … PHYS. REV. ACCEL. BEAMS 23, 121001 (2020)
121001-11

modulation tune, the m ¼ 1 and N ≤ 6 resonances arecomputed from Eq. (11). Similarly to the previous fre-quency maps, a different color code is assigned to eachresonance order.Figure 10 depicts the sideband resonances in the vicinity
of the footprint due to a modulation at 600 Hz (top) and3.55 kHz (bottom). For the selected working point, them ¼ 1 and N ¼ 3 resonance (cyan) reaches the footprintfor modulation at 600 Hz.Inspection of Fig. 10 (bottom) shows that the m ¼ 1 and
N ¼ 1 resonance (purple), which is the dipolar excitation at3.55 kHz, affects the footprint. As lower-order resonanceshave a more significant impact, a tune modulation at3.55 kHz (m ¼ 1 and N ¼ 1) is expected to be moredetrimental to the beam performance than the modulation at600 Hz (m ¼ 1 and N ¼ 3).Then, depending on tune versus position, a resonance
map is drawn connecting the tune space and the initialconfiguration space (Fig. 10 right panel). An example ofthe method is presented in the Appendix A. A modulationat 3.55 kHz mainly affects the tails of the distribution, whilea modulation frequency at 600 Hz has also an impact on thecore. The representation of the resonances in the initialconfiguration space rather than in the tune domain allowsfor an easier correlation of the DA, which is computed inconfiguration space, with the tune diffusion.A comparison of the predictions of Fig. 10 (bottom) to
Fig. 9, which is computed with tracking simulations, showsthat there is a good agreement between the two. Inparticular, the m ¼ 1, N ¼ 1 resonance has a strong impacton the particles with initial horizontal displacements at 3σand up to 5σ in the vertical plane (Fig. 9 right panel), whichis also predicted through the resonance mapping in Fig. 10(bottom, right panel, purple). Therefore, using Eq. (11),determining whether the first sideband of the resonances upto a specific order reaches the footprint and mapping thesesideband resonances in configuration space allows identi-fying the ones that affect the beam performance dependingon the modulation frequency.A similar analysis to Fig. 10 is performed for all the
multiples of 50 Hz up to 10 kHz. Figure 11 presents themodulation frequency as a function of the resonanceorder N. For each modulation frequency, the previouslydescribed procedure is repeated to determine whether them ¼ 1 or m ¼ 2 sideband up to the N ¼ 6 resonance islocated in the vicinity of the working point. Then, a color-code is assigned depending on whether the m ¼ 1 (red) orm ¼ 2 (orange) sideband affects the distribution. Thefrequency regimes with a red color, especially for loworder resonances, are the modulation frequencies with thelargest impact on the beam and should, therefore, beavoided. The orange regimes illustrate them ¼ 2 sidebandsand should be avoided only for large modulation depths.A blue color is assigned to the study if none of theresonances under consideration reach the footprint.
A comparison between the predictions (Fig. 11) and theresults of the tracking simulations (Fig. 6) shows a goodagreement between the two. The large impact on DA closeto the betatron tune and its alias is due to the m ¼ 1 andN ¼ 1 resonance. In the vicinity of the betatron tune(≈4.05 kHz) and its alias (≈7.05 kHz), there is an addi-tional high-sensitivity regime due to the m ¼ 1 and N ¼ 2resonance. The impact on DA for modulation frequenciesaround 50–1050 Hz is attributed to them ¼ 1 of the N ¼ 2and N ¼ 3 resonances that reach the footprint for suchmodulation frequencies. For large modulation depths, a DAreduction is observed in the frequency region close to(≈2.05 kHz), which is due to the m ¼ 2, N ¼ 1 and N ¼ 2resonance. Finally, no impact on the DAwas observed fromthe tracking simulations around the regime of 6.05 kHz,which is explained by the fact that no sideband up N ¼ 6affects the footprint for such modulation frequencies.In this way, the modulation frequencies with sideband
resonances that do not reach the footprint can be easilyidentified and they can be distinguished in a fast wayfrom the modulation frequencies with a critical impact.This visual tool can guide the selection of the power supplyswitching frequencies with the least possible impact on thebeam dynamics in a fast way, for several working pointsand different optics.
B. Including a power supply ripple spectrumwith multiple tones
The combined effect of the several voltage tones that areanticipated in the power supply ripple spectrum is esti-mated. The envisaged switching frequencies lie in a high-frequency regime (Table IV) and, as they are not expectedto perturb the beam motion, they are not considered in thefollowing analysis. In this context, the power supply ripplespectrum under consideration consists of the low-order
FIG. 11. The modulation frequency as a function of theresonance order N ¼ jkj þ jlj as computed with the visual toolwithout tracking simulation and for the simulations parameters ofTable II. A color code is assigned depending on whether them ¼ 1 (red) or m ¼ 2 (orange) sideband reaches the footprint ornot (blue) for each modulation frequency.
S. KOSTOGLOU et al. PHYS. REV. ACCEL. BEAMS 23, 121001 (2020)
121001-12

50 Hz harmonics. Table VII presents the root mean squareΔQrms and maximum ΔQmax modulation depth for eachfrequency as computed from Eq. (16). Three studies areperformed: first, a baseline scenario in the absence of a tunemodulation, second, including a ripple spectrum withmultiple tones and ΔQrms and finally, with ΔQmax.Figure 12 depicts the initial configuration space color-
coded with the tune diffusion rate in the absence of powersupply ripple (left) and including the maximum modulationdepths ΔQmax (right) at the frequencies listed in Table VII.The average tune diffusion rate, without consideringsynchrotron oscillations, increases from log10 D ¼ −7.78in the baseline scenario to −7.43 when considering ΔQrmsand −7.18 with ΔQmax. This small increase of the tunediffusion is mainly due to the tune modulation at 50 Hzand 600 Hz.Intensity evolution simulations, including synchrotron
oscillations, are performed to estimate whether this slightincrease in the tune diffusion rate can eventually enhancethe particle losses. The results suggest that the consideredripple spectrum has an insignificant impact on the intensitycompared to the reference case for both studies. It isconcluded that the combined effect of multiple voltagetones in the ripple spectrum, with modulation depths thatare extracted from the power supply specifications, will notaffect the beam performance of the HL-LHC.The tracking simulation studies presented in this paper
include the most important nonlinear fields in the LHC
such as the long-range and head-on beam-beam, sextupolesand octupoles. Additional effects such as electron-cloud[57], which have been experimentally observed in the LHC,can potentially introduce additional nonlinearities and mayenhance the impact of power supply ripple on the beamperformance.
IV. CONCLUSIONS
The increase of the β-functions in the HL-LHC innertriplets, resulting from the decrease of the beam size at thetwo IPs, and the presence of strong nonlinearities, com-bined with the new hardware that is currently beingdeveloped, motivates the need to perform a completeanalysis on the repercussions of power supply ripple infuture operation. These are based on simulations withparameters that correspond to the end of the luminosityleveling, a scenario that is the most critical in terms ofpower supply ripple. The tracking was performed in theelement-by-element HL-LHC lattice, including head-onand long-range beam-beam interactions, arc sextupolesand octupoles. The modulation from the power supplyripple was combined with the chromatic tune modulation.By individually scanning several modulation fre-
quencies and depths the impact of the power supply rippleon the DA was computed. A comparison with thepower supply specifications, without considering theshielding effects of the magnets that lead to a furtherattenuation of the ripple, showed that the maximumpossible ripple level is approximately two orders ofmagnitude lower than the minimum modulation depthswhich reduce the DA.The sensitivity of the beam performance to particular
modulation frequencies stems from the excitation of side-band resonances that affect the particles’ tune diffusionrate, a mechanism that strongly depends on the workingpoint and the non-linear magnet strengths. This is thefirst time that FMAs have been used to demonstrate theexcitation of sideband resonances, although their concepthas been introduced in the past. Based on the position of thesideband resonances, a visual tool to determine in a fastway the safest modulation frequencies for operation such asthe power supply switching frequencies in the inner triplethas been derived.Including in the simulations the simultaneous effect of
several voltage tones that are anticipated in the ripplespectrum, with modulation depths computed from thepower supply specifications, it was concluded that theimpact on the tune diffusion and eventually, on the lifetimeis expected to be negligible.The DA tolerances defined by the simulations must be
experimentally verified in future operation through con-trolled quadrupolar excitations and experimental tunescans. Finally, to improve the validity of the simulations,a realistic power supply ripple spectrum must be included,in combination with a more accurate representation of the
TABLE VII. The maximum and root mean square modulationdepths of the low order 50 Hz harmonics included in thesimulations as computed from the power supply specifications(Table VI) and Eq. (16).
Frequency (Hz) ΔQrmsð×10−6Þ ΔQmaxð×10−6Þ50 1.3 4.5150 0.8 2.8300 0.7 2.4600 0.3 1.2
FIG. 12. The initial configuration space for the simulationparameters of Table II in the absence of power supply ripple (left)and including a tune modulation (right) with spectral componentsat 50, 150, 300, and 600 Hz with the maximum modulationdepths ΔQmax (Table VII).
TUNE MODULATION EFFECTS FOR COLLIDING … PHYS. REV. ACCEL. BEAMS 23, 121001 (2020)
121001-13

transfer function of the ripple spectrum from the voltage tothe magnetic field.A general analysis framework of simulation data has
been developed. In particular, this paper demonstrated theimportance of FMA in the investigation of power supplyripple, illustrated methods to define power supply ripplethresholds through DA scans and presented tools todetermine the intensity evolution with weighted distribu-tions. The methods can be applied to studies of severalother types of power supply ripple and noise effects, as wellas other present and future accelerators such as RHIC, EIC,and FCC.
ACKNOWLEDGMENTS
The authors gratefully acknowledge G. Arduini, R. DeMaria, M. Fitterer, D. Gamba, R. T. Garcia and M. Martinofor valuable suggestions and discussions on this work.Research supported by the HL-LHC project.
APPENDIX A: RESONANCE MAP FROM TUNEDOMAIN TO INITIAL CONFIGURATION SPACE
The tune of a particle with initial transverse displace-ments ðx0; y0Þ can be expressed in vector form as:
vp ¼ Qxνx þQyνy; ðA1Þ
where Qx and Qy denote the horizontal and vertical tune,respectively. Assuming two distinct points of the resonanceline vra ¼ Qxa νx þQya νy and vrb ¼ Qxb νx þQyb νy, theresonance line is expressed as:
vr ¼ vrb − vra : ðA2Þ
In tune domain, the perpendicular distance of the particle’stune from the resonance line is
d ¼ jðvp − vraÞ × vrjjvrj
: ðA3Þ
To determine whether the particle is affected by theresonance, a distance tolerance ϵ is defined:
d < ϵ: ðA4Þ
A good agreement between this method and trackingsimulations has been found for ϵ ¼ 10−4. If the conditionof Eq. (A4) is satisfied, the initial transverse positions of theparticle are retrieved and the procedure is repeated for allthe particles in the distribution. The method is then iteratedfor all the sideband resonances that reach the footprint.For instance, in the presence of a tune modulation
at fm ¼ 600 Hz, a sideband resonance that reaches thefootprint is 2Qx þQy þQm ¼ 1. In this case, vra ¼0.31632νx þ 0.314νy and vrb ¼ 0.31032νx þ 0.326νy.
Considering a particle with initial horizontal and verticaldisplacements ðx0; y0Þ ¼ ð0.93σx; 4.52σyÞ with vp ¼0.31266νx þ 0.32120νy, Eq. (A3) yields d ¼ 0.5 × 10⁻⁴.As Eq. (A4) is satisfied, the particle is affected by theresonance and its initial conditions are used for themapping. Iterating over all particles results in the projectionof the resonance from the tune domain to the initialconfiguration space.
APPENDIX B: CONVERGENCE STUDIES FORINTENSITY EVOLUTION SIMULATIONS
Convergence studies are performed to determine thesuitable number of particles in the tracking simula-tions with weighted distributions that offers sufficientstatistical significance for the intensity evolution estima-tions. Figure 13 depicts the intensity evolution for anincreasing number of particles starting from 20 × 103
(blue) and extending up to 250 × 103 particles (purple).Based on the convergence tests, a minimum sample size of80 × 103 (green) particles is sufficient to converge to anaccurate intensity evolution estimation.
APPENDIX C: NON-GAUSSIANBUNCH PROFILES
Studies of the LHC bunch profiles have shown that theirtails are overpopulated in the transverse plane and under-populated in the longitudinal plane compared to the onesof a Gaussian distribution [55]. To include non-Gaussianbunch profiles in the intensity evolution simulations, thePDF of a generalized Gaussian distribution is employed,the q-Gaussian distribution [56]. The parameter q of theq-Gaussian distribution represents the weight of the tails.The normal distribution is retrieved as q → 1, while q > 1describes a distribution with overpopulated or “heavier”tails compared to ones of the normal Gaussian distribution.
FIG. 13. Intensity evolution computed with 20 × 103 (blue),40 × 103 (orange), 80 × 103 (green), 125 × 103 (red), and250 × 103 (purple) particles and the weights from Eq. (14).
S. KOSTOGLOU et al. PHYS. REV. ACCEL. BEAMS 23, 121001 (2020)
121001-14

Figure 14 depicts the probability density of the hori-zontal initial positions (blue) normalized with the beamsize. The weights of Eq. (14) are computed with theq-Gaussian PDF and q ¼ 1.5 for both transverse planes,while a normal distribution is used for the longitudinalplane. The PDF of the normal (q ¼ 1, black dashed line)and the q-Gaussian distribution (q ¼ 1.5, red dashed line)are also illustrated. The comparison between the twoclearly shows the overpopulation of the tails in the q ¼1.5 case. The gray vertical lines represent the physicalposition of the primary collimators during the LHC physicsoperation in 2018 (6.7σ, ϵn ¼ 2 μm rad).Bunch profiles like the one of Fig. 14 are used as initial
conditions for the intensity evolution simulations. To studythe impact of tail population on the beam lifetime, a series
of studies are performed for different q-parameters in thetransverse plane. The instantaneous beam lifetime isestimated by applying the fit of Eq. (15) with a slidingwindow in each case. Figure 15 presents the evolution ofthe instantaneous lifetime as a function of time for aq-parameter that spans from 1 (blue) to 1.3 (brown).The instantaneous lifetime strongly depends on the tailoverpopulation. In particular, a reduction of the averageinstantaneous lifetime from 3200 h (q ¼ 1) to 3.7 h(q ¼ 1.3) is observed. This observation highlights theimportance of including realistic bunch profiles in thesimulations for an accurate estimation of the beam lifetime.
[1] O. S. Brüning, P. Collier, P. Lebrun, S. Myers, R. Ostojic, J.Poole, and P. Proudlock, LHC Design Report, CERNYellow Reports: Monographs (CERN, Geneva, 2004).
[2] G. Apollinari, I. B. Alonso, O. Brüning, P. Fessia, M.Lamont, L. Rossi, and L. Tavian, High-Luminosity LargeHadron Collider (HL-LHC), CERN Yellow Rep. Monogr.4, 1 (2017).
[3] M. Morrone, M. Martino, R. De Maria, M. Fitterer, and C.Garion, Magnetic frequency response of High-LuminosityLarge Hadron Collider beam screens, Phys. Rev. Accel.Beams 22, 013501 (2019).
[4] S. G. Peggs and R. Talman, Nonlinear problems in accel-erator physics, Annu. Rev. Nucl. Part. Sci. 36, 287 (1986).
[5] A. Chao, D. Johnson, S. Peggs, J. Peterson, C. Saltmarsh,L. Schachinger, R. Meller, R. Siemann, R. Talman, P.Morton et al., Experimental Investigation of NonlinearDynamics in the Fermilab Tevatron, Phys. Rev. Lett. 61,2752 (1988).
[6] T. Satogata, T. Chen, B. Cole, D. Finley, A. Gerasimov, G.Goderre, M. Harrison, R. Johnson, I. Kourbanis, C. Manz,N. Merminga, L. Michelotti, S. Peggs, F. Pilat, S. Pruss, C.Saltmarsh, S. Saritepe, R. Talman, C. G. Trahern, and G.Tsironis, Driven Response of a Trapped Particle Beam,Phys. Rev. Lett. 68, 1838 (1992).
[7] S. G. Peggs, Hamiltonian theory of the E778 nonlineardynamics experiment, in 2nd ICFA Advanced BeamDynamics Workshop (1988), p. 15, http://cds.cern.ch/record/189293/files/131.pdf.
[8] X. Altuna, C. Arimatea, R. Bailey, T. Bohl, D. Brandt,K. Cornelis, C. Depas, F. Galluccio, J. Gareyte, R.Giachino, M. Giovannozzi, Z. Guo, W. Herr, A. Hilaire,T. Lundberg, J. Miles, L. Normann, T. Risselada, W.Scandale, F. Schmidt, A. Spinks, and M. Venturini, The1991 dynamic aperture experiment at the CERN SPS,Tech. Rep. Nos. CERN-SL-91-43-AP, LHC-NOTE-171,CERN-LHC-Note-171 (CERN, Geneva, 1991).
[9] W. Fischer and M. Giovannozzi, Dynamic aperture experi-ment at a synchrotron, Phys. Rev. E 55, 3507 (1997).
[10] O. S. Brüning, Diffusion in A FODO cell due to modu-lation effects in the presence of nonlinear fields, Part.Accel. 41, 133 (1992).
[11] W. Fischer and T. Satogata, A simulation study on tunemodulation effects in RHIC, Tech. Rep. (BrookhavenNational Lab. (BNL), Upton, NY (United States), 1996).
FIG. 14. Probability density of the horizontal initial positionsnormalized to the beam size (blue). The weights of Eq. (14) arecomputed with the q-Gaussian PDF and q ¼ 1.5 (red dashedline). The PDF of the normal distribution is also shown (blackdashed line). The gray vertical lines illustrate the position of theprimary collimators during the LHC physics operation in 2018.
FIG. 15. Instantaneous lifetime computed with q-Gaussiandistributions and q¼1 (blue), q¼1.05 (orange), q ¼ 1.1 (green),q ¼ 1.2 (red), q ¼ 1.25 (purple), and q ¼ 1.3 (brown).
TUNE MODULATION EFFECTS FOR COLLIDING … PHYS. REV. ACCEL. BEAMS 23, 121001 (2020)
121001-15

[12] G. Parzen, Tune modulation due to synchrotron oscillationsand chromaticity, and the dynamic aperture, in Proceed-ings, 16th Particle Accelerator Conference andInternational Conference on High-Energy Accelerators,HEACC 1995: Dallas, USA, May 1-5, 1995 (1994)pp. 2798–2800, https://accelconf.web.cern.ch/p95/ARTICLES/FAB/FAB04.pdf.
[13] G. Parzen, Tune modulation due to gradient ripple and thedynamic aperture, Tech. Rep. (Brookhaven National Lab.,Upton, NY (United States), 1994).
[14] O. S. Brüning, M. Seidel, K. Mess, and F. Willeke,Measuring the effect of an external tune modulation onthe particle diffusion in the proton storage ring of HERA,Tech. Report No. P00021147, 1994.
[15] O. S. Brüning and F. Willeke, Diffusion-like processes inproton storage rings due to the combined effect of non-linear fields and modulation effects with more than onefrequency, in Proceedings of the 4th European ParticleAccelerator Conference, London, England, 1994 (EPS-AG, London, UK, 1994).
[16] O. S. Brüning and F. Willeke, Reduction of particle lossesin HERA by generating an additional harmonic tunemodulation, in Proceedings of the Particle AcceleratorConference, Dallas, TX, 1995 (IEEE, New York, 1995),pp. 420–422, Vol. 1.
[17] F. Zimmermann, Emittance growth and proton beam life-time in HERA, Ph.D. thesis, Hamburg U., 1993.
[18] O. S. Brüning, An analysis of the long-term stability of theparticle dynamics in hadron storage rings, Ph.D. thesis,Hamburg U., 1994.
[19] S. Kostoglou, G. Arduini, L. Intelisano, Y. Papaphilippou,and G. Sterbini, Impact of the 50 Hz harmonics on thebeam evolution of the Large Hadron Collider, arXiv:2003.00140.
[20] W. Fischer, An experimental study on the long-termstability of particle motion in hadron storage rings,Ph.D. thesis, Hamburg U., 1995.
[21] Y. Papaphilippou and F. Zimmermann, Weak-strong beam-beam simulations for the large hadron collider, Phys. Rev.Accel. Beams 2, 104001 (1999).
[22] M. Fitterer, R. De Maria, S. Fartoukh, and M. Giovannozzi,Beam dynamics requirements for the powering scheme ofthe HL-LHC triplet, in Proceedings, 6th InternationalParticle Accelerator Conference (IPAC 2015): Richmond,Virginia, USA, May 3-8, 2015 (JACoW, Geneva, 2015),p. TUPTY035.
[23] B. V. Chirikov, Resonance processes in magnetic traps,Sov. J. At. Energy 6, 464 (1960).
[24] B. V. Chirikov, Research concerning the theory ofnon-linear resonance and stochasticity, Tech. ReportNo. CM-P00100691, 1971.
[25] B. V. Chirikov, A universal instability of many-dimensionaloscillator systems, Phys. Rep. 52, 263 (1979).
[26] B. V. Chirikov, M. Lieberman, D. Shepelyansky, and F.Vivaldi, A theory of modulational diffusion, Physica D(Amsterdam) 14, 289 (1985).
[27] The Electron-Ion Collider (EIC), https://www.bnl.gov/eic/(2020), accessed: 2020-05-26.
[28] The Future Circular Collider (FCC), https://fcc.web.cern.ch/ (2020), accessed: 2020-05-26.
[29] T. Suzuki, Synchro-betatron resonances, Part. Accel. 27,157 (1989).
[30] H. Roder, Amplitude, phase, and frequency modulation,Proceedings of the Institute of Radio Engineers 19, 2145(1931).
[31] A. W. Chao and M. Month, Particle trapping duringpassage through a high-order nonlinear resonance, Nucl.Instrum. Methods 121, 129 (1974).
[32] T. J. Satogata, Nonlinear resonance islands and modula-tional effects in a proton synchrotron, Ph.D. thesis,Northwestern U. (1993).
[33] T. Satogata and S. Peggs, Is beta modulation more or lesspotent than tune modulation?, in Conference Record of the1991 IEEE Particle Accelerator Conference: AcceleratorScience and Technology, May 6-9, 1991, San Francisco,California (IEEE, New York, 1991), p. 476.
[34] S. Peggs and T. Satogata, Introduction to AcceleratorDynamics (Cambridge University Press, Cambridge,England, 2017).
[35] S. Y. Lee et al., Experimental Determination of a NonlinearHamiltonian in a Synchrotron, Phys. Rev. Lett. 67, 3768(1991).
[36] E. Metral et al., Update of the HL-LHC operationalscenarios for proton operation, CERN Technical Report,2018.
[37] S. Fartoukh, Achromatic telescopic squeezing scheme andapplication to the LHC and its luminosity upgrade, Phys.Rev. Accel. Beams 16, 111002 (2013).
[38] MAD-X, http://mad.web.cern.ch/mad/ (2019), accessed:2019-12-13.
[39] S. Fartoukh, A. Valishev, Y. Papaphilippou, and D.Shatilov, Compensation of the long-range beam-beaminteractions as a path towards new configurations for thehigh luminosity LHC, Phys. Rev. Accel. Beams 18,121001 (2015).
[40] SixTrack, http://sixtrack.web.cern.ch/SixTrack/ (2019), ac-cessed: 2019-11-26.
[41] R. D. Maria, J. Andersson, V. K. B. Olsen, L. Field, M.Giovannozzi, P. D. Hermes, N. Høimyr, S. Kostoglou, G.Iadarola, E. Mcintosh, A. Mereghetti, J. W. Molson, D.Pellegrini, T. Persson, M. Schwinzerl, E. H. Maclean, K.Sjobak, I. Zacharov, and S. Singh, SixTrack project: Status,runtime environment, and new developments, in Proceed-ings, 13th International Computational Accelerator Phys-ics Conference, ICAP2018: Key West, FL, USA, 20-24October 2018 (2019) p. TUPAF02, http://accelconf.web.cern.ch/icap2018/papers/tupaf02.pdf.
[42] N. Karastathis, R. De Maria, S. Fartoukh, Y. Papaphilippou,and D. Pellegrini, Refining the HL-LHC operational settingswith inputs from dynamic aperture simulations: A progressreport, J. Phys. Conf. Ser. 1067, 022005 (2018).
[43] E. Coulinge, J.-P. Burnet, and D. Dujic, High-current low-voltage power supplies for superconducting magnets, in2017 International Symposium on Power Electronics (Ee)(IEEE, New York, 2017), pp. 1–6.
[44] D. Gamba, G. Arduini, M. Cerqueira Bastos, J. M. C. DePortugal Martinez Vazquez, R. De Maria, M. Giovannozzi,M. Martino, and R. T. Garcia, Beam dynamics require-ments for HL–LHC electrical circuits, CERN TechnicalReport No. CERN-ACC-2017-0101, 2017.
S. KOSTOGLOU et al. PHYS. REV. ACCEL. BEAMS 23, 121001 (2020)
121001-16

[45] R. De Maria, T. Kroyer, and V. Shiltsev, Field fluctuationand beam screen vibration measurements in the LHCmagnets, CERN Technical Report Nos. LHC-PROJECT-Report-1041, CERN-LHC-PROJECT-Report-1041, 2007;revised version submitted on 2007-09-24 16∶35:23.
[46] D. Gamba, G. Arduini, M. C. Bastos, J. M. C. De PortugalMartinez Vazquez, R. De Maria, M. Giovannozzi, M.Martino, and R. T. Garcia, Update of beam dynamicsrequirements for HL-LHC electrical circuits, CERN Tech-nical Report No. CERN-ACC-2019-0030, 2019.
[47] Y. Papaphilippou, Detecting chaos in particle acceleratorsthrough the frequency map analysis method Chaos: AnInterdisciplinary, J. Nonlinear Sci. 24, 024412 (2014).
[48] J. Laskar, Introduction to frequency map analysis, inHamiltonian Systems with Three or More Degrees ofFreedom (Springer, New York, 1999), pp. 134–150.
[49] J. Laskar, Frequency map analysis and particle acceler-ators, in Proceedings of the 2003 Particle AcceleratorConference, Vol. 1 (IEEE, New York, 2003), pp. 378–382.
[50] J. Laskar, Application of frequency map analysis, in TheChaotic Universe: Proceedings of the Second ICRA Net-work Workshop, Rome, Pescara, Italy, 1-5 February 1999(World Scientific, Singapore, 2000), Vol. 10, p. 115.
[51] S.Kostoglou,N.Karastathis,Y. Papaphilippou,D. Pellegrini,and P. Zisopoulos, Development of computational toolsfor noise studies in the LHC, in Conf. Proc., IPAC-2017-THPAB044 (2017), p. THPAB044, https://cds.cern.ch/record/2289645/files/thpab044.pdf.
[52] J. Laskar, C. Froeschle, and A. Celletti, The measure ofchaos by the numerical analysis of the fundamentalfrequencies. application to the standard mapping, PhysicaD: Nonlinear Phenomena 56, 253 (1992).
[53] P. Zisopoulos, Y. Papaphilippou, and J. Laskar, Refinedbetatron tune measurements by mixing beam position data,Phys. Rev. Accel. Beams 22, 071002 (2019).
[54] T. Chen, A. Gerasimov, B. Cole, D. Finley, G. Goderre,M. Harrison, R. Johnson, I. Kourbanis, C. Manz, N.Merminga, L. Michelotti, S. Peggs, F. Pilat, S. Pruss, C.Saltmarsh, S. Saritepe, T. Satogata, R. Talman, C. G.Trahern, and G. Tsironis, Measurements of a HamiltonianSystem and Their Description by a Diffusive Model, Phys.Rev. Lett. 68, 33 (1992).
[55] S. Papadopoulou, F. Antoniou, T. Argyropoulos, M.Fitterer, M. Hostettler, and Y. Papaphilippou, Modellingand measurements of bunch profiles at the LHC, J. Phys.Conf. Ser. 874, 012008 (2017).
[56] S. Papadopoulou, F. Antoniou, T. Argyropoulos, M.Hostettler, Y. Papaphilippou, and G. Trad, Impact ofnon-Gaussian beam profiles in the performance of hadroncolliders, Phys. Rev. Accel. Beams 23, 101004 (2020).
[57] A. Romano, O. Boine-Frankenheim, X. Buffat, G. Iadarola,and G. Rumolo, Electron cloud buildup driving sponta-neous vertical instabilities of stored beams in the LargeHadron Collider, Phys. Rev. Accel. Beams 21, 061002(2018).
TUNE MODULATION EFFECTS FOR COLLIDING … PHYS. REV. ACCEL. BEAMS 23, 121001 (2020)
121001-17