physical properties and lung deposition of particles
TRANSCRIPT

Physical properties and lung deposition of particlesemitted from five major indoor sources
Tuan V. Vu1& Jakub Ondracek2
& Vladimir Zdímal2 & Jaroslav Schwarz2 &
Juana Maria Delgado-Saborit1 & Roy M. Harrison1,3
Received: 8 March 2016 /Accepted: 25 July 2016 /Published online: 25 August 2016# The Author(s) 2016. This article is published with open access at Springerlink.com
Abstract The physical properties of indoor particles weremeasured with an Scanning Mobility Particle Sizer (SMPS)system (14.6–850 nm), an Aerodynamic Particle Sizer (APS,0.54–18 μm) and an Hygroscopic Tandem DifferentialMobility Analyzer (H-TDMA) in an apartment located in anurban background site in Prague (Czech Republic) from 15August to 8 September, 2014. The total particle maximumnumber concentration was 9.38 × 10⁴, 1.46 × 10⁵, 2.89 × 104,2.25 × 105 and 1.57 × 10⁶ particles cm−3 for particles releasedfrom vacuum cleaning, soap/W5 cleaning spray, smoking,incense burning and cooking (frying) activities, respectively.Particles emitted from cleaning activities showed unimodalnumber size distributions, with the majority of particles(>98.2 %) in the ultrafine size range (Dp <100 nm) and modesat a diameter of 19.8 nm for vacuum cleaning and 30.6 nm forsoap/W5 cleaning. Smoking and incense burning
predominantly generated particles in the accumulation modewith a count median diameter around 90–150 nm whilecooking emissions showed a bimodal structure with a mainmode at 47.8 nm. Particles from vacuum cleaning, incenseburning, smoking and cooking emissions were found to beBnearly hydrophobic^ with an average growth factor (Gf)around 1.01–1.10, while particles emitted from desk cleaningusing organic compounds were found to be Bless-hygroscopic^ (Gf ∼1.12–1.16). Based on an adjusted MPPDmodel with a consideration of the hygroscopic properties ofparticles, the total lung deposition fractions of these particlesby number when they penetrate into the human lung were0.73 ± 0.02, 0.62 ± 0.03, 0.37 ± 0.03, 0.32 ± 0.03 and 0.49 ±0.02 for vacuum cleaning, desk cleaning, smoking, incenseburning and cooking, respectively.
Keywords Indoor sources . Particle size . Hygroscopicgrowth . Lung deposition
Introduction
People in developed countries spend the majority of their time(approximately 90 %) in indoor environments (Delgado-Saborit et al. 2011), and as consequence they may be exposedto a range of pollutants of an indoor origin, particularly ultra-fine particles whichmay cause cardiovascular, respiratory, andneurological hazards to human health (Diffey 2011;Donaldson et al. 1998). Morawska et al. (2013) reported that19–76 % of the integrated daily residential exposure to ultra-fine particles originated from indoor-generated particles.
In recent years, many studies have been performed to char-acterize a range of indoor-generated particles from variousmicroenvironments such as home, office, school or workplace. For example, He et al. (2004) measured the contribution
Highlights• Particle size distribution and effective density from five major indoorsources
• Hygroscopic properties of indoor particles in the regions of the lung• Regional lung deposition fraction of indoor particles using a modifiedMDDP model
• Comparison of regional lung dose of particles emitted from differentindoor sources
* Roy M. [email protected]
1 Division of Environmental Health & Risk Management, School ofGeography, Earth & Environmental Sciences, University ofBirmingham, Edgbaston, Birmingham B15 2TT, UK
2 Institute of Chemical Process Fundamentals of the ASCR (ICPF),Prague 165 02, Czech Republic
3 Department of Environmental Sciences/Center of Excellence inEnvironmental Studies, King Abdulaziz University, PO Box 80203,Jeddah 21589, Saudi Arabia
Air Qual Atmos Health (2017) 10:1–14DOI 10.1007/s11869-016-0424-1

from 21 different types of indoor activities to particle numberand mass concentration in 15 residential houses. Their studyfound that the indoor particle number concentrations showedan increase by 1.5 to over 27 times during the indoor activities,while the PM2.5 concentration was also estimated to increaseduring smoking, grilling and frying activities from 3 to 90times above the background level. Similarly, Bhangar et al.(2011) investigated ultrafine particle concentration in sevenresidences in northern California and indicated that cookingwas the most important indoor activity contributing to theindoor ultrafine particle level.
Different types of indoor activities release particles with dif-ferent physical properties including their size distribution. Themajority of particles generated from indoor combustion sourcesincluding cooking, wood burning, candle burning, fireplace orkerosene heating were found in the submicron size range(Hussein et al. 2006). On the other hand, particles originatingfrom resuspension from indoor surfaces due to building occu-pant movement are predominantly distributed in the coarsemode, with a diameter lager than 1 μm (Thatcher and Layton1995). Characterization of the particle size distribution of in-door sources is not only useful in determining the regional lungdeposition of particles, but also in source apportionment ofindoor aerosols based on receptor modelling methods (Vuet al. 2015b). Ogulei et al. (2006) ran a positive matrix factor-ization (PMF) analysis on indoor particle size distributions in anoccupied townhouse in Reston (Washington, DC, USA) toidentify the contribution of indoor sources to indoor aerosols.
Although the number of studies focusing on indoor aero-sols has increased in recent years, the physical characteriza-tion database of indoor sources, particularly the hygro
scopicity of indoor particles which is known to be an impor-tant determinant of lung deposition fraction of particles in thehuman respiratory tract, is still limited (Vu et al. 2015a). Theaim of this study was to investigate physical properties includ-ing size distribution, effective density and hygroscopicity ofparticles originating from five typical indoor sources. The re-gional lung deposition fraction of indoor particles was calcu-lated based on a modified Multiple-Path Particle DosimetryModel (MPPD). Finally, the minute regional lung dose ofindoor-generated particles was estimated and compared.
Materials and methods
Site description and data measurement
The experimental campaign was conducted from 15August to8 September, 2014 in an apartment located in the suburbanbackground of Prague, Czech Republic. The apartment wasunoccupied during the sampling period. It is located on theground floor of a two-floor building and has a living room, asmall bathroom next to the kitchen and two bedrooms, one ofthem containing the instruments. The apartment (as shown inFig. 1) and sampling site have been described in detail byHussein et al. (2006).
The particle number size distribution (14.6–850 nm) wasmeasured by a Scanning Mobility Particle Sizer system(SMPS 3696, TSI Inc., USA) comprising a TSI 3080 electro-static classifier, a TSI 3081 differential mobility analyzer (longDMA) and a TSI 3775 condensation particle counter (CPC).Larger particles and their number size distribution (0.54–
Fig. 1 Plan view of the apartment
2 Air Qual Atmos Health (2017) 10:1–14

18 μm) were measured by an Aerodynamic Particle Sizer (APS3321, TSI Inc., USA). The SMPS system was operated at lowaerosol flow rate of 0.3 L min−1 and the APS flow rate was5 L min−1, with 5 min time resolution. A Hygroscopic TandemDifferential Mobility Analyzer (HTDMA) developed by theLaboratory of Aerosol Chemistry and Physics, Institute ofChemical Process Fundamentals of the ASCR (ICPF,Czech Republic) was installed to measure the hygroscopicgrowth factors at 90 % relative humidity for particles with threeselected initial dry sizes at diameters of 50, 100 and 200 nm.
Indoor particles were generated in a closed kitchen, whosedimensions are shown in Fig. 1. The cleaning, smoking, incenseburning and cooking activities were conducted during a period ofapproximately 10, 5, 60 and 20 min, respectively. Smoking ex-periments were conducted by two persons who smokedwith twocigarettes inside the kitchen. Cooking particleswere generated byfrying sausages with sunflower oil, and toasting bread. The in-door concentration was at a background level before generatingindoor sources. The sampling inlet was put in the breathing zone.All SMPS/APS datasets were corrected for particle loss insidethe inlet tube before data analysis.
Data handling
Merging SMPS/APS data
Two types of data sets (aerodynamic and mobility) collectedfrom APS and SMPS instruments were merged into one par-ticle size spectrum matrix (mobility diameter from 0.015 to10 μm) using an enhanced algorithm which was developed inCRAN R by Beddows et al. (2010). The effective density ofparticles was estimated based on the best fit between twoinstrument (APS/SMPS) datasets for number, surface areaand volume spectra. The final diameter type obtained by thisenhanced merging algorithm was mobility diameter. This typeof diameter may be converted to aerodynamic diameter usingthe following equation:
Da ¼ x:Dm:
ffiffiffiffiffiffiffiffiffiffiffiffiffiffiC Dmð ÞC Dað Þ
sð1Þ
x ¼ffiffiffiffiffiρeρo
rð2Þ
where, Da, Dm are aerodynamic and mobility diameters (nm),respectively, C is the Cunningham slip correction factor and xis known as the free parameter that is determined by giving thebest fit between APS/SMPS spectra. ρ0 is unit density and ρeis the estimated transition-regime effective density (g cm−3).PM mass concentrations were estimated from the merged sizedistribution and effective density. In this study, we assumeparticles are spherical; therefore, their mobility diameters are
equal to their equivalent volume diameter. Mobility diameterwas used as the input diameter in the MPPD model.
Estimation of hygroscopic growth factors in regionsof the lung
To analyse the growth factors from the HTDMA, a TDMAinvconversion approach provided by the Laboratory ofAtmospheric Chemistry, Paul Scherrer Institute (PSI,Switzerland) was applied (Gysel et al. 2009). ThisTDMAinv toolkit was run on the Igor Wave Metric softwareversion 6.1. This algorithm retrieved the actual growth factorprobability density function (Gf-PDF) as a piecewise linearfunction from the measurement distribution function of theHTDMA. The Gf-PDF is defined as the growth factor proba-bility density function, c(g,D), for particles with dry diameterD =D0 to present a growth factor (Gf) = g, and the total prob-ability of the presented Gf is unity: ∫0∞c(g,D0)dg = 1 (Gyselet al. 2009). In this study, the HTDMA measured the meangrowth factor at 90 % RH: Gf mean = ∫0∞gc(g,D0)dg.
To calculate the growth factors at 99.5 % RH, which isassumed for the RH in the respiratory tract, from the observedgrowth factor at 90% RH from our TDMAmeasurements, weapplied an approach provided byRissler et al. (2010) using thefollowing calculation:
Gf−99:5%¼3
ffiffiffiffiffiffiffiffiffiffiffiffiffiffiffiffiffiffiffiffiffiffiffiffiffiffiffiffiffiffiffiffiffiffiffiffiffiffiffiffiffiffiffiffiffiffiffiffiffiffiffiffiffiffiffiffiffiffiffiffiffiffiffiffiffiffiffiffiffiffiffiffiffiffiffiffiffiffiffiffiffiffiffiffiffiffiffi1þ 99:5
90G3
f −90%−1� � Ck at 90% RH−0:90ð Þ
Ck at 99:5% RH−0:95ð Þ
s
ð3Þ
where Ck is the Kelvin curvature correction factor:
Ck at a% RH ¼ exp4MWσs
RT:ρwDp−at a% RH
� �ð4Þ
MW (18 g mol-1) and ρw (1 g cm−3) are the molecularweight and density of water; σs is the surface tension of thesolution (assuming a surface tension of 0.072 J m−2); R(8.314 J mol−1) and T (298 K) are the ideal gas constant andtemperature, respectively, andDp is the particle diameter (nm).
In this study, the HTMA only measured particles at threeselected dry sizes of 50, 100 and 200 nm at 90 % RH. Forparticles of below 50 nm and over 200 nm, this study assumedthat the soluble volume fraction of particles at a diameter of50 nm is also descriptive of those smaller than 50 nm whilethose of particles with a diameter of 200 nm also describe thoselarger than 200 nm. In our measurements, particle size distribu-tions were collected using SMPS/APS instruments without adryer. It is therefore necessary to calculate the effects of ambienthumidity on the size distribution measured by the SMPS/APSbefore using the data for the lung dose calculation. The drydiameter of a particle can be estimated by the ratio of particlesize measured by SMPS and the growth factor of that dry
Air Qual Atmos Health (2017) 10:1–14 3
particle in the ambient relative humidity (RH). The RH for theindoor environment during vacuum cleaning, soap cleaning,smoking, incense burning and cooking was 47.9, 57.2, 47.3,66.21 and 72.8 %, respectively. According to our calculation,the effect of ambient relative humidity on the measured sizedistributions is not significant since the growth factors of parti-cles were approximately unity under these low RH conditions.
When a particle penetrates into the lung, its growth not onlydepends on particle size but also upon its residence time. Toaddress the particle growth dependence upon time, we used anapproach provided by Ferron (1977):
F tð Þ ¼ Dp tð Þ−Dp 0ð ÞDp eð Þ−Dp 0ð Þ ¼
Dp 0ð Þ � exp − 10t0:55
Dp 0ð Þ� �0:6
−1� �
Dp eð Þ−Dp 0ð Þ ð5Þ
where F(t) is fraction of particles at equilibrium size, Dp(t) isparticle diameter at time t (s); Dp(0) is the initial dry particlediameter (μm), Dp(e) is equilibrium particle diameter (μm)and t in the residence time in the lung(s).
Therefore, the particle growth factor in each region will becalculated by:
Averaged Gf in each lung region ¼
Z t2
t1
Dp tð ÞDp 0ð Þ dtt2−t1
ð6Þ
where t1 and t2 are the time when the particle enters and leavesthe region of the lung.
Modelling particle deposition in the human respiratorysystem
Many mathematical models have been developed to estimatethe total and regional lung deposition of particles in recentdecades; for example the ICRP model (InternationalCommission on Radiological Protection), the NCRP model
(Nat iona l Counci l on Radia t ion Protec t ion andMeasurement), the IDEAL model (Inhalation, Depositionand Exhalation of Aerosols in/from the Lung) or the MPPDmodel (Multiple-Path Particle Dosimetry) (Asgharian et al.2001; ICRP and Protection 1994; Koblinger and Hofmann1990; National Council on Radiation Protection andMeasurements 1997). This study utilized the MPPD modelto calculate the total and regional lung deposition of particlesemitted from each source.
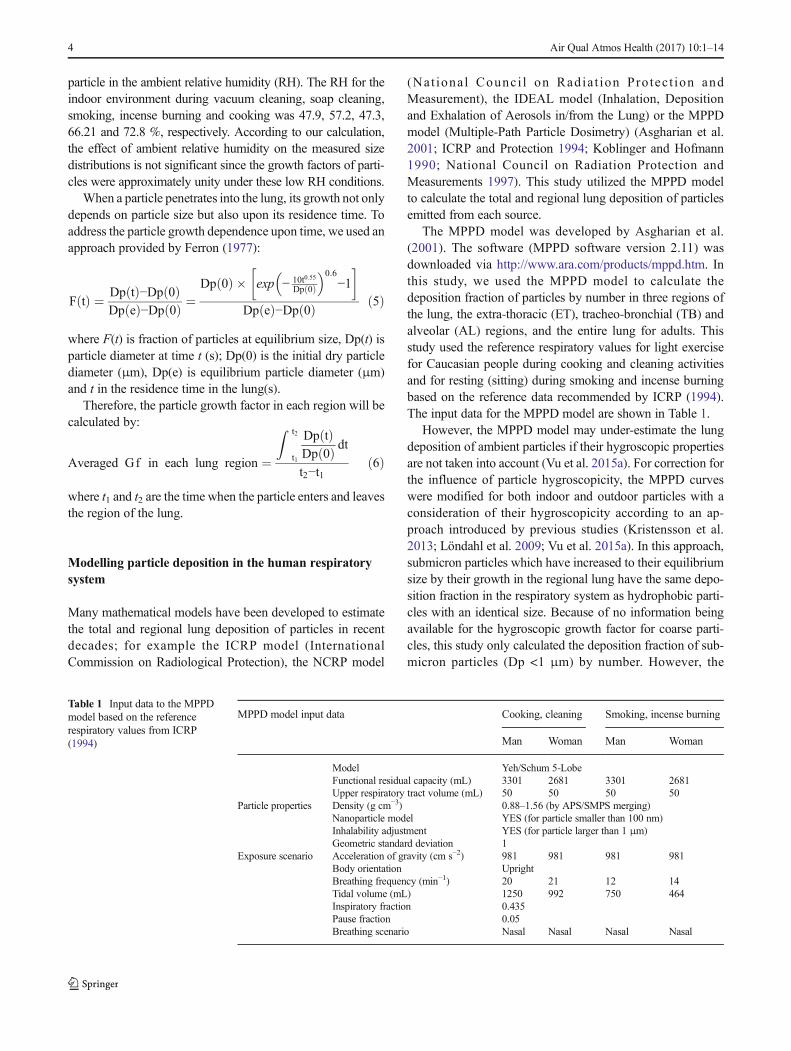
The MPPD model was developed by Asgharian et al.(2001). The software (MPPD software version 2.11) wasdownloaded via http://www.ara.com/products/mppd.htm. Inthis study, we used the MPPD model to calculate thedeposition fraction of particles by number in three regions ofthe lung, the extra-thoracic (ET), tracheo-bronchial (TB) andalveolar (AL) regions, and the entire lung for adults. Thisstudy used the reference respiratory values for light exercisefor Caucasian people during cooking and cleaning activitiesand for resting (sitting) during smoking and incense burningbased on the reference data recommended by ICRP (1994).The input data for the MPPD model are shown in Table 1.
However, the MPPD model may under-estimate the lungdeposition of ambient particles if their hygroscopic propertiesare not taken into account (Vu et al. 2015a). For correction forthe influence of particle hygroscopicity, the MPPD curveswere modified for both indoor and outdoor particles with aconsideration of their hygroscopicity according to an ap-proach introduced by previous studies (Kristensson et al.2013; Löndahl et al. 2009; Vu et al. 2015a). In this approach,submicron particles which have increased to their equilibriumsize by their growth in the regional lung have the same depo-sition fraction in the respiratory system as hydrophobic parti-cles with an identical size. Because of no information beingavailable for the hygroscopic growth factor for coarse parti-cles, this study only calculated the deposition fraction of sub-micron particles (Dp <1 μm) by number. However, the
Table 1 Input data to the MPPDmodel based on the referencerespiratory values from ICRP(1994)
MPPD model input data Cooking, cleaning Smoking, incense burning
Man Woman Man Woman
Model Yeh/Schum 5-LobeFunctional residual capacity (mL) 3301 2681 3301 2681Upper respiratory tract volume (mL) 50 50 50 50
Particle properties Density (g cm−3) 0.88–1.56 (by APS/SMPS merging)Nanoparticle model YES (for particle smaller than 100 nm)Inhalability adjustment YES (for particle larger than 1 μm)Geometric standard deviation 1
Exposure scenario Acceleration of gravity (cm s−2) 981 981 981 981Body orientation UprightBreathing frequency (min−1) 20 21 12 14Tidal volume (mL) 1250 992 750 464Inspiratory fraction 0.435Pause fraction 0.05Breathing scenario Nasal Nasal Nasal Nasal
4 Air Qual Atmos Health (2017) 10:1–14

deposition fraction of submicron particles by number is notsignificantly different to that of total particles since the sub-micron particles accounted for more than 99 % of total parti-cles by number.
Results and discussion
Particle size distributions
Outdoor/indoor background levels
The total number concentration for outdoor and indoor levels(with no indoor sources) was 4.2 ± 2.1 × 10³ and 3.3± 1.3 × 10³ particles cm−3, respectively. As shown in Fig. 2,the particle number size distribution of both outdoor and in-door particles appears to be the sum of log-normal size modes.The number mode for outdoor and indoor particle size distri-butions was 22.9 and 28.4 nm, respectively. The majority ofparticles by number (84.0 and 80.2 % of total outdoor andindoor particles, respectively) was found in the ultrafine sizerange (Dp <100 nm).
Vacuum cleaning
The peak particle number concentration was 9.4 × 10⁴ parti-cles cm−3, which decreased to 7.08 × 10⁴ particles cm−3 by the15th minute after cleaning stopped. The particle number sizedistribution shows a unimodal distribution with the mode at19.8 nm. This mode increased to 22.9 and 26.5 nm at 15 and30 min after the activity stopped. More than 98 % of totalparticles by number was found in the ultrafine particle sizerange (Dp <100 nm) during vacuum cleaning. This high num-ber of ultrafine particles emitted from the vacuum cleaner isconsistent with previous studies (Géhin et al. 2008; Knibbset al. 2011; Wu et al. 2011). Knibbs et al. (2011) investigatedparticle emissions from 21 vacuum cleaners in a flow tunneland found that the median emission rate of ultrafine particleswas 9.92 × 10⁹ particles cm−3 with a median value of countmedian diameter (CMD) of 25.5 nm.
In term of mass concentration, vacuum cleaning also gen-erated a large fraction of coarse particles. The peak PM1.0,PM2.5 and PM10 mass concentrations were 1.5, 22.7 and75.4 μg m−3. Szymczak et al. (2007) suggested that particlesare in part generated by mechanical abrasion of the graphitebrushes and copper commutator. However, the major sourceof ultrafine particles may be due to spark discharging thatoccurs at voltages above 100 V between two carbon elec-trodes within the vacuum cleaner motor (Helsper et al. 1993;Szymczak et al. 2007). Knibbs et al. (2011) reported lowerultrafine particle emissions with two battery-driven vacuumcleaners at lower voltages (14 and 22 V).
There are few studies on the chemical properties andmorphology of particles emitted from vacuum cleaners.Szymczak et al. (2007) used a MOUDI to collect particles inthe size range of 0.057–18.0 μm and suggested that ultrafineparticles comprise mainly of copper which may be generatedfrom abrasion of the copper commutator inside the motor.Lioy et al. (1999) reported that particles larger than 0.01 μmin diameter mainly consist of chemical binders, copper andcarbon (elemental and organic) which were induced by rub-bing and arcing between carbon rods and the copper commu-tator. In this study, the effective density of vacuum cleaner-generated particles obtained by the APS/SMPS merging algo-rithm was 1.16 g cm−3 which was much lower than the mate-rial density of carbon (∼2 g cm−3) and copper (8 g cm−3). Thisfinding suggests that particles released from the vacuumcleaner motor were possibly carbon internal void aggregates(DeCarlo et al. 2004; Helsper et al. 1993; Lioy et al. 1999)which have a lower effective density.
Kitchen cleaning by soap/W5 spray cleaner
As seen in Fig. 2, kitchen desk cleaning using organic com-pounds (brand name, W5 cleaner) generated predominantlyultrafine particles with a maximum concentration of1.25 × 105 particle cm−3 and a peak number mode of30.6 nm. As with the vacuum cleaning, the CMD increasedand particle number concentration decreased rapidly due tocoagulation and deposition processes after the cleaning activ-ity was finished.
Cleaning using chemical cleaners also generated both ul-trafine and coarse particles. Average PM1.0, PM2.5 and PM10
mass concentration during cleaning activity were 2.5, 10.4and 22.0 μg m−3, respectively. On the other hand,nano/ultrafine particles were probably produced by the oxida-tion and condensation of volatile organic compounds (VOCs)released from the cleaning agent during the cleaning activity(Nazaroff andWeschler 2004; Rohr 2013; Singer et al. 2006a;Zhu et al. 2001). Singer et al. (2006b) reported that a largeamount of VOCs were found using pine-oil cleaner. Theyreported a concentration measured over 1 h of 10–1300 μg m−3 for individual terpenoids, including α-terp inene (90–120 μg m−3) , d- l imonene (1000–1100 μg m−3), terpinolene (900–1300 μg m−3) and α-terpineol (260–700 μg m−3). In addition, Sarwar et al.(2004) found that terpenes from cleaning products can reactwith ozone, resulting in secondary organic aerosol productionin an indoor environment.
This study used W5 orange cleaner, which containssome surface active components (not specified in the de-tail from the product’s label), soap and limonene. In gen-eral, limonene has been identified to play an importantrole in the formation of indoor nanoparticles (Langeret al. 2008; Wainman et al. 2000; Wang et al. 2007b;
Air Qual Atmos Health (2017) 10:1–14 5

Waring et al. 2011). Langer et al. (2008) showed that thenucleation and growth of particles from the reaction of O3
and limonene could occur even at low concentration ofreactants. The effective density obtained by the APS/SMPS merging process was 0.88 g cm−3, indicating thatthe majority of particles generated by use of cleaningproducts were predominantly organic.
Tobacco smoking
The particle number size distribution from cigarette smokingshowed a unimodal structure with a mode at 90 nm and peaknumber concentration of 2.89 × 10⁴ particle cm−3 (Note thattwo cigarettes were simultaneously smoked by regularsmokers in this experiment). During the ageing process, the
Fig. 2 Particle number size distribution from indoors (without indoor sources) and outdoor environments and five major indoor sources
6 Air Qual Atmos Health (2017) 10:1–14

CMD increased to 120 nm, as shown in Fig. 2. These resultsare consistent with previous studies (Hussein et al. 2006; Wuet al. 2011). Wu et al. (2011) measured the submicron particlenumber size distribution emitted from five brands of cigarettesand found that the number mode ranged from 102.9 to116.7 nm with the maximum number concentration of1.38 × 106 particle cm−3. The number concentration of parti-cles is not only dependent on the emission rate of the source,but also the volume of the chamber or the indoor environmentwhere smoking takes place, and the ventilation.
Fine particles (Dp <2.5 μm) emitted from cigarettesmoking were found to make a dominant contribution to massconcentration with an averaged fraction of more than 82 % oftotal PM10 mass. Averaged PM1.0, PM2.5 and PM10 concen-trations were 3.2, 133.6 and 149.6 μg m−3, respectively. In areview of indoor particles, Wallace (1996) indicated that themost important indoor source of fine and coarse particles inthe USAwas tobacco smoking, with an estimated increase ofup to 45 μg m−3 in homes with smokers. The effective densityof cigarette smoke particles was 1.56 g cm−3 based on APS/SMPS merging results. This value was slightly lower than thematerial density of black carbon (∼2 g cm−3) and similar to theeffective density of humic acids and humic-like substances(1.54–1.77 g cm−3) from wood burning (Dinar et al. 2006).
Incense burning and cooking
Incense burning generated a majority of particles in the accu-mulation mode with a CMD around 110–150 nm. The totalnumber concentration was up to 2.25 × 10⁵ particle cm−3. Inthe first scan of incense burning, it showed a distinct mode at30.5 nm, suggesting that some nanoparticles were formed inthe first several minutes of burning.
The number size distribution of particles released duringincense burning was in agreement with previous studies. Wuet al. (2011) measured particle number size distributions fromfive types of incense stick and found that four of them had aCMD ranging from 124.1 to 148.9 nm and the other had aCMDof 75.5 nm. A similar study conducted by Ji et al. (2010)reported that the peak number mode of incense smoke was136 nm which was found to have a larger size distribution incomparison to other combustion processes such as diesel,wood or biomass burning. Unfortunately, the APS samplerhad a problem with its inlet during measurement of particlesize for incense burning and cooking; hence, this study couldnot measure the coarse size for incense burning and cookingemissions. In this study, we adopted an effective density of 1.1and 1.0 g cm−3 to convert the aerodynamic to mobility diam-eter for incense burning and cooking particles respectivelybased upon Buonanno et al. (2009) and Ji et al. (2010).
Cooking emissions showed a tri-modal distribution with apeak mode at 47.8 nm. After cooking, the peak mode quicklyincreased to 135.8 nm. The reason is probably related to the
ventilation (opened door when people leave kitchen roomafter cooking activity). During the cooking, a large numberof particles were generated with a peak number concentrationof 1.57 × 10⁶ particle cm−3. In a review of cooking emission,Abdullahi et al. (2013) reported a large fraction of ultrafineparticles released during cooking activity with the peak num-ber mode around 20–100 nm.
Hygroscopic growth factor of particles
Hygroscopic growth factor of outdoor and indoor particleswhen no indoor source was present
The hygroscopic growth factors (Gf) of outdoor and indoorparticles at an initial dry diameter of 50, 100 and 200 nm weremeasured during periods when no indoor source was present,from 15 to 21 August, 2014. The growth factor probabilitydensity function (Gf-PDF) of each particle size from the out-door and indoor environments is shown in Fig. 3. For theparticle size of 50 and 100 nm, two fractions of nearly hydro-phobic (Gf ∼1.01–1.11) and less-hygroscopic particles (Gf
∼1.11–1.33) were found dominant in both indoor and outdoorenvironments. For the particle size of 200 nm, the main frac-tions of particles were less-hygroscopic and more-hygroscopic particles (Gf ∼1.11–1.85). Mean growth factorsfor outdoor particles were 1.15 ± 0.07, 1.17 ± 0.09 and 1.23 ±0.10 for the particle sizes of 50, 100 and 200 nm, respectively.The mean growth factors for indoor particles were slightlyhigher than those of outdoor particles with values of 1.16 ±0.07 and 1.18 ± 0.09 for particles with a diameter of 50 and100 nm, respectively. The loss of semi-volatile organic con-stituents due to volatilization or uptake on the indoor wallsurface during the penetration from the outdoor to indoor en-vironment could explain the small decrease of the fraction ofnearly hydrophobic particles in the indoor environment whenno indoor source was present. On the other hand, the meangrowth factor for indoor particles with a diameter of 200 nmwas 1.22 ± 0.07 which was practically the same as the growthfactor for outdoor particles (1.23 ± 0.10).
Hygroscopic growth factor of particles generated from indoorsources
Figure 4 shows the hygroscopic growth factor of particlesemitted from five indoor sources at three particle sizes of 50,100 and 200 nm. Particles generated from vacuum cleaningwere found to be Bnearly hydrophobic^ with an averagegrowth factor (Gf) around 0.98–1.10 for particle sizes of 50and 100 nm. This finding is in agreement with the discussedhypothesis that particles emitted from the vacuum cleanermainly comprise carbon and copper as discussed above. Thegrowth factor of particles of 200 nm was 1.16 which is higher
Air Qual Atmos Health (2017) 10:1–14 7

than those for smaller particles due to the mix of particlesgenerated from the vacuum cleaner motor and background.
Particles emitted from Soap/W5 cleaner were found to beBless-hygroscopic^ (Gf ∼1.12–1.15 for particles at 50 and100 nm). This finding is consistent with the above suggestionthat the ultrafine particles generated by cleaning activitiesusing W5 cleaner predominantly consist of organic com-pounds such as the products of oxidation of limonene.Virkkula et al. (1999) conducted a measurement of hygro-scopic properties of aerosol formed by oxidation of limonene,α-pinene andβ-pinene and found that the hygroscopic growthfactor was approximately 1.10 at 84 % RH, consistent withour results. The hygroscopic growth factor of particles of200 nm was 1.22. This high growth factor could also be ex-plained by the mix of particles generated from cleaning activ-ities and background in the large size range, while the majorityof particles during this activity were found in the ultrafine sizerange.
The average hygroscopic growth factors of particlesemitted from cigarette smoking were approximately
1.01–1.04 for all sizes of 50, 100 and 200 nm. This hy-groscopic growth factor is found slightly higher than die-sel combustion (Gf ∼1.01), but lower than biomass burn-ing (Gf ∼1.04–1.10). This low hygroscopic growth factoris probably due to the chemical properties of particlesgenerated from combustion, which mainly comprise blackcarbon and organic compounds. Morawska et al. (2005)found a similar count median diameter for both inhaledand exhaled submicron particles, suggesting that thechange in particle size after its travel into the lung is notsignificant. However, the lack of growth of particlescannot be concluded with certainty due to differenttemperature and humidity regimes between the chamberand the lung. Li and Hopke (1993) found the hygroscopicgrowth factor of cigarette mainstream and sidestreamsmoke particles at 200 nm was approximately 1.40–1.42 at RH 99.5 % which was slightly higher than theestimated growth factor value in our study (Gf ∼1.3 forDp = 200 nm at 99.5 % humidity calculated from Gf
∼1.04 at 90 % measured by HTDMA).
Fig. 3 Hygroscopic growthfactor probability density function(Gf-PDF) for outdoor (left) andindoor (right) particles
Fig. 4 Hygroscopic growth factor of particles generated from different indoor sources
8 Air Qual Atmos Health (2017) 10:1–14

Similarly, particles emitted from incense burning werefound to be nearly hydrophobic with the hygroscopic growthfactors ranging from 1.01 to 1.05 for all particle sizes of 50,100 and 200 nm. A dominance of carbonaceous particlesreleased from incense burning can explain those lowhygroscopic growth factors. Wang et al. (2007a) measuredthe characteristics of air pollutants from incense burning intwo temples in Hong Kong and found that the organic andelemental carbon accounted for around 60 % of PM2.5 mass,while inorganic ion species only accounted for 12 % of PM2.5
mass. Li and Hopke (1993) predicted that the hygroscopicgrowth factor of particles at 99.5 % RH from the burning ofincense was around 1.45 and 1.7 for particle sizes of 100 and200 nm while the values in our estimation were much lower(Gf ∼1.16 and 1.31 for particles of 100 and 200 nm at 99.5 %RH). Li and Hopke (1993) indicated that 8 % errorswere found in their estimation of the hygroscopicgrowth ratio mainly due to the humidity uncertainty intheir HTDMA system. Furthermore, variations in parti-cle composition and influences of the local environmentmay account for differences when measuring thehygroscopic growth factor of combustion aerosols.
Particles generated from cooking activity were found to benearly hydrophobic (Gf ∼1.0–1.02 for all particle sizes of 50,100 and 200 nm). In our study, we performed the cookingexperiments by frying sausages with sunflower oil andtoasting bread. This result is consistent with Dua and Hopke(1996), who observed that there was no growth of particlesemitted from cooking oils and sweet Italian sausages.
Growth factors of particles in the lung
The mean growth factors for particles from outdoors, indoorswithout indoor sources, and five major indoor sources in theirmaximum growth at 99.5 % and different regions of the lungare shown in Fig. 5.
As discussed above, the hygroscopic properties of particlesarising from different indoor activities show different character-istics. Particles generated from soap/W5 cleaning products showamore hygroscopic tendency than particles from indoor combus-tion sources. Particles emitted from cooking activities show nosignificant growth in all sizes. When particles penetrate into therespiratory tract, the particles with diameter below 200 nm canquickly reach their equilibrium size in all lung regions. For
Fig. 5 Modelled hygroscopic growth factors at 99.5 % RH and in different regions of the lung
Air Qual Atmos Health (2017) 10:1–14 9

particles larger than 400 nm, growth factors in the ET region canbe more than 10 % lower than those in the AL region.
Effects of particles from indoor sources on lung doseof particles
MPPD models for different genders and activities
Based on the MPPD model, the deposition fraction curves ofhydrophobic particles for man and woman in light exerciseand resting are shown in Fig. 6. The total deposition fractionwas found to be slightly greater for men than women whenresting. Specifically, the deposition fraction of ultrafine parti-cles in the AL regions was found greater by up to 1.35 timeshigher for men compared with women. On the other hand,there was no significant difference between the lung deposi-tion fractions for men and women during light exercise.
Regional lung deposition of particles emitted from eachsource
Total and regional lung deposition fractions of outdoor andindoor particles (with and without indoor source particles) foradults (male and female) by number are shown in Fig. 7. Thefractional total lung deposition fraction for outdoor particlesand indoor particles (without indoor sources) was 0.49 ± 0.06and 0.45 ± 0.05. The slightly lower total deposition of parti-cles from the indoor environment compared to the outdoorenvironment was due to the shift of the outdoor particle num-ber size distribution to a larger size range when they penetratefrom outdoor to indoor environments. For both environments,a dominant fraction of particles deposited in the AL region(59.1 %), followed by the TB region (23.9 %). There was only15.7 % of particle number deposited in the ET region.
For the indoor sources, the lung deposition of particlesalters mainly due to the change of size distribution. Up to66.2 and 72.6 % of total particles deposit in the lung duringsoap/W5 cleaning and vacuum cleaning. This can be ex-plained by a majority of particles released during cleaningactivities being present as nanoparticles which easily penetrateinto the deeper region of the lung. In contrast, the lung depo-sition fraction of particles emitted from indoor combustionsources such as cooking, incense burning or smoking waslower because the main fraction of particle number was foundin the larger size range, particularly in the Aitken range forcooking and the accumulation mode for incense burning orcigarette smoke. The total lung deposition fraction was 0.49 ±0.02, 0.32 ± 0.03 and 0.37 ± 0.03 for indoor particles generat-ed during cooking, incense burning and smoking. For thoseparticles, a predominance of deposited particle number wasfound in the AL region (56.7–68.1 %), followed by the TBregion (19.5–27.0 %). Only 12.2–16.2 % of total depositedparticles by number was found in the ET region.
Discussion on the contribution of indoor sources to lung doseof aerosols
In order to determine and compare the effects of indoorsources upon human exposure, this study has compared thelung dose rate of particle number in the indoor environmentwith and without indoor activities. The lung dose of particlenumber in different regions of the lung (i) within a specificparticle size range was calculated based on the followingequation (Hussein et al. 2013):
Dosei ¼ VE � DFi � CN �Δt ð7Þ
where VE is the minute ventilation (m3 min−1); DFi is thedeposited fraction of particles in the different regions of the
Fig. 6 Deposition fraction curve from MPPD model for man and woman in resting and light exercise
10 Air Qual Atmos Health (2017) 10:1–14

human respiratory tract; CN is the total number concentration(particle cm−3);Δt is the exposure time period (minutes). Therespiratory tract deposition particle dose rate which is definedas the total particle number deposited in the respiratory systemduring a specific time period (in this study, Δt was set up to1 min), can be estimated from:
Minute dose ratei ¼ VE � DF i � CN ð8ÞVE was set at 7.75 × 10⁻³ for sitting and 2.29 ×
10−2 m3 min−1 for light exercise calculated by averaging therespective VE values for men and women at two exerciselevels (sitting and light exercise) (ICRP 1994).
Table 2 shows the minute dose rate of particles by numberfor adults in the outdoor and indoor environment (with andwithout indoor sources). During indoor activities, humans can
be exposed to a huge number of particles. For example, aperson when cooking could have an exposure of more than1.76 × 1010 particles every minute, which is a thousand timeshigher than the exposure value for outdoor particles (14.2 ×10⁶ particles). The 1-min dose of cooking particles by numberat the light exercise level is equivalent to 18.3 and 6.2 h ex-posure to outdoor particles at the resting and exercise respira-tion rate, respectively.
Similarly, the total minute lung dose of particles from vac-uum cleaning, soap/W5 cleaning, smoking and incense burn-ing could be up to 1.6 × 10⁹, 2.1 × 10⁹, 8.3 × 10⁷, 5.5 × 10⁸
particle min−1. Based on Eq. (7), it is clear that the minutelung dose rate of particles strongly depends upon VE, DFi
and CN. While the total DFi for particles from the differentindoor sources had a range of 0.32 (for incense burning) to
Fig. 7 Deposition fraction ofparticle number in regions of thelung for adults
Table 2 Lung deposition ofparticles from outdoor and indoorenvironments (without and withindoor sources) for adults(averaged deposition fraction forboth man and woman)
Deposition fraction VE(m3 min−1)
Dose (106 particles min−1)
AL TB ET Total AL TB TB Total
Outdoors 0.28 0.13 0.08 0.49 7.75E−03 9.0 4.0 2.6 16.1
Indoorsa 0.26 0.11 0.07 0.45 7.75E−03 6.6 2.9 1.9 11.4
Vacuumcleaning
0.46 0.16 0.11 0.73 2.29E−02 992.5 338.2 238.0 1568.3
Soap/W5cleaning
0.42 0.12 0.08 0.62 2.29E−02 1419.3 406.9 258.4 2084.5
Smoking 0.21 0.10 0.06 0.37 7.75E−03 47.1 21.5 13.7 82.9
Incense burning 0.19 0.08 0.05 0.32 7.75E−03 328.7 128.3 86.6 549.5
Cooking 0.33 0.10 0.06 0.49 2.29E−02 11,874.5 3413.3 2159.0 17,630.0
VE ventilation rate (minute ventilation)a Indoor environment with no indoor sources
Air Qual Atmos Health (2017) 10:1–14 11
0.73 (for vacuum cleaning) and the minute ventilation rate fora male adult can range by nearly 6.7 times from 7.5 × 10⁻³ to5 × 10−2 m3 min−1 (ICRP 1994), the concentration of particlesby number was found to show the largest variation from3.3 × 103 (for indoor environment with no source) to1.57 × 106 (for cooking emission) particle cm−3. Thissuggests that the concentration level is the main factorcontrolling the lung dose.
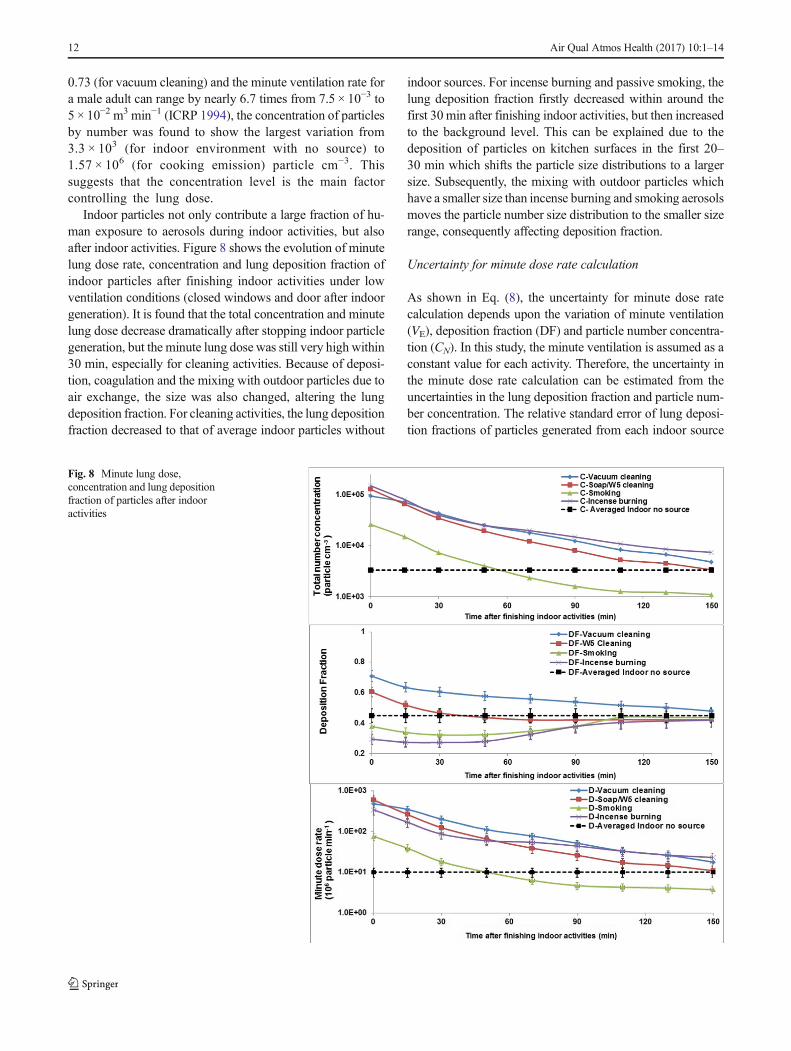
Indoor particles not only contribute a large fraction of hu-man exposure to aerosols during indoor activities, but alsoafter indoor activities. Figure 8 shows the evolution of minutelung dose rate, concentration and lung deposition fraction ofindoor particles after finishing indoor activities under lowventilation conditions (closed windows and door after indoorgeneration). It is found that the total concentration and minutelung dose decrease dramatically after stopping indoor particlegeneration, but the minute lung dose was still very high within30 min, especially for cleaning activities. Because of deposi-tion, coagulation and the mixing with outdoor particles due toair exchange, the size was also changed, altering the lungdeposition fraction. For cleaning activities, the lung depositionfraction decreased to that of average indoor particles without
indoor sources. For incense burning and passive smoking, thelung deposition fraction firstly decreased within around thefirst 30 min after finishing indoor activities, but then increasedto the background level. This can be explained due to thedeposition of particles on kitchen surfaces in the first 20–30 min which shifts the particle size distributions to a largersize. Subsequently, the mixing with outdoor particles whichhave a smaller size than incense burning and smoking aerosolsmoves the particle number size distribution to the smaller sizerange, consequently affecting deposition fraction.
Uncertainty for minute dose rate calculation
As shown in Eq. (8), the uncertainty for minute dose ratecalculation depends upon the variation of minute ventilation(VE), deposition fraction (DF) and particle number concentra-tion (CN). In this study, the minute ventilation is assumed as aconstant value for each activity. Therefore, the uncertainty inthe minute dose rate calculation can be estimated from theuncertainties in the lung deposition fraction and particle num-ber concentration. The relative standard error of lung deposi-tion fractions of particles generated from each indoor source
Fig. 8 Minute lung dose,concentration and lung depositionfraction of particles after indooractivities
12 Air Qual Atmos Health (2017) 10:1–14
mainly depends on the variation of input size distribution andsubject difference such as gender and lung structure. Since theMPPD model does not provide estimates of uncertainty, thisstudy could only estimate the errors caused by the variation ofparticle number size distribution and gender. The estimatedrelative standard deviations of total lung deposition fractioncalculated for vacuum cleaning, soap/W5 cleaning, smoking,incense burning and cooking particles were 2.7, 4.8, 8.1, 9.4and 4.1 %, respectively.
The uncertainty in particle number concentrations mea-sured for each source depends on the variation of particlenumber concentrations obtained by each SMPS measurementscan during the period of indoor source generation. Thecleaning, smoking, incense burning and cooking experimentswere performed during a period of approximately 10, 5, 60and 20min, respectively. Each SMPSmeasurement combinedtwo SMPS scans during 5 min. The relative standard deviationwas estimated by dividing the standard deviation by the aver-age number concentration of particles measured during eachactivity. The estimated relative standard deviation for particlenumber concentration measurement was 17.4, 9.4, 7.1, 22.3,and 14.4% for vacuum cleaning, soap/W5 cleaning, smoking,incense burning and cooking measurements. By combinationof the relative standard deviation for lung deposition fractionsand particle number concentrations, the uncertainty in theminute lung dose rate was estimated as 17.6, 10.6, 10.8,24.2 and 15.0 %, respectively. Clearly, the uncertainty in min-ute lung dose rate depends mainly upon the variation of par-ticle number concentration.
Conclusion
Particles released from indoor activities have many physicalproperties such as concentration, particle size, particle densityand hygroscopicity which are relevant to determining lungdeposition. Particles generated from vacuum cleaning andsoap/W5 cleaning are mainly distributed in the nano sizerange while those from incense burning and cigarette smokingwere found predominantly in the accumulation mode, andthose from cooking activity were found in the Aitken mode.Most of the particles released from indoor sources were nearlyhydrophobic, except the particles from soap/W5 cleaning thatwere less-hygroscopic. Particles from cleaning activitiesshowed very high total lung deposition fraction by number.This was up to 0.73 and 0.66 for vacuum cleaner and soap/W5cleaning particles, respectively.
Particles are predicted to deposit by number mainly in theAL region, followed by the TB region. This study found thatpeople could be exposed to high aerosol concentrations due toindoor sources. The minute lung dose of particles during in-door source episodes was found to be much greater than theindoor background level without an indoor source. The total
minute lung dose rate of particles from vacuum cleaning,soap/W5 cleaning, smoking and incense burning could beup to 1.6 × 10⁹, 2.2 × 10⁹, 7.2 × 10⁷ and 5.4 × 10⁸ particlesmin−1, respectively, while those for average outdoor and in-door background levels were 1.4 × 10⁷ and 1.0 × 10⁷ particlesmin−1. This suggests that indoor sources may make the maincontribution to the total lung dose of indoor particlesexpressed by number.
Acknowledgments This Research is supported by European Unionthrough the 7th Framework Programme HEXACOMM, FP7/2007-2013 under grant agreement No. 315760.
Open Access This article is distributed under the terms of the CreativeCommons At t r ibut ion 4 .0 In te rna t ional License (h t tp : / /creativecommons.org/licenses/by/4.0/), which permits unrestricted use,distribution, and reproduction in any medium, provided you give appro-priate credit to the original author(s) and the source, provide a link to theCreative Commons license, and indicate if changes were made.
References
Abdullahi KL, Delgado-Saborit JM, Harrison RM (2013) Emissions andindoor concentrations of particulate matter and its specific chemicalcomponents from cooking: a review. Atmos Environ 71:260–294
Asgharian B, Hofmann W, Bergmann R (2001) Particle deposition in amultiple-path model of the human lung. Aerosol Sci Technol 34:332–339
Beddows DCS, Dall’Osto M, Harrison RM (2010) An enhanced proce-dure for the merging of atmospheric particle size distribution datameasured using electrical mobility and time-of-flight analysers.Aerosol Sci Technol 44:930–938
Bhangar S,Mullen N,Hering S, Kreisberg N, NazarofW (2011)Ultrafineparticle concentrations and exposures in seven residences in north-ern California. Indoor Air 21:132–144
Buonanno G, Morawska L, Stabile L (2009) Particle emission factorsduring cooking activities. Atmos Environ 43:3235–3242
DeCarlo PF, Slowik JG, Worsnop DR, Davidovits P, Jimenez JL (2004)Particle morphology and density characterization by combined mo-bility and aerodynamic diameter measurements. Part 1: theory.Aerosol Sci Technol 38:1185–1205
Delgado-Saborit JM, Aquilina NJ, Meddings C, Baker S, Harrison RM(2011) Relationship of personal exposure to volatile organic com-pounds to home, work and fixed site outdoor concentrations. SciTotEnviron 409:478–488
Diffey BL (2011) An overview analysis of the time people spend out-doors. British J Dermatol 164:848–854
Dinar E, Mentel TF, Rudich Y (2006) The density of humic acids andhumic like substances (HULIS) from fresh and aged wood burningand pollution aerosol particles. Atmos Chem Phy 6:5213–5224
Donaldson K, Li X, MacNee W (1998) Ultrafine (nanometre) particlemediated lung injury. J Aerosol Sci 29:553–560
Dua S, Hopke P (1996) Hygroscopic growth of assorted indoor aerosols.Aerosol Sci Technol 24:151–160
Ferron G (1977) The size of soluble aerosol particles as a function of thehumidity of the air. Application to the human respiratory tract. JAerosol Sci 8:251–267
Géhin E, Ramalho O, Kirchner S (2008) Size distribution and emissionrate measurement of fine and ultrafine particle from indoor humanactivities. Atmos Environ 42:8341–8352
Air Qual Atmos Health (2017) 10:1–14 13

Gysel M, McFiggans G, Coe H (2009) Inversion of tandem differentialmobility analyser (TDMA) measurements. J Aerosol Sci 40:134–151
He C, Morawska L, Hitchins J, Gilbert D (2004) Contribution from in-door sources to particle number and mass concentrations in residen-tial houses. Atmos Environ 38:3405–3415
Helsper C, MölterW, Löffler F, Wadenpohl C, Kaufmann S,Wenninge G(1993) Investigations of a new aerosol generator for the productionof carbon aggregate particles. Atmos Environ 27:1271–1275
Hussein T, Löndahl J, Passonen P, Koivisto AJ, Petäjä T, Hämeri K,Kulmala M (2013) Modelling regional deposited dose of submicronaerosol particles. Sci Tot Environ 458:140-149
Hussein T, Glytsos T, Ondráček J, Dohányosová P, Ždímal V, Hämeri K,Lazaridis M, Smolík J, Kulmala M (2006) Particle size characteri-zation and emission rates during indoor activities in a house. AtmosEnviron 40:4285–4307
ICRP, Protection, I.C.o.R (1994) ICRP Publication 66: Human respirato-ry tract model for radiological protection. Elsevier Health Sciences
Ji X, Le Bihan O, Ramalho O, Mandin C, D’Anna B, Martinon L, NicolasM, Bard D, Pairon JC (2010) Characterization of particles emitted byincense burning in an experimental house. Indoor Air 20:147–158
Knibbs LD, He C, Duchaine C, Morawska L (2011) Vacuum cleaneremissions as a source of indoor exposure to airborne particles andbacteria. Environ Sci Technol 46:534–542
Koblinger L, Hofmann W (1990) Monte Carlo modeling of aerosol de-position in human lungs. Part I: simulation of particle transport in astochastic lung structure. J Aerosol Sci 21:661–674
Kristensson A, Rissler J, Löndahl J, Johansson C, Swietlicki E (2013)Size-resolved respiratory tract deposition of sub-micrometer aerosolparticles in a residential area with wintertime wood combustion.Aerosol Air Qual Res 13:24–35
Langer S, Moldanová J, Arrhenius K, Ljungström E, Ekberg L (2008)Ultrafine particles produced by ozone/limonene reactions in indoorair under low/closed ventilation conditions. Atmos Environ 42:4149–4159
LiW, Hopke P (1993) Initial size distributions and hygroscopicity of indoorcombustion aerosol particles. Aerosol Sci Technol 19:305–316
Lioy PJ, Wainman T, Zhang J, Goldsmith S (1999) Typical householdvacuum cleaners: the collection efficiency and emissions character-istics for fine particles. JAWMA 49:200–206
Löndahl J, Massling A, Swietlicki E, Bräuner EV, Ketzel M, Pagels J,Loft S (2009) Experimentally determined human respiratory tractdeposition of airborne particles at a busy street. Environ SciTechnol 43:4659–4664
National Council on Radiation Protection and Measurement (1997).Deposition, retention, and dosimetry of inhaled radioactive sub-stances: recommendations of the National Council on RadiationProtection and Measurements. National Council on RadiationProtection and Measurements
Morawska L, Hofmann W, Hitchins-Loveday J, Swanson C, MengersenK (2005) Experimental study of the deposition of combustion aero-sols in the human respiratory tract. J Aerosol Sci 36:939–957
Morawska L, Afshari A, Bae G, Buonanno G, Chao C, Hänninen O,HofmannW, Isaxon C, Jayaratne E, Pasanen P (2013) Indoor aerosols:from personal exposure to risk assessment. Indoor Air 23:462–487
Nazaroff WW, Weschler CJ (2004) Cleaning products and air fresheners:exposure to primary and secondary air pollutants. Atmos Environ38:2841–2865
Ogulei D, Hopke P, Wallace L (2006) Analysis of indoor particle sizedistributions in an occupied townhouse using positive matrix factor-ization. Indoor Air 16:204–215
Rissler J, Svenningsson B, Fors EO, Bilde M, Swietlicki E (2010) Anevaluation and comparison of cloud condensation nucleus activitymodels: predicting particle critical saturation from growth at subsat-uration. J Geophys Res: Atmospheres 115:1984–2012
Rohr AC (2013) The health significance of gas- and particle-phase ter-pene oxidation products: a review. Environ Intl 60:145–162
Sarwar G, Olson DA, Corsi RL,Weschler CJ (2004) Indoor fine particles:the role of terpene emissions from consumer products. JAWMA 54:367–377
Singer BC, Coleman BK, Destaillats H, Hodgson AT, Lunden MM,Weschler CJ, Nazaroff WW (2006a) Indoor secondary pollutantsfrom cleaning product and air freshener use in the presence of ozone.Atmos Environ 40:6696–6710
Singer BC, Destaillats H, Hodgson AT, Nazaroff WW (2006b) Cleaningproducts and air fresheners: emissions and resulting concentrationsof glycol ethers and terpenoids. Indoor Air 16:179–191
Szymczak W, Menzel N, Keck L (2007) Emission of ultrafine copperparticles by universal motors controlled by phase angle modulation.J Aerosol Sci 38:520–531
Thatcher TL, Layton DW (1995) Deposition, resuspension, and penetra-tion of particles within a residence. Atmos Environ 29:1487–1497
Virkkula A, Van Dingenen R, Raes F, Hjorth J (1999) Hygroscopic prop-erties of aerosol formed by oxidation of limonene, α-pinene, and β-pinene. J Geophys Res: Atmospheres 104:3569–3579
Vu TV, Delgado-Saborit JM, Harrison RM (2015a) A review of hygro-scopic growth factors of submicron aerosols from different sourcesand its implication for calculation of lung deposition efficiency ofambient aerosols. Air Qual Atmos Health. doi:10.1007/s11869-015-0365-0
Vu TV, Delgado-Saborit JM, Harrison RM (2015b) Review: particlenumber size distributions from sevenmajor sources and implicationsfor source apportionment studies. Atmos Environ 122:114–132
Wainman T, Zhang J, Weschler CJ, Lioy PJ (2000) Ozone and limonenein indoor air: a source of submicron particle exposure. EnvironmHealth Perspect 108:1139–1145
Wallace L (1996) Indoor particles: a review. JAWMA 46:98–126Wang B, Lee SC, Ho KF, Kang YM (2007a) Characteristics of emissions
of air pollutants from burning of incense in temples, Hong Kong. SciTot Environ 377:52–60
Wang S, Ang HM, Tade MO (2007b) Volatile organic compounds inindoor environment and photocatalytic oxidation: state of the art.Environ Intl 33:694–705
Waring MS, Wells JR, Siegel JA (2011) Secondary organic aerosol for-mation from ozone reactions with single terpenoids and terpenoidmixtures. Atmos Environ 45:4235–4242
Wu C, Chao CY, Sze-To G, Wan M, Chan T (2011). Ultrafine particleemissions from cigarette smouldering, incense burning, vacuumcleaner motor operation and cooking. Indoor Built Environ1420326X11421356
Zhu J, Cao X-L, Beauchamp R (2001) Determination of 2-butoxyethanolemissions from selected consumer products and its application inassessment of inhalation exposure associated with cleaning tasks.Environ Intl 26:589–597
14 Air Qual Atmos Health (2017) 10:1–14