physical and chemical characteristics of flue-gas particles in a … · chemical characteristics of...
TRANSCRIPT

Tampere University of Technology
Physical and chemical characteristics of ue-gas particles in a large pulverized fuel-redpower plant boiler during co-combustion of coal and wood pellets
CitationMylläri, F., Karjalainen, P., Taipale, R., Aalto, P., Häyrinen, A., Rautiainen, J., ... Rönkkö, T. (2017). Physical andchemical characteristics of ue-gas particles in a large pulverized fuel-red power plant boiler during co-combustion of coal and wood pellets. Combustion and Flame, 176, 554-566. DOI:10.1016/j.combustflame.2016.10.027Year2017
VersionPublisher's PDF (version of record)
Link to publicationTUTCRIS Portal (http://www.tut.fi/tutcris)
Published inCombustion and Flame
DOI10.1016/j.combustflame.2016.10.027
CopyrightUnder a Creative Commons license: http://creativecommons.org/licenses/by/4.0/
Take down policyIf you believe that this document breaches copyright, please contact [email protected], and we will remove access tothe work immediately and investigate your claim.
Download date:16.03.2019

Combustion and Flame 176 (2017) 554–566
Contents lists available at ScienceDirect
Combustion and Flame
journal homepage: www.elsevier.com/locate/combustflame
Physical and chemical characteristics of flue-gas particles in a large
pulverized fuel-fired power plant boiler during co-combustion of coal
and wood pellets
Fanni Mylläri a , Panu Karjalainen
a , Raili Taipale
b , Pami Aalto
c , Anna Häyrinen
d , Jani Rautiainen
d , Liisa Pirjola
e , Risto Hillamo
f , Jorma Keskinen
a , Topi Rönkkö a , ∗
a Aerosol Physics Laboratory, Department of Physics, Tampere University of Technology, P.O. Box 692, FI-33101 Tampere, Finland b VTT Technical Research Centre of Finland, P.O. Box 1603, FI-40101 Jyväskylä, Finland c School of Management/Politics, University of Tampere, FI-33101 Tampere, Finland d Helen Oy, Helen, FI-0 0 090 Helsinki, Finland e Department of Technology, Metropolia University of Applied Sciences, FI-00180 Helsinki, Finland f Atmospheric Composition Research, Finnish Meteorological Institute, FI-00560 Helsinki, Finland
a r t i c l e i n f o
Article history:
Received 5 August 2016
Revised 13 September 2016
Accepted 29 October 2016
Keywords:
Biomass combustion
High temperature aerosol
Total particle number concentration
Particle number size distribution
Pulverized fuel
Coal
a b s t r a c t
Fossil fuel combustion should be decreased in future years in order to lower the CO 2 emissions of en-
ergy production. The reduction can be achieved by increasing the amount of CO 2 -neutral fuels in energy
production. Here 6–13% of coal was substituted with industrial or roasted pellets in a pulverized fuel-
fired power plant without making any changes to fuel grinding or low-NO x burners. The effect of pellet
addition for the flue gas particles was studied with direct sampling from the boiler super heater area.
Based on primary dilution ratio tests, transmission electron microscope images, and the natural electric
charge of the particles, it was observed that particles in the flue gas are spherical and have been formed
in the boiler at high temperatures. The pellet addition lowered the total particle number concentrations
with all of the studied pellet–coal mixtures in comparison to the coal combustion. The 10.5% industrial
pellet addition caused a second mode in the particle number size distribution. In addition, based on the
chemical analysis of the collected size-fractioned particle samples, results indicated that the pellet addi-
tion did not increase the corrosion risk of the boiler. However, the changes in the particle number size
distribution and total particle number concentration can affect the operation of electrostatic precipitators
and flue gas cleaning.
© 2016 The Combustion Institute. Published by Elsevier Inc. All rights reserved.
b
a
B
f
a
p
c
m
e
o
i
t
1. Introduction
Climate change has caused a global need to reduce CO 2
emissions. These emission reductions are driven mainly by local
political decisions [1,2] , but larger scale political actions also
exist. In principle, smaller CO 2 emissions can be achieved by
reducing the usage of fossil fuels in traffic, residential needs, and
in power generation. This can take place by reducing the energy
consumption or by substituting fossil fuels with renewable fuels
(e.g., biofuels, solar and wind power). One likely cost effective
possibility in these actions is to utilize existing coal-fired power
plant infrastructures and substitute the coal used in those with
biomass. However, decreased CO 2 emissions and the addition of
∗ Corresponding author.
E-mail address: [email protected] (T. Rönkkö).
i
d
s
t
http://dx.doi.org/10.1016/j.combustflame.2016.10.027
0010-2180/© 2016 The Combustion Institute. Published by Elsevier Inc. All rights reserved
iomass can change the emission of other harmful pollutants
nd also increase the corrosion risks for the power plant boilers.
iomass-based fuels have a different chemical composition than
ossil fuels such as coal [3] . Biomass fuels typically contain more
lkali metals and chlorides [3,4] , which can, in the combustion
rocess, be vaporized into the flue gas [5] . For instance, alkali
hlorides are found to be harmful for the power plant boiler
aterials [6] . After the combustion process, corrosion-causing
lements can exist in the vapour or particle phase [7] , depending
n the temperature and concentrations [8] . For instance, a change
n the boiler temperature profile affects the deposition locations of
he alkali chloride [8] . In principle, the amount of alkali chlorides
n the particle phase can be determined when the particle size
istribution and chemical composition of the particles are studied
imultaneously.
In addition to the temperature profile existing in the boiler and
he chemical composition of the fuel, the fuel grain size also has
.

F. Mylläri et al. / Combustion and Flame 176 (2017) 554–566 555
a
o
s
[
m
p
a
1
s
t
s
c
fl
c
o
a
o
p
o
T
C
i
b
c
o
f
I
R
C
m
t
p
s
E
C
l
g
b
v
C
m
b
f
T
r
f
p
c
b
s
e
c
v
e
s
m
o
c
e
2
h
c
O
i
t
c
w
g
d
(
[
c
c
a
p
c
c
S
t
o
s
c
i
o
f
2
2
i
s
i
f
a
o
b
f
a
b
i
c
d
b
a
2
R
l
p
e
w
t
h
s
d
e
N
w
t
i
c
n effect on the combustion process and the slagging and fouling
f the super heater surfaces. The fuel grain size affects the particle
ize distribution after combustion in the flue gas. Ninomiya et al.
9] have studied the effect of coal grain size in terms of particle
ass (PM) emission. They discovered that < 63 μ m coal particles
roduce bimodal PM distribution, with mode means of 500 nm
nd 4 μ m. They also found that there is a small mode around
30 nm, which consisted of alkali metals, heavy metals and their
ulphate, chloride and phosphate salts. The flue gas is steered
o flue gas ducts and released in to atmosphere with or without
ome flue gas cleaning. Particle properties such as size, chemical
omposition, and the electric charge carried by particles affect the
ue gas cleaning efficiency [10,11] .
In general, the flue-gas changes in large power plant boilers
an affect, for exam ple, the corrosion of the super heater area and
ther parts of the flue-gas system, the flue-gas cleaning systems
nd, finally, the emissions of power plants. These effects depend
n the characteristics of aerosol generated in the combustion
rocess. The emissions of particles from combustion plants and
ther sources are governed by the Convention on Long-Range
ransboundary Air Pollution of the United Nations Economic
ommittee for Europe. The 2012 amendments to the Convention
nclude national emission reduction commitments by 2020 and
eyond. The limit values for SO 2 , NO x , ammonia, volatile organic
ompounds and particulate matter (i.e., with a diameter equal to
r less than 10 μm), including black carbon, are separately defined
or coal and biomass with no mention of co-combustion [12] .
n addition to the EU Member States, Canada, the United States,
ussia and several countries of Southern and Eastern Europe, the
aucasus and Central Asia are also expected to sign the amend-
ents. In its related legislation, the European Union also separates
he emissions from coal and biomass without any mention of
rospects of co-combustion [13–15] .
However, the partial substitution of coal by biomass and sub-
equent co-combustion is one of the pathways identified in the
uropean Industrial Bioenergy Initiative (EIBI) of the European
ommission and the EU Member States. The EIBI pays attention to
ocal variation in the available biomass feedstock options and sug-
ests “a pragmatic approach to select the most promising options,
ased on transparent criteria reflecting a set of key economic, en-
ironmental and social performances expected” [16] . The European
ommission deems co-combustion of biomass and coal to be “the
ost cost-effective option for electricity production”. Addition of
iomass up to 10% share of total power output has been success-
ully demonstrated and the technology is commercially available.
his technology makes use of existing plant infrastructure and
equires only limited investments in biomass pre-treatment and
eed-in systems [17] . However, “feeding, fouling and ash disposal
ose technical challenges that reduce reliability and lifetime of
oal plants. Higher co-firing mix will require more sophisticated
oiler design, process control and fuel handling and control
ystems” [18] . The European Commission is hesitant towards to
stablish a specific policy for the co-combustion of biomass and
oal. It notes that the incentives of the utilities running rele-
ant combustion plants are national support schemes and/or the
mission ceiling of the emissions trading scheme (ETS). Therefore
etting a policy for co-combustion installations without similar
easures for coal-combustion plants might lead to decreased use
f biomass and hence, by implication, higher emissions [19] .
In the United States, short tests of co-combustion have been
onducted since the 1990s. The Energy Information Administration
xpects co-combustion to be up to 20 times more prevalent by
024 than it was in 2010 [20] . Federal-level research into the
eating qualities of different biomass contents and emissions
ontinues [21] . The 2014 Clean Power Plan offered by President
bama and the Environmental Protection Agency mentions that,
n co-combustion, the “use of some kinds of biomass has the po-
ential to offer a wide range of environmental benefits, including
arbon benefits”, and that “[I]ncreasing renewable energy (RE) use
ill also continue to lower other air pollutants (e.g., fine particles,
round-level ozone, etc.)” [22] . While federal level regulation is
ebated, individual states can use renewable energy standards
RES) to incentivize power plant operators for co-combustion
20] . However, by 2012, only 3% RPS-motivated renewable energy
apacity additions came from biomass [23] . With regard to co-
ombustion, plant operators hesitate over the costs of acquiring
nd transporting the biomass, as well as the long-term effects on
rocess equipment [20] .
In this article, flue-gas aerosol from a large scale pulverized
oal-fired power plant boiler is investigated. The power plant
ombusted various mixtures of coal and two types of wood pellet.
pecial attention is paid to the particle number size distributions,
otal particle number concentration and chemical composition
f particles in the diluted flue-gas sample taken from the boiler
uper heater area. In addition, the effects of wood pellets on the
oncentrations of gaseous species and particulate matter (PM)
n the flue gas are shown. The aim is to understand the effect
f co-combustion of wood pellets and coal on flue-gas aerosol
ormation and characteristics.
. Experimental
.1. Power plant
The power plant where the experiments of this study occurred
s situated in Helsinki, Finland. In the power plant, there are two
eparate boilers, both equipped with flue gas cleaning systems that
nclude electrostatic precipitators, semi-dry desulphurization, and
abric filters, in the given order after the boiler. Boilers (363 MW th )
re equipped with a reheater and utilizes the natural circulation
f flue gas. Boilers are equipped with 12 low-NO x technology
urners (Tampella/Babcock-Hitachi HTNR low NO x ) that are at the
ront wall. The combustion air and at the same time the carrier
ir for the pulverized fuel is preheated up to 350 °C before the
oiler and grinders. Main operation principle of low-NO x burners
s air staging with secondary and tertiary air, which lowers the
ombustion temperature to the level of around 1100 °C. Air staging
ecreases NO x formation. The power plant boiler has originally
een designed to combust pulverized coal that is fed to the boiler
fter being ground in ball ring grinders.
.2. Fuel properties
In this study, some of the measurements were made with 100%
ussian coal and some with mixtures of coal and pellets. In the
atter case, coal was substituted with 6–13% (of the boiler thermal
ower) wood pellets; roasted pellets or industrial pellets (see
xperimental matrix in Table 1 ). Roasted pellet is torrefactioned
ood pellet, also known as black pellet, steamed pellet, torrefac-
ioned pellet and bio coal, manufactured from wood pellets by
eat treatment at approximately 300 °C.
Industrial pellet (wood pellet of industrial quality) fulfils the
tandard EN 14961-1 requirements having lower quality than
omestic quality wood pellets. Industrial pellet can include, for
xample, bark, which does not exist in higher quality wood pellets.
ormally, wood for industrial pellets is gained by grinding stem
ood or logs to powder and, after drying, by pressing the powder
o pellets. Due to the preparation principle of industrial pellets,
t is more brittle than domestic pellets and it contains more ash
omponents.

556 F. Mylläri et al. / Combustion and Flame 176 (2017) 554–566
Table 1
Experimental matrix. Coal was combusted during the nights and for that reason the “c” test took only 2 h. Note that there is a lower load in “c+rp7.6%”
situation. The deviations we mainly caused by instability of the pellet feeding system.
Label Power coal Power pellet Portion of pellet from fuel power (%) DLPI sampling time Duration of co-firing test
c+rp6.8% 301.6–322.2 5.2–33 1.6–9.9 2 h 3 h
c+rp7.6% 246.3–248.7 19.0–21.9 7.1–8.2 2 h 30 min 5 h
c+rp9.8% 294.7–320.3 15.7–44.1 4.7–13 2 h 10 min 5 h
c+rp13.1% 287.3–318.5 34.9–47.5 9.9–14.2 2 h 3 h
c+ip6.6% 299.2–312.9 12.8–31.8 3.9–9.6 2 h 5 h
c+ip10.5% 297.9–302.7 28.3–36.8 8.5–11.0 1 h 40 min 4 h
c 328.0–335.7 0 0 1 h 40 min 2 h
Super heater area
Dilutingsampling
probe
E1 F
PM10-cyclone
PM10-cyclone
PM10-cyclone
E2
FTIR in rawgas 600 ◦C
FTIR indiluted gas
DLPI DLPI
ELPI ELPI
CO2
ana-lyzer
SMPS
mini-ESP
on/off
Fig. 1. Measurement setup. E is ejector type diluter, F is a particle filter, and PM10-
cyclone is a cyclone with 10 μm cut–off diameter. The diluted sample was taken at
90 0–10 0 0 °C temperature area and the raw flue gas sample at 600 °C temperature
area of the boiler. The dashed line indicates the 11-m long sampling line.
c
c
p
c
o
t
2
t
i
c
1
w
f
c
f
p
a
The coal is stored inside the power plant building in four
intermediate storages, “day silos”. From the intermediate storages
the coal is divided to a belt conveyor which carries the coal to
the grinders. Below each belt conveyor there is a grinder, which
pulverizes the coal. The pellet is added to the grinder by a sepa-
rate feeding system. The pulverization is performed with ball ring
grinders (9 rolling balls). The pulverized fuel is blown into three
burners together with the combustion air. Over each grinder there
is a sieve which returns the largest particles back to the grinder.
The fuel mixture was grinded simultaneously in two of the four
grinders and thus in total 6 burners were combusting wood–pellet
coal mixtures. When pulverizing coal the mean fuel particle
size was 47–62 μm (58–69% was below 74 μm and 100% was
< 600 μm). For “c+rp” the mean fuel particle size was 56–90 μm
(32–74% was below 74 μm and 87–100% was < 600 μm), whereas
for the “c+ip” the mean fuel particle size was 54–174 μm (28–59%
was below 74 μm and 79–99% was < 600 μm). These numbers
show that the wood pellet substitution changes the pulverized
fuel by increasing the fuel particle diameter.
Pellet and coal properties are listed in Table 2 . Table 2 shows
that the pellets had lower water and ash content in contrast to
the coal. Also, the sulphur content and chloride contents were
significantly lower in the pellets than the coal. Instead, the oxy-
gen and volatile content were higher in the pellets than in the
coal. It is notable, that the sum of alkali metals (K and Na) was
higher in coal than in the pellets, which means that actually
the pellet addition diluted the alkali concentration in the boiler.
The heating value of coal was higher than the heating value of
pellets.
2.3. Measurement setup and analytical methods
The measurement setup used is shown in Fig. 1 . All the mea-
surements with pure coal and coal–pellet mixtures were made
from the same boiler unit. In these measurements, the flue-gas
sample was taken from the boiler super heater area where the
temperature ranges from 900 to 10 0 0 °C. Due to the temperature
variations and turbulence in the boiler, the flue-gas sampling was
not designed to be isokinetic. This can affect representativeness of
absolute concentration values measured for large particles, but not
to the relative concentrations between the studied fuel-mixtures.
Primary dilution of the sample was performed with a porous
tube-type diluter using nitrogen (200 °C) as diluting gas, similar
to the one in [24] . Due to the hot flue gas condition, the outer
shell of the dilution probe was cooled with pressurized air flow,
whereas the inner shell was heated to prevent the condensation
of the gaseous components. Secondary dilution was performed
with an ejector diluter (Dekati Ltd.), using nitrogen as a diluting
gas, with a dilution ratio of 2.83. The primary dilution ratio was
calculated based on CO 2 and H 2 O measurements. In most of the
measurements, the primary dilution ratios were between 6.0 and
8.3. The primary dilution ratio was chosen so that the sample
ools enough in the primary diluter. Primary dilution ratio was
hanged in one of the experiments to see how sensitive the
article size distribution is to the variations in primary dilution
onditions. Secondary dilution was used to lower the temperature
f the sample even more to the room temperature. The sample
emperature before the secondary diluter was approximately
00 °C.
After the secondary dilution the particles were collected with
wo parallel Dekati low pressure impactors (DLPI, Dekati Ltd.)
n order to measure the mass size distribution and the chemical
omposition of the particles. A cyclone with cut-off diameter of
0 μm was applied before the DLPIs. The DLPI collection plates
ere greased polycarbonate films, whereas the smallest particle
raction was collected to a teflon filter. The particulate sample
ollected by one of the DLPI was used to analyse the water soluble
raction of the particles, and the other to analyse the acid-soluble
articles. In this study, 13 size fractions of DLPI were combined
fterwards into five different size categories < 30 nm, ≥ 30 nm to

F. Mylläri et al. / Combustion and Flame 176 (2017) 554–566 557
Table 2
Fuel properties.
Industrial pellet Roasted pellet Coal
Moisture % 6.7 6.0 11.0–11.3
Ash % 0.8 3.3 10.5–11.4
Volatiles % 78.1 64.6 32.8–33.1
Heating value GJ/t 17.7 20.3 24.6–24.9
C % 47.4 53.8 62.3–63.1
H % 5.6 5.2 4.1–4.2
N % 0.1 0.3 1.8–2
O % 39.4 31.7 0
S mg/kg dry 180 580 310 0–460 0
Cl mg/kg dry 39 84.3 236
Ca mg/kg dry 2300 6100 430 0–480 0
Mg mg/kg dry 280 740 170 0–190 0
Na mg/kg dry 69 240 140 0–160 0
K mg/kg dry 760 3200 250 0–290 0
Fe mg/kg dry 140 1100 480 0–570 0
Al mg/kg dry 130 580 1420 0–150 0 0
Ti mg/kg dry 8.8 47 600–640
Ba mg/kg dry 26 25 270–280
B mg/kg dry < 40 < 40 210–230
Ag mg/kg dry < 0.5 < 0.5 < 0.5
As mg/kg dry < 0.5 < 0.5 4.9–14
Be mg/kg dry < 0.5 < 0.5 < 0.5
Bi mg/kg dry < 0.7 < 0.7 < 0.7
Cd mg/kg dry 0.2 1.2 0.1
Co mg/kg dry < 0.5 < 0.5 1.4–2.1
Cr mg/kg dry 1.2 13 9.7–11
Cu mg/kg dry 1.6 5.9 7.8–8.5
Li mg/kg dry < 0.5 1.1 9.3–10
Mn mg/kg dry 140 140 38-66
Mo mg/kg dry < 0.5 0.9 1.1–1.3
Ni mg/kg dry < 0.5 2.3 4.1–6.6
Pb mg/kg dry < 0.5 6.1 3.4–4.1
Rb mg/kg dry 2.5 6.4 5.2–9.0
Sb mg/kg dry < 0.5 < 0.5 < 0.5
Se mg/kg dry < 0.7 < 0.7 < 0.7–1.1
Sr mg/kg dry 5.5 19 150–170
Th mg/kg dry < 0.5 < 0.5 1.2–1.3
Tl mg/kg dry < 0.5 < 0.5 < 0.5
U mg/kg dry < 0.5 < 0.5 < 0.5–0.6
V mg/kg dry < 0.5 1.3 13–15
Zn mg/kg dry 30 120 11–18
<
t
d
o
w
w
Z
(
N
(
m
(
2
i
o
c
w
D
s
w
s
t
p
u
t
a
(
(
a
a
i
s
s
m
b
m
f
[
1
T
v
g
d
c
D
90 nm, ≥ 90 nm to < 260 nm, ≥ 260 nm to < 600 nm, ≥ 600 nm
o < 1.6 μm, and > 1.6 μm.
The water-soluble anion (SO
2 −4
, Cl −, F −) concentrations were
etermined with ion chromatography (measurement was based
n standard SFS-EN ISO 10304-1 and instrument that was used
as Dionex ICS-20 0 0 Ion Chromatography system). The analysed
ater-soluble elements were Ca 2+ , K
+ , Na + , SO
2 −4
, Cl −, F −, and
n, whereas the acid-soluble fraction was analysed for 31 elements
Ag, Al, As, B, Ba, Be, Bi, Ca, Cd, Co, Cr, Cu, Fe, K, Li, Mg, Mn, Mo,
a, Ni, Pb, Rb, Sb, Se, Sr, Th, Ti, Tl, U, V, Zn, Cl and S). Elements
water-soluble cations and acid-soluble elements) were deter-
ined with an Induction Coupled Plasmonic – Mass Spectrometer
ICP-MS). Measurement was based on standard SFS-EN ISO 17294-
and the instrument that was used was a Thermo Fisher Scientific
CAP Q ICP-MS. It has to be noted that Si, carbon, carbonates and
xides were not analysed from the samples. The water-soluble
ations and anions were dissolved in 25 ml of ultra-pure Milli-Q
ater in closed plastic tubes at room temperature for 5 days.
uring the dissolution, the samples were shaken for 2 h and
tored for 2 h in an ultrasound bath. The acid-soluble elements
ere dissolved in 2 ml of nitrous acid–hydrogenfluoride acid (3:1)
olution and the sample was diluted with 10 ml of Milli-Q water.
After the secondary dilution, part of the sample was diluted fur-
her with dilution ratio of 12 and conducted to an Electrical low-
ressure impactor (ELPI, Dekati Ltd., Keskinen et al. [25] ). ELPI was
sed parallel with the DLPIs to monitor the loading of the collec-
ion plates of DLPIs. Further, part of the sample flow was led with
n 11-m-long sampling line to a scanning mobility particle sizer
SMPS, Wang and Flagan [26] ), another ELPI and a CO 2 analyser
SickMaihak, SIDOR). These instruments were installed inside an
ir-conditioned room. The SMPS consisted of DMA 3071 (TSI Ltd.)
nd CPC 3025 (TSI Ltd.) with 0.6/6.0 lpm flows a thus correspond-
ng to particle size range from 9.8 nm to 414 nm. The charging
tate of the particles was studied by utilizing a self-made electro-
tatic precipitator (mini-ESP). The mini-ESP was used in part of the
easurements to remove the electrically charged particle fraction
efore the SMPS size distribution measurement. A schematic of the
easurement setup is presented in Fig. 1 . The diffusional losses
or particles in the 11-m sampling line were calculated (Hinds
27, Eqs. (7-31) and (7-32)] ) to be for 10 nm, 20 nm, 40 nm and
00 nm particles in diameter 48%, 25%, 10%, and 4%, respectively.
he particle size distributions below have been corrected by these
alues.
In addition to particle measurements, the concentrations of
aseous species were measured simultaneously after primary
ilution from the same sampling line as the particles. Gaseous
omponents were measured with an FTIR gas analyser (Gasmet
X-40 0 0), in which the optical path was 5.0 m. The gaseous sam-

558 F. Mylläri et al. / Combustion and Flame 176 (2017) 554–566
Table 3
Concentrations of gaseous compounds CO 2 (% red. dry 6% O 2 , marked as % r.) and CO, NO, SO 2 , HCl, HF (ppm reduced dry 6% O 2 , marked as ppm r.), total
particle number concentration (N tot , calculated from particle number size distribution measured with SMPS) and PM10 in the wet flue gas boiler reheater
area. The “c” corresponds to coal and “rp” to roasted pellet and “ip” to industrial pellet; the percentages are the amount of pellet thermal power of the
total fuel power.
Fuel CO 2 CO NO SO 2 HCl HF N tot PM10
(% r.) (ppm r.) (ppm r.) (ppm r.) (ppm r.) (ppm r.) ( · 10 8 cm
−3 ) mg N m
−3
c 13 ± 0.2 19.5 ± 2.3 289 ± 8.4 204 ± 13 18 ± 1.3 33.2 ± 0.8 2.76 600
c+rp6.8% 13 ± 0.2 18.3 ± 3.1 276 ± 23.5 158 ± 17.3 9 ± 1.1 29.3 ± 1.5 2.03 690
c+rp7.6% 13 ± 0.2 13.6 ± 1.1 272 ± 9.6 156 ± 14.6 9 ± 0.5 32.3 ± 1.6 1.90 510
c+rp9.8% 13 ± 0.2 11.9 ± 2.3 273 ± 16.7 183 ± 10.4 8 ± 0.4 32.1 ± 0.8 1.67 720
c+rp13.1% 14 ± 0.3 12.7 ± 3.6 294 ± 27.6 144 ± 10.4 14 ± 1 29.7 ± 0.8 1.73 820
c+ip6.6% 14 ± 0.2 16.0 ± 0.9 295 ± 16.9 146 ± 5.6 11 ± 0.7 30.5 ± 0.7 1.89 640
c+ip10.5% 14 ± 0.2 18.5 ± 1.6 278 ± 11.8 201 ± 6.1 16 ± 0.4 30.9 ± 0.7 2.20 570
Fig. 2. Particle mass size distribution ( mg N m
−3 ) calculated from the weighted par-
ticle samples that were collected with the parallel DLPIs. The bar shows the mean
value of the mass on two different impactor stages and the standard deviation is
calculated based on the same masses.
“
“
t
t
f
o
c
p
c
t
w
p
w
i
fi
s
w
S
o
e
f
ple was kept at 180 °C temperature. The gaseous components were
also measured after the reheater where the flue gas temperature
was around 600 °C. The measurement place was chosen to be at
the reheater area due to lack of viewports at the superheater area.
FTIR gas analyser (Gasmet DX-40 0 0) was also used here, with
the optical path of 2.5 m. The gaseous sample was taken with
sampling probe made by M&C. This FTIR included also a zirconium
oxide sensor to measure the humid sample gas oxygen content.
The measured gaseous components were H 2 O, CO 2 , CO, N 2 , NO,
NO 2 , SO 2 , HCl, and HF.
The flue gas particles of one coal–pellet mixture “c+ip10.5%”
were collected with a flow-through-type sampler onto holey
carbon grids for microscopy studies. These particle samples were
studied later with a transmission electron microscope (TEM, Jeol
JEM-2010) equipped with energy dispersive X-ray spectrometer
(EDS, Noran Vantage with Si(Li) detector, Thermo Scientific).
3. Results
3.1. Gaseous compounds
Table 3 shows the gaseous compounds (CO 2 , CO, NO, SO 2 ,
HCl and HF) studied from the boiler reheater area. Within the
accuracy of measurements, no significant differences in the CO 2
concentration was observed. Concentration of carbon monoxide
was lower for pellet–coal mixtures than for coal. The lowest CO
concentration was achieved with “c+rp9.8%” (11.9 ppm) and the
highest with coal (19.5 ppm). There was hardly any NO 2 present at
the flue gas ( < 2 ppm) and, thus, the NO x consisted mainly of NO.
It can be seen that the pellet addition also decreased the SO 2 , HCl
and, in some cases the NO concentrations when compared to coal
combustion. In principle the reductions of SO 2 and HCl concen-
trations were presumable due to the chemical composition of the
fuels; pellets contain less sulphur and chloride compared to coal.
However, the decrease in SO 2 concentration can be affected by
changes of combustion and flue-gas processes such as conversion
of SO 2 to SO 3 that may promote the existence of sulphate in parti-
cle phase. Lower carbon monoxide concentrations with pellet–coal
mixtures can be due to higher oxygen content of the fuel.
3.2. Particle mass size distribution and chemical composition
Particle mass on each DLPI stage was weighted in order
to gain the particle mass size distribution which is shown in
Fig. 2 . The particulate mass (below 10 μm, PM10) was calculated
from the size fractioned masses and the PM10 was averaged
between the two parallel particle collections. The PM10 values
were 600 mg N m
−3 , 690 mg N m
−3 , 510 mg N m
−3 , 720 mg N m
−3 ,
820 mg N m
−3 , 640 mg N m
−3 and 570 mg N m
−3 , respectively for
c”, “c+rp6.8%”, “c+rp7.6%”, “c+rp9.8%”, “c+rp13.1%”, “c+ip6.6%”, and
c+ip10.5%” (with the legend in Fig. 2 ). The PM10 results indicate
hat the co-combustion of wood pellets and coal does not increase
he PM10 in the boiler.
The chemical composition of the particles was determined
rom the particulate matter collected on the stages of DLPI. Based
n the studied chemical components, a maximum of 50% of PM10
ould be identified. This means that more than 50–80% of the
articles consisted of unanalysed compounds (e.g., Si and black
arbon). For instance, Frey et al. reported that, in the emissions of
he same power plant, 80% of particle emission were other than
ater or acid-soluble fraction [28] .
The results of size-fractioned ionic and elemental analysis are
resented in Appendix C for each fuel mixture. The size fractions
ere determined based on the D50% diameters of the DLPI. The
onic composition of one size fraction was calculated in two steps:
rst, all analysed ion concentrations were added up in the specific
ize range; second, the ratio of the analysed mass of one ion to the
hole analysed mass of ions in the specific size was calculated.
imilar calculations were made from elemental analysis. The mass
f some size fractions was not enough to determine the ionic or
lemental composition. Thus, the composition of that kind of size
raction has been left blank in Fig. C.8 of Appendix C . In addition,

F. Mylläri et al. / Combustion and Flame 176 (2017) 554–566 559
Fig. 3. (a) Effect of total dilution ratio on the measured particle number size distribution (c+rp7.6%). (b) Particle number size distribution measured with ELPI and SMPS
(D indicates D a and D p in the figure, respectively) during coal combustion. (c, d) Particle number size distributions measured with SMPS. Concentrations have been corrected
by the dilution ratio of the whole sampling system.
t
o
w
a
e
s
c
(
a
o
m
T
e
i
m
C
T
d
p
3
(
t
T
t
d
t
t
r
c
f
s
h
t
t
o
t
t
c
b
T
e
t
a
c
f
o
p
d
W
i
w
T
f
he missing composition can be due to undetectable concentration
f the ions/elements in the sample.
The acid-soluble fraction was 20–50% of the PM10 and the
ater-soluble fraction was 2–3% of the PM10, specific percentages
re shown in Appendix C over the graph. This means that the
lemental composition of the particle is more important when
tudying the chemical composition. For all fuel mixtures, the most
ommon measured elements in the particles were aluminium
Al), calcium (Ca), iron (Fe), magnesium (Mg), potassium (K)
nd sodium (Na). Aluminium was the main element in particles
ver 260 nm in diameter, whereas calcium and iron were the
ost common in particles that were 30–260 nm in diameter.
he partition of elements is due to different volatilities of the
lements in the fuel [29] . In addition, potassium existed mainly
n the particles over 260 nm. The water-soluble fraction consisted
ainly of Ca 2+ and SO
2 −4
ions in all size classes. In addition to
a 2+ and SO
2 −4
, some K
+ and Na + was analysed in the samples.
hese results indicate that substituting coal with 6–13% of pellets
oes not have significant effect on the chemical composition of the
articles.
.3. Physical properties of particles
Figure 3 a shows the number size distributions of particles
9.8–414 nm) sampled from the boiler super heater area where
he temperature was in the range of 90 0–10 0 0 °C “c+rp7.6%”.
he geometric-mean diameter (GMD) for the mode dominating
he size distributions was around 25 nm. The variation in the
ilution ratio did not affect the particle number size distribu-
ion corrected by the dilution ratio, which indicates that any of
he studied dilution ratios can be used to achieve comparable
esults [30,31] . It should be noted that in addition to particle
oncentration, the mean particle size also did not change as a
unction of the dilution ratio. In other words, there were no
ignificantly low-vapour pressure gaseous compounds that could
ave formed particles or condensed onto existing particles after
he sampling, such as during dilution processes or in other parts of
he sampling system. Thus, the results related to the insensitivity
f the particle size distribution on the dilution ratio indicate
hat the particles were formed before the sampling process (i.e.,
hey were present in particle phase already in high temperature
onditions).
Figure 3 b shows the particle size distribution for coal com-
ustion with two different instruments, namely SMPS and ELPI.
he measurement principle of these instruments differs from
ach other; while the SMPS classifies the particle in respect to
heir mobility size, the ELPI classifies the particles based on their
erodynamic diameter. The difference between measurement prin-
iples enables the evaluation of effective density of particles; see,
or example, Ristimäki et al. [32] and Virtanen et al. [33] . Based
n the ELPI and SMPS measurements and log-normal-distributions
lotted to the size distributions, the particles had a mean mobility
iameter of 25 nm and mean aerodynamic diameter of 55 nm.
hen the effective density is calculated using these particle sizes,
ts value is 2.05 g cm
−3 . This is close to the bulk density of SiO 2
hich is 2.196–2.648 g cm
−3 , depending on the crystal form [34] .
he effective density of the particles was the same with all studied
uel compositions.

560 F. Mylläri et al. / Combustion and Flame 176 (2017) 554–566
Fig. 4. Transmission electron microscope (TEM) images of particles collected from a flue gas sample. (a) General picture of the small particles, (b) particles having diameters
of 10–25 nm and (c) example of larger particle with diameter of 120–130 nm.
a
a
o
1
T
i
s
a
(
C
t
q
p
p
d
s
u
s
c
d
p
o
p
n
h
t
d
c
B
f
a
m
F
p
w
b
b
t
L
t
s
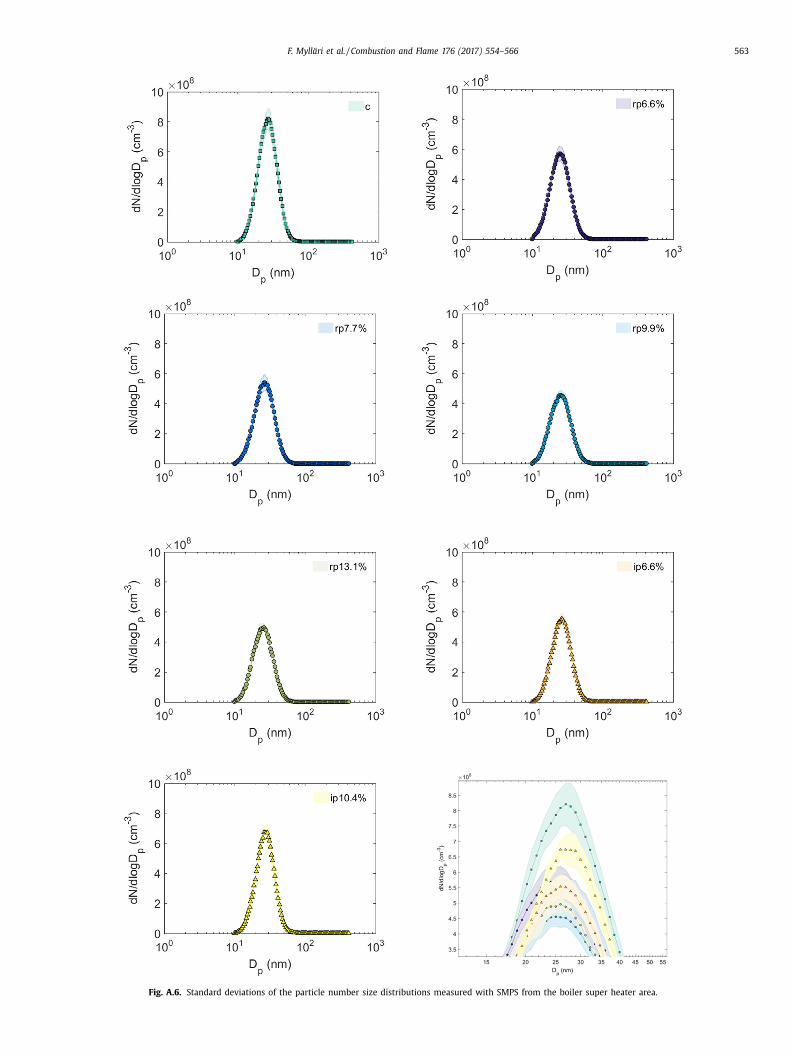
Particle number size distribution was dominated by the par-
ticles in the range of 10–70 nm in diameter. Figure 3 c shows
that the peak concentrations in the number size distribution were
not the same with different fuels. The standard deviations for
each studied wood pellet–coal mixture are shown in Appendix A .
The total particle number concentrations (for particles in the size
range of 9.8–414 nm) were calculated from the particle number
size distributions and are listed in Table 3 . The particle number
size distributions were also used to calculate the volume size dis-
tribution of the particles (see Appendix B ). The 100% coal has the
highest peak concentration and, thus, indicates the highest total
particle concentration in the boiler super heater area. The sec-
ond highest peak concentration was observed with coal+ip10.5%
case, whereas for the other coal–pellet mixtures total particle
concentrations decreased with increasing pellet proportion. How-
ever, it seems that also “c+rp13.1%” had an increasing trend to
the total particle number concentration (9.8–414 nm) compared
with “c+rp9.8%”. It can be concluded that the pellet substitution
decreases the total particle number concentration in the boiler.
The lowest total particle number concentration (9.8–414 nm) was
achieved with combustion of roasted pellets and coal because all
studied “c+rp”-mixtures, even over 10% substitution, decreased
the total particle number concentration equally compared to coal
combustion. It seems that over 10% substitution of industrial pel-
lets can actually increase the total particle number concentration
in the boiler compared to “c+rp”-mixtures.
Figure 3 d shows that the particle number size distributions
were mainly unimodal in size range of 9.8–414 nm with a mean
electrical mobility diameter of 25 nm and a geometric standard
deviation (GSD) of 1.4. However, when combusting “c+ip10.5%”-
fuel, the other mode was also observed, in addition to the mode at
25 nm. The other particle mode had the GMD of around 120 nm
(GSD 1.6), but the number concentration for this mode was about
3 orders of magnitude smaller than the number concentrations of
mode at 25 nm. Thus, the combustion of other “c+rp”-mixtures
decreased the total particle number concentration in the studied
size range, but did not have an effect on the form of particle
number size distribution, and the combustion of “c+ip10.5%”
did cause a slightly higher total particle number concentrations
and a bimodal particle size distribution. This can be a result of
differences in some properties of the fuels, such as the grindability
of the pellets. Roasted pellets are more similar to the coal and,
thus, could be more easily ground with the coal compared to the
industrial pellets which are less processed and look more like
stemwood.
The particle sample for transmission electron microscope (TEM)
nalyses was collected during the combustion of “c+ip10.5%”. Ex-
mples of the images of the particles are shown in Fig. 4 . Based
n the images, the typical particle sizes were determined to be
0–25 nm in diameter and 120–130 nm in diameter. Based on the
EM images, particles in both of these size ranges were spher-
cal. The observed diameters correspond well with the particle
ize distribution measured with the SMPS. Qualitative chemical
nalysis of the smaller particles, conducted by the EDS method
in Fig. 4 b), showed that the particles consisted of Si, Al, P, Fe,
a and Ti. Similar analysis for larger particles (in Fig. 4 c) showed
hat they consisted of Si, Al, P, Fe, Ca, Ti and Mg. Based on these
ualitative analyses, the major difference in the chemical com-
osition of particles was the existence of magnesium in larger
articles.
The SMPS measurement for the aerosol sample ( Fig. 3 c and
) produced a number size distribution of all particles in the
ize range of the instrument. However, by using the mini-ESP
pstream of the SMPS, the measurement produced the number
ize distribution of electrically neutral particles (i.e., electrically
harged particles were removed from the sample before the size
istribution measurement). The fraction of electrically charged
articles was then calculated by subtracting the concentrations
f electrically neutral particles from the concentrations of all
articles. This was made for the particle size range of 20–80
m in which range the particle concentrations were relatively
igh.
In addition to the results calculated from the measurements,
he theoretical charging probabilities were calculated with two
ifferent char ging probability functions: Boltzmann equilibrium
harge distribution [35] and Wiedensohler parametrization [36] .
oltzmann equilibrium charge distribution was calculated in
our different temperatures (293 K, 773 K, 1073 K and 1373 K),
ssuming 1–6 elemental charges of both polarities. The Boltz-
ann charging probabilities are shown in Fig. 5 with labels “B”.
igure 5 also includes the charging probability from Wiedensohler
arametrization at room temperature for one elemental charge
ith both polarities (“W1”) and for two elemental charges with
oth polarities (“W1+W2”).
In combustion studies, the amount of electric charge carried
y particles have been used as an indicator of the formation
emperature of the particles (Maricq [37] , Filippo and Maricq [38] ,
ähde et al. [39] , Alanen et al. [40] ). In this study, it was observed
hat the fraction of electrically charged particles in the studied
ize range was strongly particle size dependent (see Fig. 5 ), being

F. Mylläri et al. / Combustion and Flame 176 (2017) 554–566 561
Fig. 5. Fraction of electrically charged particles in the boiler super heater area.
Symbols are based on measurement and grey and blue lines denote the charging
probability according to Wiedensohler and Boltzmann at different temperatures.
(For interpretation of the references to colour in this figure legend, the reader is
referred to the web version of this article.)
a
D
t
C
s
o
f
f
l
t
p
W
A
s
t
r
p
c
W
b
d
c
a
t
p
8
t
e
a
c
s
2
B
t
d
f
s
4
p
m
c
o
m
c
c
b
o
r
p
a
H
t
d
k
i
c
t
e
f
c
s
p
s
g
c
t
p
o
f
r
T
o
I
s
t
o
p
o
F
p
f
p
c
n
i
p
p
T
s
p
b
p
t
s
s
a
s
w
pproximately 40% at 20 nm, 55% at 60 nm and 60% at 80 nm.
ue to the mean particle size near 25 nm, for coal combustion,
he fraction of electrically charged particles was, on average, 43%.
oal combustion originated particles 20–30 nm in diameter were
lightly less charged than the same sized coal-pellet-combustion
riginated particles. In addition, particles in size range 30–80 nm
rom “c+rp13.1%” combustion are also less charged than particles
rom coal or “c+ip” combustion. The charging probability calcu-
ated based on particle size distribution measurements was higher
han the charging probabilities calculated from Wiedensohler
arametrization. This result is thought to be expected because the
iedensohler parametrization is valid only at room temperatures.
ctually, the comparison of measurement results with Wieden-
ohler parametrization indicates that the particles carried three
o four times more electrical charge than the particles formed at
oom temperature.
When we took into account 1–4 elemental charges in one
article and calculated the Boltzmann charging probability, the
harging probability at room temperature was similar to the
iedensohler parametrization for the 20-nm particles in diameter,
ut closer the measurement results for the 80-nm particles in
iameter. However, when the Boltzmann charging probability was
alculated at elevated temperatures, the charging probability was
pproaching the charging probability that was calculated based on
he measurements. The best fit between the Boltzmann charging
robability and experimental results was gained at approximately
00 K. This similarity in charging probabilities at 800 K indicates
hat the particles have been formed at high temperatures. How-
ver, it has to be kept in mind that the Boltzmann temperature,
t particle sizes below 50 nm in diameter, must be interpreted
autiously. It is also known from the measurements that the
ample temperature after primary dilution was approximately
00 °C, which is less than the temperature predicted by the
oltzmann charging probability. This strongly supports the in-
erpretation above (related to the insensitivity of particle size
istribution on primary dilution ratio) that the particles were
ormed in the boiler before the primary dilution process of the
ample.
. Discussion
Fuel choices affect the aerosols released in combustion in
ower plants. The results of this study showed that coal–pellet
ixture combustion reduces SO 2 concentrations in flue gas in
omparison with pure coal combustion, which is reasonable based
n the chemical composition on the fuels. In addition, coal–pellet
ixture combustion reduced the concentrations of CO, and HCl
oncentrations so that the combustion was cleaner than the
ombustion of coal alone. Decrease of CO concentrations may
e caused for example by the oxygen content of pellet fuels
r changes of processes in combustion and flue gas. Additional
easons for the decrease in CO concentration could be the fuel
article size distribution, increased amount of volatile matter, but
lso using wood and, thus, improving the ignition of coal [41] .
owever, our data set does not offer unambiguous explanation for
he decreased CO concentration. CO 2 concentrations of the flue gas
id not change significantly because of fuel changes. It should be
eep in mind that the combustion of pellet–coal mixture reduces
ndirectly also the CO 2 emissions of the power plant due to the
arbon neutrality of the biomass pellets. In order to get informa-
ion regarding the total benefits from CO 2 perspective e.g., the CO 2
missions of fuel transportation should be taken into account.
In this study, the chemical composition of the particles sampled
rom the super heater area was very similar to all studied fuel
ombinations and, thus, it can be concluded that the 6–13% pellet
ubstitution may not increase the corrosion risk of the boiler or su-
er heaters. Nonetheless, the corrosion of boiler and super heater
urfaces is a complicated process affected by both the initially
aseous and particulate compounds, as well as the temperature
onditions in the boiler, and the detailed understanding of how
he fuel changes affect those requires more detailed studies.
Combustion aerosol particles have been previously studied in
ower plants mostly by measurements for the flue gas in the stack
r in duct before ESP. In this study, the particles were studied
rom the super heater area of the power plant. In general, the
esults are in line with previous studies made at the stack [42–45] .
he results indicated that fuel changes have not had major effects
n particle mass and the number size distributions of the flue gas.
n addition, results show very clearly that, with all fuel mixtures
tudied here, the particle number size distributions (from 9.8 nm
o 414 nm) were dominated by nanoparticles with a mean size
f approximately 25 nm. From the emission point of view, this
article size is problematic because, in general, electrical charging
f nanoparticles is not as efficient as the charging larger particles.
or example, Ylätalo et al. [46] have shown that sub-100 nm
articles penetrate through ESP. Thus, removal of these particles
rom the flue gas may require techniques other than electrostatic
recipitators (ESP). Compared to the combustion of coal only, the
ombustion of coal–pellet mixtures was observed to decrease the
umber concentration of nanoparticles and, in addition, slightly
ncrease the fraction of electrically charged nanoparticles. If the
ower plant is equipped with ESPs, both of these effects have the
otential to decrease the particle emissions into the atmosphere.
hus, from the viewpoint of flue gas cleaning and particle emis-
ions, the possible effects of co-combustion of coal and biomass
ellets seems to be more positive than negative.
The particle number size distribution measurements supported
y other measurements indicated that, for all fuel mixtures, the
articles were solid, chemically stable and a significant part of
hem was electrically charged. For one fuel mixture (over 10%
ubstitution of coal with industrial pellets), the particle number
ize distribution was observed to consist of two modes, and
ccording to TEM analyses, both of these modes consisted of
pherical particles. In general, although the particle measurements
ere made after diluting the flue gas sample and thus decreasing

562 F. Mylläri et al. / Combustion and Flame 176 (2017) 554–566
f
w
t
w
i
d
t
m
p
d
d
a
s
h
c
n
t
w
9
p
t
c
t
A
f
I
F
f
t
2
b
A
d
its temperature into the room temperature, the results strongly
indicate that the measured particles were formed at high tem-
perature conditions before the sampling and dilution process. In
addition to the chemical composition of the particles, this was
also indicated by the insensitivity of the particle size distribution
(number and size of particles) on the primary dilution ratio, as
well as by the observation that the measured particles carried
electric charge typical for high-temperature aerosol. Overall, the
fraction of neutral/charged particles is at the same level as pre-
viously reported by Maricq [37] for particles originating from
gasoline and diesel engines (data followed Boltzmann charge
distributions at 80 0–110 0 K). Thus, the measurement (sampling,
dilution, instrumentation) setup used in this study is suitable to
get information on particles existing in the high-temperature flue
gas. On the other hand, results indicate indirectly that the flue
gas from coal combustion and from the combustion of coal–pellet
mixtures do not include a lot of such gaseous compounds that can
directly condense on particle surfaces.
5. Conclusions
The transition from fossil fuel combustion to biomass combus-
tion has been started, although relevant policies to support this
transition are not yet in place. This study characterized how the
substitution of coal with pellets changes the flue gas composition
in the power plant super heater area. Gaseous components in the
flue gas are directly affected by the fuel chemical composition;
for example, the concentration of SO 2 and HCl were decreased
in the flue gas by pellet substitution. The fuel oxygen content
may improve the combustion which can be detected as lower CO
concentration in the flue gas.
In addition to changes in the gaseous compounds of the flue
gas, the particle chemical and physical properties might also be
affected by the fuel changes. In this study, it was detected that
the particle mass size distribution did not change significantly
between the studied pellet–coal mixtures. However, the PM10 var-
ied between 510 and 820 mg N m
−3 . The particle samples gained
rom the determination of the particle mass size distribution
ere further analysed. The elemental and ionic analysis showed
hat the chemical composition of the particles was quite similar
hich indicates that the pellet–coal mixtures in 6–13% does not
ncrease the corrosion risk. Even though the particle mass size
istributions were similar with all of the fuels that were studied,
he particle number size distributions have some differences,
eaning that the fuel affects the fine particles in the flue gas. The
rimary dilution ratio did not have an effect on the particle size
istribution, which indicates that the particles are formed before
ilution in the boiler. The particle number size distributions have
mean diameter of 25 nm, but with “c+ip10.5%” there is also a
econd mode at 120 nm in diameter. Although, the second mode
as 3 orders of magnitude lower particle number concentration
ompared to the 1st mode in 25 nm size. The bimodal particle
umber size distribution and, for “c+ip10.5%”, spherical shape of
he particles could be also identified from the TEM images. There
as also a difference in the particle number concentration (from
.8 nm to 414 nm); the coal combustion caused the highest total
article number concentrations (2.78 ·10 8 cm
−3 ) and the “c+rp”
he lowest (1.67 ·10 8 cm
−3 ), whereas the flue gas particle number
oncentrations for the coal–industrial pellet mixture were between
hese values (1.89 ·10 8 cm
−3 –2.20 ·10 8 cm
−3 ).
cknowledgments
The study was conducted in the MMEA WP 4.5.2. of Cleen Ltd.,
unded by Tekes (the Finnish Funding Agency for Technology and
nnovation). Dr. Mari Honkanen is acknowledged for TEM imaging.
.M. acknowledges TUT Graduate School , KAUTE-foundation , TES-
oundation for financial support. F.M., P.A. and T.R. acknowledges
he financial support from the Academy of Finland (ELTRAN Grant
93437 ). Juho Kauppinen is acknowledged for performing the
oiler sampling and the DLPI sample collections.
ppendix A. Standard deviation for the particle number size
istributions
F. Mylläri et al. / Combustion and Flame 176 (2017) 554–566 563
Fig. A.6. Standard deviations of the particle number size distributions measured with SMPS from the boiler super heater area.
564 F. Mylläri et al. / Combustion and Flame 176 (2017) 554–566
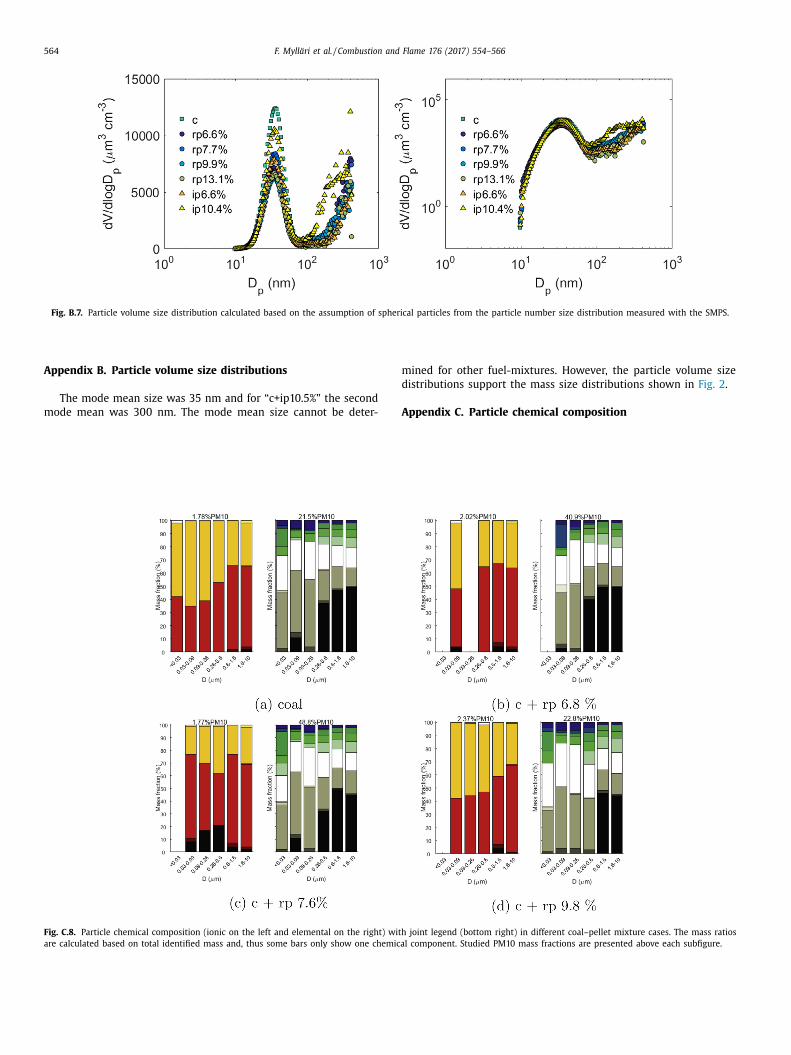
Fig. B.7. Particle volume size distribution calculated based on the assumption of spherical particles from the particle number size distribution measured with the SMPS.
m
d
Appendix B. Particle volume size distributions
The mode mean size was 35 nm and for “c+ip10.5%” the second
mode mean was 300 nm. The mode mean size cannot be deter- A
Fig. C.8. Particle chemical composition (ionic on the left and elemental on the right) with
are calculated based on total identified mass and, thus some bars only show one chemica
ined for other fuel-mixtures. However, the particle volume size
istributions support the mass size distributions shown in Fig. 2 .
ppendix C. Particle chemical composition
joint legend (bottom right) in different coal–pellet mixture cases. The mass ratios
l component. Studied PM10 mass fractions are presented above each subfigure.

F. Mylläri et al. / Combustion and Flame 176 (2017) 554–566 565
Fig. C.8. Continued
R
[
[
[
eferences
[1] U.S., The clean power plan, https://www.whitehouse.gov/climate-change ,
2015(accessed 24.11.15).
[2] U.K., 2010 to 2015 government policy: greenhouse gas emissions, https://www.gov.uk/government/publications/2010-to-2015-government-policy-
greenhouse- gas- emissions/2010- to- 2015- government- policy- greenhouse- gas- emissions , 2015(accessed 24.11.15).
[3] K.V. Shah, M.K. Cieplik, C.I. Betrand, W.L. van de Kamp, H.B. Vuthaluru, Corre-latind the effects of ash elements and their association in the fuel matrix with
the ash release during pulverized fuel combustion, Fuel Process. Technol. 91
(2010) 531–545, doi: 10.1016/j.fuproc.2009.12.016 . [4] B.M. Jenkins, L.L. Baxter, T.R. Miles Jr., T.R. Miles, Combustion properties of
biomass, Fuel Process. Technol. 54 (1998) 17–46. [5] T. Sorvajärvi , N. DeMartini , J. Rossi , J. Toivonen , In situ measurement technique
for simultaneous detection of K, KCl, and KOH vapours released during com-bustion of solid biomass fuel in a single particle reactor, Appl. Spectrosc. 68
(2014) 179–184 .
[6] H.P. Nielsen , F.J. Frandsen , K. Dam-Johansen , L.L. Baxter , The implications ofchlorine-associated corrosion on the operation of biomass-fired boilers, Prog.
Energy Combust. Sci. 26 (20 0 0) 283–298 . [7] H. Kuuluvainen , P. Karjalainen , C.J.E. Bajamundi , J. Maunula , P. Vainikka ,
J. Roppo , J. Keskinen , T. Rönkkö, Physical properties of aerosol particles mea-sured from a bubbling fluidized bed boiler, Fuel 139 (2015) 144–153 .
[8] A. Leppänen, H. Tran, R. Taipale, E. Välimäki, A. Oksanen, Numerical modeling
of fine particle and deposit formation in a recovery boiler, Fuel 129 (2014) 45–53, doi: 10.1016/j.fuel.2014.03.046 .
[9] Y. Ninomiya, L. Zhang, A. Sato, Z. Dong, Influence of coal particle size on par-ticulate matter emission and its chemical species produced during coal com-
bustion, Fuel Process. Technol. 85 (2004) 1065–1088, doi: 10.1016/j.fuproc.2003.10.012 .
[10] Y. Zhuang , Y.J. Kim , T.G. Lee , P. Biswas , Experimental and theorethical studies of
ultra-fine particles behavior in electrostatic precipitators, J. Electrost. 48 (20 0 0)245–260 .
[11] A. Suriyawong, C.J. Hogan, J. Jiang, P. Biswas, Charged fraction and electrostaticcollection of ultrafine and submicrometer particles formed during O 2 –CO 2 coal
combustion, Fuel 87 (6) (2007) 673–682, doi: 10.1016/j.fuel.2007.07.024 . [12] United Nations Economic Commission for Europe [UN-ECE ], 1999 protocol
to abate acidification, eutrophication and ground-level ozone to the conven-tion on long-range transboundary air pollution, as amended on 4 May 2012,
ECE/EB. AIR/114, United Nations Economic Commission for Europe [UN-ECE], 6
May 2013.
[13] The European Parliament and the European Council, On the limitation of emis-sions of certain pollutants into the air from large combustion plants, Directive
2001/80/EC, The European Parliament and the European Council, 23 October2001.
[14] The European Parliament and the European Council, On industrial emissions(integrated pollution prevention and control) (Recast), Directive 2010/75/EU,
The European Parliament and the European Council, 17 December 2010.
[15] The European Parliament and the European Council, On the limitation of emis-sions of certain pollutants into the air from medium combustion plants, Di-
rective 2015/2193, The European Parliament and the European Council, 28November 2015.
[16] The European Industrial Bioenergy Initiative, Boosting the contribution ofBioenergy to the EU climate and energy ambitions: implementationplan 2013–
2017, Version of 24 January 2014, p. 3. https://setis.ec.europa.eu/system/files/
Bioenergy%20EII%202013-2017%20IP.pdf [17] The European Commission, State of play on the sustainability of solid and
gaseous biomass used for electricity, heating and cooling in the EU, SWD(2014)259 final, The European Commission, Brussels, 28 July 2014, p. 5.
[18] The European Commission, Technology assessment: accompanying the docu-ment energy technologies and innovation, COM(2013) 253 final, The European
Commission, 2 May 2013, pp. 23, 25.
[19] The European Commission, Impact assessment: accompanying document tothe report from the Commission to the Council and the European Parlia-
ment on sustainability requirements for the use of solid and gaseous biomasssources in electricity, heating and cooling, COM(2010) 11 final, The European
Commission, Brussels, 25 February 2010, pp. 21, 42–43. 20] National Energy Technology Laboratory, Role of alternative energy sources:
pulverized coal and biomass co-firing technology assessment, DOE/NETL-
2012/1537, National Energy Technology Laboratory, August 30, 2012, p. VII. [21] Biomass R&D Board, “The Federal Activities Report on the Bioeconomy”, 2016,
pp. 34–35. http://www.biomassboard.gov/pdfs/farb _ 2 _ 18 _ 16.pdf 22] Environmental Protection Agency, Carbon pollution emission guidelines for ex-
isting stationary sources: electric utility generating units; final rule, Fed. Reg-ist. 80 (205) (2015) 64885, 64804(October 23, 2015, Friday).
23] G. Barbose, Renewables portfolio standards in the united states: a status up-date, State-Federal RPS Collaborative National Summit on RPS, Washington,
D.C., November 6 2013, Environmental Protection Agency (2013), p. 9 . https:
//www.epa.gov/sites/production/files/2015- 08/documents/cpp- final- rule.pdf . [24] M. Aho, P. Vainikka, R. Taipale, P. Yrjas, Effective new chemicals to prevent
corrosion due to chlorine in power plant superheaters, Fuel 87 (2008) 647–654 . http://dx.doi.org/10.1016/j.fuel.2007.05.033

566 F. Mylläri et al. / Combustion and Flame 176 (2017) 554–566
[
[25] J. Keskinen , K. Pietarinen , M. Lehtimäki , Electrical low pressure impactor, J.Aerosol Sci. 23 (1992) 353–360 .
[26] S.C. Wang , R.C. Flagan , Scanning electrical mobility spectrometer, Aerosol Sci.Technol. 13 (1990) 230–240 .
[27] W.C. Hinds , Aerosol technology properties, behavior, and measurement of air-borne particles, 2nd ed., John Wiley & Sons, 1999 . Eqs. (7-31) and (7-32))
[28] A.K. Frey , K. Saarnio , H. Lamberg , F. Mylläri , P. Karjalainen , K. Teinilä, S. Car-bone , J. Tissari , V. Niemelä, A. Häyrinen , J. Rautiainen , J. Kytömäki , P. Artaxo ,
A. Virkkula , L. Pirjola , T. Rönkkö, J. Keskinen , J. Jokiniemi , R. Hillamo , Optical
and chemical characterization if aerosols emitted from coal, heavy and lightfuel oil, and small-scale wood combustion, Environ. Sci. Technol. 48 (2014)
827–836 . [29] E.I. Kauppinen , Aerosol formation in coal combustion processes, J. Aerosol Sci.
22 (1991) S451–S454 . (Suppl. 1) [30] U. Mathis, J. Ristimäki, M. Mohr, J. Keskinen, L. Ntziachristos, Z. Samaras,
P. Mikkanen, Sampling conditions for the measurement of nucleation mode
particles in the exhaust of a diesel vehicle, Aerosol Sci. Technol. 38 (12) (2004)1149–1160, doi: 10.1080/027868290891497 .
[31] I. Abdul-Khalek, D. Kittelson, F. Brear, 1999, The influence of dilution condi-tions on diesel exhaust particle size distribution measurements, SAE Technical
Paper 1999-01-1142, SAE, 10.4271/1999-01-1142. [32] J. Ristimäki , A. Virtanen , M. Marjamäki , A. Rostedt , J. Keskinen , On-line mea-
surement of size distribution and effective density of submicron aerosol parti-
cles, J. Aerosol Sci. 33 (11) (2004) 1541–1557 . [33] A. Virtanen , J. Ristimäki , J. Keskinen , Method for measuring effective density
and fractal dimension of aerosol agglomerates, Aerosol Sci. Technol. 38 (5)(2004) 437–446 .
[34] W.M. Haynes (Ed.), CRC Handbook of Chemistry and Physics, 96th Edition (In-ternet Version 2015-2016), CRC Press/Taylor & Francis, Boca Raton, FL, 2011,
pp. 4–88 .
[35] W.C. Hinds , Aerosol technology properties, Behavioir, and Measurement of Air-borne Particles, 2nd ed., John Wiley & Sons (1999) .
[36] A. Wiedensohler , An approximation of the bipolar charge distribution for par-ticles in the submicron size range, J. Aerosol Sci. 19 (3) (1988) 387–389 .
[37] M.M. Maricq , On the electrical charge of motor vehicle exhaust particles,Aerosol Sci. 37 (2006) 858–874 .
[38] A.D. Filippo , M.M. Maricq , Diesel nucleation mode particles: semi-volatile orsolid? Environ. Sci. Technol. 42 (2008) 7957–7962 .
[39] T. Lähde , T. Rönkkö, A. Virtanen , T.J. Schuck , L. Pirjola , K. Hämeri , M. Kulmala ,F. Arnold , D. Rothe , J. Keskinen , Heavy duty diesel engine exhaust aerosol par-
ticle and ion measurements, Environ. Sci. Technol. 43 (2009) 163–168 . [40] J. Alanen , E. Saukko , K. Lehtoranta , T. Murtonen , H. Timonen , R. Hillamo , P. Kar-
jalainen , H. Kuuluvainen , J. Harra , J. Keskinen , T. Rönkkö, The formation and
physical properties of the particle emissions from a natural gas engine, Fuel162 (2015) 155–161 .
[41] A. Gani , K. Morishita , K. Nishikawa , I. Naruse , Characteristics of co-combustionof low-rank coal with biomass, Energy Fuel 19 (2005) 1652–1659 .
[42] J. Joutsensaari , E.I. Kauppinen , P. Ahonen , T.M. Lind , S.I. Ylätalo , J.K. Jokiniemi ,J. Hautanen , M. Kilpeläinen , Aerosol formation in real scale pulverized coal
combustion, J. Aerosol Sci. 23 (1992) S241–S244 . (Suppl. 1)
[43] H. Yi , J. Hao , L. Duan , X. Tanf , P. Ning , X. Li , Fine particle and trace elementemissions from an anthracite coal-fired power plant equipped with a bag–
house in China, Fuel 87 (2008) 2050–2057 . 44] H. Wu , A.J. Pedersen , P. Glarborg , F.J. Frandsen , K. Dam-Johansen , B. Sander ,
Formation of fine particles in co-combustion of coal and solid recoveredfuel in a pulverized coal-fired power station, Proc. Combust. Inst. 33 (2011)
2845–2852 .
[45] F. Mylläri, E. Asmi, T. Anttila, E. Saukko, V. Vakkari, L. Pirjola, R. Hillamo, T.Laurila, A. Häyrinen, J. Rautiainen, H. Lihavainen, E. O’Connor, V. Niemelä, J.
Keskinen, M.D. Maso, T. Rönkkö, New particle formation in the fresh flue-gasplume from a coal-fired power plant: effect of flue-gas cleaning, Atmos. Chem.
Phys. 16 (2016) 1–12. [46] S.I. Ylätalo, J. Hautanen, Electrostatic precipitator penetration function for pul-
verized coal combustion, Aerosol Sci. Technol. 29 (1) (1998) 17–30, doi: 10.
1080/02786829808965547 .