physical agents evaluation
TRANSCRIPT
Assessment, Evaluation and control of physical agents in Metroland Media Group
OHS314 Physical Agents
Submitted to: Dr. AbdoliEramaki
Submitted by:
Abdel Hameed Adra AbdurRehman Khawaja
Harleen Panfer Haroun Khokar Rabioul Hassan
Simon Li
Introduction Physical agents such as noise, light, heat and cold, and vibrations are present at every workplace. Each of these agents can be measured and observed by an expert in this field and the data displayed in charts or tables to compare and ensure proper standards are met and to help reduce all physical agents’ related occupational hazards. To apply what was learned in the course we conducted our final project at Metroland Media Group, located at 10 Tempo Ave., Toronto, ON. Our contact was the pressroom supervisor, Mr. Scott Reis, who eagerly guided us around the worksite. Scope of the report Our focus was mainly on getting a sound level meter reading around the red printing press and inside the supervisors office and creating a sound map. The sound level map will show the areas of high and low sound pressures where the workers normally execute their tasks. Dosimetry measurements were taken around the red press at various locations and in the lunch room for five minute intervals to determine total noise exposure a single worker is exposed to in a ten hour shift. The dry bulb, wet bulb, globe temperature and air velocity readings were taken around the red press in order to calculate the World Bulb Globe Temperature (WBGT) and the heat stress that workers are exposed to. A photometry was also conducted to determine whether there is adequate lighting present to ensure the work can be done efficiently and without strain to the eye. Methods and Materials The Sound Level Meter, Soundtrack LxT from Larson Davis, was assembled by attaching the microphone to the main body, confirmed by a click when placed correctly. The cap of the microphone was removed and the round sponge was attached to its end which eliminates wind and inflated readings. Once turned on, the SLM settings were set to ‘A’ for Frequency Weighting, ‘Slow’ for Detector, ‘A’ for Peak Weighing, and ‘Linear’ for Integration Method. To create a successful sound map around the only working machine at the time of visit, the ‘Red Press’, a general floor map of the area surrounding the machinery was drawn. Determining that taking the readings with the SLM close to ear height of the operator at an arms distance was adequate for the purposes of the project. Before starting to take the readings, the pressroom supervisor, Mr. Reis provided us with foot guards that would serve as foot protection and a pair of 3M OPTIME 101 Peltor ear muffs that have a Noise reduction rating of 27 dB. Without these two personal protective equipment one is forbidden to operate or come near the machine. The workers were also wearing overalls that covered the arms and legs fully, wore gloves that provided extra grip, and have eye protection. Multiple readings were taken around the perimeter of the press at the closest distance an employee stands from the press, 1 meter, 2 meters and where possible upto 5 meters away. The recordings
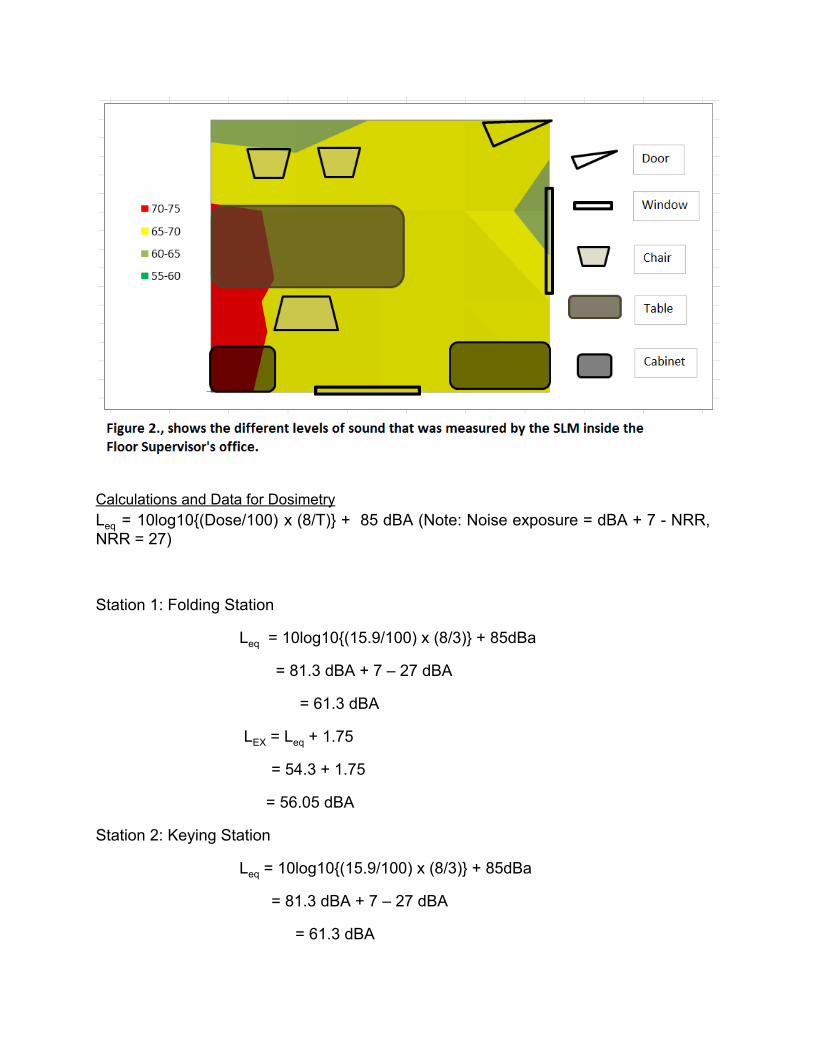
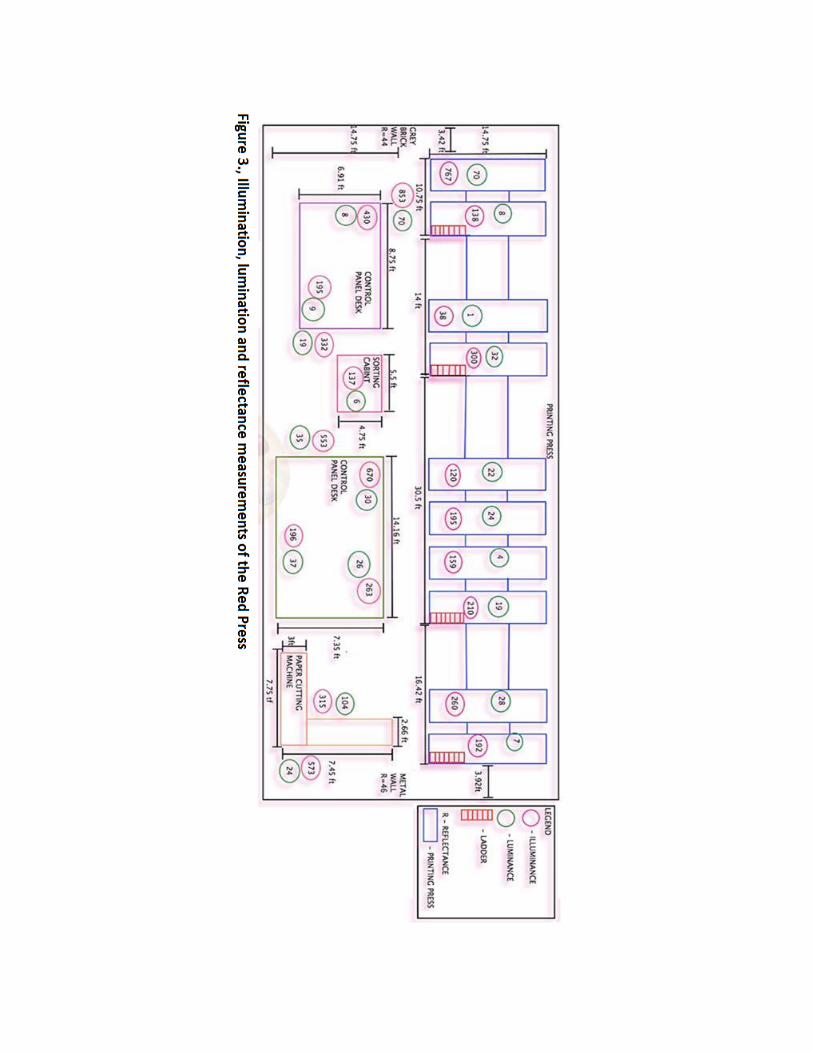
were plotted on excel, and the results shown in figure 1. Another sound map was created of the Floor Supervisor’s office and the results shown in figure 2. The noise dosimeter, from Brüel & Kjær, was used to measure sound level exposure over time. The dosimeter is calibrated for “A” weighting and clipped to the collar of an employee who would then continue to perform their job. Measurements were recorded in six stations. Station 1 was the Folding station, station 2 was the Key station, station 3 was the Rolling station, station 4 was the Webbing Station, Station 5 was the Console Station and station 6 was the lunch room. Each station was recorded at varying distances from the source, depending on the type of work that needed to be done. The employee with the dosimeter attached would stay and perform normal tasks for five minutes at each station while the dosimeter was recording. After 5 minutes, the worker would have the dosimeter taken off and the results were recorded. The results are then to be compared against the estimated time a worker will spend at each station, and extrapolated on, to provide an accurate representation of the noise dose received by the worker. The workers were all wearing 3M Optime 101 Peltor ear muffs which has a noise reduction of 27 dB. The data is shown in table 1. The device used to measure the illumination and luminance was the photometer. The experiment began by attaching the light sensor to the photometer and taking the cover off of the light sensor. The device was then turned on and it was made sure that the unit was set to “Lux.” The photometer that was used to conduct this experiment was an OEM Smart Sensor Model AR823. We began by analyzing the second half of the printing press room which was not in operation and that gave us the perfect opportunity to move around and measure as effectively as possible. The operation of the printing press was a complete indoor operation, and no windows were present so no natural light was coming into the room. After analyzing the room, the area was plotted out on a piece of paper and we began taking measurements. We started taking measurements by placing the digital lux meter over work stations and areas where workers might read numbers off a meter. We made sure that the device was placed horizontally and that we stood as far away from the device as possible. After placing the device horizontally, we turned the digital lux meter around 180 degrees to measure the luminance. The digital lux meter was placed over 10 printing press machines, 1 conveyer, 2 control panels with buttons and a computer on them, a sorting cabinet and a paper cutting machine. Each printing press machine had 6 light fixtures built into them, 3 on the front and 3 on the back. After measuring both the illuminance and the luminance on 21 work stations, we proceeded to measure the reflection of the wall. One side of the room seemed to be made a grey brick wall, and the other side of the room seemed to be covered by a certain type of metal. The illuminance, luminance and reflectance of the surfaces data is shown in table 4. A floor map of fixtures and the readings of the surfaces of the Red Press is shown in figure 3.
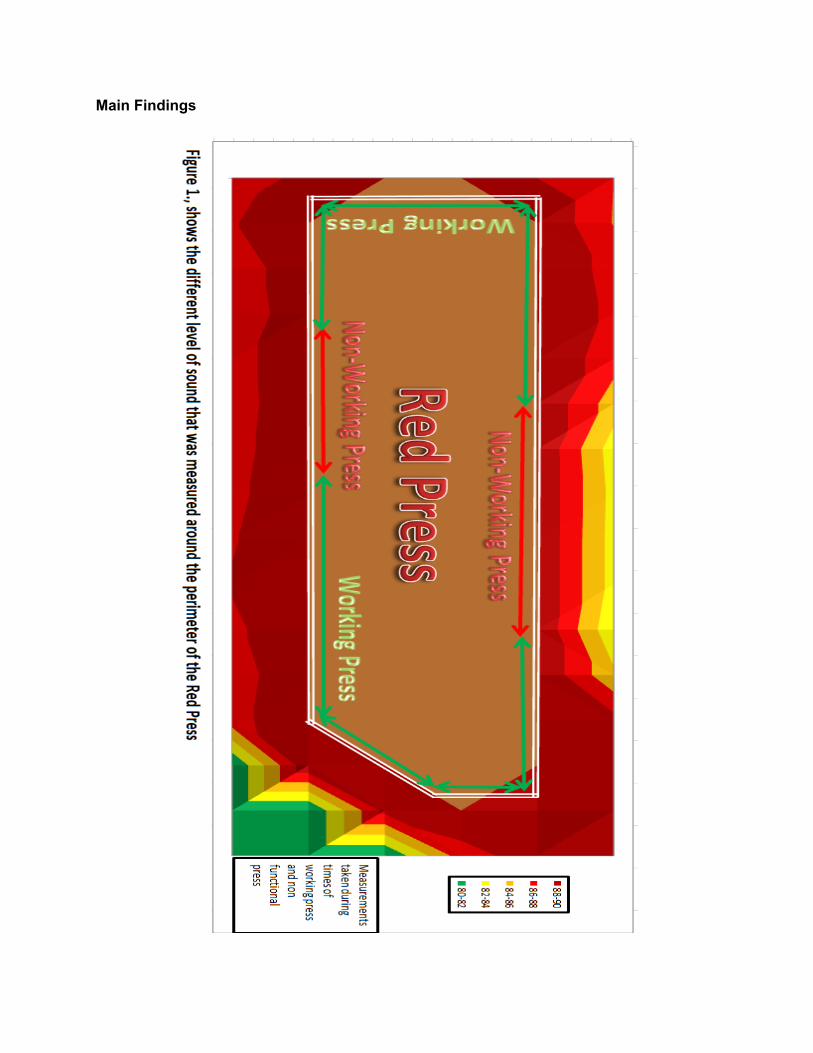
Main Findings
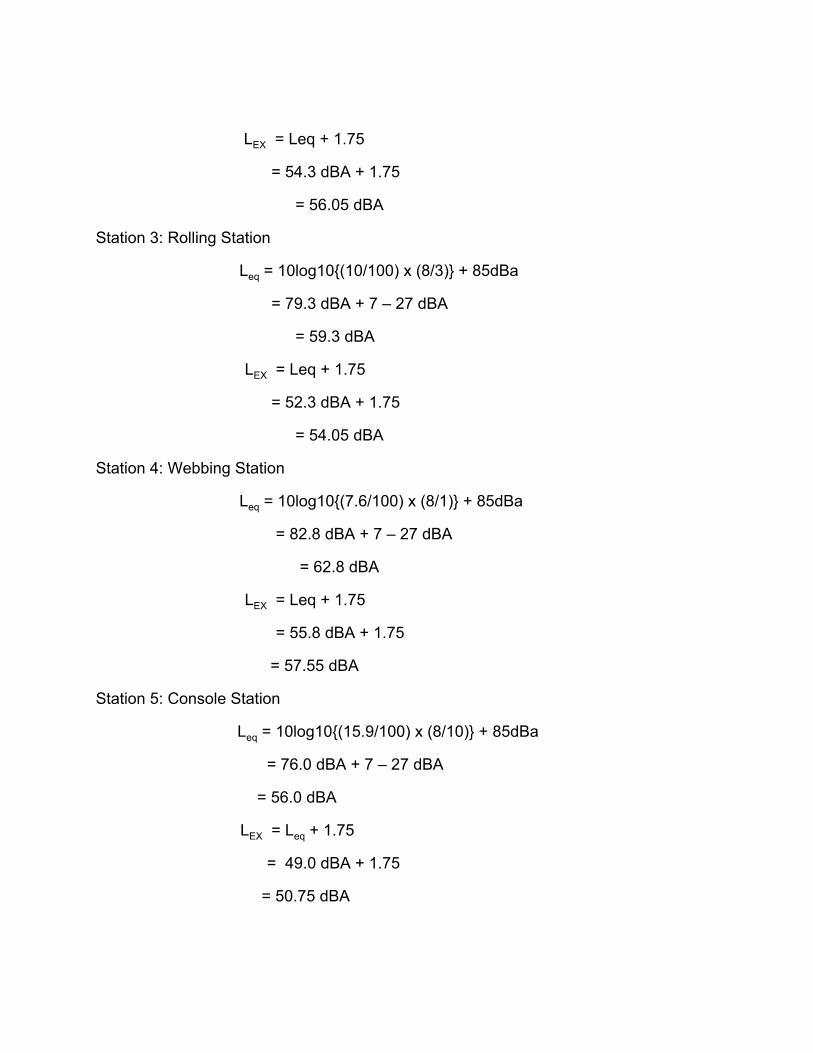
Calculations and Data for Dosimetry Leq = 10log10(Dose/100) x (8/T) + 85 dBA (Note: Noise exposure = dBA + 7 NRR, NRR = 27)
Station 1: Folding Station
Leq = 10log10(15.9/100) x (8/3) + 85dBa
= 81.3 dBA + 7 – 27 dBA
= 61.3 dBA
LEX = Leq + 1.75
= 54.3 + 1.75
= 56.05 dBA
Station 2: Keying Station
Leq = 10log10(15.9/100) x (8/3) + 85dBa
= 81.3 dBA + 7 – 27 dBA
= 61.3 dBA
LEX = Leq + 1.75
= 54.3 dBA + 1.75
= 56.05 dBA
Station 3: Rolling Station
Leq = 10log10(10/100) x (8/3) + 85dBa
= 79.3 dBA + 7 – 27 dBA
= 59.3 dBA
LEX = Leq + 1.75
= 52.3 dBA + 1.75
= 54.05 dBA
Station 4: Webbing Station
Leq = 10log10(7.6/100) x (8/1) + 85dBa
= 82.8 dBA + 7 – 27 dBA
= 62.8 dBA
LEX = Leq + 1.75
= 55.8 dBA + 1.75
= 57.55 dBA
Station 5: Console Station
Leq = 10log10(15.9/100) x (8/10) + 85dBa
= 76.0 dBA + 7 – 27 dBA
= 56.0 dBA
LEX = Leq + 1.75
= 49.0 dBA + 1.75
= 50.75 dBA
Station 6: Lunch Room
Leq = 10log10(0.01/100) x (8/1) + 85dBa
= 54.0 dBA
LEX = Leq + 1.75
= 54.0 + 1.75
= 55.75 dBA (no headphones were used in the lunch room)
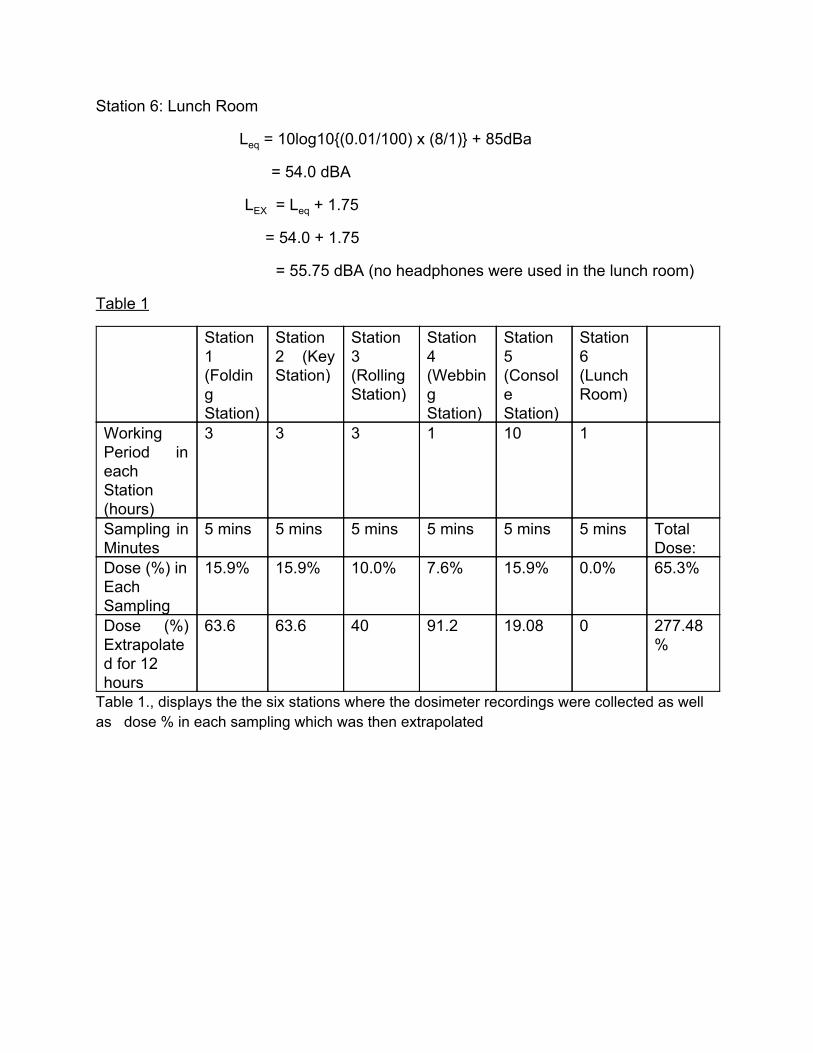
Table 1
Station 1 (Folding Station)
Station 2 (Key Station)
Station 3 (Rolling Station)
Station 4 (Webbing Station)
Station 5 (Console Station)
Station 6 (Lunch Room)
Working Period in each Station (hours)
3 3 3 1 10 1
Sampling in Minutes
5 mins 5 mins 5 mins 5 mins 5 mins 5 mins Total Dose:
Dose (%) in Each Sampling
15.9% 15.9% 10.0% 7.6% 15.9% 0.0% 65.3%
Dose (%) Extrapolated for 12 hours
63.6 63.6 40 91.2 19.08 0 277.48%
Table 1., displays the the six stations where the dosimeter recordings were collected as well as dose % in each sampling which was then extrapolated
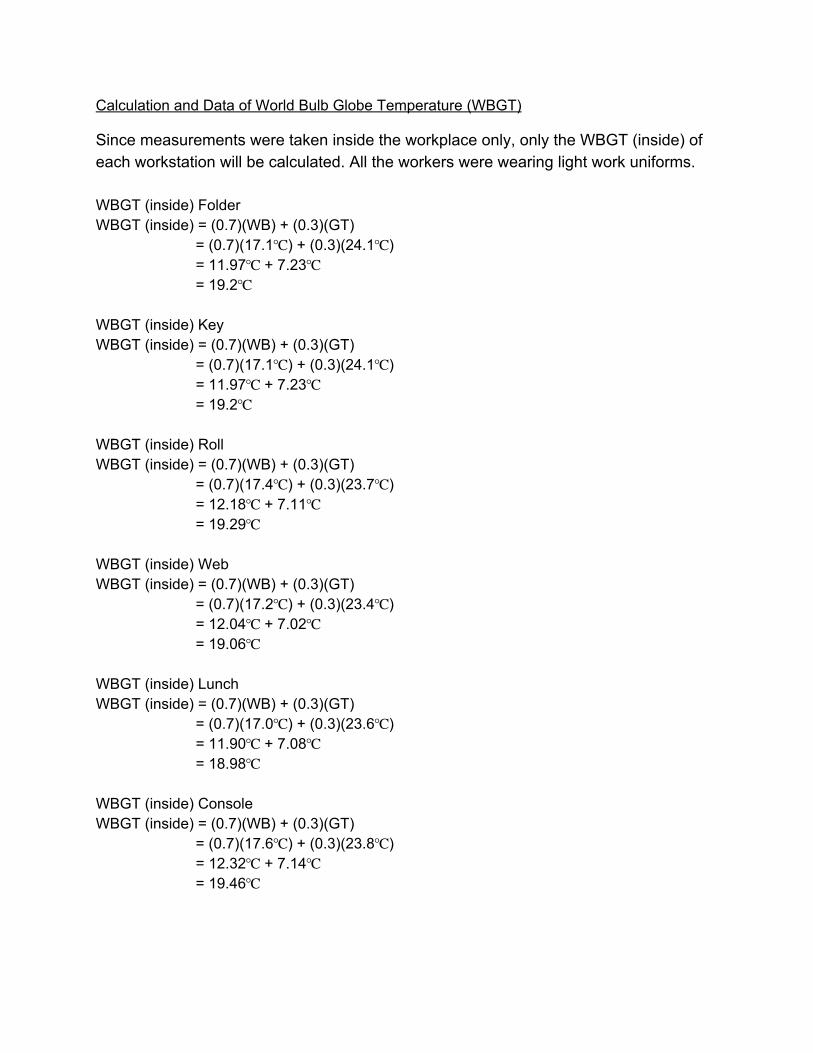
Calculation and Data of World Bulb Globe Temperature (WBGT)
Since measurements were taken inside the workplace only, only the WBGT (inside) of each workstation will be calculated. All the workers were wearing light work uniforms. WBGT (inside) Folder WBGT (inside) = (0.7)(WB) + (0.3)(GT)
= (0.7)(17.1) + (0.3)(24.1) = 11.97 + 7.23 = 19.2
WBGT (inside) Key WBGT (inside) = (0.7)(WB) + (0.3)(GT)
= (0.7)(17.1) + (0.3)(24.1) = 11.97 + 7.23 = 19.2
WBGT (inside) Roll WBGT (inside) = (0.7)(WB) + (0.3)(GT)
= (0.7)(17.4) + (0.3)(23.7) = 12.18 + 7.11 = 19.29
WBGT (inside) Web WBGT (inside) = (0.7)(WB) + (0.3)(GT)
= (0.7)(17.2) + (0.3)(23.4) = 12.04 + 7.02 = 19.06
WBGT (inside) Lunch WBGT (inside) = (0.7)(WB) + (0.3)(GT)
= (0.7)(17.0) + (0.3)(23.6) = 11.90 + 7.08 = 18.98
WBGT (inside) Console WBGT (inside) = (0.7)(WB) + (0.3)(GT)
= (0.7)(17.6) + (0.3)(23.8) = 12.32 + 7.14 = 19.46
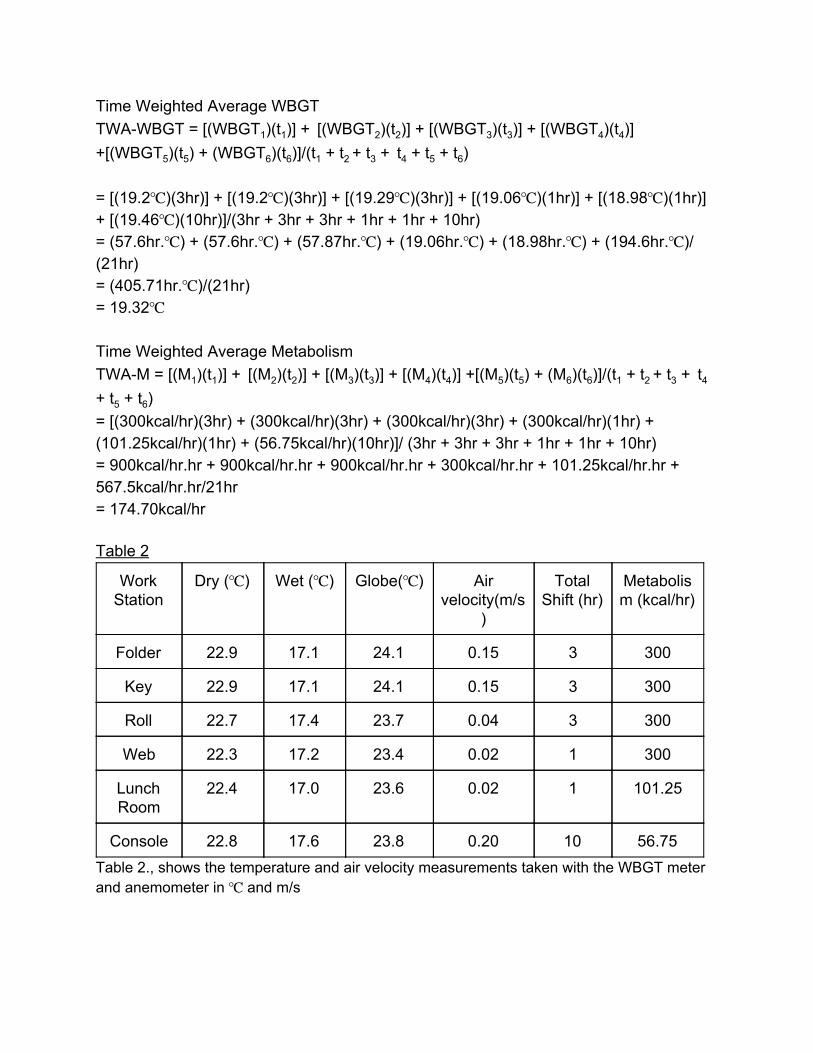
Time Weighted Average WBGT TWAWBGT = [(WBGT1)(t1)] + [(WBGT2)(t2)] + [(WBGT3)(t3)] + [(WBGT4)(t4)] +[(WBGT5)(t5) + (WBGT6)(t6)]/(t1 + t2 + t3 + t4 + t5 + t6) = [(19.2)(3hr)] + [(19.2)(3hr)] + [(19.29)(3hr)] + [(19.06)(1hr)] + [(18.98)(1hr)] + [(19.46)(10hr)]/(3hr + 3hr + 3hr + 1hr + 1hr + 10hr) = (57.6hr.) + (57.6hr.) + (57.87hr.) + (19.06hr.) + (18.98hr.) + (194.6hr.)/ (21hr) = (405.71hr.)/(21hr) = 19.32 Time Weighted Average Metabolism TWAM = [(M1)(t1)] + [(M2)(t2)] + [(M3)(t3)] + [(M4)(t4)] +[(M5)(t5) + (M6)(t6)]/(t1 + t2 + t3 + t4 + t5 + t6) = [(300kcal/hr)(3hr) + (300kcal/hr)(3hr) + (300kcal/hr)(3hr) + (300kcal/hr)(1hr) + (101.25kcal/hr)(1hr) + (56.75kcal/hr)(10hr)]/ (3hr + 3hr + 3hr + 1hr + 1hr + 10hr) = 900kcal/hr.hr + 900kcal/hr.hr + 900kcal/hr.hr + 300kcal/hr.hr + 101.25kcal/hr.hr + 567.5kcal/hr.hr/21hr = 174.70kcal/hr Table 2
Work Station
Dry () Wet () Globe() Air velocity(m/s
)
Total Shift (hr)
Metabolism (kcal/hr)
Folder 22.9 17.1 24.1 0.15 3 300
Key 22.9 17.1 24.1 0.15 3 300
Roll 22.7 17.4 23.7 0.04 3 300
Web 22.3 17.2 23.4 0.02 1 300
Lunch Room
22.4 17.0 23.6 0.02 1 101.25
Console 22.8 17.6 23.8 0.20 10 56.75 Table 2., shows the temperature and air velocity measurements taken with the WBGT meter and anemometer in and m/s
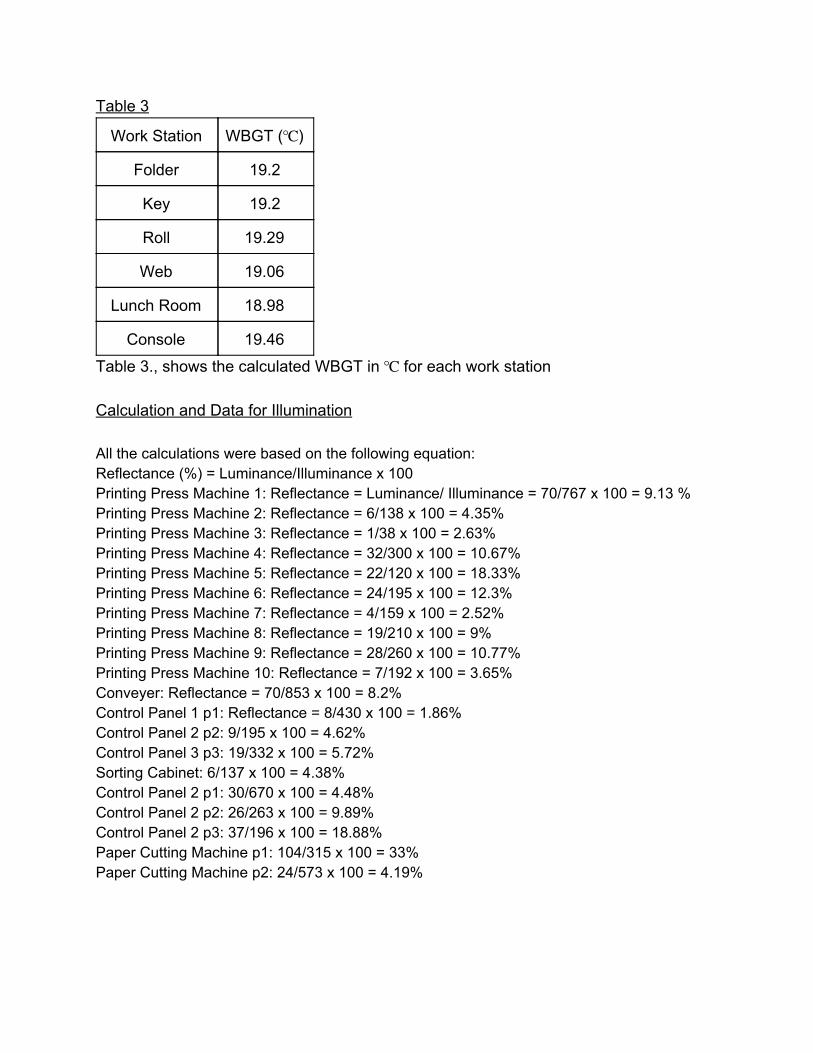
Table 3
Work Station WBGT ()
Folder 19.2
Key 19.2
Roll 19.29
Web 19.06
Lunch Room 18.98
Console 19.46 Table 3., shows the calculated WBGT in for each work station Calculation and Data for Illumination All the calculations were based on the following equation: Reflectance (%) = Luminance/Illuminance x 100 Printing Press Machine 1: Reflectance = Luminance/ Illuminance = 70/767 x 100 = 9.13 % Printing Press Machine 2: Reflectance = 6/138 x 100 = 4.35% Printing Press Machine 3: Reflectance = 1/38 x 100 = 2.63% Printing Press Machine 4: Reflectance = 32/300 x 100 = 10.67% Printing Press Machine 5: Reflectance = 22/120 x 100 = 18.33% Printing Press Machine 6: Reflectance = 24/195 x 100 = 12.3% Printing Press Machine 7: Reflectance = 4/159 x 100 = 2.52% Printing Press Machine 8: Reflectance = 19/210 x 100 = 9% Printing Press Machine 9: Reflectance = 28/260 x 100 = 10.77% Printing Press Machine 10: Reflectance = 7/192 x 100 = 3.65% Conveyer: Reflectance = 70/853 x 100 = 8.2% Control Panel 1 p1: Reflectance = 8/430 x 100 = 1.86% Control Panel 2 p2: 9/195 x 100 = 4.62% Control Panel 3 p3: 19/332 x 100 = 5.72% Sorting Cabinet: 6/137 x 100 = 4.38% Control Panel 2 p1: 30/670 x 100 = 4.48% Control Panel 2 p2: 26/263 x 100 = 9.89% Control Panel 2 p3: 37/196 x 100 = 18.88% Paper Cutting Machine p1: 104/315 x 100 = 33% Paper Cutting Machine p2: 24/573 x 100 = 4.19%
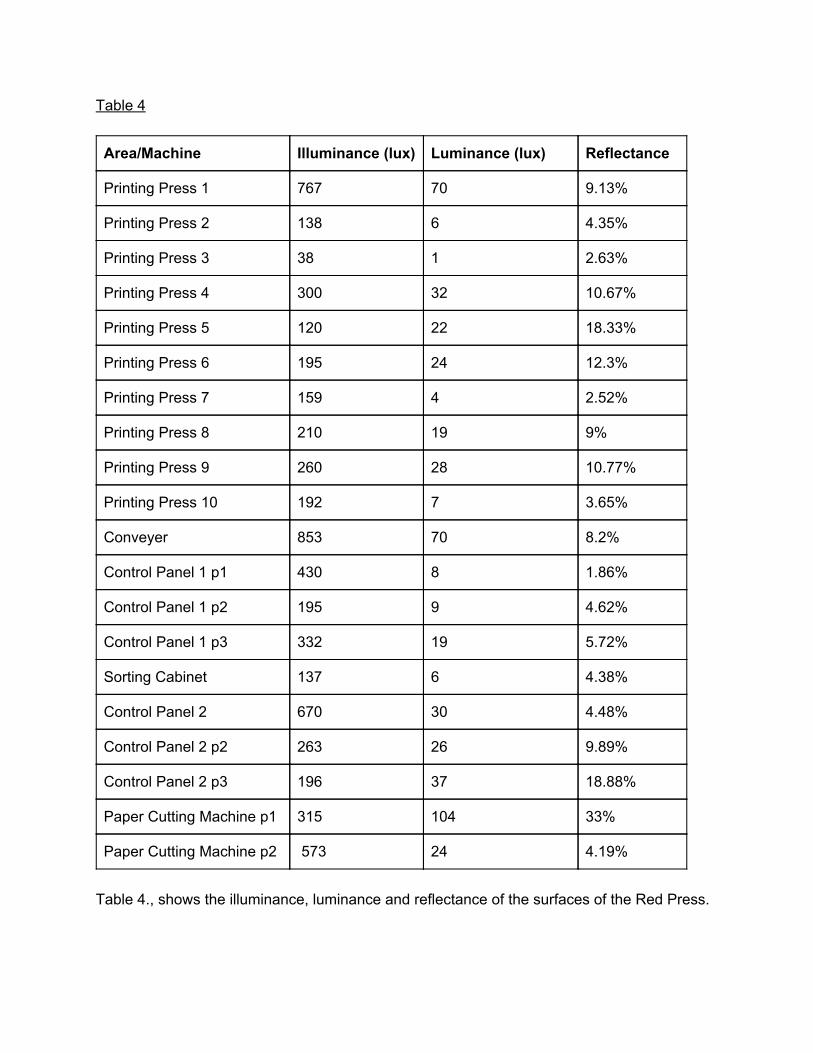
Table 4
Area/Machine Illuminance (lux) Luminance (lux) Reflectance
Printing Press 1 767 70 9.13%
Printing Press 2 138 6 4.35%
Printing Press 3 38 1 2.63%
Printing Press 4 300 32 10.67%
Printing Press 5 120 22 18.33%
Printing Press 6 195 24 12.3%
Printing Press 7 159 4 2.52%
Printing Press 8 210 19 9%
Printing Press 9 260 28 10.77%
Printing Press 10 192 7 3.65%
Conveyer 853 70 8.2%
Control Panel 1 p1 430 8 1.86%
Control Panel 1 p2 195 9 4.62%
Control Panel 1 p3 332 19 5.72%
Sorting Cabinet 137 6 4.38%
Control Panel 2 670 30 4.48%
Control Panel 2 p2 263 26 9.89%
Control Panel 2 p3 196 37 18.88%
Paper Cutting Machine p1 315 104 33%
Paper Cutting Machine p2 573 24 4.19%
Table 4., shows the illuminance, luminance and reflectance of the surfaces of the Red Press.
Results and Comparison The SLM was used at various points in order to create the floor map shown in figure 1 and figure 2. The distance the employees work vary throughout the shift, but most of the work is done within a meters’ distance of the Red Press. Majority of the readings closest to the press were greater than 85 dBA. Although some of the parts of the press were off while the readings were being taken, it is safe to assume that even if the parts were operational the sound level would be + 0.5 dB 1 dB as it was not a very significant increase in the noise produced. This is due to the logarithmic properties of sound measurement. The lowest recorded value was 82.4 dBA which was at about a distance of 5 meters away and the highest recorded value was 90.6 dBA and recorded at a point directly adjacent to the motor of the Red Press. The employees must always wear protective equipment to safeguard their hearing and bodies. To significantly decrease the impact on the employees ears, they are equipped with 3M Optime 101 Peltor ear muffs that has a noise reduction rating of 27 dB. Therefore, even though the SLM read 90.6 dBA, an employees ear would only hear the noise at 64 dB, which is much below Ontario standards. In table 1, the working period refers to the amount of hours a worker would be working over a period of time. For example, a worker would be working at station 1 for about 3 hours of a 12 hour shift. However, instead of recording 12 hours’ worth of data, only 5 minutes worth of data was collected from each station to then be extrapolated. To further illustrate, a worker would be at station 2 for 3 hours over the course of a 12 hour shift. Another piece of data from the table is the sampling in minutes. This refers to the amount of time the data was recorded for per station. Next, in table 1 the dose (%) in each sampling was recorded. This value was recorded through the use of a dosimeter which was attached to a worker who then continued working their shift. Finally, the last piece of data from table 1 is the dose (%) that was extrapolated for 12 hours. This extrapolated value is the most accurate way of describing the conditions that a worker will face over 10 hours of work exposure without actually recording for 10 hours of actual work. In addition, results were taken from 5 work stations and then the lunch room which was classified as station 6 in Table 1. In Table 2 the measurements shown are the recorded dry bulb, wet bulb, globe temperature and air velocity readings. These measurements were taken at each of the workstations. After all the recordings were taken, the WBGT of each workplace was calculated. The WBGT (inside) equation which is, WBGT (inside) = (0.7)(WB) + (0.3)(GT), in degree celsius was only calculated since all the work areas were inside the facility. The Time Weighted Average (TWA) WBGT shows the average WBGT of the entire workplace in a single work day. The equation takes into account every WBGT for each workstation in degree celsius and and the time spent at each station in hours. Table 3 shows the overall calculated WBGT for each work station. The WBGT values are relatively close to each other since the workstations were within relatively close proximity of each other. Furthermore, the workplace was large and had adequate ventilation for the workers. This means worker were comfortable since they were not working in hot and cramped conditions, keeping the level of heat stress at low levels.
Another factor that kept heat stress levels low was that the workers were not doing any overly strenuous work, but rather light, moderate work. The Time Weighted Average WBGT equates to 19.32. The minimum standard WBGT for an enclosed industrial workplace such as Metroland Media in Ontario is 18 based on ACGIH standards. This means that the workplace meets the minimum required WBGT for this workplace. Furthermore, for every work station, the minimum WBGT was meet which are as follows; Folder (19.2), Key (19.2), Roll (19.29), Web (19.06), Lunch Room (18.98) Console (19.46). The printing press machines proved to have similar illumination, luminance and reflectance ratios except for the first printing press machine and the third printing press machine as shown in table 4. The first printing press machine was recorded to be 767 lux because it was the closest one to the wall and the reflectance of the wall affected the machine. This does not prove to be a problem as there was no glare based on the fact that looking at the button with the reflectance was better than covering the button from the reflectance of the adjacent wall. The third printing press machine was recorded to be 38 lux because not enough light fixtures were working. The deviation in illumination between one machine and another was due to the number of working fixtures above each printing press machine. The same reasoning of being adjacent to the wall goes for the conveyer as to why it is higher than the other measurements. The first parts of both control panels were layouts for buttons, and they both had good lighting as it is important not to confuse one light with another. The second parts of the control panels were computers, and their lighting was perfect because it didn’t produce any glare, and had a similar contrast compared to the adjacent operation. The third parts of the control panels were just areas where the workers might write. The paper cutting machines had excellent lighting because the light was adequate and sufficient for such a task. Conclusion and Recommendation Some of the constraints were mapping the region and determining where a good SLM reading could be taken. Maintaining the SLM at an arms length at ear level is physically demanding and is recommended that two people alternate taking readings and recordings. It was difficult to not get in the way of the employees during the project and a supervisor had to accompany the project conductors in order to ensure their safety. It was also impossible to get evenly spaced out readings therefore multiple readings were taken at various distances in order to create a detailed sound floor map. The machine is the source of such high level noise and it is impossible to isolate the workers in order to continue production. Personal Protective Equipment plays a great role at this particular workplace as it ensures that the ears are protected with ear muffs that significantly reduce the noise heard. Measuring Leq and LEX for each station it has been shown that there is a relationship between both values and both values are important in order to determine exposure. For example, LEX = Leq. However, LEX = Leq is only true in regards to an 8 hour work shift. When a work shift is not the typical 8 hours, LEX does not equal Leq. In this case, LEX = Leq + time shift correction. From 8 hours to 12 hours, there is a 1.75 correction that needs to be

made. For example, for station 1, the Leq calculated was 81.3 dBA. However, the workers were all wearing PPE which reduced the noise by 27 dB which led to a new value of 54.3dBA . But, when the time shift correction is added, the new value, LEX, is 56.05dBA. Because the workers are not working 8 hour shifts, the use of the time shift correction is critical. The use of the time shift value now provides the most accurate representation of the dBA the worker was exposed to without having to record for the course of their shift. According to OSHA, the permissible exposure limit for noise exposure is 85 dBA for an 8 hour shift. Because the workers were not working 8 hour shifts, the LEX value will be used instead. As seen in the calculations, all the stations had an LEX below the OHSA limit. This means that Metroland Media does not exceed the permissible exposure limit. Set by OSHA. It was also concluded that the dosimeter has an advantage over a regular SLM because it provides a constant readout for sound levels as opposed to a single sound level reading. It also can be attached to the worker; in that case a more realistic reading can be taken to better measure the sounds that the worker encounters. Also, it is important to note that as dose percentage increase in magnitude, so does the Leq value. For example, as shown in table 1, station 1, 2 and 5 had the highest dose percentage (15.9%). Likewise, station 6 had the lowest. All in all, the objective was completed as both the Leq and LEX were calculated for each station as well as the dose (%) extrapolated over 12 hours. A potential source of error that should be considered is that once the dosimeter was strapped on an employee his normal movements may have ruffled the mic and could have potentially caused an increase in the overall dose that would be recorded and then extrapolated. Based on the WBGT when compared to the Ontario ACGIH standard for WBGT in an enclosed industrial workplace, Metroland Media meets the minimum requirement. The WBGT for each of the work stations showed the heat stress that the workers were placed in, which are at safe levels. The reason why the workplace had such excellent results are because the work area was very large and well ventilated, giving workers a comfortable work environment that wasn’t hot and cramped. Furthermore the work being done was not heavy but light and moderate. This also helped keep the work environment at a comfortable temperature. Overall, Metroland Media meet Ontario ACGIH standards for the WBGT levels in an enclosed industrial workplace. The minimal requirement for illumination in industrial areas based on the Canadian Occupational Health and Safety Regulations is 20 lux. No value of the measured values went below 20 lux, so the workplace met the minimal standards. Based on the type of printing press this is, the category of the range of illuminance is category “D.” Most of the workers were under the age of 40, speed and accuracy were not important, and the reflectance of the background task was almost always less than 30 percent. This conclusion was calculated by the use of the age weighting factor table. This leads us to the conclusion that the recommended illuminance for the printing press is 200 lux. Since most of the values, with a few exceptions, are relatively close to 200 lux, the workplace has proved to not only meet the minimum recommended requirements, but also the recommended requirements. The

workplace proved to provide a good standard for illumination, the only recommendation would be consistent and periodic maintenance of the light fixtures of the printing press machines. Acknowledgments We would like to thank Mr. Scott Reis from Metroland Media Group for taking time out to respond to our questions and concerns and guiding us through the production facility. We would also like to thank the supervisors that accompanied us while conducting the project and making sure we were safe and out of harms way, as well as informed about potential tripping or other physical hazards present at the job, such as skids, paper bins, paper rolls, etc.
References “Noise Control: A guide for workers and employers,” Occupational Safety and Health Administration, U.S. Department of Labor, accessed September 22, 2014, http://www.nonoise.org/hearing/noisecon/noisecon.htm “Noise – Occupational Exposure Limits in Canada,” Canadian Centre for Occupational Health and Safety, last modified March 5, 2014, accessed September 22, 2014, http://www.ccohs.ca/oshanswers/phys_agents/exposure_can.html Occupational Safety and Health Administration, US Department of Labor. (2013). Section III, Chapter 5: Noise. In OSHA Technical Manual. Retrieved from https://www.osha.gov/dts/osta/otm/new_noise/index.pdf Extreme Hot or Cold Temperature Conditions. (2013, November 19). Retrieved December 9, 2014, from http://www.ccohs.ca/oshanswers/phys_agents/hot_cold.html Rea, Mark Stanley. The IESNA Lighting Handbook: Reference & Application. 9th ed. New York, NY: Illuminating Engineering Society of North America, 2000. Chapter 1. Print. "IESNA Lighting; Ready Reference Fourth Edition." Requirements for Lighting Levels. Ed. R. Harrold and D. Mennie. WBDG (Whole Building Design Guide), 7 Jan. 2010. Web. 9 Nov. 2014. http://www.me.ua.edu/me416/s09/pdf/IESNARRLightingCalc.pdf