phys ther.€1984; 64:919-923. - moodle usp: e … ther.€1984; 64:919-923. and helen trevelyan j m...
TRANSCRIPT

1984; 64:919-923.PHYS THER. and Helen TrevelyanJ M Walker, Debbie Sue, Nancy Miles-Elkousy, Gail FordActive Mobility of the Extremities in Older Subjects
http://ptjournal.apta.org/content/64/6/919be found online at: The online version of this article, along with updated information and services, can
Collections
Injuries and Conditions: Upper Extremity Injuries and Conditions: Lower Extremity
Geriatrics: Other in the following collection(s): This article, along with others on similar topics, appears
e-Letters
"Responses" in the online version of this article. "Submit a response" in the right-hand menu under
or click onhere To submit an e-Letter on this article, click
E-mail alerts to receive free e-mail alerts hereSign up
by guest on March 28, 2012http://ptjournal.apta.org/Downloaded from

Active Mobility of the Extremities in Older Subjects
J. M. WALKER, DEBBIE SUE, NANCY MILES-ELKOUSY, GAIL FORD, and HELEN TREVELYAN
The purposes of this study were 1) to expand the data base of active range of motion (ROM) in the upper and lower extremities of older persons measured by goniometry and 2) to determine if differences exist related to age, sex, and physical activity. Active ROM was measured with a clinical goniometer in 28 joint motions of the upper and lower extremities of the right side in 60 older subjects. Thirty men and 30 women were equally divided in two age groups of 60 to 69 and 75 to 84 years of age. Multivariate analysis of variance showed no significant differences in ROM that were attributable to sex and age. In univariate tests, however, 12 motions were significantly different (p < .05) between the sexes, but only in 4 motions was the difference greater than intertester error. Physical activity, as assessed by a questionnaire and a rating scale, was not related to specific changes of joint range. Within the older subjects, however, a significant relationship between ROM and age or ROM and physical activity cannot be assumed. These results suggest that a data base of normative values is needed for older individuals.
Key Words: Aged, Joints, Physical therapy.
Measurement of range of motion (ROM) is routinely used to assess joint mobility, assess function, plan treatments, and set realistic goals for patients. Investigators have reported data suggesting that selected ranges of joint motion vary with age.1-10 Regressive changes in all tissues of diarthrodial joints that begin to occur after 20 years of age, as reported from studies on ani
mals and in man, may produce decreased amplitudes of motion.11-13 Pain, muscle weakness, or spasticity also may limit active joint motion. The health status of an individual and any impairment of joint integrity associated with aging may affect selected ranges of joint motion. The relationship between ROM and physical activity is not yet established.3 Despite numerous studies on ROM, only a small data base exists of normative joint ROM values in individuals over 60 years of age (termed older in this paper).2-5 The purposes of this study were 1) to expand the data base of active ROM in the upper and lower extremities of older persons measured by goniometry and 2) to determine if differences exist related to age, sex, and physical activity.
METHOD
Sample
Sixty healthy, right-handed, white volunteers participated in this study. Thirty were women and 30 were men. Each sex group was divided into two age groups of 15 subjects each: 60 to 69 years of age (classified as Y for young-old) and 75 to 84 years of age (classified as O for middle-old) (Tab.l). The sub
jects were residents of the greater Los Angeles area and functioned independently within their homes. We used a three-item questionnaire to screen out subjects having ROM limitation that interfered with the performance of daily activities and having pathological conditions, such as hemiplegia, rheumatoid arthritis, recent fractures or surgeries, or other conditions under constant treatment. We did not exclude subjects with mild arthritis and other similar musculoskeletal conditions because these are common in the age group from which the sample was drawn.
Instrumentation
We measured the shoulder, elbow, hip, and knee joints with a large 360-degree goniometer* calibrated in 1-degree increments with 32-em arms. We used a small 180-degree goniometer with 17-cm arms to measure the radioulnar, wrist, ankle, subtalar, and first metatarsophalangeal (MTP) joints. Because the 180-degree goniometer was calibrated in 5-degree increments, it was superimposed on a 1-degree increment protractor after each measurement and
* Fred Sammons, Inc, Box 32, Brookfield, IL 60513
Dr. Walker is Associate Professor, Department of Physical Therapy and Department of Anatomy and Cell Biology, University of Southern California, 12933 Erickson Ave, Downey, CA 90242 (USA).
Ms. Sue is Staff Physical Therapist, Glendale Adventist Medical Center, 1509 Wilson Terrace, Glendale, CA 91206.
Mrs. Miles-Elkousy is Staff Physical Therapist, Northridge Hospital Medical Center, 18300 Roscoe Blvd, Northridge, CA 91328.
Ms. Ford is Staff Physical Therapist, Northridge Hospital Medical Center.
Mrs. Trevelyan is Staff Physical Therapist, Sutter General Hospital, 2820 L St, Sacramento, CA 95816.
This paper was adapted from a poster presentation at the Annual Conference of the American Physical Therapy Association, Kansas City, KS, June 1983.
Some of the research for this article was completed by D. Sue, N. Miles-Elkousy, G. Ford, and H. Trevelyan in partial fulfillment of the requirements for the Master of Science Degree in Physical Therapy, University of Southern California, Downey, CA.
This article was submitted June 15, 1983; was with the authors for revision 11 weeks; and was accepted January 30, 1984.
Volume 64 / Number 6, June 1984 919
by guest on March 28, 2012http://ptjournal.apta.org/Downloaded from
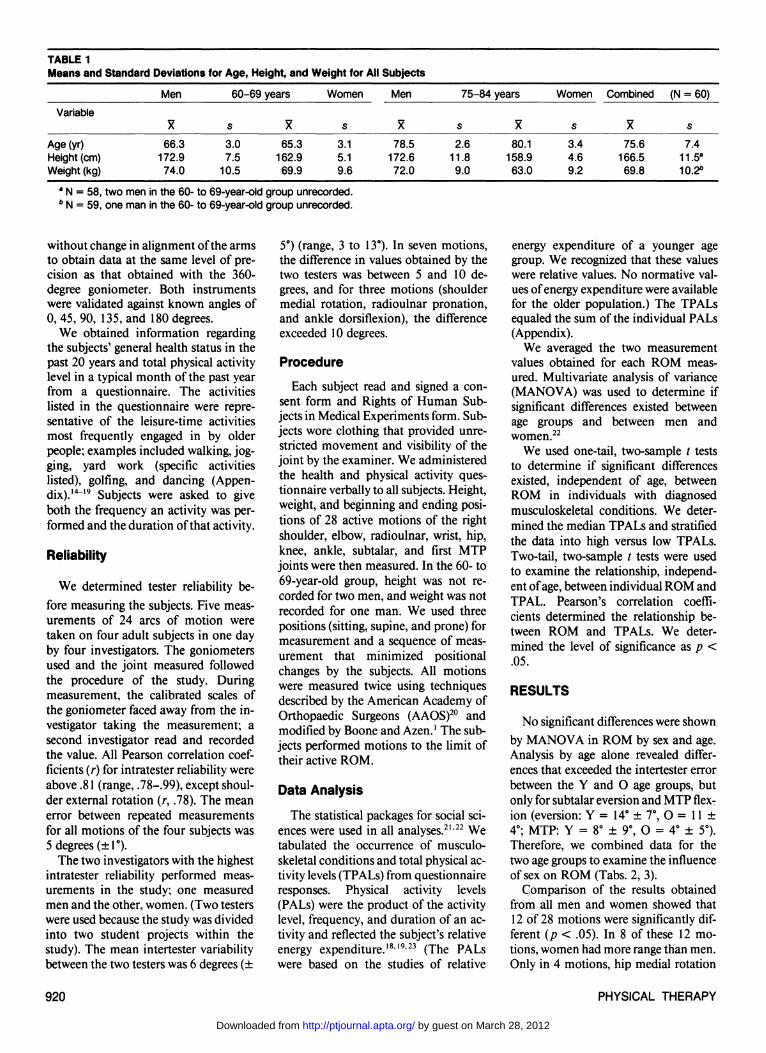
TABLE 1 Means and Standard Deviations for Age, Height, and Weight for All Subjects
Variable
Age (yr) Height (cm) Weight (kg)
Men
X
66.3 172.9 74.0
60-69
s
3.0 7.5
10.5
years
X
65.3 162.9 69.9
Women
s
3.1 5.1 9.6
Men
X
78.5 172.6 72.0
75-84 years
s
2.6 11.8 9.0
X
80.1 158.9 63.0
Women
s
3.4 4.6 9.2
Combined
X
75.6 166.5 69.8
(N = 60)
s
7.4 11.5a
10.2b
a N = 58, two men in the 60- to 69-year-old group unrecorded. b N = 59, one man in the 60- to 69-year-old group unrecorded.
without change in alignment of the arms to obtain data at the same level of precision as that obtained with the 360-degree goniometer. Both instruments were validated against known angles of 0, 45, 90, 135, and 180 degrees.
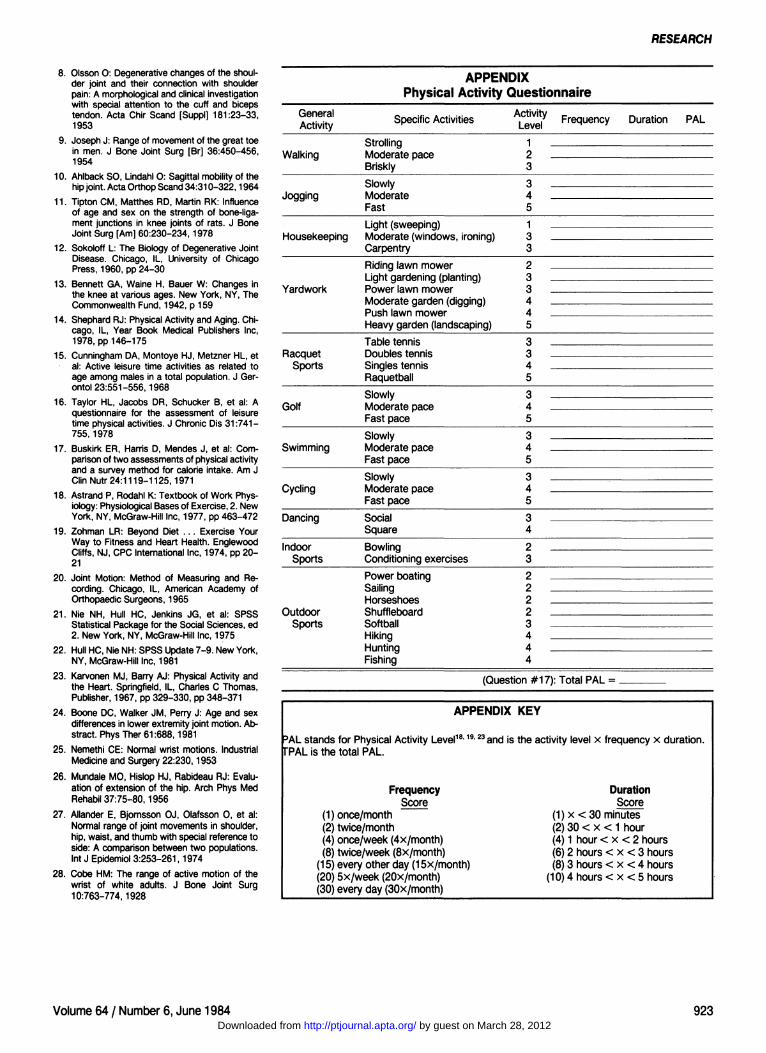
We obtained information regarding the subjects' general health status in the past 20 years and total physical activity level in a typical month of the past year from a questionnaire. The activities listed in the questionnaire were representative of the leisure-time activities most frequently engaged in by older people; examples included walking, jogging, yard work (specific activities listed), golfing, and dancing (Appendix).14-19 Subjects were asked to give both the frequency an activity was performed and the duration of that activity.
Reliability
We determined tester reliability before measuring the subjects. Five measurements of 24 arcs of motion were taken on four adult subjects in one day by four investigators. The goniometers used and the joint measured followed the procedure of the study. During measurement, the calibrated scales of the goniometer faced away from the investigator taking the measurement; a second investigator read and recorded the value. All Pearson correlation coefficients (r) for intratester reliability were above .81 (range, 78-.99), except shoulder external rotation (r, .78). The mean error between repeated measurements for all motions of the four subjects was 5 degrees (±1°).
The two investigators with the highest intratester reliability performed measurements in the study; one measured men and the other, women. (Two testers were used because the study was divided into two student projects within the study). The mean intertester variability between the two testers was 6 degrees (±
5°) (range, 3 to 13°). In seven motions, the difference in values obtained by the two testers was between 5 and 10 degrees, and for three motions (shoulder medial rotation, radioulnar pronation, and ankle dorsiflexion), the difference exceeded 10 degrees.
Procedure
Each subject read and signed a consent form and Rights of Human Subjects in Medical Experiments form. Subjects wore clothing that provided unrestricted movement and visibility of the joint by the examiner. We administered the health and physical activity questionnaire verbally to all subjects. Height, weight, and beginning and ending positions of 28 active motions of the right shoulder, elbow, radioulnar, wrist, hip, knee, ankle, subtalar, and first MTP joints were then measured. In the 60- to 69-year-old group, height was not recorded for two men, and weight was not recorded for one man. We used three positions (sitting, supine, and prone) for measurement and a sequence of measurement that minimized positional changes by the subjects. All motions were measured twice using techniques described by the American Academy of Orthopaedic Surgeons (AAOS)20 and modified by Boone and Azen.1 The subjects performed motions to the limit of their active ROM.
Data Analysis
The statistical packages for social sciences were used in all analyses.21,22 We tabulated the occurrence of musculoskeletal conditions and total physical activity levels (TPALs) from questionnaire responses. Physical activity levels (PALs) were the product of the activity level, frequency, and duration of an activity and reflected the subject's relative energy expenditure.18,19,23 (The PALs were based on the studies of relative
energy expenditure of a younger age group. We recognized that these values were relative values. No normative values of energy expenditure were available for the older population.) The TPALs equaled the sum of the individual PALs (Appendix).
We averaged the two measurement values obtained for each ROM measured. Multivariate analysis of variance (MANOVA) was used to determine if significant differences existed between age groups and between men and women.22
We used one-tail, two-sample t tests to determine if significant differences existed, independent of age, between ROM in individuals with diagnosed musculoskeletal conditions. We determined the median TPALs and stratified the data into high versus low TPALs. Two-tail, two-sample t tests were used to examine the relationship, independent of age, between individual ROM and TPAL. Pearson's correlation coefficients determined the relationship between ROM and TPALs. We determined the level of significance as p < .05.
RESULTS
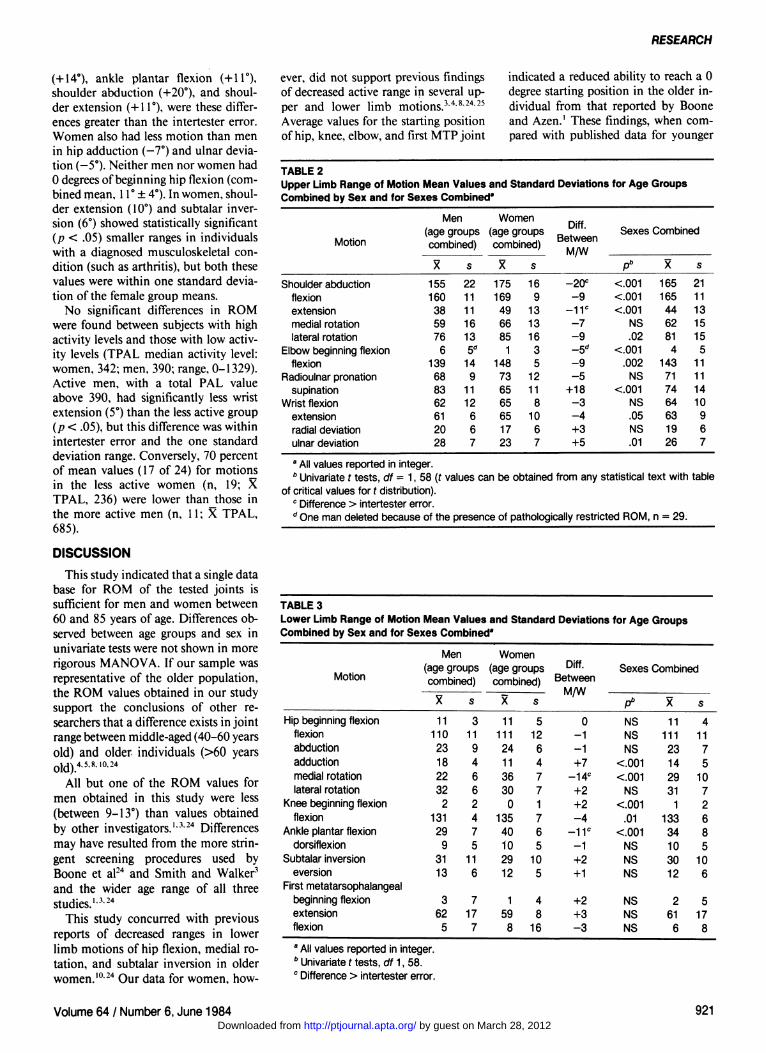
No significant differences were shown by MANOVA in ROM by sex and age. Analysis by age alone revealed differences that exceeded the intertester error between the Y and O age groups, but only for subtalar eversion and MTP flexion (eversion: Y = 14° ± 7°, O = 11 ± 4°; MTP: Y = 8° ± 9°, O = 4° ± 5°). Therefore, we combined data for the two age groups to examine the influence of sex on ROM (Tabs. 2, 3).
Comparison of the results obtained from all men and women showed that 12 of 28 motions were significantly different (p < .05). In 8 of these 12 motions, women had more range than men. Only in 4 motions, hip medial rotation
920 PHYSICAL THERAPY
by guest on March 28, 2012http://ptjournal.apta.org/Downloaded from
RESEARCH
(+14°), ankle plantar flexion (+11°), shoulder abduction (4-20°), and shoulder extension (+11°), were these differences greater than the intertester error. Women also had less motion than men in hip adduction (-7°) and ulnar deviation (-5°). Neither men nor women had 0 degrees of beginning hip flexion (combined mean, 11° ± 4°). In women, shoulder extension (10°) and subtalar inversion (6°) showed statistically significant (p < .05) smaller ranges in individuals with a diagnosed musculoskeletal condition (such as arthritis), but both these values were within one standard deviation of the female group means.
No significant differences in ROM were found between subjects with high activity levels and those with low activity levels (TPAL median activity level: women, 342; men, 390; range, 0-1329). Active men, with a total PAL value above 390, had significantly less wrist extension (5°) than the less active group (p < .05), but this difference was within intertester error and the one standard deviation range. Conversely, 70 percent of mean values (17 of 24) for motions in the less active women (n, 19; X TPAL, 236) were lower than those in the more active men (n, 11; X TPAL, 685).
DISCUSSION
This study indicated that a single data base for ROM of the tested joints is sufficient for men and women between 60 and 85 years of age. Differences observed between age groups and sex in univariate tests were not shown in more rigorous MANOVA. If our sample was representative of the older population, the ROM values obtained in our study support the conclusions of other researchers that a difference exists in joint range between middle-aged (40-60 years old) and older individuals (>60 years old).4,5,8,10,24
All but one of the ROM values for men obtained in this study were less (between 9-13°) than values obtained by other investigators.1,3,24 Differences may have resulted from the more stringent screening procedures used by Boone et al24 and Smith and Walker3
and the wider age range of all three studies.1,3,24
This study concurred with previous reports of decreased ranges in lower limb motions of hip flexion, medial rotation, and subtalar inversion in older women.10,24 Our data for women, how
ever, did not support previous findings of decreased active range in several upper and lower limb motions.3,4,8,24,25
Average values for the starting position of hip, knee, elbow, and first MTP joint
indicated a reduced ability to reach a 0 degree starting position in the older individual from that reported by Boone and Azen.1 These findings, when compared with published data for younger
TABLE 2 Upper Limb Range of Motion Mean Values and Standard Deviations for Age Groups Combined by Sex and for Sexes Combined"
Motion
Shoulder abduction flexion extension medial rotation lateral rotation
Elbow beginning flexion flexion
Radioulnar pronation supination
Wrist flexion extension radial deviation ulnar deviation
Men (age groups combined)
155 160 38 59 76
6 139 68 83 62 61 20 28
s
22 11 11 16 13 5d
14 9
11 12 6 6 7
Women (age groups combined)
175 169 49 66 85
1 148 73 65 65 65 17 23
s
16 9
13 13 16 3 5
12 11 8
10 6 7
Diff. Between
M/W
-20 c
- 9 - 1 1 c
- 7 - 9 -5d
- 9 - 5
+18 - 3 - 4 +3 +5
Sexes Combined
pb
<.001 <.001 <.001
NS .02
<.001 .002
NS <.001
NS .05 NS .01
165 165 44 62 81 4
143 71 74 64 63 19 26
s
21 11 13 15 15 5
11 11 14 10 9 6 7
a All values reported in integer. b Univariate t tests, df = 1, 58 (t values can be obtained from any statistical text with table
of critical values for t distribution). c Difference > intertester error. d One man deleted because of the presence of pathologically restricted ROM, n = 29.
TABLE 3 Lower Limb Range of Motion Mean Values and Standard Deviations for Age Groups Combined by Sex and for Sexes Combined"
Motion
Hip beginning flexion flexion abduction adduction medial rotation lateral rotation
Knee beginning flexion flexion
Ankle plantar flexion dorsiflexion
Subtalar inversion eversion
First metatarsophalangeal beginning flexion extension flexion
Men (age groups combined)
11 110 23 18 22 32
2 131 29 9
31 13
3 62
5
s
3 11 9 4 6 6 2 4 7 5
11 6
7 17 7
Women (age groups combined)
11 111 24 11 36 30
0 135 40 10 29 12
1 59 8
s
5 12 6 4 7 7 1 7 6 5
10 5
4 8
16
Diff. Between
M/W
0 - 1 - 1 +7
-14 c
+2 +2 - 4
- 1 1 c
- 1 +2 +1
+2 +3 - 3
Sexes Combined
pb
NS NS NS
<001 <.001
NS <.001
.01 <.001
NS NS NS
NS NS NS
11 111 23 14 29 31
1 133 34 10 30 12
2 61 6
s
4 11 7 5
10 7 2 6 8 5
10 6
5 17 8
a All values reported in integer. b Univariate t tests, df 1, 58. c Difference > intertester error.
Volume 64 / Number 6, June 1984 921 by guest on March 28, 2012http://ptjournal.apta.org/Downloaded from

TABLE 4 Comparison of Sample Mean Values with American Academy of Orthopaedic Surgeons Handbook Values Where the Difference Exceeded One Standard Deviation and Intertester Error
Motion
Sexes Combined Hip abduction
adduction medial rotation lateral rotation
Ankle plantar flexion First metatarsophalangeal flexion
Men only Shoulder extension Wrist extension
Women only Shoulder flexion Radioulnar supination
Present Study
X
23 14 29 31 34
6
38 61
169 65
s
7 5
10 7 8 8
11 6
9 11
AAOS20
Averages
48 31 45 45 48 37
53 71
158 84
Differences (°)
-25 -17 -16 -14 -14 -31
-19 -10
+11 -19
age groups, suggest a decrease in ROM with age that supports the conclusions of previous studies.1,5-10,24 The cross-sectional design used in all those studies, however, only permits inferences to be made about the effect of age on ROM.
Although significant decreases in motion with age have been reported,3,25
differences in range often lack clinical importance as they fall within accepted boundaries for intratester, intertester, and goniometer error.
For the men, but to a much lesser extent for the women, our values were similar to age-matched data of Tucker.4
Tucker also screened subjects for joint pathology but did not report the criteria used.
Clinicians should be aware of an increased tendency for hip flexion contractures in the elderly. We observed a mean value of 11 degrees for beginning hip flexion, which is consistent with previous studies,10,26 although Boone et al,24 reported a mean value of 2 degrees.
The Handbook of the American Academy of Orthopaedic Surgeons (AAOS) is a widely used source of normative values although the primary data or investigators) error has never been reported.20 An important finding of this study was that older persons had smaller ROM at certain joints than the ROM published in the AAOS Handbook. Although the results of our study were based on a small sample of 30 men and 30 women over 60 years of age, the general trends are supported by studies by Smith and Walker3 and Boone et al.24
Only 25 of the 28 motions we measured are reported in the AAOS Handbook.
Comparison showed that 9 motions (36%) in both sexes and six combined means (28%) of the two age groups for lower limb motions were different from AAOS values by more than one standard deviation, and from our intertester error (Tab. 4). Overall, in men, 22 of the 25 motions were an average of 9 degrees less than the averages given in the AAOS Handbook. In women, AAOS values were higher by an average of 15 degrees (range, 6-29°) in 44 percent of motions. The largest differences observed were for MTP flexion (women, 29°; men, 32°). Our finding supported an age-related decrease in MTP flexion reported by Joseph in men over 45 years of age compared with younger men (no age range given).9 In both men and women, hip rotation, abduction, and adduction values were less than AAOS values by 14 to 25 degrees. These comparisons suggest that AAOS Handbook average values are not appropriate for all joints of older subjects and that a separate normative data base should be developed.
Although investigators have inferred that habitual activity may influence joint range, we did not find any consistent relationship between the amount of physical activity and the range of joint motion.1,14, l5,27,28 This finding was similar to the only other study located that examined this relationship.3 From the results of our study, we theorize that older individuals may be spectators more than they are active participants in physical activities, such as specific sports. We did not validate the questionnaire that elicited data only on leisure
activities; from these data, we calculated physical activity levels and assessed these levels by estimates of the relative metabolic energy expenditure.14,15,16 Although rate of energy expenditure for a given work load may be a good indicator of cardiopulmonary fitness, it may not be related to ROM in joints. Our sample, recruited in part from recreational centers, may not be representative of persons over 60 years of age, especially the 75- to 84-year-old population. Further studies should expand the questionnaire to include the subject's former occupation and retirement work activities, as well as recreational activities. Longitudinal studies are needed to examine more accurately the relationship between age and change in ROM.
CONCLUSION
Measurement of 28 active motions of the right extremities in 30 men and 30 women showed that middle-old (75- to 84-year-old) individuals do not differ significantly from young-old (60- to 69-year-old) individuals. Only univariate tests revealed significant differences between men and women of these age groups. Substantive differences, between active ROM values measured in this study and average estimates published in the AAOS Handbook strongly suggest that a separate data base of normative values is needed for certain extremity motions in the joints of the older population. Clinicians may expect to observe decreased ROM in healthy older individuals.
REFERENCES 1. Boone DC, Azen SP: Normal range of motion
of joints in male subjects. J Bone Joint Surg [Am] 61:756-759,1979
2. Boone DC: Influence of age and sex on joint motion in normal subjects. Paper. Los Angeles, CA, University of Southern California, 1980
3. Smith J, Walker JM: Knee and elbow range of motion in healthy older individuals. Physical & Occupational Therapy in Geriatrics 2:31-38, 1983
4. Tucker JE: Measurement of joint motion of older individuals. Thesis. Stanford, CA, Stanford University, 1964
5. Watanabe H, Ogata K, Amano T, et al: The range of joint motion of the extremities in healthy Japanese people: The differences according to the age. Nippon Seikeigeka Gakkai Zasshi 53(3):275-291,1979 (Japanese)
6. West CC: Measurement of joint motion. Arch Phys Med 26:414-425,1945
7. Sammarco GJ, Burnstein AH, Frankel VH: Biomechanics of the ankle: A kinematic study. Orthop Clin North Am 4:75-96,1973
922 PHYSICAL THERAPY
by guest on March 28, 2012http://ptjournal.apta.org/Downloaded from
RESEARCH
8. Olsson O: Degenerative changes of the shoulder joint and their connection with shoulder pain: A morphological and clinical investigation with special attention to the cuff and biceps tendon. Acta Chir Scand [Suppl] 181:23-33, 1953
9. Joseph J: Range of movement of the great toe in men. J Bone Joint Surg [Br] 36:450-456, 1954
10. Ahlback SO, Lindahl O: Sagittal mobility of the hip joint. Acta Orthop Scand 34:310-322,1964
11. Tipton CM, Matthes RD, Martin RK: Influence of age and sex on the strength of bone-ligament junctions in knee joints of rats. J Bone Joint Surg [Am] 60:230-234,1978
12. Sokoloff L: The Biology of Degenerative Joint Disease. Chicago, IL, University of Chicago Press, 1960, pp 24-30
13. Bennett GA, Waine H, Bauer W: Changes in the knee at various ages. New York, NY, The Commonwealth Fund, 1942, p 159
14. Shephard RJ: Physical Activity and Aging. Chicago, IL, Year Book Medical Publishers Inc, 1978, pp 146-175
15. Cunningham DA, Montoye HJ, Metzner HL, et al: Active leisure time activities as related to age among males in a total population. J Gerontol 23:551-556,1968
16. Taylor HL, Jacobs DR, Schucker B, et al: A questionnaire for the assessment of leisure time physical activities. J Chronic Dis 31:741 -755,1978
17. Buskirk ER, Harris D, Mendes J, et al: Comparison of two assessments of physical activity and a survey method for calorie intake. Am J Clin Nutr 24:1119-1125,1971
18. Astrand P, Rodahl K: Textbook of Work Physiology: Physiological Bases of Exercise, 2. New York, NY, McGraw-Hill Inc, 1977, pp 463-472
19. Zohman LR: Beyond Diet . . . Exercise Your Way to Fitness and Heart Health. Englewood Cliffs, NJ, CPC International Inc, 1974, pp 20-21
20. Joint Motion: Method of Measuring and Recording. Chicago, IL, American Academy of Orthopaedic Surgeons, 1965
21. Nie NH, Hull HC, Jenkins JG, et al: SPSS Statistical Package for the Social Sciences, ed 2. New York, NY, McGraw-Hill Inc, 1975
22. Hull HC, Nie NH: SPSS Update 7-9. New York, NY, McGraw-Hill Inc, 1981
23. Karvonen MJ, Barry AJ: Physical Activity and the Heart. Springfield, IL, Charles C Thomas, Publisher, 1967, pp 329-330, pp 348-371
24. Boone DC, Walker JM, Perry J: Age and sex differences in lower extremity joint motion. Abstract. Phys Ther 61:688,1981
25. Nemethi CE: Normal wrist motions. Industrial Medicine and Surgery 22:230,1953
26. Mundale MO, Hislop HJ, Rabideau RJ: Evaluation of extension of the hip. Arch Phys Med Rehabil 37:75-80,1956
27. Allander E, Bjornsson OJ, Olafsson O, et al: Normal range of joint movements in shoulder, hip, waist, and thumb with special reference to side: A comparison between two populations. Int J Epidemiol 3:253-261,1974
28. Cobe HM: The range of active motion of the wrist of white adults. J Bone Joint Surg 10:763-774,1928
General Activity
Walking
Jogging
Housekeeping
Yardwork
Racquet Sports
Golf
Swimming
Cycling
Dancing
Indoor Sports
Outdoor Sports
APPENDIX Physical Activity Questionnaire
Specific Activities
Strolling Moderate pace Briskly
Slowly Moderate Fast
Light (sweeping) Moderate (windows, ironing) Carpentry
Riding lawn mower Light gardening (planting) Power lawn mower Moderate garden (digging) Push lawn mower Heavy garden (landscaping)
Table tennis Doubles tennis Singles tennis Raquetball
Slowly Moderate pace Fast pace
Slowly Moderate pace Fast pace
Slowly Moderate pace Fast pace
Social Square
Bowling Conditioning exercises
Power boating Sailing Horseshoes Shuffleboard Softball Hiking Hunting Fishing
Activity Level
1 2 3 3 4 5 1 3 3 2 3 3 4 4 5 3 3 4 5 3 4 5 3 4 5 3 4 5 3 4 2 3 2 2 2 2 3 4 4 4
Frequency
(Question #17): Total PAL =
Duration PAL
APPENDIX KEY
PAL stands for Physical Activity Level18, 19, 23 and is the activity level x frequency x duration. | TPAL is the total PAL.
Frequency Score
(1) once/month (2) twice/month (4) once/week (4x/month) (8) twice/week (8x/month)
(15) every other day (15x/month) (20) 5x/week (20x/month) (30) every day (30x/month)
Duration Score
(1) x < 30 minutes (2) 30 < x < 1 hour (4) 1 hour < x < 2 hours (6) 2 hours < x < 3 hours (8) 3 hours < x < 4 hours
(10) 4 hours < x < 5 hours
Volume 64 / Number 6, June 1984 923 by guest on March 28, 2012http://ptjournal.apta.org/Downloaded from

1984; 64:919-923.PHYS THER. and Helen TrevelyanJ M Walker, Debbie Sue, Nancy Miles-Elkousy, Gail FordActive Mobility of the Extremities in Older Subjects
Cited by
http://ptjournal.apta.org/content/64/6/919#otherarticles
This article has been cited by 5 HighWire-hosted articles:
Information Subscription http://ptjournal.apta.org/subscriptions/
Permissions and Reprints http://ptjournal.apta.org/site/misc/terms.xhtml
Information for Authors http://ptjournal.apta.org/site/misc/ifora.xhtml
by guest on March 28, 2012http://ptjournal.apta.org/Downloaded from