phylogenomics and coalescent analyses resolve extant seed
TRANSCRIPT

Phylogenomics and Coalescent Analyses Resolve ExtantSeed Plant RelationshipsZhenxiang Xi1, Joshua S. Rest2, Charles C. Davis1*
1 Department of Organismic and Evolutionary Biology, Harvard University, Cambridge, Massachusetts, United States of America, 2 Department of Ecology andEvolution, Stony Brook University, Stony Brook, New York, United States of America
Abstract
The extant seed plants include more than 260,000 species that belong to five main lineages: angiosperms, conifers,cycads, Ginkgo, and gnetophytes. Despite tremendous effort using molecular data, phylogenetic relationships amongthese five lineages remain uncertain. Here, we provide the first broad coalescent-based species tree estimation ofseed plants using genome-scale nuclear and plastid data By incorporating 305 nuclear genes and 47 plastid genesfrom 14 species, we identify that i) extant gymnosperms (i.e., conifers, cycads, Ginkgo, and gnetophytes) aremonophyletic, ii) gnetophytes exhibit discordant placements within conifers between their nuclear and plastidgenomes, and iii) cycads plus Ginkgo form a clade that is sister to all remaining extant gymnosperms. Weadditionally observe that the placement of Ginkgo inferred from coalescent analyses is congruent across differentnucleotide rate partitions. In contrast, the standard concatenation method produces strongly supported, butincongruent placements of Ginkgo between slow- and fast-evolving sites. Specifically, fast-evolving sites yieldrelationships in conflict with coalescent analyses. We hypothesize that this incongruence may be related to the wayin which concatenation methods treat sites with elevated nucleotide substitution rates. More empirical and simulationinvestigations are needed to understand this potential weakness of concatenation methods.
Citation: Xi Z, Rest JS, Davis CC (2013) Phylogenomics and Coalescent Analyses Resolve Extant Seed Plant Relationships. PLoS ONE 8(11): e80870.doi:10.1371/journal.pone.0080870
Editor: Paul V. A. Fine, University of California, Berkeley, United States of America
Received September 4, 2013; Accepted October 15, 2013; Published November 21, 2013
Copyright: © 2013 Xi et al. This is an open-access article distributed under the terms of the Creative Commons Attribution License, which permitsunrestricted use, distribution, and reproduction in any medium, provided the original author and source are credited.
Funding: This study was funded by a grant from the United States National Science Foundation DEB-1120243 to C.C.D. The funders had no role in studydesign, data collection and analysis, decision to publish, or preparation of the manuscript.
Competing interests: The authors have declared that no competing interests exist.
* E-mail: [email protected]
Introduction
Seed plants originated at least 370 million years ago [1] andinclude more than 260,000 extant species [2], making them themost species rich land plant clade. These species are placed infive main lineages: angiosperms, conifers, cycads, Ginkgo, andgnetophytes [3]. By far the greatest species diversity is found inthe angiosperms; the remaining four lineages constitute theextant gymnosperms (Figure 1A), meaning “naked seeds”.Today’s gymnosperms are a shadow of their former glory–only~1,000 species currently exist [2]. Nevertheless, they are ofhuge ecological and economic importance, especially for theirtimber and horticultural value.
Despite tremendous efforts to resolve phylogeneticrelationships among the five extant seed plant lineages usingmolecular data, these relationships remain uncertain. Forexample, early studies identified the monophyly of extantgymnosperms [4-11], but more recent studies using duplicategene rooting have suggested that cycads are instead moreclosely related to angiosperms than they are to other extantgymnosperms (Figure 1B) [3,12]. Similarly, the gnetophytes,
which were previously thought to be sister to angiospermsbased on morphological characters (i.e., the anthophytehypothesis; [13,14]), are now grouped with other extantgymnosperms using molecular data. Establishing thephylogenetic placement of gnetophytes among extantgymnosperms, however, remains problematic. Recentmolecular studies have suggested three conflicting hypothesesof gnetophyte relationships: the gnecup (i.e., gnetophytes sisterto cupressophytes; [9,15]), gnepine (i.e., gnetophytes sister toPinaceae; [7,8,10,16-24]), and gnetifer (i.e., gnetophytes sisterto conifers; [5,25]) hypotheses (Figure 1C). In addition, earlystudies concatenating multiple genes placed Ginkgo alone assister to conifers and gnetophytes within the extantgymnosperm clade [7-11,16-18,26-28]. However, more recentstudies using additional genes have suggested that a cladecontaining cycads plus Ginkgo cannot be excluded as sister toall remaining extant gymnosperms (Figure 1D)[15,19,21-24,29,30]. In particular, attempts to include data thatare less prone to saturation due to high rates of substitution(e.g., amino acid sequences and slow-evolving nucleotidesequences) have lead to increasing support for the placement
PLOS ONE | www.plosone.org 1 November 2013 | Volume 8 | Issue 11 | e80870
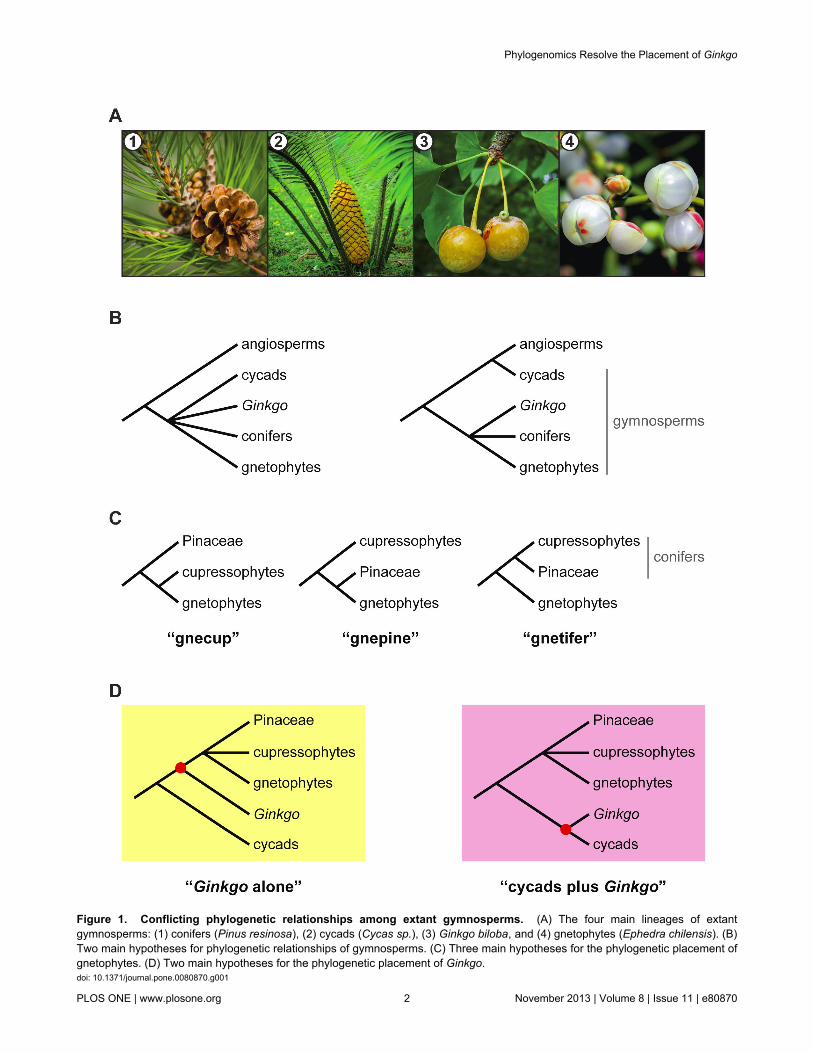
Figure 1. Conflicting phylogenetic relationships among extant gymnosperms. (A) The four main lineages of extantgymnosperms: (1) conifers (Pinus resinosa), (2) cycads (Cycas sp.), (3) Ginkgo biloba, and (4) gnetophytes (Ephedra chilensis). (B)Two main hypotheses for phylogenetic relationships of gymnosperms. (C) Three main hypotheses for the phylogenetic placement ofgnetophytes. (D) Two main hypotheses for the phylogenetic placement of Ginkgo.doi: 10.1371/journal.pone.0080870.g001
Phylogenomics Resolve the Placement of Ginkgo
PLOS ONE | www.plosone.org 2 November 2013 | Volume 8 | Issue 11 | e80870
of cycads plus Ginkgo as sister to all remaining extantgymnosperms [15,21,23,24]. For all of these reasons, abroader comparative phylogenomic assessment of thesequestions is warranted to better understand the evolution ofextant seed plants.
Advances in next-generation sequencing and computationalphylogenomics represent tremendous opportunities for inferringspecies relationships using hundreds, or even thousands, ofgenes. Until now the reconstruction of broad seed plantphylogenies from multiple genes has relied almost entirely onconcatenation methods [7-11,15-19,21,23,24,29,31-37], inwhich phylogenies are inferred from a single combined genematrix [38]. These analyses assume that all genes have thesame, or very similar, evolutionary histories. Theoretical andsimulation studies, however, have shown that concatenationmethods can yield misleading results, especially if gene treesare highly heterogeneous [39-43]. In contrast, recentlydeveloped coalescent-based methods estimate the speciesphylogeny from a collective set of gene trees, which permitdifferent genes to have different evolutionary histories [44-46].Both theoretical and empirical studies have shown thatcoalescent methods can better accommodate geneheterogeneity [44-48].
Here, our phylogenomic analyses of 14 species representthe first coalescent-based species tree estimation of seedplants. By incorporating hundreds of nuclear genes as well as afull complement of plastid genes, we also provide a directcomparison of phylogenetic relationships inferred from nuclearand plastid genomes.
Results and Discussion
Taxon and gene sampling of nuclear and plastid genesOur nuclear gene taxon sampling included 12 species
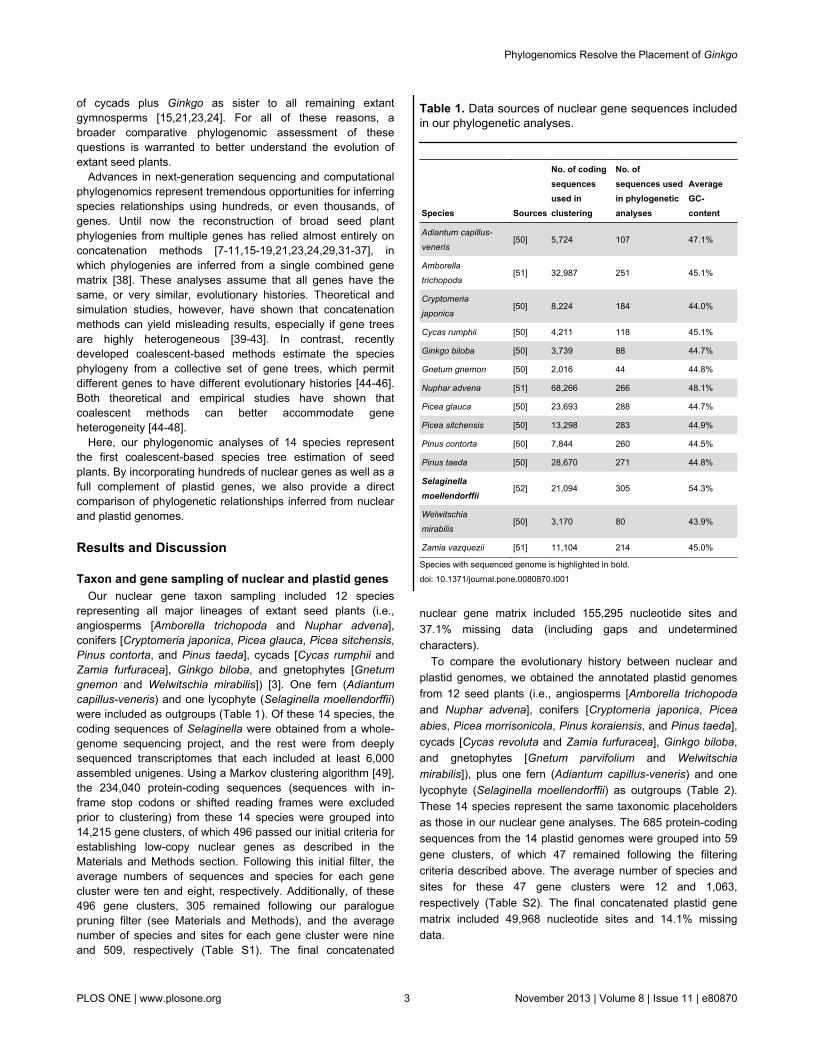
representing all major lineages of extant seed plants (i.e.,angiosperms [Amborella trichopoda and Nuphar advena],conifers [Cryptomeria japonica, Picea glauca, Picea sitchensis,Pinus contorta, and Pinus taeda], cycads [Cycas rumphii andZamia furfuracea], Ginkgo biloba, and gnetophytes [Gnetumgnemon and Welwitschia mirabilis]) [3]. One fern (Adiantumcapillus-veneris) and one lycophyte (Selaginella moellendorffii)were included as outgroups (Table 1). Of these 14 species, thecoding sequences of Selaginella were obtained from a whole-genome sequencing project, and the rest were from deeplysequenced transcriptomes that each included at least 6,000assembled unigenes. Using a Markov clustering algorithm [49],the 234,040 protein-coding sequences (sequences with in-frame stop codons or shifted reading frames were excludedprior to clustering) from these 14 species were grouped into14,215 gene clusters, of which 496 passed our initial criteria forestablishing low-copy nuclear genes as described in theMaterials and Methods section. Following this initial filter, theaverage numbers of sequences and species for each genecluster were ten and eight, respectively. Additionally, of these496 gene clusters, 305 remained following our paraloguepruning filter (see Materials and Methods), and the averagenumber of species and sites for each gene cluster were nineand 509, respectively (Table S1). The final concatenated
nuclear gene matrix included 155,295 nucleotide sites and37.1% missing data (including gaps and undeterminedcharacters).
To compare the evolutionary history between nuclear andplastid genomes, we obtained the annotated plastid genomesfrom 12 seed plants (i.e., angiosperms [Amborella trichopodaand Nuphar advena], conifers [Cryptomeria japonica, Piceaabies, Picea morrisonicola, Pinus koraiensis, and Pinus taeda],cycads [Cycas revoluta and Zamia furfuracea], Ginkgo biloba,and gnetophytes [Gnetum parvifolium and Welwitschiamirabilis]), plus one fern (Adiantum capillus-veneris) and onelycophyte (Selaginella moellendorffii) as outgroups (Table 2).These 14 species represent the same taxonomic placeholdersas those in our nuclear gene analyses. The 685 protein-codingsequences from the 14 plastid genomes were grouped into 59gene clusters, of which 47 remained following the filteringcriteria described above. The average number of species andsites for these 47 gene clusters were 12 and 1,063,respectively (Table S2). The final concatenated plastid genematrix included 49,968 nucleotide sites and 14.1% missingdata.
Table 1. Data sources of nuclear gene sequences includedin our phylogenetic analyses.
Species Sources
No. of codingsequencesused inclustering
No. ofsequences usedin phylogeneticanalyses
AverageGC-content
Adiantum capillus-
veneris[50] 5,724 107 47.1%
Amborella
trichopoda[51] 32,987 251 45.1%
Cryptomeria
japonica[50] 8,224 184 44.0%
Cycas rumphii [50] 4,211 118 45.1%
Ginkgo biloba [50] 3,739 88 44.7%
Gnetum gnemon [50] 2,016 44 44.8%
Nuphar advena [51] 68,266 266 48.1%
Picea glauca [50] 23,693 288 44.7%
Picea sitchensis [50] 13,298 283 44.9%
Pinus contorta [50] 7,844 260 44.5%
Pinus taeda [50] 28,670 271 44.8%
Selaginellamoellendorffii
[52] 21,094 305 54.3%
Welwitschia
mirabilis[50] 3,170 80 43.9%
Zamia vazquezii [51] 11,104 214 45.0%
Species with sequenced genome is highlighted in bold.doi: 10.1371/journal.pone.0080870.t001
Phylogenomics Resolve the Placement of Ginkgo
PLOS ONE | www.plosone.org 3 November 2013 | Volume 8 | Issue 11 | e80870

Inferring Species Relationships Using Coalescent andConcatenation Methods
Species relationships were first estimated from nucleotidesequences using the recently developed coalescent method:Species Tree Estimation using Average Ranks of Coalescence(STAR) [46]. Since this method is based on summary statisticscalculated across all gene trees, a small number of outliergenes that significantly deviate from the coalescent model haverelatively little effect on the accurate inference of the speciestree [48]. We note that while all plastid genes are generallyexpected to share the same history, evidence of recombination,heteroplasmy, and incomplete lineage sorting in plastidgenomes suggests that this may not always apply (e.g., 53-57).Thus, we additionally analyzed plastid genes using thecoalescent method. We compared the results from coalescentanalyses of both nuclear and plastid genes with those fromconcatenation analyses using maximum likelihood (ML) asimplemented in RAxML [58]. Statistical confidence wasestablished for both methods using a multilocus bootstrappingapproach [59], in which genes were resampled withreplacement followed by resampling sites with replacementwithin each gene.
Our species trees inferred from coalescent andconcatenation methods largely agree with each other (Figure2). Similarly, analyses of nuclear and plastid genes are largelyin agreement. All analyses strongly support (≥87 bootstrappercentage [BP]) the monophyly of extant gymnosperms. Thelone placement that shows conflict between the nuclear andplastid gene trees is for the gnetophytes (i.e., Gnetum andWelwitschia). Our coalescent and concatenation analyses of
Table 2. Data sources of plastid gene sequences includedin our phylogenetic analyses.
SpeciesGenBankaccession number
No. of sequencesused inphylogeneticanalyses
Average GC-content
Adiantum capillus-
venerisNC_004766 46 42.8%
Amborella trichopoda NC_005086 44 40.1%Cryptomeria japonica NC_010548 46 38.0%Cycas revoluta NC_020319 47 40.3%Ginkgo biloba NC_016986 47 40.4%Gnetum parvifolium NC_011942 33 38.6% Nuphar advena NC_008788 44 40.6%Picea abies NC_021456 36 40.7%Picea morrisonicola NC_016069 35 40.7%Pinus koraiensis NC_004677 36 40.5%Pinus taeda NC_021440 36 40.4%Selaginella
moellendorffiiNC_013086 47 50.8%
Welwitschia mirabilis NC_010654 32 37.2%
Zamia furfuraceaJQ770198-JQ770303
32 41.4%
doi: 10.1371/journal.pone.0080870.t002
nuclear genes support the gnepine hypothesis (i.e.,gnetophytes sister to Pinaceae [Picea and Pinus]) with 64 BPand 85 BP, respectively (Figure 2A). In contrast, our coalescentand concatenation analyses of plastid genes support thegnecup hypothesis (i.e., gnetophytes sister to cupressophytes[Cryptomeria]) with 60 BP and 94 BP, respectively (Figure 2B).Moreover, in each of these cases the rival topology is rejectedusing the approximately unbiased (AU) test [60]: the gnecupplacement is rejected for concatenated nuclear gene matrix (p-value = 0.001) and the gnepine placement is rejected forconcatenated plastid gene matrix (p-value = 0.001). Thisconflicting placement between the nuclear and plastidgenomes is consistent with previous studies (e.g., 15,19,22),although our study is a direct comparison using a similar set ofspecies for both genomes. These results suggest that thenuclear and plastid genomes of gnetophytes may havedistinctly different evolutionary histories.
An additional well-supported placement we uncovered hererelates to cycads and Ginkgo. Our coalescent andconcatenation analyses of nuclear genes strongly support (100BP and 93 BP, respectively) cycads (i.e., Cycas and Zamia)plus Ginkgo as sister to all remaining extant gymnosperms(Figure 2A and see red dots in Figure 1D for clades underconsideration). The rival placement of Ginkgo alone as sister toconifers and gnetophytes (i.e., the “Gingko alone” hypothesis)is rejected for the concatenated nuclear gene matrix (p-value =0.004, AU test). In addition, our coalescent analyses of plastidgenes similarly support (71 BP) the monophyly of cycads plusGinkgo (Figure 2B). The concatenation analyses of plastidgenes, in contrast, weakly support (56 BP) the “Gingko alone”hypothesis.
Because sequences from both cycads and Ginkgo were notpresent in all 305 nuclear genes, we conducted an additionalanalysis using only those genes that included both cycads andGinkgo (sequences from both cycads and Ginkgo were presentin all 47 plastid genes; see Table 2). This allows us to test if thephylogenetic placement of Ginkgo inferred from nuclear genesis sensitive to missing data. Although the number of nucleargene clusters declines to 69 when applying this taxon filter, theresults are identical to those above: the coalescent andconcatenation analyses strongly support (95 BP and 97 BP,respectively) cycads plus Ginkgo as sister to all remainingextant gymnosperms.
To further investigate if the placement of Ginkgo is sensitiveto the number of sampled genes, we randomly subsampled the305 nuclear genes in four different gene size categories (i.e.,25, 47, 100, or 200 genes; 10 replicates each). We similarlysubsampled the 47 plastid genes (i.e., 25 genes with 10replicates). Even as the sample size declines, the coalescentand concatenation analyses of nuclear genes strongly support(≥80 BP) cycads plus Ginkgo as sister to all remaining extantgymnosperms. Support for this relationship only dropped below80 BP when the number of subsampled nuclear genes was 25for the coalescent analyses (Figure 3A). For the 25subsampled plastid genes, the coalescent analyses alsosupport cycads plus Ginkgo with ≥80 BP. In contrast,concatenation analyses of 25 subsampled plastid genessupport the “Gingko alone” hypothesis with ≥80 BP (Figure 3A).
Phylogenomics Resolve the Placement of Ginkgo
PLOS ONE | www.plosone.org 4 November 2013 | Volume 8 | Issue 11 | e80870

Figure 2. Species trees inferred from (A) 305 nuclear genes and (B) 47 plastid genes using the coalescent method(STAR). Bootstrap percentages (BPs) from STAR/RAxML are indicated above each branch; an asterisk indicates that the clade issupported by 100 BPs from both STAR and RAxML. Branch lengths were estimated by fitting the concatenated matrices to theinferred topology from STAR.doi: 10.1371/journal.pone.0080870.g002
Phylogenomics Resolve the Placement of Ginkgo
PLOS ONE | www.plosone.org 5 November 2013 | Volume 8 | Issue 11 | e80870
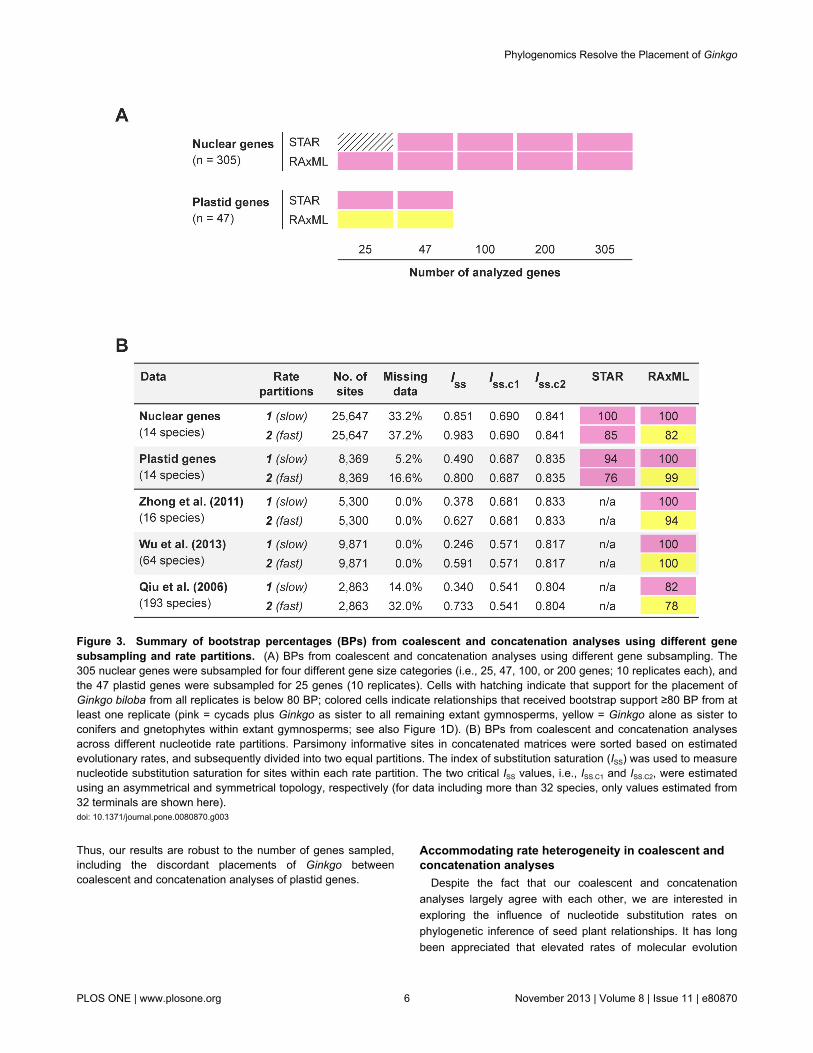
Thus, our results are robust to the number of genes sampled,including the discordant placements of Ginkgo betweencoalescent and concatenation analyses of plastid genes.
Accommodating rate heterogeneity in coalescent andconcatenation analyses
Despite the fact that our coalescent and concatenationanalyses largely agree with each other, we are interested inexploring the influence of nucleotide substitution rates onphylogenetic inference of seed plant relationships. It has longbeen appreciated that elevated rates of molecular evolution
Figure 3. Summary of bootstrap percentages (BPs) from coalescent and concatenation analyses using different genesubsampling and rate partitions. (A) BPs from coalescent and concatenation analyses using different gene subsampling. The305 nuclear genes were subsampled for four different gene size categories (i.e., 25, 47, 100, or 200 genes; 10 replicates each), andthe 47 plastid genes were subsampled for 25 genes (10 replicates). Cells with hatching indicate that support for the placement ofGinkgo biloba from all replicates is below 80 BP; colored cells indicate relationships that received bootstrap support ≥80 BP from atleast one replicate (pink = cycads plus Ginkgo as sister to all remaining extant gymnosperms, yellow = Ginkgo alone as sister toconifers and gnetophytes within extant gymnosperms; see also Figure 1D). (B) BPs from coalescent and concatenation analysesacross different nucleotide rate partitions. Parsimony informative sites in concatenated matrices were sorted based on estimatedevolutionary rates, and subsequently divided into two equal partitions. The index of substitution saturation (ISS) was used to measurenucleotide substitution saturation for sites within each rate partition. The two critical ISS values, i.e., ISS.C1 and ISS.C2, were estimatedusing an asymmetrical and symmetrical topology, respectively (for data including more than 32 species, only values estimated from32 terminals are shown here).doi: 10.1371/journal.pone.0080870.g003
Phylogenomics Resolve the Placement of Ginkgo
PLOS ONE | www.plosone.org 6 November 2013 | Volume 8 | Issue 11 | e80870

can lead to multiple substitutions at the same site [61,62],which can be especially misleading for resolving deeperrelationships if the substitution model fails to correct for highlevels of saturation in fast-evolving sites [24,62-68]. This isespecially relevant for inferring the phylogeny of early diverginggymnosperms given their ancient origin [69-72]. Here, toassess the effect of rate heterogeneity, we partitionednucleotide sites in our concatenated matrices according toestimated evolutionary rates.
The relative evolutionary rate of each site in ourconcatenated matrices was estimated using the ObservedVariability (OV) method [62], which compares all sequences ata given site in a pair-wise manner, and uses the total numberof mismatches between species as the measure of sitevariability. Importantly, since the OV is a tree-independentapproach, it is free from systematic bias of estimatingevolutionary rates using an inaccurate phylogeny [62]. Wesorted all parsimony informative sites in our concatenatednucleotide matrices based on their relative evolutionary ratesand then divided them into two equal partitions (Figures S1Aand S1B). For nuclear genes each rate partition contains25,647 sites, and for plastid genes each partition contains8,369 sites.
When analyzing data from each rate partition separately, thecoalescent method supports (≥76 BP) cycads plus Ginkgo assister to all remaining extant gymnosperms across all ratepartitions for both nuclear and plastid genes (Figure 3B). Incontrast, the concatenation method produces well supported,but incongruent results, across different rate partitions (Figure3B). Here, the slow-evolving sites corroborate results from ourcoalescent analyses and place cycads sister to Ginkgo with100 BP for both nuclear and plastid genes. However, fast-evolving sites support the “Gingko alone” hypothesis with 82BP and 99 BP for nuclear and plastid genes, respectively.Additionally, when the placement of cycads plus Ginkgo isinferred using the concatenation method, the rival placement of“Ginkgo alone” is rejected (p-value < 0.001, AU test). Similarly,in all cases when “Ginkgo alone” is supported, the rivalplacement of cycads plus Ginkgo is rejected (p-value < 0.001,AU test).
To determine if nucleotide substitution saturation mightinfluence the incongruent placements of Ginkgo in ourconcatenation analyses, we characterized sites within each ofour rate partitions using an entropy-based index of substitutionsaturation (ISS) [73]. As ISS approaches 1, or if ISS is not smallerthan the critical ISS value (ISS.C), then sequences are determinedto exhibit substantial saturation [73]. Our analyses demonstratethat for plastid genes (Figure 3B), the slow-evolving sitesexhibit no evidence of saturation (i.e., ISS is significantly smallerthan ISS.C; p-value < 0.001, two-tailed t-test), while the fast-evolving sites show evidence of substantial saturation (i.e., ISS
is greater than ISS.C when the true topology is asymmetrical). Incontrast, our analyses indicate that all rate partitions for nucleargenes show evidence of substantial saturation, but the slow-evolving sites exhibit lower overall levels of saturation (Figure3B). Thus, the nuclear and plastid genes together suggest thatthe incongruence we observe in the placement of Ginkgoacross rate partitions using the concatenation method may be
related to higher overall levels of substitution saturation in fast-evolving nucleotide sites. Further exploration of this question iswarranted.
Finally, since previous studies have established theimportance of taxon sampling in determining the placement ofGinkgo [15], we re-analyzed three concatenated nucleotidematrices from previous studies to confirm that our results arenot biased by insufficient taxon sampling. These three matricesinclude a wide breadth of taxon and gene sampling: i) 16 seedplants using 52 plastid genes from Zhong et al. [24], ii) 64vascular plants using 53 plastid genes from Wu et al. [15], andiii) 193 green plants using six genes representing all three plantgenomic compartments (i.e., nucleus, plastid, andmitochondrion) from Qiu et al. [29]. Our phylogenetic analysesof these three matrices mirror the results using theconcatenation method summarized above. When including onlythose slow-evolving sites identified by the OV method (FiguresS1C–S1E), the clade containing cycads plus Ginkgo is wellsupported (≥82 BP; Figure 3B). In contrast, analyzing only thefast-evolving sites supports (≥78 BP) the “Gingko alone”hypothesis (Figure 3B). Importantly, the slow-evolving sites inall three matrices exhibit no evidence of saturation (p-value <0.001, two-tailed t-test); while the fast-evolving sites in two ofthree matrices show evidence of substantial saturation (Figure3B).
Conclusions
Our phylogenomic analyses of seed plants identify threemain results: i) extant gymnosperms are monophyletic, ii)gnetophytes exhibit discordant placements within conifersbetween their nuclear and plastid genomes, and iii) cycads plusGinkgo form a clade that is sister to all remaining extantgymnosperms. Our results also show that standardconcatenation analyses of both nuclear and plastid genesproduce well supported, but conflicting placements of key taxaacross sites with different substitution rates. Determining thecauses of this incongruence, however, requires more empiricaland simulation studies. Here, we hypothesize that thisincongruence may be related to the way in whichconcatenation methods treat sites with elevated nucleotidesubstitution rates. Although our concatenation analyses of fast-evolving nucleotide sites produced the “Ginkgo alone”topology, the signal from slow-evolving sites appears to haveprevailed. Thus, we did not observe strongly conflictingplacements of Ginkgo between coalescent and concatenationmethods when analyzing all sites together. One interpretationof these results is that concatenation analyses of full data setsmay not be heavily misled by a subset of sites with elevatedsubstitution rates. However, an extrapolation of our specificresults suggests that as saturated sites increase inphylogenomic data sets, standard concatenation methods mayproduce strongly supported but incorrect results. In contrast,coalescent analyses of the same data sets demonstratedconsistent placement of cycads plus Ginkgo, suggesting thatcoalescent-based methods better deal with rate heterogeneity[44-48].
Phylogenomics Resolve the Placement of Ginkgo
PLOS ONE | www.plosone.org 7 November 2013 | Volume 8 | Issue 11 | e80870

How does this increased phylogenetic resolution enhanceour understanding of seed plant evolution? Cycads and Ginkgoshare a number of morphological characters, such as theirunusual pattern of pollen tube development [74], flagellatedmale gametes [75,76], simple female strobili [77], and embryodevelopment [78]. In light of the increasing support of cycadsplus Ginkgo we identify here, some of these traits, which havebeen commonly thought to be symplesiomorphies ofgymnosperms [13,78], may actually represent synapomorphiesof the cycads plus Ginkgo clade [15]. Assessing thesequestions going forward will be challenging, however, given thephenomenally high rate of extinction suffered by gymnosperms[79]. A thoughtful assessment of this question is only likely tobe answered with more exhaustive sampling of fossil lineages.
Materials and Methods
Data acquisition and sequence translationGene sequences from both nuclear and plastid genomes
were gathered for this study. For nuclear genes, assembledunique transcripts were obtained (Table 1) and then translatedto amino acid sequences using prot4EST v2.2 [80]. For plastidgenes, the fully annotated plastid genomes were obtained fromNCBI GenBank (Table 2).
Homology Assignment and Sequence AlignmentThe establishment of sequence homology for phylogenetic
analyses followed Dunn et al. [81] and Hejnol et al. [82]. Briefly,sequence similarity was first assessed for all amino acidsequences using BLASTP v2.2.25 [83] with 10-20 e-valuethreshold, and then grouped using a Markov cluster algorithmas implemented in MCL v09-308 [49] with the inflation valueequals 5.0. Clusters were required to i) include at least onesequence from Selaginella (for outgroup rooting), ii) includesequences from at least four species, iii) include at least 100amino acids for each sequence [84], iv) have a mean of lessthan five sequences per species, and v) have a median of lessthan two sequences per species. Amino acid sequences fromeach cluster were aligned using MUSCLE v3.8.31 [85], andambiguous sites were trimmed using trimAl v1.2rev59 [86] withthe heuristic automated method. Sequences were removedfrom the alignment if they contained less than 70% of the totalalignment length [87]. Nucleotide sequences were then alignedaccording to the corresponding amino acid alignments usingPAL2NAL v14 [88]. For each cluster, the gene tree wasinferred from nucleotide alignments using RAxML v7.2.8 withthe GTRGAMMA substitution model. All but one sequencewere deleted in clades of sequences derived from the samespecies, i.e., monophyly masking, using Phyutility v2.2.6 [89].
Paralogue pruning and species tree assessmentParalogue pruning of each gene tree used for species tree
assessment followed Hejnol et al. [82]. Briefly, we firstidentified the maximally inclusive subtree that contains no morethan one sequence per species. This subtree is then prunedaway and the remaining tree is used as a substrate for anotherround of pruning. The process is repeated until the remaining
tree has no more than one sequence per species. Subtreesproduced by paralogue pruning were then filtered to includeonly those with i) seven or more species and ii) 60% of thespecies present in the original cluster from which they werederived.
For the coalescent approach, individual gene trees were firstinferred using RAxML with the GTRGAMMA substitution modelfrom nucleotide sequences, species relationships were thenestimated from gene trees using STAR as implemented inPhybase v1.3 [90]. For concatenation analyses, theconcatenated nucleotide matrix was generated from individualgenes using Phyutility, and the best-scoring ML tree wasobtained using RAxML with the GTRGAMMA substitutionmodel. Bootstrap support was estimated for both coalescentand concatenation methods using a multilocus bootstrapapproach as described in the Results and Discussion sectionwith 200 replicates.
Alternative topology tests were performed in the MLframework using the AU test as implemented in scalebootv0.3-3 [91]. All constrained searches were conducted inRAxML using the GTRGAMMA substitution model.
Gene subsamplingTo subsample gene clusters, the 305 nuclear gene clusters
were randomly selected for the sizes of 25, 47, 100, and 200genes, and the 47 plastid gene clusters were randomlyselected for the size of 25 genes. Ten sets of gene clusterswere selected as replicates for each size. Species trees andbootstrap support were estimated using STAR and RAxML foreach replicate as described above.
Estimation of evolutionary rate and substitutionsaturation assessment
The OV method was used to measure the relativeevolutionary rate of each site in all five concatenated matrices(Figure 3B) as described in the Results and Discussion section.Species trees and bootstrap supports were estimated usingSTAR and RAxML for each rate partition as described above.
Nucleotide substitution saturation was measured using ISS asimplemented in DAMBE [92]. ISS was estimated for each ratepartition from 200 replicates with gaps treated as unknownstates.
Supporting Information
Figure S1. The estimated evolutionary rates for nucleotidesites in all five concatenated matrices analyzed in thisstudy. Parsimony informative sites in each concatenatedmatrix were sorted based on the Observed Variability (OV)method, and subsequently divided into two equal partitions.(PDF)
Table S1. Data characteristics for all 305 nuclear genes,including the locus ID of sequence from Selaginellamoellendorffii in each gene, number of species per gene,number of nucleotide sites per gene, and percentage ofgaps per gene.
Phylogenomics Resolve the Placement of Ginkgo
PLOS ONE | www.plosone.org 8 November 2013 | Volume 8 | Issue 11 | e80870
(PDF)
Table S2. Data characteristics for all 47 plastid genes,including number of species per gene, number ofnucleotide sites per gene, and percentage of gaps pergene.(PDF)
Acknowledgements
We thank Dannie Durand, Andrew Knoll, and members of theDavis, Durand, and Rest laboratories for advice and
discussion. We also thank Casey Dunn, Mike Ethier, andAlexandros Stamatakis for technical support.
Author Contributions
Conceived and designed the experiments: ZX JSR CCD.Performed the experiments: ZX. Analyzed the data: ZX JSRCCD. Wrote the manuscript: ZX JSR CCD.
References
1. Rothwell GW, Scheckler SE, Gillespie WH (1989) Elkinsia gen. nov., alate Devonian gymnosperm with cupulate ovules. Bot Gaz 150:170-189. doi:10.1086/337763.
2. Fiz-Palacios O, Schneider H, Heinrichs J, Savolainen V (2011)Diversification of land plants: insights from a family-level phylogeneticanalysis. BMC Evol Biol 11: 341. doi:10.1186/1471-2148-11-341.PubMed: 22103931.
3. Mathews S (2009) Phylogenetic relationships among seed plants:persistent questions and the limits of molecular data. Am J Bot 96:228-236. doi:10.3732/ajb.0800178. PubMed: 21628186.
4. Goremykin V, Bobrova V, Pahnke J, Troitsky A, Antonov A et al. (1996)Noncoding sequences from the slowly evolving chloroplast invertedrepeat in addition to rbcL data do not support Gnetalean affinities ofangiosperms. Mol Biol Evol 13: 383-396. doi:10.1093/oxfordjournals.molbev.a025597. PubMed: 8587503.
5. Chaw SM, Zharkikh A, Sung HM, Lau TC, Li WH (1997) Molecularphylogeny of extant gymnosperms and seed plant evolution: analysis ofnuclear 18S rRNA sequences. Mol Biol Evol 14: 56-68. doi:10.1093/oxfordjournals.molbev.a025702. PubMed: 9000754.
6. Samigullin TK, Martin WF, Troitsky AV, Antonov AS (1999) Moleculardata from the chloroplast rpoC1 gene suggest deep and distinctdichotomy of contemporary spermatophytes into two monophyla:gymnosperms (including Gnetales) and angiosperms. J Mol Evol 49:310-315. doi:10.1007/PL00006553. PubMed: 10473771.
7. Bowe LM, Coat G, dePamphilis CW (2000) Phylogeny of seed plantsbased on all three genomic compartments: extant gymnosperms aremonophyletic and Gnetales' closest relatives are conifers. Proc NatlAcad Sci U S A 97: 4092-4097. doi:10.1073/pnas.97.8.4092. PubMed:10760278.
8. Chaw SM, Parkinson CL, Cheng YC, Vincent TM, Palmer JD (2000)Seed plant phylogeny inferred from all three plant genomes: monophylyof extant gymnosperms and origin of Gnetales from conifers. Proc NatlAcad Sci U S A 97: 4086-4091. doi:10.1073/pnas.97.8.4086. PubMed:10760277.
9. Nickrent DL, Parkinson CL, Palmer JD, Duff RJ (2000) Multigenephylogeny of land plants with special reference to bryophytes and theearliest land plants. Mol Biol Evol 17: 1885-1895. doi:10.1093/oxfordjournals.molbev.a026290. PubMed: 11110905.
10. Gugerli F, Sperisen C, Büchler U, Brunner L, Brodbeck S et al. (2001)The evolutionary split of Pinaceae from other conifers: evidence froman intron loss and a multigene phylogeny. Mol Phylogenet Evol 21:167-175. doi:10.1006/mpev.2001.1004. PubMed: 11697913.
11. Soltis DE, Soltis PS, Zanis MJ (2002) Phylogeny of seed plants basedon evidence from eight genes. Am J Bot 89: 1670-1681. doi:10.3732/ajb.89.10.1670. PubMed: 21665594.
12. Mathews S, Clements MD, Beilstein MA (2010) A duplicate generooting of seed plants and the phylogenetic position of flowering plants.Philos Trans R Soc Lond B Biol Sci 365: 383-395. doi:10.1098/rstb.2009.0233. PubMed: 20047866.
13. Crane PR (1985) Phylogenetic analysis of seed plants and the origin ofangiosperms. Ann Missouri Bot Gard 72: 716-793. doi:10.2307/2399221.
14. Doyle JA, Donoghue MJ (1986) Seed plant phylogeny and the origin ofangiosperms: an experimental cladistic approach. Bot Rev 52: 321-431.doi:10.1007/BF02861082.
15. Wu CS, Chaw SM, Huang YY (2013) Chloroplast phylogenomicsindicates that Ginkgo biloba is sister to cycads. Genome Biol Evol 5:243-254. doi:10.1093/gbe/evt001. PubMed: 23315384.
16. Burleigh JG, Mathews S (2004) Phylogenetic signal in nucleotide datafrom seed plants: implications for resolving the seed plant tree of life.Am J Bot 91: 1599-1613. doi:10.3732/ajb.91.10.1599. PubMed:21652311.
17. Hajibabaei M, Xia JN, Drouin G (2006) Seed plant phylogeny:gnetophytes are derived conifers and a sister group to Pinaceae. MolPhylogenet Evol 40: 208-217. doi:10.1016/j.ympev.2006.03.006.PubMed: 16621615.
18. Qiu YL, Li LB, Wang B, Chen ZD, Dombrovska O et al. (2007) Anonflowering land plant phylogeny inferred from nucleotide sequencesof seven chloroplast, mitochondrial, and nuclear genes. Int J Plant Sci168: 691-708. doi:10.1086/513474.
19. Finet C, Timme RE, Delwiche CF, Marlétaz F (2010) Multigenephylogeny of the green lineage reveals the origin and diversification ofland plants. Curr Biol 20: 2217-2222. doi:10.1016/j.cub.2010.11.035.PubMed: 21145743.
20. Regina TMR, Quagliariello C (2010) Lineage-specific group II introngains and losses of the mitochondrial rps3 gene in gymnosperms. PlantPhysiol Biochem 48: 646-654. doi:10.1016/j.plaphy.2010.05.003.PubMed: 20605476.
21. Zhong B, Yonezawa T, Zhong Y, Hasegawa M (2010) The position ofgnetales among seed plants: overcoming pitfalls of chloroplastphylogenomics. Mol Biol Evol 27: 2855-2863. doi:10.1093/molbev/msq170. PubMed: 20601411.
22. Wodniok S, Brinkmann H, Glöckner G, Heidel AJ, Philippe H et al.(2011) Origin of land plants: do conjugating green algae hold the key?BMC Evol Biol 11: 104. doi:10.1186/1471-2148-11-104. PubMed:21501468.
23. Wu CS, Wang YN, Hsu CY, Lin CP, Chaw SM (2011) Loss of differentinverted repeat copies from the chloroplast genomes of Pinaceae andcupressophytes and influence of heterotachy on the evaluation ofgymnosperm phylogeny. Genome Biol Evol 3: 1284-1295. doi:10.1093/gbe/evr095. PubMed: 21933779.
24. Zhong B, Deusch O, Goremykin VV, Penny D, Biggs PJ et al. (2011)Systematic error in seed plant phylogenomics. Genome Biol Evol 3:1340-1348. doi:10.1093/gbe/evr105. PubMed: 22016337.
25. Ran JH, Gao H, Wang XQ (2010) Fast evolution of the retroprocessedmitochondrial rps3 gene in Conifer II and further evidence for thephylogeny of gymnosperms. Mol Phylogenet Evol 54: 136-149. doi:10.1016/j.ympev.2009.09.011. PubMed: 19761858.
26. Qiu YL, Lee JH, Bernasconi-Quadroni F, Soltis DE, Soltis PS et al.(1999) The earliest angiosperms: evidence from mitochondrial, plastidand nuclear genomes. Nature 402: 404-407. doi:10.1038/46536.PubMed: 10586879.
27. Qiu YL, Lee J, Bernasconi-Quadroni F, Soltis DE, Soltis PS et al.(2000) Phylogeny of basal angiosperms: analyses of five genes fromthree genomes. Int J Plant Sci 161: S3-S27. doi:10.1086/317584.
28. Qiu YL, Li LB, Hendry TA, Li RQ, Taylor DW et al. (2006)Reconstructing the basal angiosperm phylogeny: evaluating informationcontent of mitochondrial genes. Taxon 55: 837-856. doi:10.2307/25065680.
29. Qiu YL, Li LB, Wang B, Chen ZD, Knoop V et al. (2006) The deepestdivergences in land plants inferred from phylogenomic evidence. ProcNatl Acad Sci U S A 103: 15511-15516. doi:10.1073/pnas.0603335103.PubMed: 17030812.
30. Wu CS, Wang YN, Liu SM, Chaw SM (2007) Chloroplast genome(cpDNA) of Cycas taitungensis and 56 cp protein-coding genes ofGnetum parvifolium: Insights into cpDNA evolution and phylogeny of
Phylogenomics Resolve the Placement of Ginkgo
PLOS ONE | www.plosone.org 9 November 2013 | Volume 8 | Issue 11 | e80870

extant seed plants. Mol Biol Evol 24: 1366-1379. doi:10.1093/molbev/msm059. PubMed: 17383970.
31. Rydin C, Kallersjo M, Friist EM (2002) Seed plant relationships and thesystematic position of Gnetales based on nuclear and chloroplast DNA:conflicting data, rooting problems, and the monophyly of conifers. Int JPlant Sci 163: 197-214. doi:10.1086/338321.
32. Burleigh JG, Mathews S (2007) Assessing among-locus variation in theinference of seed plant phylogeny. Int J Plant Sci 168: 111-124. doi:10.1086/509586.
33. Rai HS, Reeves PA, Peakall R, Olmstead RG, Graham SW (2008)Inference of higher-order conifer relationships from a multi-locus plastiddata set. Botany 86: 658-669. doi:10.1139/B08-062.
34. de la Torre-Bárcena JE, Kolokotronis SO, Lee EK, Stevenson DW,Brenner ED et al. (2009) The impact of outgroup choice and missingdata on major seed plant phylogenetics using genome-wide EST data.PLOS ONE 4: e5764. doi:10.1371/journal.pone.0005764. PubMed:19503618.
35. Graham SW, Iles WJD (2009) Different gymnosperm outgroups have(mostly) congruent signal regarding the root of flowering plantphylogeny. Am J Bot 96: 216-227. doi:10.3732/ajb.0800320. PubMed:21628185.
36. Cibrián-Jaramillo A, De la Torre-Bárcena JE, Lee EK, Katari MS, LittleDP et al. (2010) Using phylogenomic patterns and gene ontology toidentify proteins of importance in plant evolution. Genome Biol Evol 2:225-239. doi:10.1093/gbe/evq012. PubMed: 20624728.
37. Lee EK, Cibrian-Jaramillo A, Kolokotronis SO, Katari MS, Stamatakis Aet al. (2011) A functional phylogenomic view of the seed plants. PLOSGenet 7: e1002411.
38. Huelsenbeck JP, Bull JJ, Cunningham CW (1996) Combining data inphylogenetic analysis. Trends Ecol Evol 11: 152-158. doi:10.1016/0169-5347(96)10006-9. PubMed: 21237790.
39. Mossel E, Vigoda E (2005) Phylogenetic MCMC algorithms aremisleading on mixtures of trees. Science 309: 2207-2209. doi:10.1126/science.1115493. PubMed: 16195459.
40. Degnan JH, Rosenberg NA (2006) Discordance of species trees withtheir most likely gene trees. PLoS Genet 2: e68. doi:10.1371/journal.pgen.0020068. PubMed: 16733550.
41. Kubatko LS, Degnan JH (2007) Inconsistency of phylogeneticestimates from concatenated data under coalescence. Syst Biol 56:17-24. doi:10.1080/10635150601146041. PubMed: 17366134.
42. Rosenberg NA, Tao R (2008) Discordance of species trees with theirmost likely gene trees: the case of five taxa. Syst Biol 57: 131-140. doi:10.1080/10635150801905535. PubMed: 18300026.
43. Liu L, Edwards SV (2009) Phylogenetic analysis in the anomaly zone.Syst Biol 58: 452-460. doi:10.1093/sysbio/syp034. PubMed: 20525599.
44. Liu L, Pearl DK, Brumfield RT, Edwards SV (2008) Estimating speciestrees using multiple-allele DNA sequence data. Evolution 62:2080-2091. doi:10.1111/j.1558-5646.2008.00414.x. PubMed:18462214.
45. Degnan JH, Rosenberg NA (2009) Gene tree discordance,phylogenetic inference and the multispecies coalescent. Trends EcolEvol 24: 332-340. doi:10.1016/j.tree.2009.01.009. PubMed: 19307040.
46. Liu L, Yu L, Pearl DK, Edwards SV (2009) Estimating speciesphylogenies using coalescence times among sequences. Syst Biol 58:468-477. doi:10.1093/sysbio/syp031. PubMed: 20525601.
47. Liu L, Yu L, Edwards SV (2010) A maximum pseudo-likelihoodapproach for estimating species trees under the coalescent model.BMC Evol Biol 10: 302. doi:10.1186/1471-2148-10-302. PubMed:20937096.
48. Song S, Liu L, Edwards SV, Wu S (2012) Resolving conflict ineutherian mammal phylogeny using phylogenomics and themultispecies coalescent model. Proc Natl Acad Sci U S A 109:14942-14947. doi:10.1073/pnas.1211733109. PubMed: 22930817.
49. Enright AJ, van Dongen S, Ouzounis CA (2002) An efficient algorithmfor large-scale detection of protein families. Nucleic Acids Res 30:1575-1584. doi:10.1093/nar/30.7.1575. PubMed: 11917018.
50. Duvick J, Fu A, Muppirala U, Sabharwal M, Wilkerson MD et al. (2008)PlantGDB: a resource for comparative plant genomics. Nucleic AcidsRes 36: D959-D965. PubMed: 18063570.
51. Jiao Y, Wickett NJ, Ayyampalayam S, Chanderbali AS, Landherr L etal. (2011) Ancestral polyploidy in seed plants and angiosperms. Nature473: 97-100. doi:10.1038/nature09916. PubMed: 21478875.
52. Banks JA, Nishiyama T, Hasebe M, Bowman JL, Gribskov M et al.(2011) The Selaginella genome identifies genetic changes associatedwith the evolution of vascular plants. Science 332: 960-963. doi:10.1126/science.1203810. PubMed: 21551031.
53. Medgyesy P, Fejes E, Maliga P (1985) Interspecific chloroplastrecombination in a Nicotiana somatic hybrid. Proc Natl Acad Sci U S A82: 6960-6964. doi:10.1073/pnas.82.20.6960. PubMed: 16593619.
54. Ogihara Y, Terachi T, Sasakuma T (1988) Intramolecularrecombination of chloroplast genome mediated by short direct-repeatsequences in wheat species. Proc Natl Acad Sci U S A 85: 8573-8577.doi:10.1073/pnas.85.22.8573. PubMed: 3186748.
55. Rajora OP, Dancik BP (1995) Chloroplast DNA variation in Populus. III.Novel chloroplast DNA variants in natural Populus × canadensishybrids. Theor Appl Genet 90: 331-334. PubMed: 24173921.
56. Wolfe AD, Randle CP (2004) Recombination, heteroplasmy, haplotypepolymorphism, and paralogy in plastid genes: Implications for plantmolecular systematics. Syst Bot 29: 1011-1020. doi:10.1600/0363644042451008.
57. Jakob SS, Blattner FR (2006) A chloroplast genealogy of Hordeum(Poaceae): long-term persisting haplotypes, incomplete lineage sorting,regional extinction, and the consequences for phylogenetic inference.Mol Biol Evol 23: 1602-1612. doi:10.1093/molbev/msl018. PubMed:16754643.
58. Stamatakis A (2006) RAxML-VI-HPC: Maximum likelihood-basedphylogenetic analyses with thousands of taxa and mixed models.Bioinformatics 22: 2688-2690. doi:10.1093/bioinformatics/btl446.PubMed: 16928733.
59. Seo TK (2008) Calculating bootstrap probabilities of phylogeny usingmultilocus sequence data. Mol Biol Evol 25: 960-971. doi:10.1093/molbev/msn043. PubMed: 18281270.
60. Shimodaira H (2002) An approximately unbiased test of phylogenetictree selection. Syst Biol 51: 492-508. doi:10.1080/10635150290069913. PubMed: 12079646.
61. Olsen GJ (1987) Earliest phylogenetic branchings: comparing rRNA-based evolutionary trees inferred with various techniques. Cold SpringHarb Symp Quant Biol 52: 825-837. doi:10.1101/SQB.1987.052.01.090. PubMed: 3454291.
62. Goremykin VV, Nikiforova SV, Bininda-Emonds OR (2010) Automatedremoval of noisy data in phylogenomic analyses. J Mol Evol 71:319-331. doi:10.1007/s00239-010-9398-z. PubMed: 20976444.
63. Brinkmann H, Philippe H (1999) Archaea sister group of bacteria?Indications from tree reconstruction artifacts in ancient phylogenies.Mol Biol Evol 16: 817-825. doi:10.1093/oxfordjournals.molbev.a026166.PubMed: 10368959.
64. Hirt RP, Logsdon JM, Healy B, Dorey MW, Doolittle WF et al. (1999)Microsporidia are related to Fungi: evidence from the largest subunit ofRNA polymerase II and other proteins. Proc Natl Acad Sci U S A 96:580-585. doi:10.1073/pnas.96.2.580. PubMed: 9892676.
65. Philippe H, Lopez P, Brinkmann H, Budin K, Germot A et al. (2000)Early-branching or fast-evolving eukaryotes? An answer based onslowly evolving positions. Proc Biol Sci 267: 1213-1221. doi:10.1098/rspb.2000.1130. PubMed: 10902687.
66. Gribaldo S, Philippe H (2002) Ancient phylogenetic relationships. TheorPopul Biol 61: 391-408. doi:10.1006/tpbi.2002.1593. PubMed:12167360.
67. Pisani D (2004) Identifying and removing fast-evolving sites usingcompatibility analysis: an example from the arthropoda. Syst Biol 53:978-989. doi:10.1080/10635150490888877. PubMed: 15764565.
68. Philippe H, Roure B (2011) Difficult phylogenetic questions: more data,maybe; better methods, certainly. BMC Biol 9: 91. doi:10.1186/1741-7007-9-91. PubMed: 22206462.
69. Schneider H, Schuettpelz E, Pryer KM, Cranfill R, Magallón S et al.(2004) Ferns diversified in the shadow of angiosperms. Nature 428:553-557. doi:10.1038/nature02361. PubMed: 15058303.
70. Smith SA, Beaulieu JM, Donoghue MJ (2010) An uncorrelated relaxed-clock analysis suggests an earlier origin for flowering plants. Proc NatlAcad Sci U S A 107: 5897-5902. doi:10.1073/pnas.1001225107.PubMed: 20304790.
71. Clarke JT, Warnock RCM, Donoghue PCJ (2011) Establishing a time-scale for plant evolution. New Phytol 192: 266-301. doi:10.1111/j.1469-8137.2011.03794.x. PubMed: 21729086.
72. Magallón S, Hilu KW, Quandt D (2013) Land plant evolutionarytimeline: gene effects are secondary to fossil constraints in relaxedclock estimation of age and substitution rates. Am J Bot 100: 556-573.doi:10.3732/ajb.1200416. PubMed: 23445823.
73. Xia X, Xie Z, Salemi M, Chen L, Wang Y (2003) An index of substitutionsaturation and its application. Mol Phylogenet Evol 26: 1-7. doi:10.1016/S1055-7903(02)00326-3. PubMed: 12470932.
74. Friedman WE (1993) The evolutionary history of the seed plant malegametophyte. Trends Ecol Evol 8: 15-21. doi:10.1016/0169-5347(93)90125-9. PubMed: 21236093.
75. Brenner ED, Stevenson DW, Twigg RW (2003) Cycads: evolutionaryinnovations and the role of plant-derived neurotoxins. Trends Plant Sci8: 446-452. doi:10.1016/S1360-1385(03)00190-0. PubMed: 13678912.
76. Norstog KJ, Gifford EM, Stevenson DW (2004) Comparativedevelopment of the spermatozoids of cycads and Ginkgo biloba. Bot
Phylogenomics Resolve the Placement of Ginkgo
PLOS ONE | www.plosone.org 10 November 2013 | Volume 8 | Issue 11 | e80870

Rev 70: 5-15. Available online at:10.1663/0006-8101(2004)070[0005:CDOTSO]2.0.CO;2
77. Rudall PJ, Bateman RM (2010) Defining the limits of flowers: thechallenge of distinguishing between the evolutionary products of simpleversus compound strobili. Philos Trans R Soc Lond B Biol Sci 365:397-409. doi:10.1098/rstb.2009.0234. PubMed: 20047867.
78. Wang L, Wang D, Lin MM, Lu Y, Jiang XX et al. (2011) Anembryological study and systematic significance of the primitivegymnosperm Ginkgo biloba. J Syst Evol 49: 353-361. doi:10.1111/j.1759-6831.2011.00123.x.
79. Crisp MD, Cook LG (2011) Cenozoic extinctions account for the lowdiversity of extant gymnosperms compared with angiosperms. NewPhytol 192: 997-1009. doi:10.1111/j.1469-8137.2011.03862.x.PubMed: 21895664.
80. Wasmuth JD, Blaxter ML (2004) prot4EST: translating expressedsequence tags from neglected genomes. BMC Bioinformatics 5: 187.doi:10.1186/1471-2105-5-187. PubMed: 15571632.
81. Dunn CW, Hejnol A, Matus DQ, Pang K, Browne WE et al. (2008)Broad phylogenomic sampling improves resolution of the animal tree oflife. Nature 452: 745-749. doi:10.1038/nature06614. PubMed:18322464.
82. Hejnol A, Obst M, Stamatakis A, Ott M, Rouse GW et al. (2009)Assessing the root of bilaterian animals with scalable phylogenomicmethods. Proc Biol Sci 276: 4261-4270. doi:10.1098/rspb.2009.0896.PubMed: 19759036.
83. Altschul SF, Gish W, Miller W, Myers EW, Lipman DJ (1990) Basiclocal alignment search tool. J Mol Biol 215: 403-410. doi:10.1016/S0022-2836(05)80360-2. PubMed: 2231712.
84. Liu QP, Xue QZ (2005) Comparative studies on codon usage pattern ofchloroplasts and their host nuclear genes in four plant species. J Genet84: 55-62. doi:10.1007/BF02715890. PubMed: 15876584.
85. Edgar RC (2004) MUSCLE: multiple sequence alignment with highaccuracy and high throughput. Nucleic Acids Res 32: 1792-1797. doi:10.1093/nar/gkh340. PubMed: 15034147.
86. Capella-Gutiérrez S, Silla-Martínez JM, Gabaldón T (2009) trimAl: atool for automated alignment trimming in large-scale phylogeneticanalyses. Bioinformatics 25: 1972-1973. doi:10.1093/bioinformatics/btp348. PubMed: 19505945.
87. Jiao Y, Leebens-Mack J, Ayyampalayam S, Bowers JE, McKain MR etal. (2012) A genome triplication associated with early diversification ofthe core eudicots. Genome Biol 13: R3. doi:10.1186/gb-2012-13-1-r3.PubMed: 22280555.
88. Suyama M, Torrents D, Bork P (2006) PAL2NAL: robust conversion ofprotein sequence alignments into the corresponding codon alignments.Nucleic Acids Res 34: W609-W612. doi:10.1093/nar/gkl315. PubMed:16845082.
89. Smith SA, Dunn CW (2008) Phyutility: a phyloinformatics tool for trees,alignments and molecular data. Bioinformatics 24: 715-716. doi:10.1093/bioinformatics/btm619. PubMed: 18227120.
90. Liu L, Yu L (2010) Phybase: an R package for species tree analysis.Bioinformatics 26: 962-963. doi:10.1093/bioinformatics/btq062.PubMed: 20156990.
91. Shimodaira H (2008) Testing regions with nonsmooth boundaries viamultiscale bootstrap. J Stat Plan Infer 138: 1227-1241. doi:10.1016/j.jspi.2007.04.001.
92. Xia X, Xie Z (2001) DAMBE: software package for data analysis inmolecular biology and evolution. J Hered 92: 371-373. doi:10.1093/jhered/92.4.371. PubMed: 11535656.
Phylogenomics Resolve the Placement of Ginkgo
PLOS ONE | www.plosone.org 11 November 2013 | Volume 8 | Issue 11 | e80870