phylogenetic structure of foliar spectral traits in...
TRANSCRIPT

remote sensing
Article
Phylogenetic Structure of Foliar Spectral Traits inTropical Forest Canopies
Kelly M McManus 12 Gregory P Asner 12 Roberta E Martin 1 Kyle G Dexter 34W John Kress 5 and Christopher B Field 12
1 Department of Global Ecology Carnegie Institution for Science Stanford CA 94305 USAgpacarnegiescienceedu (GPA) rmartincarnegiescienceedu (REM)cfieldcarnegiescienceedu (CBF)
2 Department of Earth System Science Stanford University Stanford CA 94305 USA3 School of GeoSciences University of Edinburgh Edinburgh EH9 3FF UK kyledexteredacuk4 Royal Botanic Garden Edinburgh Edinburgh EH3 5LR UK5 Department of Botany Smithsonian National Museum of Natural History Washington DC 20560 USA
kressjsiedu Correspondence mcmanuskstanfordedu Tel +1-650-319-8904 Fax +1-650-462-5968
Academic Editors Susan L Ustin Randolph H Wynne and Prasad S ThenkabailReceived 1 December 2015 Accepted 22 February 2016 Published 27 February 2016
Abstract The Spectranomics approach to tropical forest remote sensing has established a link betweenfoliar reflectance spectra and the phylogenetic composition of tropical canopy tree communitiesvis-agrave-vis the taxonomic organization of biochemical trait variation However a direct relationshipbetween phylogenetic affiliation and foliar reflectance spectra of species has not been establishedWe sought to develop this relationship by quantifying the extent to which underlying patternsof phylogenetic structure drive interspecific variation among foliar reflectance spectra withinthree Neotropical canopy tree communities with varying levels of soil fertility We interpretedthe resulting spectral patterns of phylogenetic signal in the context of foliar biochemical traits thatmay contribute to the spectral-phylogenetic link We utilized a multi-model ensemble to elucidatetrait-spectral relationships and quantified phylogenetic signal for spectral wavelengths and traitsusing Pagelrsquos lambda statistic Foliar reflectance spectra showed evidence of phylogenetic influenceprimarily within the visible and shortwave infrared spectral regions These regions were also selectedby the multi-model ensemble as those most important to the quantitative prediction of several foliarbiochemical traits Patterns of phylogenetic organization of spectra and traits varied across sites andwith soil fertility indicative of the complex interactions between the environmental and phylogeneticcontrols underlying patterns of biodiversity
Keywords functional traits hyperspectral imaging spectroscopy phylogeny phylogenetic signalsoil fertility spectranomics tropical forest
1 Introduction
Advances in ecological remote sensing over recent decades have contributed substantial newinsights into patterns and processes of biophysical and biochemical variation in species-rich tropicalforests Imaging spectroscopy also known as hyperspectral imaging (HSI) has served as thetechnological backbone for many of these advances [1] as the fine spectral resolution (2ndash10 nm)and extended spectral range (380ndash2500 nm) provided by HSI facilitate the quantitative retrieval of awide range of biochemical attributes [2ndash4] Variation in remotely-sensed biochemical traits has beenused to assess forest canopy functioning including water stress pest pressure and canopy fluxes innutrients and carbon [5ndash7] Further HSI data have shown significant potential for mapping community
Remote Sens 2016 8 196 doi103390rs8030196 wwwmdpicomjournalremotesensing
Remote Sens 2016 8 196 2 of 16
composition including species and plant functional groups based largely on their biochemicaltraits [8ndash10] However a challenge remains to understand whether trait variation (measured directly orremotely sensed) arising from taxonomic differences is confounded by environmental gradients [1112]
Phylogenetic relatedness ie the degree to which species share evolutionary histories can explaina substantial proportion of morphological and genetic variation among species within ecologicalcommunities [1314] However only recently have sufficient data on the relationships of rare tropicaltree species become available to allow researchers to assess phylogenetic patterns of trait variationin addition to their impact on emergent community-level properties [15ndash17] Recent phylogeneticstudies have contributed insights into the assembly of tropical forest tree communities [18ndash21] butlittle work has been done to relate phylogenies with remote sensing approaches to tropical canopycommunity ecology In the context of high-diversity tropical forests extensive DNA sequence dataeg from DNA barcoding efforts may prove particularly valuable for understanding the spectralproperties of closely-related taxa For the most part phylogenetic methods have not been incorporatedinto remote-sensing based analyses of foliar trait variation An exception is the work of Asnerand Martin (2009) [12] which quantified the taxonomic and environmental components of traitvariation across a gradient of soil fertility in a lowland Amazonian forest using a hierarchical ANOVAprocedure to partition taxonomic variance of biochemical traits into family genus-within-family andspecies-within-genus components However while this approach quantifies the entire pattern inphylogenetic relatedness in a community it does not allow for variance in the distance between taxaat the same taxonomic rank Explicit phylogenetic analyses using phylogenies derived from DNAsequence data may resolve the role of relatedness in determining patterns of trait variation particularlyamong species and genera [22]
Many traits that are capable of being detected or quantified from HSI such as foliar nitrogenchlorophyll phosphorus and specific leaf area vary among tropical tree species in proportion tophylogenetic relatedness or exhibit ldquophylogenetic signalrdquo [122123] Moreover patterns of multivariatetrait co-variation such as stoichiometric ratios between foliar nutrients are tightly linked with patternsof species diversity [24] so much so that species-specific chemical portfolios are now utilized toidentify species using an approach called Spectranomics developed by Asner and Martin (2009) [25]Other spectroscopic techniques such as near-infrared spectroscopy of dried plant materials have beenutilized to discriminate species on the basis of their chemical properties [2627] It might therefore beanticipated that along with the biochemical traits themselves variations among the reflectance spectraof co-existing species within a tropical tree community may directly reflect the phylogenetic structureof that community Methods to quantify the degree of phylogenetic signal are well establishedfor assessing patterns of interspecific trait variation [13142829] and adapting such methods tospectral analysis may be achieved by calculating phylogenetic signal for each wavelength across thereflectance spectrum
Here we ask whether tropical canopy tree foliar reflectance spectra exhibit phylogenetic signalas measured by the Pagelrsquos λ [28] for three distinct Neotropical rainforest canopy communities thatvary in soil fertility and community composition We then investigate the relationship between foliarreflectance spectra and phylogenetic structure by (1) examining the relationships between spectra anda suite of nine biochemical traits that relate to a wide range of leaf functions and which are known tobe expressed in leaf reflectance spectra and (2) directly quantifying the phylogenetic signal of thesebiochemical traits
2 Methods
21 General Approach
We examined patterns of phylogenetic signal of foliar spectra at high and low fertility forestsites in the context of the established relationships of foliar biochemical traits with both spectral andphylogenetic patterns Our dataset included nine traits that represent a range of leaf functions and
Remote Sens 2016 8 196 3 of 16
have established quantitative relationships with foliar reflectance spectra nitrogen (N ) phosphorus(P ) calcium (Ca ) leaf-mass-per-area (LMA guml macute2) lignin (Lig ) cellulose (Cel ) totalphenols (Phe mguml gacute1) condensed tannins (Tan mguml gacute1) and chlorophyll (Chl mguml gacute1) [2312]Foliar N LMA and chlorophyll relate to growth rates and rates of leaf turnover [30ndash32] Foliar P andCa are rock-derived nutrients often thought to limit growth in tropical forests [33] Lignin and cellulosereflect foliar investments into leaf structure and longevity [34] and phenols and tannins are known tofunction primarily as anti-herbivore defenses [3536] We quantified the relationships between spectraand traits utilizing the multi-model ensemble of Feilhauer et al [37] which has been shown to improvethe robustness of the spectral band selection process relative to utilizing a single technique aloneWe measured the phylogenetic relationships of both spectra and traits with two different phylogeniesone derived from the supertree available through the program Phylomatic [38] and one reconstructedfrom a concatenated alignment of DNA sequences for two plastid markers commonly utilized in plantDNA barcoding matK and rbcL The former includes all taxa but lacks resolution among species withingenera and among genera within families
22 Site Descriptions
This study was conducted in three Neotropical forests that are similar in climate but span a widerange of soil fertility (Figure 1 Table 1) Barro Colorado Island (BCI) Panama is a roughly 15 km2
island located in Lake Gatun The forests of BCI are characterized as moist deciduous tropical forestunderlain by sedimentary volcanic and marine substrates of the early and late Oligocene and anandesite cap forming the highest point on the island (elevation = 137 m asl) [39] Soils on BCI havebeen classified as primarily Combisols and Ferralsols by Baillie et al (2007) [40] and are unusuallyfertile compared to continental neotropical soils [40ndash42] with soil macronutrients evenly distributedacross the landscape [4344] Two additional sites were located along the Tambopata River in thesouthern Peruvian Amazon basin distinguished by varying soil classifications This area is known asldquoChunchordquo and encompasses 6033 ha of moderately high terraces (13ndash17 m) and adjacent expansivefloodplains located upriver from the confluence of the Malinowski and Tambopata Rivers [45] The firstsite in this area Tam-I was on floodplain forests characterized by high-fertility Inceptisols originatingin the Andes and deposited throughout the Holocene [46] The second site Tam-U was located in theterra firme forests on flat to undulating Pleistocene surfaces c 15ndash20 m above the floodplain forestsand are classified as weathered lower fertility haplic Ultisols
Remote Sens 2016 8 196 3 of 16
Foliar P and Ca are rock-derived nutrients often thought to limit growth in tropical forests [33] Lignin and cellulose reflect foliar investments into leaf structure and longevity [34] and phenols and tannins are known to function primarily as anti-herbivore defenses [3536] We quantified the relationships between spectra and traits utilizing the multi-model ensemble of Feilhauer et al [37] which has been shown to improve the robustness of the spectral band selection process relative to utilizing a single technique alone We measured the phylogenetic relationships of both spectra and traits with two different phylogenies one derived from the supertree available through the program Phylomatic [38] and one reconstructed from a concatenated alignment of DNA sequences for two plastid markers commonly utilized in plant DNA barcoding matK and rbcL The former includes all taxa but lacks resolution among species within genera and among genera within families
22 Site Descriptions
This study was conducted in three Neotropical forests that are similar in climate but span a wide range of soil fertility (Figure 1 Table 1) Barro Colorado Island (BCI) Panama is a roughly 15 km2 island located in Lake Gatun The forests of BCI are characterized as moist deciduous tropical forest underlain by sedimentary volcanic and marine substrates of the early and late Oligocene and an andesite cap forming the highest point on the island (elevation = 137 m asl) [39] Soils on BCI have been classified as primarily Combisols and Ferralsols by Baillie et al (2007) [40] and are unusually fertile compared to continental neotropical soils [40ndash42] with soil macronutrients evenly distributed across the landscape [4344] Two additional sites were located along the Tambopata River in the southern Peruvian Amazon basin distinguished by varying soil classifications This area is known as ldquoChunchordquo and encompasses 6033 ha of moderately high terraces (13ndash17 m) and adjacent expansive floodplains located upriver from the confluence of the Malinowski and Tambopata Rivers [45] The first site in this area Tam-I was on floodplain forests characterized by high-fertility Inceptisols originating in the Andes and deposited throughout the Holocene [46] The second site Tam-U was located in the terra firme forests on flat to undulating Pleistocene surfaces c 15ndash20 m above the floodplain forests and are classified as weathered lower fertility haplic Ultisols
Figure 1 Study site locations in (a) Peru with Tam-I and Tam-U on adjacent landscapes in in the ldquoChunchordquo region along the Tambopata River and (b) Panama at Barro Colorado Island located in Lake Gatun north of the Panama Canal Imagecopy Google Earth 2015
Figure 1 Study site locations in (a) Peru with Tam-I and Tam-U on adjacent landscapes in in theldquoChunchordquo region along the Tambopata River and (b) Panama at Barro Colorado Island located inLake Gatun north of the Panama Canal Imagecopy Google Earth 2015
Remote Sens 2016 8 196 4 of 16
Table 1 Demographics and environmental characteristics for study locations For each site thespecies genera and families that co-occur at least one other site is given in parentheses BCI = BarroColorado Island (Panama) Tam-I = Tambopata (Peru) Inceptisol site Tam-U = Tambopata Ultisol siteMAP = mean annual temperature MAT = mean annual precipitation MAT and MAT data are averagedover the ranges 1972ndash1999 for BCI and 2008ndash2013 for Tambopata [4345]
BCI Tam-I Tam-U
DemographicsIndividuals 69 196 200
Species 69 (13) 125 (40) 150 (34)Genera 52 (30) 89 (48) 90 (41)
Families 27 (25) 37 (28) 33 (26)Environment
Elevation (m) 189 220 213MAP (mmyr) 2550 2600 2600
MAT (˝C) 272 24 24Primary soil types CombisolsFerralsols Inceptisols Ultisols
23 Species Data for Chemical Spectral and Phylogenetic Analyses
Biochemical trait data spectral reflectance signatures and genetic data were obtained for299 species in 154 genera and 46 families (Table 1) Data for nine traits (P Ca N LMA Chl Lig CelPhe Tan) were obtained for fully-sunlit top-of-canopy foliage (Table 2) and were quantified as part ofa pan-tropical analysis of foliar biochemical traits previously reported in Asner and Martin (2015) [47]Sampling was designed to capture the diversity of sunlit canopies throughout the sites while alsomaintaining statistical power for replication at the family genus and species levels Between 19 and32 of species overlapped between sites with greater overlap at higher taxonomic levels (45ndash58 ofgenera and 76ndash93 of families Table 1) Sample collection methodology along with analyses ofwithin-species and within-crown variation were previously reported in Asner and Martin (2011) [12]for Tambopata sites and Asner and Martin (2015) [47] for BCI The chemical assays utilized alongwith instruments and standards are described in detail in Asner and Martin (2011) [12] and detailedprotocols are available on the Carnegie Spectranomics Project website (spectranomicsciwedu) Traitdata were transformed where necessary to improve normality (Table 2)
Spectroscopic measurements were made concurrently with sample collection following themethod of Asner and Martin (2011) [12] A detailed methodology of the spectroscopic measurementprocedure for the two Peruvian sites is provided in the supplement to Asner and Martin (2011) [12]and further information is available from spectranomicsciwedu This procedure was also utilizedfor the BCI data collection Briefly six leaves were randomly selected from the outermost surface ofbranches with all signs of epiphyll growth endophytes and herbivory intact to represent the state ofthe tree at the time of collection Spectra were collected with a custom-build field spectrometer thatrecords in 2151 bands spanning the 350 to 2500 nm wavelength region (FS-3 with custom detectorsand exit slit configuration to maximize signal-to-noise performance Analytical Spectra Devices IncBoulder CO USA) an integrating sphere designed for high-resolution spectroscopic measurements(approx 9 mm dia field-of-view) and an illumination collimator [12] The spectra were calibrated fordark current and stray light referenced to a calibration block (Spectralon Labsphere Inc DurhamNH USA) in the integrating sphere Hemispherical reflectance was measured on the leaf adaxialsurface mid-way between the main vein and the leaf edge and roughly halfway from petiole to leaftip Large primary or secondary veins were avoided to the extent possible Calibrated spectra werethen resampled to a 10 nm bandwidth and trimmed to the 400ndash2500 nm range The high fidelity of theresulting spectra did not require smoothing or other filters Each of the six reflectance spectra for anindividual were averaged which were then averaged to the species level
Remote Sens 2016 8 196 5 of 16
Table 2 Trait statistics and phylogenetic signal for all sites Site-level trait means are reported ˘ standard deviation Units of measurement are reported in parenthesesCV = coefficient of variation The phylogenetic signal for each trait is reported for analyses based on DNA and Phylomatic phylogenies subset to the species present ateach site (λDNA and λPhyl) F is the F statistic reported for a one-way ANOVA for trait variation among sites Superscripts (a b c) on site-specific trait means correspondto groups found to be significantly different via Tukeyrsquos post-hoc test for each trait Site variables are defined in the caption to Table 1 Chl = Chlorophyll
TraitTam-I Tam-U
FMean CV () Range λDNA λPhyl Mean CV () Range λDNA λPhyl
Nitrogen dagger () 220 a ˘ 064 290 104ndash408 086 066 218 a ˘ 066 302 119ndash466 066 055 00Phosphorus dagger () 020 b ˘ 008 400 009ndash051 050 058 013 a ˘ 005 391 005ndash033 000 000 726
Calcium daggerdagger () 158 a ˘ 082 518 025ndash485 047 052 072 b ˘ 069 959 003ndash345 030 023 771 LMA daggerdagger (guml macute2) 101 a ˘ 29 287 47ndash191 070 045 111 b ˘ 30 270 38ndash216 014 012 120
Lignin daggerdagger () 199 b ˘ 84 420 63ndash422 079 084 236 a ˘ 93 394 53ndash508 020 039 93 Cellulose daggerdagger () 175 a ˘ 46 263 73ndash293 000 020 184 a ˘ 49 267 64ndash357 000 021 19
Phenols (mguml gacute1) 68 b ˘ 45 664 1ndash173 000 000 90 a ˘ 50 556 1ndash225 042 052 121 Tannins (mguml gacute1) 36 a ˘ 21 574 1ndash87 000 000 43 b ˘ 22 511 0ndash116 039 054 49
Chl dagger (mguml gacute1) 741 b ˘ 229 309 228ndash1511 030 010 669 c ˘ 218 325 216ndash1539 013 012 222
TraitBCI All sites
Mean CV () Range λDNA λPhyl Mean CV () Range λDNA λPhyl
Nitrogen dagger () 218 a ˘ 078 358 101ndash504 000 037 219 ˘ 067 305 101ndash504 082 065 Phosphorus dagger () 012 a ˘ 006 496 005ndash043 000 000 016 ˘ 007 476 005ndash051 022 023
Calcium daggerdagger () 140 a ˘ 077 550 030ndash372 000 047 118 ˘ 086 727 003ndash485 051 038 LMA daggerdagger (guml macute2) 93 a ˘ 27 290 30ndash155 000 000 104 ˘ 30 288 30ndash216 039 022
Lignin daggerdagger () 230 a ˘ 94 510 70ndash431 061 051 220 ˘ 91 414 53ndash508 079 070 Cellulose daggerdagger () 181 a ˘ 49 271 99ndash310 017 017 180 ˘ 48 265 64ndash357 020 054
Phenols (mguml gacute1) 92 a ˘ 56 607 5ndash256 000 000 81 ˘ 50 619 1ndash256 044 041 Tannins (mguml gacute1) 34 a ˘ 21 617 0ndash100 000 010 39 ˘ 22 556 0ndash116 049 040
Chl dagger (mguml gacute1) 771 a ˘ 277 359 381ndash1968 000 000 715 ˘ 235 329 216ndash1968 018 015
p lt 005 p lt 0001 p lt 1 ˆ 10acute5 dagger log-transformed prior to analysis daggerdagger square-root transformed prior to analysis
Remote Sens 2016 8 196 6 of 16
24 DNA Sequencing Alignment and Assembly into a Supermatrix
Genetic material (10 7-mm frozen leaf discs per individual) from samples for all individuals at bothTambopata sites were submitted to the Canadian Centre for DNA Barcoding (CCDB) at the BiodiversityInstitute of Ontario University of Guelph for sequencing Samples were sequenced at two separateloci corresponding to the DNA barcode markers rbcL and matK which together provide resolution ofbasal and more recent evolutionary relationships [16] DNA extraction PCR and sequencing wereperformed at the CCDB following standard high-throughput protocols [48] DNA barcodes for thesame two markers for taxa present within the BCI site were obtained from the Smithsonian InstitutionDepartment of Botany
We combined DNA sequences for BCI and Tambopata into single FASTA files for matK andrbcL markers respectively prior to alignment We aligned both matK and rbcL sequences using theMAFFT multiple sequence alignment software available online (v7) [49] We visually examined andcorrected the aligned sequences utilizing the Mesquite software program (v304) and excluded sitesthat represented gaps across gt99 of sequences No rbcL sites were below this threshold while 47of matK sites were omitted during this step
25 Phylogenetic Reconstruction DNA-Sequence Based Method
We constructed a phylogeny from a concatenated matrix of rbcL and matK DNA sequences fromall three sites using maximum likelihood via the RAxML software (v824) [50] on the CIPRES onlineportal [51] For the rbcL marker 278 of the 299 species had sequence data available for the matK marker210 species had data available For the combined matrix we selected only one sequence per markerper species To include the maximum number of species possible within the combined phylogenywe utilized a hierarchical approach to select sequences within species described in SupplementaryMethods The combined phylogeny included 283 out of 299 species of which 205 had data formatK + rbcL and 78 had data for a single marker only (5 for matK and 73 for rbcL) We made the finaltree ultrametric using the nonparametric rate smoothing method of Sanderson (1997) [52] via thechronos function in the ape package for R [5354]
26 Phylogeny Reconstruction Supertree Method
We constructed a phylogenetic tree for all taxa at the study locations using the computerprogram Phylomatic (v3) [38] with the most recent phylogenetic hypothesis available at the timeof analysis (R20120829 phylogenetic tree for plants derived from the Angiosperm Phylogeny Group IIIreconstruction APGIII 2009) Phylomatic matches a user-submitted list of taxa against a masterphylogeny of plant family and genus-level relationships and returns a trimmed phylogeny for thetaxa desired We used the BLADJ algorithm in Phylocom [55] with the ages file from Gastauer andMeira-Neto (2013) [56] to adjust the branch lengths of the phylogeny using known ages of plantfossils [57] Although providing little to no resolution below (or frequently at) the family levelthe branching pattern of the resulting Phylomatic phylogeny was largely consistent with that of theDNA-based phylogeny at higher taxonomic levels (Supplementary Figure S1)
27 Quantifying Phylogenetic Signal of Spectra and Traits
We estimated phylogenetic signal for foliar reflectance spectra and traits across all sites andspecies utilizing the Phylomatic and DNA-based phylogenies described in Section 25 and 26 andalso for each study location individually by subsetting both the DNA phylogeny and Phylomaticphylogeny to the taxa present at each site (Supplementary Figures S2ndashS7) We estimated phylogeneticsignal for species mean reflectance values at each wavelength and species mean trait values usingthe lambda (λ) statistic introduced by Pagel [28] λ is a scaling parameter that is used to evaluate theextent to which phylogenetic relatedness determines the covariance matrix among species for a giventrait (or spectral wavelength in this study) [58] Estimates of λ were compared to two alternative
Remote Sens 2016 8 196 7 of 16
evolutionary hypotheses that of a star phylogeny in which all tips are equidistant (ie no phylogeneticsignal λ = 0) and that of a trait evolving along the given phylogeny under a model of Brownian motion(λ = 1) We quantified λ independently for each site with separate estimates for both phylogeniesSignificance is computed for each hypothesis via a χ2 test of the likelihood that the observed pattern oftrait expression is generated from a phylogenetic tree with λ equal to zero or one [59]
28 Multi-Method Ensemble Selection of Biochemically-Related Spectral Bands
To evaluate the extent to which spectral features were correlated with biochemical traitswe utilized the multi-method ensemble approach of Feilhauer et al (2015) [37] The ensembleconsists of three regression models used in parallel to quantify foliar traits from leaf reflectancespectra Partial Least Squares (PLS) Random Forest (RF) and Support Vector Machine (SVM) whichprovide separate estimates of the relationship between a biochemical trait and the correspondingspectral signal measured at the leaf level Models were constructed utilizing biochemical trait data forall species included in the study trait data were standardized to have a mean of zero and unit varianceFrom each model we obtained a vector of coefficients indicating the spectral bands most important forthe prediction of a given foliar trait These coefficients were weighted based on model fit and mergedto form an ensemble assessment of the bands most influential to the prediction of trait variation Theensemble utilized data from all three sites to capture the full range of trait and spectral variation
29 Quantification of Trait Correlations and Determination of Phylogenetic Independent Contrasts
Trait correlations may reduce the independence of individual trait-spectral models or estimates ofthe phylogenetic signal of traits To determine the interdependency of traits we calculated pairwisecorrelation among species mean trait values as well as among phylogenetically-corrected trait valuesknown as phylogenetic independent contrasts (PICs) PICs provide an adjusted estimate of traitvariation among species which accounts for the relatedness of taxa and are useful for determiningwhether patterns of trait co-variation are found broadly across a phylogeny or show phylogeneticdependency (eg restricted to the taxa within a given clade) [60] PICs were calculated for each traitusing standardized trait data based on the evolutionary distances given by the DNA-based phylogenyWe then calculated pairwise correlations of PICs which were forced through the origin followingGarland et al (1992) [61]
3 Results
31 Spectral Variation across Soil Types
Leaf reflectance spectra indicated similar mean values across sites and high variance amongspecies at all three sites (Figure 2) The highest reflectance values and greatest range were observedin the near-infrared (NIR 750ndash1300 nm) but the highest coefficients of variation were found in theshortwave-infrared (SWIR 1500ndash2500 nm) followed by the visible spectra region (400ndash750 nm) Leafreflectance spectra for Tam-I and Tam-U were generally similar and lower than BCI spectra in thevisible range and generally higher than BCI in the SWIR with the exception of the absorption featureat ~1800 nm present at both Tambopata sites but absent at BCI Tam-I and BCI were similar and higherthan Tam-U in the NIR Across the three sites the change in spectral reflectance from one wavelengthto the next (eg spectral first derivative) showed low inter-site variation
Remote Sens 2016 8 196 8 of 16Remote Sens 2016 8 196 8 of 16
Figure 2 (a) Mean reflectance spectra for each site (colored lines) and range of all reflectance spectra for all sites included in the study (grey area) (b) Spectral coefficients of variation for all sites (c) Mean differences in spectral reflectance values between sites with mean BCI reflectance as a baseline for comparison (d) Minimum and maximum values of the first derivative of spectral reflectance for species at all sites BCI = Barro Colorado Island (Panama) Tam-I = Tambopata (Peru) Inceptisol site Tam-U = Tambopata Ultisol site
32 Patterns of Trait Variation and Co-Variation
The majority of traits varied linearly with soil fertility (Table 2) Chlorophyll was significantly different between all three sites and decreased linearly from the highest fertility site (BCI) to the lowest fertility site (Tam-U) LMA and tannins were highest at Tam-U and both showed no significant differences between BCI and Tam-I Phosphorus was highest at the floodplain site in Peru (Tam-I) and Ca was lowest at the terra firme site (Tam-U) with no significant difference between the two high-fertility sites Phenols and lignin were lowest at Tam-I and had no significant difference between Tam-U and BCI No significant between-site differences were found for nitrogen or cellulose Coefficients of variation were highest for BCI for nearly all traits (excepting Ca and phenols)
Both species mean trait values and phylogenetic independent contrasts (PICs) revealed substantial trait interdependency (Supplementary Table S1) Trait correlations were common among groups of functionally-related traits such as among the growth-related traits N LMA and chlorophyll which were significantly related among both traits and PICs Traits co-varied less across functional groups with moderately weak (r lt ~ 04) to no correlations observed among growth defense and structural compounds Species mean trait values for two rock-derived traits P and Ca were significantly correlated with nearly all other traits however several of these correlations were weaker among PICs indicating a phylogenetic basis for some patterns of P and Ca covariation (such as both P and Ca with chlorophyll P with lignin cellulose and tannins and Ca with LMA and phenols) The strongest correlation observed between species mean values for phenols and tannins (r = 090) is largely a consequence of the derivation of tannins as a fraction of total phenols
Figure 2 (a) Mean reflectance spectra for each site (colored lines) and range of all reflectance spectrafor all sites included in the study (grey area) (b) Spectral coefficients of variation for all sites (c) Meandifferences in spectral reflectance values between sites with mean BCI reflectance as a baseline forcomparison (d) Minimum and maximum values of the first derivative of spectral reflectance forspecies at all sites BCI = Barro Colorado Island (Panama) Tam-I = Tambopata (Peru) Inceptisol siteTam-U = Tambopata Ultisol site
32 Patterns of Trait Variation and Co-Variation
The majority of traits varied linearly with soil fertility (Table 2) Chlorophyll was significantlydifferent between all three sites and decreased linearly from the highest fertility site (BCI) to thelowest fertility site (Tam-U) LMA and tannins were highest at Tam-U and both showed no significantdifferences between BCI and Tam-I Phosphorus was highest at the floodplain site in Peru (Tam-I) andCa was lowest at the terra firme site (Tam-U) with no significant difference between the two high-fertilitysites Phenols and lignin were lowest at Tam-I and had no significant difference between Tam-Uand BCI No significant between-site differences were found for nitrogen or cellulose Coefficients ofvariation were highest for BCI for nearly all traits (excepting Ca and phenols)
Both species mean trait values and phylogenetic independent contrasts (PICs) revealed substantialtrait interdependency (Supplementary Table S1) Trait correlations were common among groups offunctionally-related traits such as among the growth-related traits N LMA and chlorophyll whichwere significantly related among both traits and PICs Traits co-varied less across functional groupswith moderately weak (r lt ~04) to no correlations observed among growth defense and structuralcompounds Species mean trait values for two rock-derived traits P and Ca were significantlycorrelated with nearly all other traits however several of these correlations were weaker among PICsindicating a phylogenetic basis for some patterns of P and Ca covariation (such as both P and Ca
Remote Sens 2016 8 196 9 of 16
with chlorophyll P with lignin cellulose and tannins and Ca with LMA and phenols) The strongestcorrelation observed between species mean values for phenols and tannins (r = 090) is largely aconsequence of the derivation of tannins as a fraction of total phenols
33 Phylogenetic Structure of Spectra
Spectral regions with λ values significantly greater than zero were observed at all sites and acrossall phylogenies apart from the DNA-based phylogeny constructed for BCI (Figure 3 SupplementaryFigures S8 and S9) Both the DNA-based and Phylomatic phylogenies constructed for all speciesincluded in the study showed significant phylogenetic signal within the SWIR and the Phylomaticphylogeny indicated significant phylogenetic signal within the NIR additionally A substantial drop inphylogenetic signal is present at ~1900 nm for analyses using both phylogenies which is concurrentwith a well-established water feature present at this spectral location [262] Among the site-specificphylogenies phylogenetic signal was highest across the SWIR with λ values significantly greaterthan zero from ~1400 to 2450 nm at both Tam-U (DNA-based and Phylomatic phylogenies) and BCI(Phylomatic phylogeny only) At the two high-fertility sites Tam-I and BCI narrow regions withinthe visible and near-infrared ranges (VNIR) exhibited λ values significantly greater than zero At BCIλ values exhibited two discrete peaks within the visible range from 440 to 490 nm and from 690 to720 nm although only the first peak demonstrated statistical significance (Figure 3) At Tam-Istatistically significant peaks were found from 550 to 610 nm and from 700 to 720 nm Phylogeneticsignal was consistently low or absent throughout the near-infrared (NIR) region across all three sites
Remote Sens 2016 8 196 9 of 16
33 Phylogenetic Structure of Spectra
Spectral regions with λ values significantly greater than zero were observed at all sites and across all phylogenies apart from the DNA-based phylogeny constructed for BCI (Figure 3 Supplementary Figures S8 and S9) Both the DNA-based and Phylomatic phylogenies constructed for all species included in the study showed significant phylogenetic signal within the SWIR and the Phylomatic phylogeny indicated significant phylogenetic signal within the NIR additionally A substantial drop in phylogenetic signal is present at ~1900 nm for analyses using both phylogenies which is concurrent with a well-established water feature present at this spectral location [262] Among the site-specific phylogenies phylogenetic signal was highest across the SWIR with λ values significantly greater than zero from ~1400 to 2450 nm at both Tam-U (DNA-based and Phylomatic phylogenies) and BCI (Phylomatic phylogeny only) At the two high-fertility sites Tam-I and BCI narrow regions within the visible and near-infrared ranges (VNIR) exhibited λ values significantly greater than zero At BCI λ values exhibited two discrete peaks within the visible range from 440 to 490 nm and from 690 to 720 nm although only the first peak demonstrated statistical significance (Figure 3) At Tam-I statistically significant peaks were found from 550 to 610 nm and from 700 to 720 nm Phylogenetic signal was consistently low or absent throughout the near-infrared (NIR) region across all three sites
Figure 3 Phylogenetic signal as Pagelrsquos lambda of species reflectance coefficients at each site for four representative functional traits overlaid on the multi-model ensemble regression coefficients (grey bars) as measures of band importance to each trait model Site-specific lambda spectra are indicated by color BCI=purple Tam-I = cyan Tam-U = green and phylogeny used to generate lambda is indicated by line style DNA = solid lines Phylomatic = dashed lines Red bars (top and bottom) indicate bands selected by the ensemble as most important to the relationship between reflectance and chemical concentrationtrait variation LMA = leaf dry mass per unit area Ca = calcium Lig = lignin Phe = total polyphenols
Figure 3 Phylogenetic signal as Pagelrsquos lambda of species reflectance coefficients at each site forfour representative functional traits overlaid on the multi-model ensemble regression coefficients(grey bars) as measures of band importance to each trait model Site-specific lambda spectra areindicated by color BCI=purple Tam-I = cyan Tam-U = green and phylogeny used to generate lambdais indicated by line style DNA = solid lines Phylomatic = dashed lines Red bars (top and bottom)indicate bands selected by the ensemble as most important to the relationship between reflectance andchemical concentrationtrait variation LMA = leaf dry mass per unit area Ca = calcium Lig = ligninPhe = total polyphenols
Remote Sens 2016 8 196 10 of 16
34 Phylogenetic Structure of Traits
Patterns of phylogenetic signal for traits varied by site and with the methods of phylogeneticconstruction (eg Phylomatic or DNA-based phylogeny Table 2) For most traits phylogeneticsignal was strongest when all sites were included in the phylogenetic analysis For all phylogeneticanalyses including both the full phylogenies and site-specific phylogenies λ values were consistentlysignificantly less than one the value predicted for traits evolving according to a Brownian motionmodel of evolution All traits exhibited λ values significantly greater than zero for the full Phylomaticphylogeny and all traits except for P and phenols exhibited λ values significantly greater than zerofor the full DNA-based phylogeny Among the site-specific phylogenies Ca and lignin were the onlytraits to exhibit λ values significantly greater than zero across all sites At Tam-I we consistently foundevidence of phylogenetic signal for several traits across both community phylogenies including N PCa LMA and lignin At Tam-U both phylogenies indicated phylogenetic signal for N and Ca and theDNA-based phylogeny additionally indicated phylogenetic signal for lignin phenols and tannins
35 Ensemble Selection of Bands for Biochemical Traits
Multi-method ensemble analyses indicated a generally robust link between foliar spectroscopyand leaf traits Mean ensemble fits (combined R2) ranged from a low of 029 for lignin to a high of071 for LMA (Table 3) Among the individual models PLS and SVM regression models consistentlyoutperformed the RF regression model Weighted spectral coefficients indicated frequent agreementbetween the PLS and SVM models in the importance of individual bands for the prediction ofbiochemical traits which contributed to the selection of these bands by the ensemble even whenthe corresponding RF coefficient was comparatively weak (Supplementary Figures S10) Ensemblemodels selected 24ndash40 bands of importance per trait with the majority of selected bands in the SWIR(Figure 3 Table 3) The two defense traits phenols and tannins were expressed exclusively in theSWIR while the growth related traits (chlorophyll N LMA) rock-derived nutrients (Ca P) and ligninwere additionally related to narrow spectral features within the visible range Only the cellulose andchlorophyll models included bands selected within the NIR
Table 3 Ensemble model goodness-of-fit statistics for all traits including fits for the three regressionmodels which comprise the ensemble the ensemble average and the number of bands selected foreach trait model PLS = Partial Least Squares RF = Random Forest SVM = Support Vector Machine
PLS R2 RF R2 SVM R2 Ensemble R2 Bands (n)
Nitrogen 070 018 066 051 31Phosphorus 040 020 038 033 34
Calcium 048 016 048 038 33LMA 076 059 077 071 40
Lignin 039 007 041 029 36Cellulose 052 008 047 036 39Phenols 069 033 073 058 24Tannins 059 025 059 049 30
Chlorophyll 072 056 073 067 31
4 Discussion
Within three Neotropical forest communities we found evidence for phylogenetic structurein foliar reflectance spectra primarily within the visible (400ndash750 nm) and shortwave infrared(1500ndash2500 nm) spectral regions both of which are known to be sensitive to foliar biochemistry(reviewed in Ollinger 2011 [62]) Moreover spectral regions exhibiting significant phylogenetic signalbroadly overlapped with the spectral regions selected by the multi-model ensemble as those mostimportant to the quantitative prediction of the nine foliar traits measured in this study (Figure 2)The general co-incidence of phylogenetic signal and biochemical correlations within the visible and
Remote Sens 2016 8 196 11 of 16
short spectral regions affirms the importance of these broad regions to quantifying foliar traits anddetecting taxonomic differences and further suggests a biochemical basis for species identification viaSpectranomics [25] However both the specific spectral regions that displayed phylogenetic structurevaried considerably among sites which may indicate differences in the evolutionary and ecologicalprocesses acting within the tropical tree communities at each site
Within the visible portion of the spectra we observed contrasting patterns of phylogeneticorganization between high and low fertility sites The phylogenetic signal for species reflectancewithin discrete regions of the visible spectrum at both high-fertility sites Tam-I and BCI may indicatea phylogenetic basis for the absorption of light by chlorophyll and other pigments which are thepredominant biochemical constituents active within this region [361] While we found evidence for astrong chlorophyll band selection in this region we did not observe phylogenetic signal for chlorophyllitself However non-pigment biochemical constituents are known to have an indirect influence onthe efficacy of the photosynthetic apparatus as elements such as N and P are directly and indirectlyinvolved in the biochemistry of photosynthesis [306364]
Soil fertility may play a role in the among-site differences in phylogenetic signal of this spectralregion Nutrient limitation is known to facilitate habitat associations in low-resource tropical treecommunities favoring species that allocate limited resources towards longer-lived better-defendedfoliage [1165] Across a diverse phylogeny this process may be expected to yield the convergence ofdistantly related species on similar trait values which would reduce phylogenetic signal compared toa Brownian expectation [23] However within a relatively high-fertility site local-scale differences inresource availability (including light availability) may contribute to the maintenance of a wide range oflife-history strategies and therefore permit greater conservation of differences among species [2066]Although other explanations are possible it is not implausible to speculate that resource-basedconstraints on photosynthesis may explain differences in patterns of phylogenetic signal within thevisible range between the high and low-fertility sites in this study
Phylogenetic structure was observed across broad regions within the SWIR when comparing allspecies included in the study and was observed to some degree among species present at each sitealbeit λ was not significant at all sites or within all community phylogenies (Figure 3) The majorityof bands selected by the ensemble for importance to foliar biochemical traits were also locatedwithin the SWIR However a comparison of patterns of phylogenetic organization between thetwo Tambopata sites reveals that while more phylogenetic signal is found for foliar reflectancespectra at Tam-U a larger number of foliar traits show evidence of phylogenetic signal at Tam-IThe relationship between foliar biochemistry and reflectance spectra is complex particularly within theSWIR where numerous biochemical constituents may absorb at overlapping wavelengths [67] Directlinks between leaf biochemistry and spectral reflectance within the SWIR are driven by changes in thevibrational or rotational properties of molecules [6267] The relationship between these absorptionfeatures and elemental leaf traits such as N P or more broadly-defined functional traits such asLMA is indirectmdashcontingent upon the allocation of elemental resources to specific biochemicalcompounds (such as N to Rubisco) or biochemical compounds to foliar functional traits (such as ligninto LMA) [3161] Patterns of phylogenetic structure within the SWIR may relate more to these specificbiochemical differences among species than to laboratory estimates of elemental concentrations orbroader functional traits
A low coefficient of variation (CV) within the near-infrared (750ndash1500 nm) spectral region acrossall sites likely contributes to the apparent lack of site-specific phylogenetic signal or importance toprediction of foliar biochemistry within this spectral range (Figures 2b and 3) Given the high diversityof tropical tree species found at each site low dispersion of reflectance values is likely to result indistantly-related species with spectral values more similar than would be predicted by Brownian modelof evolution However a high spectral CV does not necessarily predict a high value for lambda as thisvariation may or may not correspond to patterns of phylogenetic relatedness Similarly low spectral
Remote Sens 2016 8 196 12 of 16
dispersion among species reduces the utility of this region for the prediction of foliar biochemistry(Supplementary Figures S10)
The pattern of phylogenetic organization of traits and spectra at BCI was more contingent uponthe methods of phylogenetic construction than for either site at Tambopata While λ values generatedusing the Phylocom phylogeny revealed significant phylogenetic structure across a substantial portionof the reflectance spectrum and for a few foliar traits (Ca lignin) values of λ generated using theDNA-based phylogeny revealed no significant phylogenetic signal for spectra or traits This contrast islikely driven by differences in phylogenetic resolution between the two phylogenies (SupplementaryFigures 1ndash7) The megatree from which the Phylomatic phylogeny is derived is resolved only to thegenus level and assumes a ldquocomb-shapedrdquo and unresolved phylogeny below this level (ie all speciesequally related) [38] The Phylomatic phylogeny emphasizes evolutionary signal at the basal branches ofthe phylogeny whereas the DNA-based phylogeny also includes resolution at the tips of the phylogenyThus the degree of trait divergence among congeneric species in our DNA-based phylogeny outweighsthe estimate for phylogenetic signal restricted to the basal nodes in the Phylomatic phylogeny Whilethis interpretation holds true across all sites the effects are most pronounced within the BCI communityphylogenies where a relatively higher proportional representation of recently evolved clades such asInga and Ficus increases the influence of these evolutionary relationships at the tips of the phylogeneticbranches on the overall pattern of phylogenetic signal
Previous work by Asner and Martin (2011) [12] established the substantial contribution oftaxonomic organization to between-species variation of several foliar biochemical traits many ofwhich contribute to the spectral reflectance signatures of canopy tree species In the current studywe demonstrate that phylogenetic organization is directly expressed in patterns of spectral variationamong species The patterns of phylogenetic signal observed in the reflectance spectra of three distincttropical canopy tree communities provide a direct confirmation of the phylogenetic basis of foliarreflectance inferred from the relationships of foliar spectra and traits and foliar traits and taxonomy [68]Quantifying this component using λ or other phylogenetic metrics [1469] may have many applicationsin remote sensing from improving species identification algorithms to providing insights into theprocesses driving community assembly Further incorporating phylogenetic analyses into spectralregression models such as PLS RF and SVM may facilitate more robust models by accounting for thestatistical non-independence of species [60] The increasing availability of well-resolved phylogeniesand methods for phylogenetic analysis create an opportunity for all those interested in the evolutionaryunderpinnings of ecological remote sensing
5 Conclusions
Phylogenetic relationships are known to explain a considerable amount of trait variation amongspecies within tropical forest communities and foliar trait variation is known to underlie differencesin foliar reflectance spectra In this study we established that foliar reflectance spectra themselvesare influenced by the phylogenetic relatedness of species and that patterns of trait variation amongcanopy tree communities vary in ways that are suggestive of both phylogenetic and abiotic constraintson ecological strategies The increasing ease of obtaining and utilizing well-resolved phylogeniesnow makes incorporating evolutionary approaches into ecological remote sensing a feasible meansof accounting for the statistical non-independence of species for addressing broad questions ofcommunity assembly and for many other applications in which a robust understanding of theunderlying phylogenetic structure of species is useful
Supplementary Materials The following are available online at wwwmdpicom2072-429283196 Table S1Pairwise Pearsonrsquos correlation coefficients for speciesrsquo standardized mean foliar trait values (lower diagonal) andphylogenetic independent contrasts (PICs) of trait values utilizing the DNA-based phylogeny (upper diagonal)Levels of significance are indicated with asterisks LMA = leaf mass per area Chl = chlorophyll Figure S1Comparison of the branching patterns of the DNA-based phylogeny (left-hand tree) and Phylomatic phylogeny(right hand tree) to the family level for all taxa included in the study ˆ families included only in the DNA-basedphylogeny families included only in the Phylomatic phylogeny Figure S2 DNA phylogeny for BCI representing
Remote Sens 2016 8 196 13 of 16
62 species with available genetic sequences Figure S3 Phylomatic phylogeny for BCI representing 69 speciesincluded in the APG megatree Figure S4 DNA phylogeny for Tam-I representing 121 species with availablegenetic sequences Figure S5 Phylocom phylogeny for Tam-I representing 115 species included in the APGmegatree Figure S6 DNA phylogeny for Tam-U representing 141 species with available genetic sequencesFigure S7 Phylomatic phylogeny for Tam-U representing 144 species included in the APG megatree Figure S8Phylogenetic signal as Pagelrsquos lambda of species reflectance coefficients for all species at all sites included in thestudy utilizing (a) the DNA-based phylogeny and (b) the Phylomatic phylogeny Figure S9 Phylogenetic signal asPagelrsquos lambda of species reflectance coefficients at each site for five functional traits overlaid on the multi-modelensemble regression coefficients (grey bars) as measures of band importance to each trait model Site-specificlambda spectra are indicated by color BCI = purple Tam-I = cyan Tam-U = green and phylogeny used togenerate lambda is indicated by line style DNA = solid lines Phylocom = dashed lines Red bars (top and bottom)indicate bands selected by the ensemble as most important to the relationship between reflectance and chemicalconcentrationtrait variation Chl = chlorophyll N = nitrogen P = phosphorus Cel = cellulose Tan = tanninsFigure S10 Spectral coefficients for three regression models that comprise the multi-model ensemble weighted byindividual model fit statistic (R2) For each wavelength the ensemble coefficient is equal to the sum of the threeindividual model coefficients Bands selected as most influential for each biochemical trait by the ensemble areindicated by grey bars LMA = leaf mass per area Chl = chlorophyll N = nitrogen Ca = calcium P = phosphorusCel = cellulose Phe = phenols Tan = tannins Lig = lignin
Acknowledgments We thank the Spectranomics team for field laboratory and remote sensing assistanceWe thank Caroline Puente and the Smithsonian Tropical Research Institute for assistance with the moleculardata for species collected at BCI Panama and we thank the Canadian Centre for DNA Barcoding (CCDB) at theBiodiversity Institute of Ontario University of Guelph for assistance with the processing of genetic sequencesfrom sites in Tambopata Peru This study and the Spectranomics Project are supported by the John D andCatherine T MacArthur Foundation
Author Contributions KMM GPA and CBF conceived and designed this study GPA and REMdeveloped and implemented the sampling design spectral analyses and chemical analyses KGD WJKand KMM collaborated on the phylogenetic analyses KMM wrote the manuscript all authors providededitorial advice
Conflicts of Interest The authors declare no conflict of interest
References
1 Asner GP Organismic remote sensing for tropical forest ecology and conservation Ann Mo Bot Gard2015 100 127ndash140 [CrossRef]
2 Kokaly RF Asner GP Ollinger SV Martin ME Wessman CA Characterizing canopy biochemistryfrom imaging spectroscopy and its application to ecosystem studies Remote Sens Environ 2009 113 S78ndashS91[CrossRef]
3 Ustin SL Gitelson AA Jacquemoud S Schaepman M Asner GP Gamon JA Zarco-Tejada PRetrieval of foliar information about plant pigment systems from high resolution spectroscopyRemote Sens Environ 2009 113 S67ndashS77 [CrossRef]
4 Homolovaacute L Malenovskyacute Z Clevers JGPW Garciacutea-Santos G Schaepman ME Review of optical-basedremote sensing for plant trait mapping Ecol Complex 2013 15 1ndash16 [CrossRef]
5 White JC Coops NC Hilker T Wulder MA Carroll AL Detecting mountain pine beetle red attackdamage with EO-1 Hyperion moisture indices Int J Remote Sens 2007 28 2111ndash2121 [CrossRef]
6 Dahlin KM Asner GP Field CB Environmental and community controls on plant canopy chemistry in aMediterranean-type ecosystem Proc Natl Acad Sci USA 2013 110 6895ndash6900 [CrossRef] [PubMed]
7 Fassnacht FE Latifi H Ghosh A Joshi PK Koch B Assessing the potential of hyperspectral imagery tomap bark beetle-induced tree mortality Remote Sens Environ 2014 140 533ndash548 [CrossRef]
8 Clark M Roberts D Clark D Hyperspectral discrimination of tropical rain forest tree species at leaf tocrown scales Remote Sens Environ 2005 96 375ndash398 [CrossRef]
9 Kalacska M Bohlman S Sanchez-Azofeifa GA Castro-Esau K Caelli T Hyperspectral discriminationof tropical dry forest lianas and trees Comparative data reduction approaches at the leaf and canopy levelsRemote Sens Environ 2007 109 406ndash415 [CrossRef]
10 Feret J-B Asner GP Mapping tropical forest canopy diversity using high-fidelity imaging spectroscopyEcol Appl 2014 24 1289ndash1296 [CrossRef]
11 Fyllas NM Patintildeo S Baker TR Bielefeld Nardoto G Martinelli LA Quesada CA Paiva RSchwarz M Horna V Mercado LM et al Basin-wide variations in foliar properties of Amazonian forestPhylogeny soils and climate Biogeosciences 2009 6 2677ndash2708 [CrossRef]
Remote Sens 2016 8 196 14 of 16
12 Asner GP Martin RE Canopy phylogenetic chemical and spectral assembly in a lowland Amazonianforest New Phytol 2011 189 999ndash1012 [CrossRef] [PubMed]
13 Freckleton RP Harvey PH Pagel M Phylogenetic analysis and comparative data A test and review ofevidence Am Nat 2002 160 712ndash726 [CrossRef] [PubMed]
14 Blomberg SP Garland T Ives AR Testing for phylogenetic signal in comparative data Behavioral traitsare more labile Evolution 2003 57 717ndash745 [CrossRef] [PubMed]
15 Webb CO Ackerly DD McPeek MA Donoghue MJ Phylogenies and community ecologyAnnu Rev Ecol Syst 2002 33 475ndash505 [CrossRef]
16 Kress WJ Erickson DL Jones FA Swenson NG Perez R Sanjur O Bermingham E Plant DNAbarcodes and a community phylogeny of a tropical forest dynamics plot in Panama Proc Natl Acad Sci USA2009 106 18621ndash18626 [CrossRef] [PubMed]
17 Hollingsworth PM Graham SW Little DP Choosing and using a plant DNA barcode PLoS ONE 2011 6[CrossRef] [PubMed]
18 Kembel SW Hubbell SP The phylogenetic structure of a neotropical forest tree community Ecology 200687 S86ndashS99 [CrossRef]
19 Kraft NJB Cornwell WK Webb CO Ackerly DD Trait evolution community assembly and thephylogenetic structure of ecological communities Am Nat 2007 170 271ndash283 [CrossRef] [PubMed]
20 Wright SJ Kitajima K Kraft NJB Reich PB Wright IJ Bunker DE Condit R Dalling JWDavies SJ Diacuteaz S et al Functional traits and the growthndashmortality trade-off in tropical trees Ecology 201091 3664ndash3674 [CrossRef] [PubMed]
21 Baraloto C Hardy OJ Paine CET Dexter KG Cruaud C Dunning LT Gonzalez M-A Molino J-FSabatier D Savolainen V et al Using functional traits and phylogenetic trees to examine the assembly oftropical tree communities J Ecol 2012 100 690ndash701 [CrossRef]
22 Kress WJ Garciacutea-Robledo C Uriarte M Erickson DL DNA barcodes for ecology evolution andconservation Trends Ecol Evol 2014 30 25ndash35 [CrossRef] [PubMed]
23 Kraft NJB Ackerly DD Functional trait and phylogenetic tests of community assembly across spatialscales in an Amazonian forest Ecol Monogr 2010 80 401ndash422 [CrossRef]
24 Townsend AR Cleveland CC Asner GP Bustamante MMC Controls over foliar NP ratios in tropicalrain forests Ecology 2007 88 107ndash118 [CrossRef]
25 Asner GP Martin RE Airborne spectranomics Mapping canopy chemical and taxonomic diversity intropical forests Front Ecol Environ 2009 7 269ndash276 [CrossRef]
26 Durgante FM Higuchi N Almeida A Vicentini A Species spectral signature Discriminating closelyrelated plant species in the Amazon with near-infrared leaf-spectroscopy For Ecol Manag 2013 291240ndash248 [CrossRef]
27 Lang C Costa FRC Camargo JLC Durgante FM Vicentini A Near infrared spectroscopy facilitatesrapid identification of both young and mature Amazonian tree species PLoS ONE 2015 10 [CrossRef][PubMed]
28 Pagel M Inferring the historical patterns of biological evolution Nature 1999 401 877ndash884 [CrossRef][PubMed]
29 Crisp MD Cook LG Phylogenetic niche conservatism What are the underlying evolutionary andecological causes New Phytol 2012 196 681ndash694 [CrossRef] [PubMed]
30 Field C Mooney HA Photosynthesis-nitrogen relationship in wild plants In Proceedings of the SixthMaria Moors Cabot Symposium on the Economy of Plant Form and Function 29 August 1986 Givnish TJEd Cambridge University Press Cambridge UK pp 25ndash56
31 Westoby M A leaf-height-seed (LHS) plant ecology strategy scheme Plant Soil 1998 199 213ndash227 [CrossRef]32 Poorter H Niinemets Uuml Poorter L Wright IJ Villar R Causes and consequences of variation in leaf
mass per area (LMA) A meta-analysis New Phytol 2009 182 565ndash588 [CrossRef] [PubMed]33 Vitousek PM Sanford RL Nutrient cycling in moist tropical forest Annu Rev Ecol Syst 1986 17 137ndash167
[CrossRef]34 Melillo JM Aber JD Muratore JF Nitrogen and lignin control of hardwood leaf litter decomposition
dynamics Ecology 1982 63 621ndash626 [CrossRef]35 Feeny P Plant apparency and chemical defense Recent Adv Phytochem 1976 10 1ndash40
Remote Sens 2016 8 196 15 of 16
36 Coley PD Costs and benefits of defense by tannins in a neotropical tree Oecologia 1986 70 238ndash241[CrossRef]
37 Feilhauer H Asner GP Martin RE Multi-method ensemble selection of spectral bands related to leafbiochemistry Remote Sens Environ 2015 164 57ndash65 [CrossRef]
38 Webb CO Donoghue MJ Phylomatic Tree assembly for applied phylogenetics Mol Ecol Notes 2005 5181ndash183 [CrossRef]
39 Woodring WP Geology of Barro Colorado Island Canal Zone Smithsonian Institution Washington DC USA1958 Volume 4304
40 Baillie I Elsenbeer H Barthold F Grimm R Stallard RF Semi-Detailed Soil Survey of Barro Colorado IslandSmithsonian Tropical Research Institute Panama City Panama 2007
41 Vitousek PM Litterfall nutrient cycling and nutrient limitation in tropical forests Ecology 1984 65 285ndash298[CrossRef]
42 Messmer T Elsenbeer H Wilcke W High exchangeable calcium concentrations in soils on Barro ColoradoIsland Panama Geoderma 2014 217ndash218 212ndash224 [CrossRef]
43 Leigh EG Tropical Forest Ecology A View from Barro Colorado Island Oxford University Press OxfordUK 1999
44 Yavitt JB Nutrient dynamics of soil derived from different parent material on Barro Colorado IslandPanama Biotropica 2000 32 198ndash207 [CrossRef]
45 Asner GP Anderson CB Martin RE Tupayachi R Knapp DE Sinca F Landscape biogeochemistryreflected in shifting distributions of chemical traits in the Amazon forest canopy Nat Geosci 2015 8 567ndash573[CrossRef]
46 Quesada CA Lloyd J Schwarz M Baker TR Phillips OL Patintildeo S Czimczik C Hodnett MGHerrera R Arneth A et al Regional and large-scale patterns in Amazon forest structure and functionare mediated by variations in soil physical and chemical properties Biogeosci Discuss 2009 6 3993ndash4057[CrossRef]
47 Asner GP Martin RE Convergent elevation trends in canopy chemical traits of tropical forestsGlob Change Biol 2015 [CrossRef] [PubMed]
48 Martin CC Environmental Genomics Methods in Molecular Biology Humana Press Totowa NJ USA 2008Volume 410
49 Katoh K MAFFT A novel method for rapid multiple sequence alignment based on fast Fourier transformNucleic Acids Res 2002 30 3059ndash3066 [CrossRef] [PubMed]
50 Stamatakis A Hoover P Rougemont J A rapid bootstrap algorithm for the RAxML web servers Syst Biol2008 57 758ndash771 [CrossRef] [PubMed]
51 Miller MA Pfeiffer W Schwartz T Creating the CIPRES Science Gateway for inference of largephylogenetic trees In Proceedings of the 2010 Gateway Computing Environments Workshop (GCE)New Orleans LA USA 14 November 2010 pp 1ndash8
52 Sanderson MJ A nonparametric approach to estimating divergence times in the absence of rate constancyMol Biol Evol 1997 14 1218ndash1231 [CrossRef]
53 Paradis E Claude J Strimmer K APE Analyses of phylogenetics and evolution in R languageBioinformatics 2004 20 289ndash290 [CrossRef] [PubMed]
54 R Development Core Team R Data ImportExport Version 2100 200955 Webb CO Ackerly DD Kembel SW Phylocom Software for the analysis of phylogenetic community
structure and trait evolution Bioinformatics 2008 24 2098ndash2100 [CrossRef] [PubMed]56 Gastauer M Meira-Neto JAA Avoiding inaccuracies in tree calibration and phylogenetic community
analysis using Phylocom 42 Ecol Inform 2013 15 85ndash90 [CrossRef]57 Wikstroumlm N Savolainen V Chase MW Evolution of the angiosperms Calibrating the family tree
Proc Biol Sci 2001 268 2211ndash2220 [CrossRef] [PubMed]58 Muumlnkemuumlller T Lavergne S Bzeznik B Dray S Jombart T Schiffers K Thuiller W How to measure
and test phylogenetic signal Methods Ecol Evol 2012 3 743ndash756 [CrossRef]59 Revell LJ Phytools An R package for phylogenetic comparative biology (and other things)
Methods Ecol Evol 2012 3 217ndash223 [CrossRef]60 Felsenstein J Confidence limits on phylogenies An approach using the bootstrap Evolution 1985 39
783ndash791 [CrossRef]
Remote Sens 2016 8 196 16 of 16
61 Garland T Harvey PH Ives AR Procedures for the analysis of comparative data using phylogeneticallyindependent contrasts Syst Biol 1992 41 18ndash32 [CrossRef]
62 Ollinger S V Sources of variability in canopy reflectance and the convergent properties of plants New Phytol2011 189 375ndash394 [CrossRef] [PubMed]
63 Mutanga O Skidmore AK van Wieren S Discriminating tropical grass (Cenchrus ciliaris) canopiesgrown under different nitrogen treatments using spectroradiometry ISPRS J Photogramm Remote Sens 200357 263ndash272 [CrossRef]
64 Reich PB Oleksyn J Wright IJ Leaf phosphorus influences the photosynthesis-nitrogen relationA cross-biome analysis of 314 species Oecologia 2009 160 207ndash212 [CrossRef] [PubMed]
65 Fine PVA Miller ZJ Mesones I Irazuzta S Appel HM Stevens MHH Saumlaumlksjaumlrvi I Schultz JCColey PD The growth-defense trade-off and habitat specialization by plants in Amazonian forests Ecology2006 87 S150ndashS162 [CrossRef]
66 Reich PB Wright IJ Cavender-Bares J Craine JM Olesksyn J Westoby M Walters MB Theevolution of plant functional variation Traits spectra and strategies Int J Plant Sci 2003 164 S143ndashS164[CrossRef]
67 Curran PJ Remote sensing of foliar chemistry Remote Sens Environ 1989 30 271ndash278 [CrossRef]68 Asner GP Martin RE Tupayachi R Anderson CB Sinca F Carranza-Jimeacutenez L Martinez P
Amazonian functional diversity from forest canopy chemical assembly Proc Natl Acad Sci USA 2014 1115604ndash5609 [CrossRef] [PubMed]
69 Revell LJ Size-correction and principal components for interspecific comparative studies Evolution 200963 3258ndash3268 [CrossRef] [PubMed]
copy 2016 by the authors licensee MDPI Basel Switzerland This article is an open accessarticle distributed under the terms and conditions of the Creative Commons by Attribution(CC-BY) license (httpcreativecommonsorglicensesby40)
- Introduction
- Methods
-
- General Approach
- Site Descriptions
- Species Data for Chemical Spectral and Phylogenetic Analyses
- DNA Sequencing Alignment and Assembly into a Supermatrix
- Phylogenetic Reconstruction DNA-Sequence Based Method
- Phylogeny Reconstruction Supertree Method
- Quantifying Phylogenetic Signal of Spectra and Traits
- Multi-Method Ensemble Selection of Biochemically-Related Spectral Bands
- Quantification of Trait Correlations and Determination of Phylogenetic Independent Contrasts
-
- Results
-
- Spectral Variation across Soil Types
- Patterns of Trait Variation and Co-Variation
- Phylogenetic Structure of Spectra
- Phylogenetic Structure of Traits
- Ensemble Selection of Bands for Biochemical Traits
-
- Discussion
- Conclusions
-

Remote Sens 2016 8 196 3 of 16
have established quantitative relationships with foliar reflectance spectra nitrogen (N ) phosphorus(P ) calcium (Ca ) leaf-mass-per-area (LMA guml macute2) lignin (Lig ) cellulose (Cel ) totalphenols (Phe mguml gacute1) condensed tannins (Tan mguml gacute1) and chlorophyll (Chl mguml gacute1) [2312]Foliar N LMA and chlorophyll relate to growth rates and rates of leaf turnover [30ndash32] Foliar P andCa are rock-derived nutrients often thought to limit growth in tropical forests [33] Lignin and cellulosereflect foliar investments into leaf structure and longevity [34] and phenols and tannins are known tofunction primarily as anti-herbivore defenses [3536] We quantified the relationships between spectraand traits utilizing the multi-model ensemble of Feilhauer et al [37] which has been shown to improvethe robustness of the spectral band selection process relative to utilizing a single technique aloneWe measured the phylogenetic relationships of both spectra and traits with two different phylogeniesone derived from the supertree available through the program Phylomatic [38] and one reconstructedfrom a concatenated alignment of DNA sequences for two plastid markers commonly utilized in plantDNA barcoding matK and rbcL The former includes all taxa but lacks resolution among species withingenera and among genera within families
22 Site Descriptions
This study was conducted in three Neotropical forests that are similar in climate but span a widerange of soil fertility (Figure 1 Table 1) Barro Colorado Island (BCI) Panama is a roughly 15 km2
island located in Lake Gatun The forests of BCI are characterized as moist deciduous tropical forestunderlain by sedimentary volcanic and marine substrates of the early and late Oligocene and anandesite cap forming the highest point on the island (elevation = 137 m asl) [39] Soils on BCI havebeen classified as primarily Combisols and Ferralsols by Baillie et al (2007) [40] and are unusuallyfertile compared to continental neotropical soils [40ndash42] with soil macronutrients evenly distributedacross the landscape [4344] Two additional sites were located along the Tambopata River in thesouthern Peruvian Amazon basin distinguished by varying soil classifications This area is known asldquoChunchordquo and encompasses 6033 ha of moderately high terraces (13ndash17 m) and adjacent expansivefloodplains located upriver from the confluence of the Malinowski and Tambopata Rivers [45] The firstsite in this area Tam-I was on floodplain forests characterized by high-fertility Inceptisols originatingin the Andes and deposited throughout the Holocene [46] The second site Tam-U was located in theterra firme forests on flat to undulating Pleistocene surfaces c 15ndash20 m above the floodplain forestsand are classified as weathered lower fertility haplic Ultisols
Remote Sens 2016 8 196 3 of 16
Foliar P and Ca are rock-derived nutrients often thought to limit growth in tropical forests [33] Lignin and cellulose reflect foliar investments into leaf structure and longevity [34] and phenols and tannins are known to function primarily as anti-herbivore defenses [3536] We quantified the relationships between spectra and traits utilizing the multi-model ensemble of Feilhauer et al [37] which has been shown to improve the robustness of the spectral band selection process relative to utilizing a single technique alone We measured the phylogenetic relationships of both spectra and traits with two different phylogenies one derived from the supertree available through the program Phylomatic [38] and one reconstructed from a concatenated alignment of DNA sequences for two plastid markers commonly utilized in plant DNA barcoding matK and rbcL The former includes all taxa but lacks resolution among species within genera and among genera within families
22 Site Descriptions
This study was conducted in three Neotropical forests that are similar in climate but span a wide range of soil fertility (Figure 1 Table 1) Barro Colorado Island (BCI) Panama is a roughly 15 km2 island located in Lake Gatun The forests of BCI are characterized as moist deciduous tropical forest underlain by sedimentary volcanic and marine substrates of the early and late Oligocene and an andesite cap forming the highest point on the island (elevation = 137 m asl) [39] Soils on BCI have been classified as primarily Combisols and Ferralsols by Baillie et al (2007) [40] and are unusually fertile compared to continental neotropical soils [40ndash42] with soil macronutrients evenly distributed across the landscape [4344] Two additional sites were located along the Tambopata River in the southern Peruvian Amazon basin distinguished by varying soil classifications This area is known as ldquoChunchordquo and encompasses 6033 ha of moderately high terraces (13ndash17 m) and adjacent expansive floodplains located upriver from the confluence of the Malinowski and Tambopata Rivers [45] The first site in this area Tam-I was on floodplain forests characterized by high-fertility Inceptisols originating in the Andes and deposited throughout the Holocene [46] The second site Tam-U was located in the terra firme forests on flat to undulating Pleistocene surfaces c 15ndash20 m above the floodplain forests and are classified as weathered lower fertility haplic Ultisols
Figure 1 Study site locations in (a) Peru with Tam-I and Tam-U on adjacent landscapes in in the ldquoChunchordquo region along the Tambopata River and (b) Panama at Barro Colorado Island located in Lake Gatun north of the Panama Canal Imagecopy Google Earth 2015
Figure 1 Study site locations in (a) Peru with Tam-I and Tam-U on adjacent landscapes in in theldquoChunchordquo region along the Tambopata River and (b) Panama at Barro Colorado Island located inLake Gatun north of the Panama Canal Imagecopy Google Earth 2015
Remote Sens 2016 8 196 4 of 16
Table 1 Demographics and environmental characteristics for study locations For each site thespecies genera and families that co-occur at least one other site is given in parentheses BCI = BarroColorado Island (Panama) Tam-I = Tambopata (Peru) Inceptisol site Tam-U = Tambopata Ultisol siteMAP = mean annual temperature MAT = mean annual precipitation MAT and MAT data are averagedover the ranges 1972ndash1999 for BCI and 2008ndash2013 for Tambopata [4345]
BCI Tam-I Tam-U
DemographicsIndividuals 69 196 200
Species 69 (13) 125 (40) 150 (34)Genera 52 (30) 89 (48) 90 (41)
Families 27 (25) 37 (28) 33 (26)Environment
Elevation (m) 189 220 213MAP (mmyr) 2550 2600 2600
MAT (˝C) 272 24 24Primary soil types CombisolsFerralsols Inceptisols Ultisols
23 Species Data for Chemical Spectral and Phylogenetic Analyses
Biochemical trait data spectral reflectance signatures and genetic data were obtained for299 species in 154 genera and 46 families (Table 1) Data for nine traits (P Ca N LMA Chl Lig CelPhe Tan) were obtained for fully-sunlit top-of-canopy foliage (Table 2) and were quantified as part ofa pan-tropical analysis of foliar biochemical traits previously reported in Asner and Martin (2015) [47]Sampling was designed to capture the diversity of sunlit canopies throughout the sites while alsomaintaining statistical power for replication at the family genus and species levels Between 19 and32 of species overlapped between sites with greater overlap at higher taxonomic levels (45ndash58 ofgenera and 76ndash93 of families Table 1) Sample collection methodology along with analyses ofwithin-species and within-crown variation were previously reported in Asner and Martin (2011) [12]for Tambopata sites and Asner and Martin (2015) [47] for BCI The chemical assays utilized alongwith instruments and standards are described in detail in Asner and Martin (2011) [12] and detailedprotocols are available on the Carnegie Spectranomics Project website (spectranomicsciwedu) Traitdata were transformed where necessary to improve normality (Table 2)
Spectroscopic measurements were made concurrently with sample collection following themethod of Asner and Martin (2011) [12] A detailed methodology of the spectroscopic measurementprocedure for the two Peruvian sites is provided in the supplement to Asner and Martin (2011) [12]and further information is available from spectranomicsciwedu This procedure was also utilizedfor the BCI data collection Briefly six leaves were randomly selected from the outermost surface ofbranches with all signs of epiphyll growth endophytes and herbivory intact to represent the state ofthe tree at the time of collection Spectra were collected with a custom-build field spectrometer thatrecords in 2151 bands spanning the 350 to 2500 nm wavelength region (FS-3 with custom detectorsand exit slit configuration to maximize signal-to-noise performance Analytical Spectra Devices IncBoulder CO USA) an integrating sphere designed for high-resolution spectroscopic measurements(approx 9 mm dia field-of-view) and an illumination collimator [12] The spectra were calibrated fordark current and stray light referenced to a calibration block (Spectralon Labsphere Inc DurhamNH USA) in the integrating sphere Hemispherical reflectance was measured on the leaf adaxialsurface mid-way between the main vein and the leaf edge and roughly halfway from petiole to leaftip Large primary or secondary veins were avoided to the extent possible Calibrated spectra werethen resampled to a 10 nm bandwidth and trimmed to the 400ndash2500 nm range The high fidelity of theresulting spectra did not require smoothing or other filters Each of the six reflectance spectra for anindividual were averaged which were then averaged to the species level
Remote Sens 2016 8 196 5 of 16
Table 2 Trait statistics and phylogenetic signal for all sites Site-level trait means are reported ˘ standard deviation Units of measurement are reported in parenthesesCV = coefficient of variation The phylogenetic signal for each trait is reported for analyses based on DNA and Phylomatic phylogenies subset to the species present ateach site (λDNA and λPhyl) F is the F statistic reported for a one-way ANOVA for trait variation among sites Superscripts (a b c) on site-specific trait means correspondto groups found to be significantly different via Tukeyrsquos post-hoc test for each trait Site variables are defined in the caption to Table 1 Chl = Chlorophyll
TraitTam-I Tam-U
FMean CV () Range λDNA λPhyl Mean CV () Range λDNA λPhyl
Nitrogen dagger () 220 a ˘ 064 290 104ndash408 086 066 218 a ˘ 066 302 119ndash466 066 055 00Phosphorus dagger () 020 b ˘ 008 400 009ndash051 050 058 013 a ˘ 005 391 005ndash033 000 000 726
Calcium daggerdagger () 158 a ˘ 082 518 025ndash485 047 052 072 b ˘ 069 959 003ndash345 030 023 771 LMA daggerdagger (guml macute2) 101 a ˘ 29 287 47ndash191 070 045 111 b ˘ 30 270 38ndash216 014 012 120
Lignin daggerdagger () 199 b ˘ 84 420 63ndash422 079 084 236 a ˘ 93 394 53ndash508 020 039 93 Cellulose daggerdagger () 175 a ˘ 46 263 73ndash293 000 020 184 a ˘ 49 267 64ndash357 000 021 19
Phenols (mguml gacute1) 68 b ˘ 45 664 1ndash173 000 000 90 a ˘ 50 556 1ndash225 042 052 121 Tannins (mguml gacute1) 36 a ˘ 21 574 1ndash87 000 000 43 b ˘ 22 511 0ndash116 039 054 49
Chl dagger (mguml gacute1) 741 b ˘ 229 309 228ndash1511 030 010 669 c ˘ 218 325 216ndash1539 013 012 222
TraitBCI All sites
Mean CV () Range λDNA λPhyl Mean CV () Range λDNA λPhyl
Nitrogen dagger () 218 a ˘ 078 358 101ndash504 000 037 219 ˘ 067 305 101ndash504 082 065 Phosphorus dagger () 012 a ˘ 006 496 005ndash043 000 000 016 ˘ 007 476 005ndash051 022 023
Calcium daggerdagger () 140 a ˘ 077 550 030ndash372 000 047 118 ˘ 086 727 003ndash485 051 038 LMA daggerdagger (guml macute2) 93 a ˘ 27 290 30ndash155 000 000 104 ˘ 30 288 30ndash216 039 022
Lignin daggerdagger () 230 a ˘ 94 510 70ndash431 061 051 220 ˘ 91 414 53ndash508 079 070 Cellulose daggerdagger () 181 a ˘ 49 271 99ndash310 017 017 180 ˘ 48 265 64ndash357 020 054
Phenols (mguml gacute1) 92 a ˘ 56 607 5ndash256 000 000 81 ˘ 50 619 1ndash256 044 041 Tannins (mguml gacute1) 34 a ˘ 21 617 0ndash100 000 010 39 ˘ 22 556 0ndash116 049 040
Chl dagger (mguml gacute1) 771 a ˘ 277 359 381ndash1968 000 000 715 ˘ 235 329 216ndash1968 018 015
p lt 005 p lt 0001 p lt 1 ˆ 10acute5 dagger log-transformed prior to analysis daggerdagger square-root transformed prior to analysis
Remote Sens 2016 8 196 6 of 16
24 DNA Sequencing Alignment and Assembly into a Supermatrix
Genetic material (10 7-mm frozen leaf discs per individual) from samples for all individuals at bothTambopata sites were submitted to the Canadian Centre for DNA Barcoding (CCDB) at the BiodiversityInstitute of Ontario University of Guelph for sequencing Samples were sequenced at two separateloci corresponding to the DNA barcode markers rbcL and matK which together provide resolution ofbasal and more recent evolutionary relationships [16] DNA extraction PCR and sequencing wereperformed at the CCDB following standard high-throughput protocols [48] DNA barcodes for thesame two markers for taxa present within the BCI site were obtained from the Smithsonian InstitutionDepartment of Botany
We combined DNA sequences for BCI and Tambopata into single FASTA files for matK andrbcL markers respectively prior to alignment We aligned both matK and rbcL sequences using theMAFFT multiple sequence alignment software available online (v7) [49] We visually examined andcorrected the aligned sequences utilizing the Mesquite software program (v304) and excluded sitesthat represented gaps across gt99 of sequences No rbcL sites were below this threshold while 47of matK sites were omitted during this step
25 Phylogenetic Reconstruction DNA-Sequence Based Method
We constructed a phylogeny from a concatenated matrix of rbcL and matK DNA sequences fromall three sites using maximum likelihood via the RAxML software (v824) [50] on the CIPRES onlineportal [51] For the rbcL marker 278 of the 299 species had sequence data available for the matK marker210 species had data available For the combined matrix we selected only one sequence per markerper species To include the maximum number of species possible within the combined phylogenywe utilized a hierarchical approach to select sequences within species described in SupplementaryMethods The combined phylogeny included 283 out of 299 species of which 205 had data formatK + rbcL and 78 had data for a single marker only (5 for matK and 73 for rbcL) We made the finaltree ultrametric using the nonparametric rate smoothing method of Sanderson (1997) [52] via thechronos function in the ape package for R [5354]
26 Phylogeny Reconstruction Supertree Method
We constructed a phylogenetic tree for all taxa at the study locations using the computerprogram Phylomatic (v3) [38] with the most recent phylogenetic hypothesis available at the timeof analysis (R20120829 phylogenetic tree for plants derived from the Angiosperm Phylogeny Group IIIreconstruction APGIII 2009) Phylomatic matches a user-submitted list of taxa against a masterphylogeny of plant family and genus-level relationships and returns a trimmed phylogeny for thetaxa desired We used the BLADJ algorithm in Phylocom [55] with the ages file from Gastauer andMeira-Neto (2013) [56] to adjust the branch lengths of the phylogeny using known ages of plantfossils [57] Although providing little to no resolution below (or frequently at) the family levelthe branching pattern of the resulting Phylomatic phylogeny was largely consistent with that of theDNA-based phylogeny at higher taxonomic levels (Supplementary Figure S1)
27 Quantifying Phylogenetic Signal of Spectra and Traits
We estimated phylogenetic signal for foliar reflectance spectra and traits across all sites andspecies utilizing the Phylomatic and DNA-based phylogenies described in Section 25 and 26 andalso for each study location individually by subsetting both the DNA phylogeny and Phylomaticphylogeny to the taxa present at each site (Supplementary Figures S2ndashS7) We estimated phylogeneticsignal for species mean reflectance values at each wavelength and species mean trait values usingthe lambda (λ) statistic introduced by Pagel [28] λ is a scaling parameter that is used to evaluate theextent to which phylogenetic relatedness determines the covariance matrix among species for a giventrait (or spectral wavelength in this study) [58] Estimates of λ were compared to two alternative
Remote Sens 2016 8 196 7 of 16
evolutionary hypotheses that of a star phylogeny in which all tips are equidistant (ie no phylogeneticsignal λ = 0) and that of a trait evolving along the given phylogeny under a model of Brownian motion(λ = 1) We quantified λ independently for each site with separate estimates for both phylogeniesSignificance is computed for each hypothesis via a χ2 test of the likelihood that the observed pattern oftrait expression is generated from a phylogenetic tree with λ equal to zero or one [59]
28 Multi-Method Ensemble Selection of Biochemically-Related Spectral Bands
To evaluate the extent to which spectral features were correlated with biochemical traitswe utilized the multi-method ensemble approach of Feilhauer et al (2015) [37] The ensembleconsists of three regression models used in parallel to quantify foliar traits from leaf reflectancespectra Partial Least Squares (PLS) Random Forest (RF) and Support Vector Machine (SVM) whichprovide separate estimates of the relationship between a biochemical trait and the correspondingspectral signal measured at the leaf level Models were constructed utilizing biochemical trait data forall species included in the study trait data were standardized to have a mean of zero and unit varianceFrom each model we obtained a vector of coefficients indicating the spectral bands most important forthe prediction of a given foliar trait These coefficients were weighted based on model fit and mergedto form an ensemble assessment of the bands most influential to the prediction of trait variation Theensemble utilized data from all three sites to capture the full range of trait and spectral variation
29 Quantification of Trait Correlations and Determination of Phylogenetic Independent Contrasts
Trait correlations may reduce the independence of individual trait-spectral models or estimates ofthe phylogenetic signal of traits To determine the interdependency of traits we calculated pairwisecorrelation among species mean trait values as well as among phylogenetically-corrected trait valuesknown as phylogenetic independent contrasts (PICs) PICs provide an adjusted estimate of traitvariation among species which accounts for the relatedness of taxa and are useful for determiningwhether patterns of trait co-variation are found broadly across a phylogeny or show phylogeneticdependency (eg restricted to the taxa within a given clade) [60] PICs were calculated for each traitusing standardized trait data based on the evolutionary distances given by the DNA-based phylogenyWe then calculated pairwise correlations of PICs which were forced through the origin followingGarland et al (1992) [61]
3 Results
31 Spectral Variation across Soil Types
Leaf reflectance spectra indicated similar mean values across sites and high variance amongspecies at all three sites (Figure 2) The highest reflectance values and greatest range were observedin the near-infrared (NIR 750ndash1300 nm) but the highest coefficients of variation were found in theshortwave-infrared (SWIR 1500ndash2500 nm) followed by the visible spectra region (400ndash750 nm) Leafreflectance spectra for Tam-I and Tam-U were generally similar and lower than BCI spectra in thevisible range and generally higher than BCI in the SWIR with the exception of the absorption featureat ~1800 nm present at both Tambopata sites but absent at BCI Tam-I and BCI were similar and higherthan Tam-U in the NIR Across the three sites the change in spectral reflectance from one wavelengthto the next (eg spectral first derivative) showed low inter-site variation
Remote Sens 2016 8 196 8 of 16Remote Sens 2016 8 196 8 of 16
Figure 2 (a) Mean reflectance spectra for each site (colored lines) and range of all reflectance spectra for all sites included in the study (grey area) (b) Spectral coefficients of variation for all sites (c) Mean differences in spectral reflectance values between sites with mean BCI reflectance as a baseline for comparison (d) Minimum and maximum values of the first derivative of spectral reflectance for species at all sites BCI = Barro Colorado Island (Panama) Tam-I = Tambopata (Peru) Inceptisol site Tam-U = Tambopata Ultisol site
32 Patterns of Trait Variation and Co-Variation
The majority of traits varied linearly with soil fertility (Table 2) Chlorophyll was significantly different between all three sites and decreased linearly from the highest fertility site (BCI) to the lowest fertility site (Tam-U) LMA and tannins were highest at Tam-U and both showed no significant differences between BCI and Tam-I Phosphorus was highest at the floodplain site in Peru (Tam-I) and Ca was lowest at the terra firme site (Tam-U) with no significant difference between the two high-fertility sites Phenols and lignin were lowest at Tam-I and had no significant difference between Tam-U and BCI No significant between-site differences were found for nitrogen or cellulose Coefficients of variation were highest for BCI for nearly all traits (excepting Ca and phenols)
Both species mean trait values and phylogenetic independent contrasts (PICs) revealed substantial trait interdependency (Supplementary Table S1) Trait correlations were common among groups of functionally-related traits such as among the growth-related traits N LMA and chlorophyll which were significantly related among both traits and PICs Traits co-varied less across functional groups with moderately weak (r lt ~ 04) to no correlations observed among growth defense and structural compounds Species mean trait values for two rock-derived traits P and Ca were significantly correlated with nearly all other traits however several of these correlations were weaker among PICs indicating a phylogenetic basis for some patterns of P and Ca covariation (such as both P and Ca with chlorophyll P with lignin cellulose and tannins and Ca with LMA and phenols) The strongest correlation observed between species mean values for phenols and tannins (r = 090) is largely a consequence of the derivation of tannins as a fraction of total phenols
Figure 2 (a) Mean reflectance spectra for each site (colored lines) and range of all reflectance spectrafor all sites included in the study (grey area) (b) Spectral coefficients of variation for all sites (c) Meandifferences in spectral reflectance values between sites with mean BCI reflectance as a baseline forcomparison (d) Minimum and maximum values of the first derivative of spectral reflectance forspecies at all sites BCI = Barro Colorado Island (Panama) Tam-I = Tambopata (Peru) Inceptisol siteTam-U = Tambopata Ultisol site
32 Patterns of Trait Variation and Co-Variation
The majority of traits varied linearly with soil fertility (Table 2) Chlorophyll was significantlydifferent between all three sites and decreased linearly from the highest fertility site (BCI) to thelowest fertility site (Tam-U) LMA and tannins were highest at Tam-U and both showed no significantdifferences between BCI and Tam-I Phosphorus was highest at the floodplain site in Peru (Tam-I) andCa was lowest at the terra firme site (Tam-U) with no significant difference between the two high-fertilitysites Phenols and lignin were lowest at Tam-I and had no significant difference between Tam-Uand BCI No significant between-site differences were found for nitrogen or cellulose Coefficients ofvariation were highest for BCI for nearly all traits (excepting Ca and phenols)
Both species mean trait values and phylogenetic independent contrasts (PICs) revealed substantialtrait interdependency (Supplementary Table S1) Trait correlations were common among groups offunctionally-related traits such as among the growth-related traits N LMA and chlorophyll whichwere significantly related among both traits and PICs Traits co-varied less across functional groupswith moderately weak (r lt ~04) to no correlations observed among growth defense and structuralcompounds Species mean trait values for two rock-derived traits P and Ca were significantlycorrelated with nearly all other traits however several of these correlations were weaker among PICsindicating a phylogenetic basis for some patterns of P and Ca covariation (such as both P and Ca
Remote Sens 2016 8 196 9 of 16
with chlorophyll P with lignin cellulose and tannins and Ca with LMA and phenols) The strongestcorrelation observed between species mean values for phenols and tannins (r = 090) is largely aconsequence of the derivation of tannins as a fraction of total phenols
33 Phylogenetic Structure of Spectra
Spectral regions with λ values significantly greater than zero were observed at all sites and acrossall phylogenies apart from the DNA-based phylogeny constructed for BCI (Figure 3 SupplementaryFigures S8 and S9) Both the DNA-based and Phylomatic phylogenies constructed for all speciesincluded in the study showed significant phylogenetic signal within the SWIR and the Phylomaticphylogeny indicated significant phylogenetic signal within the NIR additionally A substantial drop inphylogenetic signal is present at ~1900 nm for analyses using both phylogenies which is concurrentwith a well-established water feature present at this spectral location [262] Among the site-specificphylogenies phylogenetic signal was highest across the SWIR with λ values significantly greaterthan zero from ~1400 to 2450 nm at both Tam-U (DNA-based and Phylomatic phylogenies) and BCI(Phylomatic phylogeny only) At the two high-fertility sites Tam-I and BCI narrow regions withinthe visible and near-infrared ranges (VNIR) exhibited λ values significantly greater than zero At BCIλ values exhibited two discrete peaks within the visible range from 440 to 490 nm and from 690 to720 nm although only the first peak demonstrated statistical significance (Figure 3) At Tam-Istatistically significant peaks were found from 550 to 610 nm and from 700 to 720 nm Phylogeneticsignal was consistently low or absent throughout the near-infrared (NIR) region across all three sites
Remote Sens 2016 8 196 9 of 16
33 Phylogenetic Structure of Spectra
Spectral regions with λ values significantly greater than zero were observed at all sites and across all phylogenies apart from the DNA-based phylogeny constructed for BCI (Figure 3 Supplementary Figures S8 and S9) Both the DNA-based and Phylomatic phylogenies constructed for all species included in the study showed significant phylogenetic signal within the SWIR and the Phylomatic phylogeny indicated significant phylogenetic signal within the NIR additionally A substantial drop in phylogenetic signal is present at ~1900 nm for analyses using both phylogenies which is concurrent with a well-established water feature present at this spectral location [262] Among the site-specific phylogenies phylogenetic signal was highest across the SWIR with λ values significantly greater than zero from ~1400 to 2450 nm at both Tam-U (DNA-based and Phylomatic phylogenies) and BCI (Phylomatic phylogeny only) At the two high-fertility sites Tam-I and BCI narrow regions within the visible and near-infrared ranges (VNIR) exhibited λ values significantly greater than zero At BCI λ values exhibited two discrete peaks within the visible range from 440 to 490 nm and from 690 to 720 nm although only the first peak demonstrated statistical significance (Figure 3) At Tam-I statistically significant peaks were found from 550 to 610 nm and from 700 to 720 nm Phylogenetic signal was consistently low or absent throughout the near-infrared (NIR) region across all three sites
Figure 3 Phylogenetic signal as Pagelrsquos lambda of species reflectance coefficients at each site for four representative functional traits overlaid on the multi-model ensemble regression coefficients (grey bars) as measures of band importance to each trait model Site-specific lambda spectra are indicated by color BCI=purple Tam-I = cyan Tam-U = green and phylogeny used to generate lambda is indicated by line style DNA = solid lines Phylomatic = dashed lines Red bars (top and bottom) indicate bands selected by the ensemble as most important to the relationship between reflectance and chemical concentrationtrait variation LMA = leaf dry mass per unit area Ca = calcium Lig = lignin Phe = total polyphenols
Figure 3 Phylogenetic signal as Pagelrsquos lambda of species reflectance coefficients at each site forfour representative functional traits overlaid on the multi-model ensemble regression coefficients(grey bars) as measures of band importance to each trait model Site-specific lambda spectra areindicated by color BCI=purple Tam-I = cyan Tam-U = green and phylogeny used to generate lambdais indicated by line style DNA = solid lines Phylomatic = dashed lines Red bars (top and bottom)indicate bands selected by the ensemble as most important to the relationship between reflectance andchemical concentrationtrait variation LMA = leaf dry mass per unit area Ca = calcium Lig = ligninPhe = total polyphenols
Remote Sens 2016 8 196 10 of 16
34 Phylogenetic Structure of Traits
Patterns of phylogenetic signal for traits varied by site and with the methods of phylogeneticconstruction (eg Phylomatic or DNA-based phylogeny Table 2) For most traits phylogeneticsignal was strongest when all sites were included in the phylogenetic analysis For all phylogeneticanalyses including both the full phylogenies and site-specific phylogenies λ values were consistentlysignificantly less than one the value predicted for traits evolving according to a Brownian motionmodel of evolution All traits exhibited λ values significantly greater than zero for the full Phylomaticphylogeny and all traits except for P and phenols exhibited λ values significantly greater than zerofor the full DNA-based phylogeny Among the site-specific phylogenies Ca and lignin were the onlytraits to exhibit λ values significantly greater than zero across all sites At Tam-I we consistently foundevidence of phylogenetic signal for several traits across both community phylogenies including N PCa LMA and lignin At Tam-U both phylogenies indicated phylogenetic signal for N and Ca and theDNA-based phylogeny additionally indicated phylogenetic signal for lignin phenols and tannins
35 Ensemble Selection of Bands for Biochemical Traits
Multi-method ensemble analyses indicated a generally robust link between foliar spectroscopyand leaf traits Mean ensemble fits (combined R2) ranged from a low of 029 for lignin to a high of071 for LMA (Table 3) Among the individual models PLS and SVM regression models consistentlyoutperformed the RF regression model Weighted spectral coefficients indicated frequent agreementbetween the PLS and SVM models in the importance of individual bands for the prediction ofbiochemical traits which contributed to the selection of these bands by the ensemble even whenthe corresponding RF coefficient was comparatively weak (Supplementary Figures S10) Ensemblemodels selected 24ndash40 bands of importance per trait with the majority of selected bands in the SWIR(Figure 3 Table 3) The two defense traits phenols and tannins were expressed exclusively in theSWIR while the growth related traits (chlorophyll N LMA) rock-derived nutrients (Ca P) and ligninwere additionally related to narrow spectral features within the visible range Only the cellulose andchlorophyll models included bands selected within the NIR
Table 3 Ensemble model goodness-of-fit statistics for all traits including fits for the three regressionmodels which comprise the ensemble the ensemble average and the number of bands selected foreach trait model PLS = Partial Least Squares RF = Random Forest SVM = Support Vector Machine
PLS R2 RF R2 SVM R2 Ensemble R2 Bands (n)
Nitrogen 070 018 066 051 31Phosphorus 040 020 038 033 34
Calcium 048 016 048 038 33LMA 076 059 077 071 40
Lignin 039 007 041 029 36Cellulose 052 008 047 036 39Phenols 069 033 073 058 24Tannins 059 025 059 049 30
Chlorophyll 072 056 073 067 31
4 Discussion
Within three Neotropical forest communities we found evidence for phylogenetic structurein foliar reflectance spectra primarily within the visible (400ndash750 nm) and shortwave infrared(1500ndash2500 nm) spectral regions both of which are known to be sensitive to foliar biochemistry(reviewed in Ollinger 2011 [62]) Moreover spectral regions exhibiting significant phylogenetic signalbroadly overlapped with the spectral regions selected by the multi-model ensemble as those mostimportant to the quantitative prediction of the nine foliar traits measured in this study (Figure 2)The general co-incidence of phylogenetic signal and biochemical correlations within the visible and
Remote Sens 2016 8 196 11 of 16
short spectral regions affirms the importance of these broad regions to quantifying foliar traits anddetecting taxonomic differences and further suggests a biochemical basis for species identification viaSpectranomics [25] However both the specific spectral regions that displayed phylogenetic structurevaried considerably among sites which may indicate differences in the evolutionary and ecologicalprocesses acting within the tropical tree communities at each site
Within the visible portion of the spectra we observed contrasting patterns of phylogeneticorganization between high and low fertility sites The phylogenetic signal for species reflectancewithin discrete regions of the visible spectrum at both high-fertility sites Tam-I and BCI may indicatea phylogenetic basis for the absorption of light by chlorophyll and other pigments which are thepredominant biochemical constituents active within this region [361] While we found evidence for astrong chlorophyll band selection in this region we did not observe phylogenetic signal for chlorophyllitself However non-pigment biochemical constituents are known to have an indirect influence onthe efficacy of the photosynthetic apparatus as elements such as N and P are directly and indirectlyinvolved in the biochemistry of photosynthesis [306364]
Soil fertility may play a role in the among-site differences in phylogenetic signal of this spectralregion Nutrient limitation is known to facilitate habitat associations in low-resource tropical treecommunities favoring species that allocate limited resources towards longer-lived better-defendedfoliage [1165] Across a diverse phylogeny this process may be expected to yield the convergence ofdistantly related species on similar trait values which would reduce phylogenetic signal compared toa Brownian expectation [23] However within a relatively high-fertility site local-scale differences inresource availability (including light availability) may contribute to the maintenance of a wide range oflife-history strategies and therefore permit greater conservation of differences among species [2066]Although other explanations are possible it is not implausible to speculate that resource-basedconstraints on photosynthesis may explain differences in patterns of phylogenetic signal within thevisible range between the high and low-fertility sites in this study
Phylogenetic structure was observed across broad regions within the SWIR when comparing allspecies included in the study and was observed to some degree among species present at each sitealbeit λ was not significant at all sites or within all community phylogenies (Figure 3) The majorityof bands selected by the ensemble for importance to foliar biochemical traits were also locatedwithin the SWIR However a comparison of patterns of phylogenetic organization between thetwo Tambopata sites reveals that while more phylogenetic signal is found for foliar reflectancespectra at Tam-U a larger number of foliar traits show evidence of phylogenetic signal at Tam-IThe relationship between foliar biochemistry and reflectance spectra is complex particularly within theSWIR where numerous biochemical constituents may absorb at overlapping wavelengths [67] Directlinks between leaf biochemistry and spectral reflectance within the SWIR are driven by changes in thevibrational or rotational properties of molecules [6267] The relationship between these absorptionfeatures and elemental leaf traits such as N P or more broadly-defined functional traits such asLMA is indirectmdashcontingent upon the allocation of elemental resources to specific biochemicalcompounds (such as N to Rubisco) or biochemical compounds to foliar functional traits (such as ligninto LMA) [3161] Patterns of phylogenetic structure within the SWIR may relate more to these specificbiochemical differences among species than to laboratory estimates of elemental concentrations orbroader functional traits
A low coefficient of variation (CV) within the near-infrared (750ndash1500 nm) spectral region acrossall sites likely contributes to the apparent lack of site-specific phylogenetic signal or importance toprediction of foliar biochemistry within this spectral range (Figures 2b and 3) Given the high diversityof tropical tree species found at each site low dispersion of reflectance values is likely to result indistantly-related species with spectral values more similar than would be predicted by Brownian modelof evolution However a high spectral CV does not necessarily predict a high value for lambda as thisvariation may or may not correspond to patterns of phylogenetic relatedness Similarly low spectral
Remote Sens 2016 8 196 12 of 16
dispersion among species reduces the utility of this region for the prediction of foliar biochemistry(Supplementary Figures S10)
The pattern of phylogenetic organization of traits and spectra at BCI was more contingent uponthe methods of phylogenetic construction than for either site at Tambopata While λ values generatedusing the Phylocom phylogeny revealed significant phylogenetic structure across a substantial portionof the reflectance spectrum and for a few foliar traits (Ca lignin) values of λ generated using theDNA-based phylogeny revealed no significant phylogenetic signal for spectra or traits This contrast islikely driven by differences in phylogenetic resolution between the two phylogenies (SupplementaryFigures 1ndash7) The megatree from which the Phylomatic phylogeny is derived is resolved only to thegenus level and assumes a ldquocomb-shapedrdquo and unresolved phylogeny below this level (ie all speciesequally related) [38] The Phylomatic phylogeny emphasizes evolutionary signal at the basal branches ofthe phylogeny whereas the DNA-based phylogeny also includes resolution at the tips of the phylogenyThus the degree of trait divergence among congeneric species in our DNA-based phylogeny outweighsthe estimate for phylogenetic signal restricted to the basal nodes in the Phylomatic phylogeny Whilethis interpretation holds true across all sites the effects are most pronounced within the BCI communityphylogenies where a relatively higher proportional representation of recently evolved clades such asInga and Ficus increases the influence of these evolutionary relationships at the tips of the phylogeneticbranches on the overall pattern of phylogenetic signal
Previous work by Asner and Martin (2011) [12] established the substantial contribution oftaxonomic organization to between-species variation of several foliar biochemical traits many ofwhich contribute to the spectral reflectance signatures of canopy tree species In the current studywe demonstrate that phylogenetic organization is directly expressed in patterns of spectral variationamong species The patterns of phylogenetic signal observed in the reflectance spectra of three distincttropical canopy tree communities provide a direct confirmation of the phylogenetic basis of foliarreflectance inferred from the relationships of foliar spectra and traits and foliar traits and taxonomy [68]Quantifying this component using λ or other phylogenetic metrics [1469] may have many applicationsin remote sensing from improving species identification algorithms to providing insights into theprocesses driving community assembly Further incorporating phylogenetic analyses into spectralregression models such as PLS RF and SVM may facilitate more robust models by accounting for thestatistical non-independence of species [60] The increasing availability of well-resolved phylogeniesand methods for phylogenetic analysis create an opportunity for all those interested in the evolutionaryunderpinnings of ecological remote sensing
5 Conclusions
Phylogenetic relationships are known to explain a considerable amount of trait variation amongspecies within tropical forest communities and foliar trait variation is known to underlie differencesin foliar reflectance spectra In this study we established that foliar reflectance spectra themselvesare influenced by the phylogenetic relatedness of species and that patterns of trait variation amongcanopy tree communities vary in ways that are suggestive of both phylogenetic and abiotic constraintson ecological strategies The increasing ease of obtaining and utilizing well-resolved phylogeniesnow makes incorporating evolutionary approaches into ecological remote sensing a feasible meansof accounting for the statistical non-independence of species for addressing broad questions ofcommunity assembly and for many other applications in which a robust understanding of theunderlying phylogenetic structure of species is useful
Supplementary Materials The following are available online at wwwmdpicom2072-429283196 Table S1Pairwise Pearsonrsquos correlation coefficients for speciesrsquo standardized mean foliar trait values (lower diagonal) andphylogenetic independent contrasts (PICs) of trait values utilizing the DNA-based phylogeny (upper diagonal)Levels of significance are indicated with asterisks LMA = leaf mass per area Chl = chlorophyll Figure S1Comparison of the branching patterns of the DNA-based phylogeny (left-hand tree) and Phylomatic phylogeny(right hand tree) to the family level for all taxa included in the study ˆ families included only in the DNA-basedphylogeny families included only in the Phylomatic phylogeny Figure S2 DNA phylogeny for BCI representing
Remote Sens 2016 8 196 13 of 16
62 species with available genetic sequences Figure S3 Phylomatic phylogeny for BCI representing 69 speciesincluded in the APG megatree Figure S4 DNA phylogeny for Tam-I representing 121 species with availablegenetic sequences Figure S5 Phylocom phylogeny for Tam-I representing 115 species included in the APGmegatree Figure S6 DNA phylogeny for Tam-U representing 141 species with available genetic sequencesFigure S7 Phylomatic phylogeny for Tam-U representing 144 species included in the APG megatree Figure S8Phylogenetic signal as Pagelrsquos lambda of species reflectance coefficients for all species at all sites included in thestudy utilizing (a) the DNA-based phylogeny and (b) the Phylomatic phylogeny Figure S9 Phylogenetic signal asPagelrsquos lambda of species reflectance coefficients at each site for five functional traits overlaid on the multi-modelensemble regression coefficients (grey bars) as measures of band importance to each trait model Site-specificlambda spectra are indicated by color BCI = purple Tam-I = cyan Tam-U = green and phylogeny used togenerate lambda is indicated by line style DNA = solid lines Phylocom = dashed lines Red bars (top and bottom)indicate bands selected by the ensemble as most important to the relationship between reflectance and chemicalconcentrationtrait variation Chl = chlorophyll N = nitrogen P = phosphorus Cel = cellulose Tan = tanninsFigure S10 Spectral coefficients for three regression models that comprise the multi-model ensemble weighted byindividual model fit statistic (R2) For each wavelength the ensemble coefficient is equal to the sum of the threeindividual model coefficients Bands selected as most influential for each biochemical trait by the ensemble areindicated by grey bars LMA = leaf mass per area Chl = chlorophyll N = nitrogen Ca = calcium P = phosphorusCel = cellulose Phe = phenols Tan = tannins Lig = lignin
Acknowledgments We thank the Spectranomics team for field laboratory and remote sensing assistanceWe thank Caroline Puente and the Smithsonian Tropical Research Institute for assistance with the moleculardata for species collected at BCI Panama and we thank the Canadian Centre for DNA Barcoding (CCDB) at theBiodiversity Institute of Ontario University of Guelph for assistance with the processing of genetic sequencesfrom sites in Tambopata Peru This study and the Spectranomics Project are supported by the John D andCatherine T MacArthur Foundation
Author Contributions KMM GPA and CBF conceived and designed this study GPA and REMdeveloped and implemented the sampling design spectral analyses and chemical analyses KGD WJKand KMM collaborated on the phylogenetic analyses KMM wrote the manuscript all authors providededitorial advice
Conflicts of Interest The authors declare no conflict of interest
References
1 Asner GP Organismic remote sensing for tropical forest ecology and conservation Ann Mo Bot Gard2015 100 127ndash140 [CrossRef]
2 Kokaly RF Asner GP Ollinger SV Martin ME Wessman CA Characterizing canopy biochemistryfrom imaging spectroscopy and its application to ecosystem studies Remote Sens Environ 2009 113 S78ndashS91[CrossRef]
3 Ustin SL Gitelson AA Jacquemoud S Schaepman M Asner GP Gamon JA Zarco-Tejada PRetrieval of foliar information about plant pigment systems from high resolution spectroscopyRemote Sens Environ 2009 113 S67ndashS77 [CrossRef]
4 Homolovaacute L Malenovskyacute Z Clevers JGPW Garciacutea-Santos G Schaepman ME Review of optical-basedremote sensing for plant trait mapping Ecol Complex 2013 15 1ndash16 [CrossRef]
5 White JC Coops NC Hilker T Wulder MA Carroll AL Detecting mountain pine beetle red attackdamage with EO-1 Hyperion moisture indices Int J Remote Sens 2007 28 2111ndash2121 [CrossRef]
6 Dahlin KM Asner GP Field CB Environmental and community controls on plant canopy chemistry in aMediterranean-type ecosystem Proc Natl Acad Sci USA 2013 110 6895ndash6900 [CrossRef] [PubMed]
7 Fassnacht FE Latifi H Ghosh A Joshi PK Koch B Assessing the potential of hyperspectral imagery tomap bark beetle-induced tree mortality Remote Sens Environ 2014 140 533ndash548 [CrossRef]
8 Clark M Roberts D Clark D Hyperspectral discrimination of tropical rain forest tree species at leaf tocrown scales Remote Sens Environ 2005 96 375ndash398 [CrossRef]
9 Kalacska M Bohlman S Sanchez-Azofeifa GA Castro-Esau K Caelli T Hyperspectral discriminationof tropical dry forest lianas and trees Comparative data reduction approaches at the leaf and canopy levelsRemote Sens Environ 2007 109 406ndash415 [CrossRef]
10 Feret J-B Asner GP Mapping tropical forest canopy diversity using high-fidelity imaging spectroscopyEcol Appl 2014 24 1289ndash1296 [CrossRef]
11 Fyllas NM Patintildeo S Baker TR Bielefeld Nardoto G Martinelli LA Quesada CA Paiva RSchwarz M Horna V Mercado LM et al Basin-wide variations in foliar properties of Amazonian forestPhylogeny soils and climate Biogeosciences 2009 6 2677ndash2708 [CrossRef]
Remote Sens 2016 8 196 14 of 16
12 Asner GP Martin RE Canopy phylogenetic chemical and spectral assembly in a lowland Amazonianforest New Phytol 2011 189 999ndash1012 [CrossRef] [PubMed]
13 Freckleton RP Harvey PH Pagel M Phylogenetic analysis and comparative data A test and review ofevidence Am Nat 2002 160 712ndash726 [CrossRef] [PubMed]
14 Blomberg SP Garland T Ives AR Testing for phylogenetic signal in comparative data Behavioral traitsare more labile Evolution 2003 57 717ndash745 [CrossRef] [PubMed]
15 Webb CO Ackerly DD McPeek MA Donoghue MJ Phylogenies and community ecologyAnnu Rev Ecol Syst 2002 33 475ndash505 [CrossRef]
16 Kress WJ Erickson DL Jones FA Swenson NG Perez R Sanjur O Bermingham E Plant DNAbarcodes and a community phylogeny of a tropical forest dynamics plot in Panama Proc Natl Acad Sci USA2009 106 18621ndash18626 [CrossRef] [PubMed]
17 Hollingsworth PM Graham SW Little DP Choosing and using a plant DNA barcode PLoS ONE 2011 6[CrossRef] [PubMed]
18 Kembel SW Hubbell SP The phylogenetic structure of a neotropical forest tree community Ecology 200687 S86ndashS99 [CrossRef]
19 Kraft NJB Cornwell WK Webb CO Ackerly DD Trait evolution community assembly and thephylogenetic structure of ecological communities Am Nat 2007 170 271ndash283 [CrossRef] [PubMed]
20 Wright SJ Kitajima K Kraft NJB Reich PB Wright IJ Bunker DE Condit R Dalling JWDavies SJ Diacuteaz S et al Functional traits and the growthndashmortality trade-off in tropical trees Ecology 201091 3664ndash3674 [CrossRef] [PubMed]
21 Baraloto C Hardy OJ Paine CET Dexter KG Cruaud C Dunning LT Gonzalez M-A Molino J-FSabatier D Savolainen V et al Using functional traits and phylogenetic trees to examine the assembly oftropical tree communities J Ecol 2012 100 690ndash701 [CrossRef]
22 Kress WJ Garciacutea-Robledo C Uriarte M Erickson DL DNA barcodes for ecology evolution andconservation Trends Ecol Evol 2014 30 25ndash35 [CrossRef] [PubMed]
23 Kraft NJB Ackerly DD Functional trait and phylogenetic tests of community assembly across spatialscales in an Amazonian forest Ecol Monogr 2010 80 401ndash422 [CrossRef]
24 Townsend AR Cleveland CC Asner GP Bustamante MMC Controls over foliar NP ratios in tropicalrain forests Ecology 2007 88 107ndash118 [CrossRef]
25 Asner GP Martin RE Airborne spectranomics Mapping canopy chemical and taxonomic diversity intropical forests Front Ecol Environ 2009 7 269ndash276 [CrossRef]
26 Durgante FM Higuchi N Almeida A Vicentini A Species spectral signature Discriminating closelyrelated plant species in the Amazon with near-infrared leaf-spectroscopy For Ecol Manag 2013 291240ndash248 [CrossRef]
27 Lang C Costa FRC Camargo JLC Durgante FM Vicentini A Near infrared spectroscopy facilitatesrapid identification of both young and mature Amazonian tree species PLoS ONE 2015 10 [CrossRef][PubMed]
28 Pagel M Inferring the historical patterns of biological evolution Nature 1999 401 877ndash884 [CrossRef][PubMed]
29 Crisp MD Cook LG Phylogenetic niche conservatism What are the underlying evolutionary andecological causes New Phytol 2012 196 681ndash694 [CrossRef] [PubMed]
30 Field C Mooney HA Photosynthesis-nitrogen relationship in wild plants In Proceedings of the SixthMaria Moors Cabot Symposium on the Economy of Plant Form and Function 29 August 1986 Givnish TJEd Cambridge University Press Cambridge UK pp 25ndash56
31 Westoby M A leaf-height-seed (LHS) plant ecology strategy scheme Plant Soil 1998 199 213ndash227 [CrossRef]32 Poorter H Niinemets Uuml Poorter L Wright IJ Villar R Causes and consequences of variation in leaf
mass per area (LMA) A meta-analysis New Phytol 2009 182 565ndash588 [CrossRef] [PubMed]33 Vitousek PM Sanford RL Nutrient cycling in moist tropical forest Annu Rev Ecol Syst 1986 17 137ndash167
[CrossRef]34 Melillo JM Aber JD Muratore JF Nitrogen and lignin control of hardwood leaf litter decomposition
dynamics Ecology 1982 63 621ndash626 [CrossRef]35 Feeny P Plant apparency and chemical defense Recent Adv Phytochem 1976 10 1ndash40
Remote Sens 2016 8 196 15 of 16
36 Coley PD Costs and benefits of defense by tannins in a neotropical tree Oecologia 1986 70 238ndash241[CrossRef]
37 Feilhauer H Asner GP Martin RE Multi-method ensemble selection of spectral bands related to leafbiochemistry Remote Sens Environ 2015 164 57ndash65 [CrossRef]
38 Webb CO Donoghue MJ Phylomatic Tree assembly for applied phylogenetics Mol Ecol Notes 2005 5181ndash183 [CrossRef]
39 Woodring WP Geology of Barro Colorado Island Canal Zone Smithsonian Institution Washington DC USA1958 Volume 4304
40 Baillie I Elsenbeer H Barthold F Grimm R Stallard RF Semi-Detailed Soil Survey of Barro Colorado IslandSmithsonian Tropical Research Institute Panama City Panama 2007
41 Vitousek PM Litterfall nutrient cycling and nutrient limitation in tropical forests Ecology 1984 65 285ndash298[CrossRef]
42 Messmer T Elsenbeer H Wilcke W High exchangeable calcium concentrations in soils on Barro ColoradoIsland Panama Geoderma 2014 217ndash218 212ndash224 [CrossRef]
43 Leigh EG Tropical Forest Ecology A View from Barro Colorado Island Oxford University Press OxfordUK 1999
44 Yavitt JB Nutrient dynamics of soil derived from different parent material on Barro Colorado IslandPanama Biotropica 2000 32 198ndash207 [CrossRef]
45 Asner GP Anderson CB Martin RE Tupayachi R Knapp DE Sinca F Landscape biogeochemistryreflected in shifting distributions of chemical traits in the Amazon forest canopy Nat Geosci 2015 8 567ndash573[CrossRef]
46 Quesada CA Lloyd J Schwarz M Baker TR Phillips OL Patintildeo S Czimczik C Hodnett MGHerrera R Arneth A et al Regional and large-scale patterns in Amazon forest structure and functionare mediated by variations in soil physical and chemical properties Biogeosci Discuss 2009 6 3993ndash4057[CrossRef]
47 Asner GP Martin RE Convergent elevation trends in canopy chemical traits of tropical forestsGlob Change Biol 2015 [CrossRef] [PubMed]
48 Martin CC Environmental Genomics Methods in Molecular Biology Humana Press Totowa NJ USA 2008Volume 410
49 Katoh K MAFFT A novel method for rapid multiple sequence alignment based on fast Fourier transformNucleic Acids Res 2002 30 3059ndash3066 [CrossRef] [PubMed]
50 Stamatakis A Hoover P Rougemont J A rapid bootstrap algorithm for the RAxML web servers Syst Biol2008 57 758ndash771 [CrossRef] [PubMed]
51 Miller MA Pfeiffer W Schwartz T Creating the CIPRES Science Gateway for inference of largephylogenetic trees In Proceedings of the 2010 Gateway Computing Environments Workshop (GCE)New Orleans LA USA 14 November 2010 pp 1ndash8
52 Sanderson MJ A nonparametric approach to estimating divergence times in the absence of rate constancyMol Biol Evol 1997 14 1218ndash1231 [CrossRef]
53 Paradis E Claude J Strimmer K APE Analyses of phylogenetics and evolution in R languageBioinformatics 2004 20 289ndash290 [CrossRef] [PubMed]
54 R Development Core Team R Data ImportExport Version 2100 200955 Webb CO Ackerly DD Kembel SW Phylocom Software for the analysis of phylogenetic community
structure and trait evolution Bioinformatics 2008 24 2098ndash2100 [CrossRef] [PubMed]56 Gastauer M Meira-Neto JAA Avoiding inaccuracies in tree calibration and phylogenetic community
analysis using Phylocom 42 Ecol Inform 2013 15 85ndash90 [CrossRef]57 Wikstroumlm N Savolainen V Chase MW Evolution of the angiosperms Calibrating the family tree
Proc Biol Sci 2001 268 2211ndash2220 [CrossRef] [PubMed]58 Muumlnkemuumlller T Lavergne S Bzeznik B Dray S Jombart T Schiffers K Thuiller W How to measure
and test phylogenetic signal Methods Ecol Evol 2012 3 743ndash756 [CrossRef]59 Revell LJ Phytools An R package for phylogenetic comparative biology (and other things)
Methods Ecol Evol 2012 3 217ndash223 [CrossRef]60 Felsenstein J Confidence limits on phylogenies An approach using the bootstrap Evolution 1985 39
783ndash791 [CrossRef]
Remote Sens 2016 8 196 16 of 16
61 Garland T Harvey PH Ives AR Procedures for the analysis of comparative data using phylogeneticallyindependent contrasts Syst Biol 1992 41 18ndash32 [CrossRef]
62 Ollinger S V Sources of variability in canopy reflectance and the convergent properties of plants New Phytol2011 189 375ndash394 [CrossRef] [PubMed]
63 Mutanga O Skidmore AK van Wieren S Discriminating tropical grass (Cenchrus ciliaris) canopiesgrown under different nitrogen treatments using spectroradiometry ISPRS J Photogramm Remote Sens 200357 263ndash272 [CrossRef]
64 Reich PB Oleksyn J Wright IJ Leaf phosphorus influences the photosynthesis-nitrogen relationA cross-biome analysis of 314 species Oecologia 2009 160 207ndash212 [CrossRef] [PubMed]
65 Fine PVA Miller ZJ Mesones I Irazuzta S Appel HM Stevens MHH Saumlaumlksjaumlrvi I Schultz JCColey PD The growth-defense trade-off and habitat specialization by plants in Amazonian forests Ecology2006 87 S150ndashS162 [CrossRef]
66 Reich PB Wright IJ Cavender-Bares J Craine JM Olesksyn J Westoby M Walters MB Theevolution of plant functional variation Traits spectra and strategies Int J Plant Sci 2003 164 S143ndashS164[CrossRef]
67 Curran PJ Remote sensing of foliar chemistry Remote Sens Environ 1989 30 271ndash278 [CrossRef]68 Asner GP Martin RE Tupayachi R Anderson CB Sinca F Carranza-Jimeacutenez L Martinez P
Amazonian functional diversity from forest canopy chemical assembly Proc Natl Acad Sci USA 2014 1115604ndash5609 [CrossRef] [PubMed]
69 Revell LJ Size-correction and principal components for interspecific comparative studies Evolution 200963 3258ndash3268 [CrossRef] [PubMed]
copy 2016 by the authors licensee MDPI Basel Switzerland This article is an open accessarticle distributed under the terms and conditions of the Creative Commons by Attribution(CC-BY) license (httpcreativecommonsorglicensesby40)
- Introduction
- Methods
-
- General Approach
- Site Descriptions
- Species Data for Chemical Spectral and Phylogenetic Analyses
- DNA Sequencing Alignment and Assembly into a Supermatrix
- Phylogenetic Reconstruction DNA-Sequence Based Method
- Phylogeny Reconstruction Supertree Method
- Quantifying Phylogenetic Signal of Spectra and Traits
- Multi-Method Ensemble Selection of Biochemically-Related Spectral Bands
- Quantification of Trait Correlations and Determination of Phylogenetic Independent Contrasts
-
- Results
-
- Spectral Variation across Soil Types
- Patterns of Trait Variation and Co-Variation
- Phylogenetic Structure of Spectra
- Phylogenetic Structure of Traits
- Ensemble Selection of Bands for Biochemical Traits
-
- Discussion
- Conclusions
-
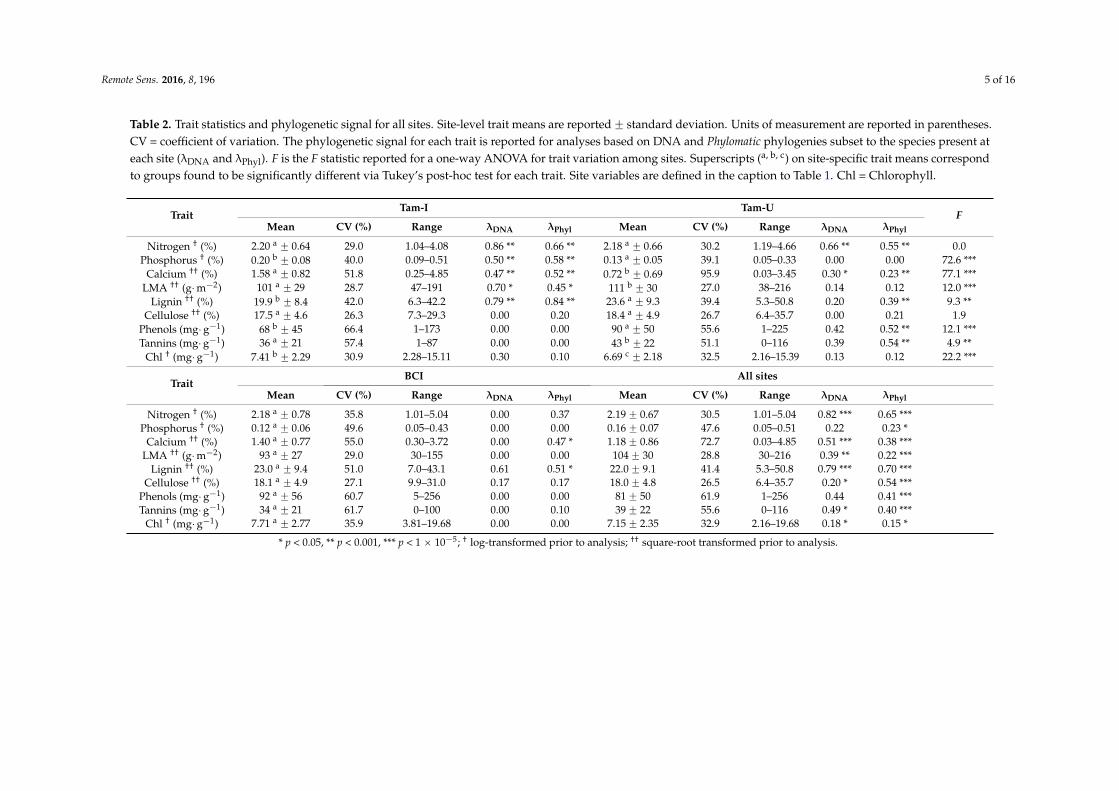

Remote Sens 2016 8 196 9 of 16
with chlorophyll P with lignin cellulose and tannins and Ca with LMA and phenols) The strongestcorrelation observed between species mean values for phenols and tannins (r = 090) is largely aconsequence of the derivation of tannins as a fraction of total phenols
33 Phylogenetic Structure of Spectra
Spectral regions with λ values significantly greater than zero were observed at all sites and acrossall phylogenies apart from the DNA-based phylogeny constructed for BCI (Figure 3 SupplementaryFigures S8 and S9) Both the DNA-based and Phylomatic phylogenies constructed for all speciesincluded in the study showed significant phylogenetic signal within the SWIR and the Phylomaticphylogeny indicated significant phylogenetic signal within the NIR additionally A substantial drop inphylogenetic signal is present at ~1900 nm for analyses using both phylogenies which is concurrentwith a well-established water feature present at this spectral location [262] Among the site-specificphylogenies phylogenetic signal was highest across the SWIR with λ values significantly greaterthan zero from ~1400 to 2450 nm at both Tam-U (DNA-based and Phylomatic phylogenies) and BCI(Phylomatic phylogeny only) At the two high-fertility sites Tam-I and BCI narrow regions withinthe visible and near-infrared ranges (VNIR) exhibited λ values significantly greater than zero At BCIλ values exhibited two discrete peaks within the visible range from 440 to 490 nm and from 690 to720 nm although only the first peak demonstrated statistical significance (Figure 3) At Tam-Istatistically significant peaks were found from 550 to 610 nm and from 700 to 720 nm Phylogeneticsignal was consistently low or absent throughout the near-infrared (NIR) region across all three sites
Remote Sens 2016 8 196 9 of 16
33 Phylogenetic Structure of Spectra
Spectral regions with λ values significantly greater than zero were observed at all sites and across all phylogenies apart from the DNA-based phylogeny constructed for BCI (Figure 3 Supplementary Figures S8 and S9) Both the DNA-based and Phylomatic phylogenies constructed for all species included in the study showed significant phylogenetic signal within the SWIR and the Phylomatic phylogeny indicated significant phylogenetic signal within the NIR additionally A substantial drop in phylogenetic signal is present at ~1900 nm for analyses using both phylogenies which is concurrent with a well-established water feature present at this spectral location [262] Among the site-specific phylogenies phylogenetic signal was highest across the SWIR with λ values significantly greater than zero from ~1400 to 2450 nm at both Tam-U (DNA-based and Phylomatic phylogenies) and BCI (Phylomatic phylogeny only) At the two high-fertility sites Tam-I and BCI narrow regions within the visible and near-infrared ranges (VNIR) exhibited λ values significantly greater than zero At BCI λ values exhibited two discrete peaks within the visible range from 440 to 490 nm and from 690 to 720 nm although only the first peak demonstrated statistical significance (Figure 3) At Tam-I statistically significant peaks were found from 550 to 610 nm and from 700 to 720 nm Phylogenetic signal was consistently low or absent throughout the near-infrared (NIR) region across all three sites
Figure 3 Phylogenetic signal as Pagelrsquos lambda of species reflectance coefficients at each site for four representative functional traits overlaid on the multi-model ensemble regression coefficients (grey bars) as measures of band importance to each trait model Site-specific lambda spectra are indicated by color BCI=purple Tam-I = cyan Tam-U = green and phylogeny used to generate lambda is indicated by line style DNA = solid lines Phylomatic = dashed lines Red bars (top and bottom) indicate bands selected by the ensemble as most important to the relationship between reflectance and chemical concentrationtrait variation LMA = leaf dry mass per unit area Ca = calcium Lig = lignin Phe = total polyphenols
Figure 3 Phylogenetic signal as Pagelrsquos lambda of species reflectance coefficients at each site forfour representative functional traits overlaid on the multi-model ensemble regression coefficients(grey bars) as measures of band importance to each trait model Site-specific lambda spectra areindicated by color BCI=purple Tam-I = cyan Tam-U = green and phylogeny used to generate lambdais indicated by line style DNA = solid lines Phylomatic = dashed lines Red bars (top and bottom)indicate bands selected by the ensemble as most important to the relationship between reflectance andchemical concentrationtrait variation LMA = leaf dry mass per unit area Ca = calcium Lig = ligninPhe = total polyphenols
Remote Sens 2016 8 196 10 of 16
34 Phylogenetic Structure of Traits
Patterns of phylogenetic signal for traits varied by site and with the methods of phylogeneticconstruction (eg Phylomatic or DNA-based phylogeny Table 2) For most traits phylogeneticsignal was strongest when all sites were included in the phylogenetic analysis For all phylogeneticanalyses including both the full phylogenies and site-specific phylogenies λ values were consistentlysignificantly less than one the value predicted for traits evolving according to a Brownian motionmodel of evolution All traits exhibited λ values significantly greater than zero for the full Phylomaticphylogeny and all traits except for P and phenols exhibited λ values significantly greater than zerofor the full DNA-based phylogeny Among the site-specific phylogenies Ca and lignin were the onlytraits to exhibit λ values significantly greater than zero across all sites At Tam-I we consistently foundevidence of phylogenetic signal for several traits across both community phylogenies including N PCa LMA and lignin At Tam-U both phylogenies indicated phylogenetic signal for N and Ca and theDNA-based phylogeny additionally indicated phylogenetic signal for lignin phenols and tannins
35 Ensemble Selection of Bands for Biochemical Traits
Multi-method ensemble analyses indicated a generally robust link between foliar spectroscopyand leaf traits Mean ensemble fits (combined R2) ranged from a low of 029 for lignin to a high of071 for LMA (Table 3) Among the individual models PLS and SVM regression models consistentlyoutperformed the RF regression model Weighted spectral coefficients indicated frequent agreementbetween the PLS and SVM models in the importance of individual bands for the prediction ofbiochemical traits which contributed to the selection of these bands by the ensemble even whenthe corresponding RF coefficient was comparatively weak (Supplementary Figures S10) Ensemblemodels selected 24ndash40 bands of importance per trait with the majority of selected bands in the SWIR(Figure 3 Table 3) The two defense traits phenols and tannins were expressed exclusively in theSWIR while the growth related traits (chlorophyll N LMA) rock-derived nutrients (Ca P) and ligninwere additionally related to narrow spectral features within the visible range Only the cellulose andchlorophyll models included bands selected within the NIR
Table 3 Ensemble model goodness-of-fit statistics for all traits including fits for the three regressionmodels which comprise the ensemble the ensemble average and the number of bands selected foreach trait model PLS = Partial Least Squares RF = Random Forest SVM = Support Vector Machine
PLS R2 RF R2 SVM R2 Ensemble R2 Bands (n)
Nitrogen 070 018 066 051 31Phosphorus 040 020 038 033 34
Calcium 048 016 048 038 33LMA 076 059 077 071 40
Lignin 039 007 041 029 36Cellulose 052 008 047 036 39Phenols 069 033 073 058 24Tannins 059 025 059 049 30
Chlorophyll 072 056 073 067 31
4 Discussion
Within three Neotropical forest communities we found evidence for phylogenetic structurein foliar reflectance spectra primarily within the visible (400ndash750 nm) and shortwave infrared(1500ndash2500 nm) spectral regions both of which are known to be sensitive to foliar biochemistry(reviewed in Ollinger 2011 [62]) Moreover spectral regions exhibiting significant phylogenetic signalbroadly overlapped with the spectral regions selected by the multi-model ensemble as those mostimportant to the quantitative prediction of the nine foliar traits measured in this study (Figure 2)The general co-incidence of phylogenetic signal and biochemical correlations within the visible and
Remote Sens 2016 8 196 11 of 16
short spectral regions affirms the importance of these broad regions to quantifying foliar traits anddetecting taxonomic differences and further suggests a biochemical basis for species identification viaSpectranomics [25] However both the specific spectral regions that displayed phylogenetic structurevaried considerably among sites which may indicate differences in the evolutionary and ecologicalprocesses acting within the tropical tree communities at each site
Within the visible portion of the spectra we observed contrasting patterns of phylogeneticorganization between high and low fertility sites The phylogenetic signal for species reflectancewithin discrete regions of the visible spectrum at both high-fertility sites Tam-I and BCI may indicatea phylogenetic basis for the absorption of light by chlorophyll and other pigments which are thepredominant biochemical constituents active within this region [361] While we found evidence for astrong chlorophyll band selection in this region we did not observe phylogenetic signal for chlorophyllitself However non-pigment biochemical constituents are known to have an indirect influence onthe efficacy of the photosynthetic apparatus as elements such as N and P are directly and indirectlyinvolved in the biochemistry of photosynthesis [306364]
Soil fertility may play a role in the among-site differences in phylogenetic signal of this spectralregion Nutrient limitation is known to facilitate habitat associations in low-resource tropical treecommunities favoring species that allocate limited resources towards longer-lived better-defendedfoliage [1165] Across a diverse phylogeny this process may be expected to yield the convergence ofdistantly related species on similar trait values which would reduce phylogenetic signal compared toa Brownian expectation [23] However within a relatively high-fertility site local-scale differences inresource availability (including light availability) may contribute to the maintenance of a wide range oflife-history strategies and therefore permit greater conservation of differences among species [2066]Although other explanations are possible it is not implausible to speculate that resource-basedconstraints on photosynthesis may explain differences in patterns of phylogenetic signal within thevisible range between the high and low-fertility sites in this study
Phylogenetic structure was observed across broad regions within the SWIR when comparing allspecies included in the study and was observed to some degree among species present at each sitealbeit λ was not significant at all sites or within all community phylogenies (Figure 3) The majorityof bands selected by the ensemble for importance to foliar biochemical traits were also locatedwithin the SWIR However a comparison of patterns of phylogenetic organization between thetwo Tambopata sites reveals that while more phylogenetic signal is found for foliar reflectancespectra at Tam-U a larger number of foliar traits show evidence of phylogenetic signal at Tam-IThe relationship between foliar biochemistry and reflectance spectra is complex particularly within theSWIR where numerous biochemical constituents may absorb at overlapping wavelengths [67] Directlinks between leaf biochemistry and spectral reflectance within the SWIR are driven by changes in thevibrational or rotational properties of molecules [6267] The relationship between these absorptionfeatures and elemental leaf traits such as N P or more broadly-defined functional traits such asLMA is indirectmdashcontingent upon the allocation of elemental resources to specific biochemicalcompounds (such as N to Rubisco) or biochemical compounds to foliar functional traits (such as ligninto LMA) [3161] Patterns of phylogenetic structure within the SWIR may relate more to these specificbiochemical differences among species than to laboratory estimates of elemental concentrations orbroader functional traits
A low coefficient of variation (CV) within the near-infrared (750ndash1500 nm) spectral region acrossall sites likely contributes to the apparent lack of site-specific phylogenetic signal or importance toprediction of foliar biochemistry within this spectral range (Figures 2b and 3) Given the high diversityof tropical tree species found at each site low dispersion of reflectance values is likely to result indistantly-related species with spectral values more similar than would be predicted by Brownian modelof evolution However a high spectral CV does not necessarily predict a high value for lambda as thisvariation may or may not correspond to patterns of phylogenetic relatedness Similarly low spectral
Remote Sens 2016 8 196 12 of 16
dispersion among species reduces the utility of this region for the prediction of foliar biochemistry(Supplementary Figures S10)
The pattern of phylogenetic organization of traits and spectra at BCI was more contingent uponthe methods of phylogenetic construction than for either site at Tambopata While λ values generatedusing the Phylocom phylogeny revealed significant phylogenetic structure across a substantial portionof the reflectance spectrum and for a few foliar traits (Ca lignin) values of λ generated using theDNA-based phylogeny revealed no significant phylogenetic signal for spectra or traits This contrast islikely driven by differences in phylogenetic resolution between the two phylogenies (SupplementaryFigures 1ndash7) The megatree from which the Phylomatic phylogeny is derived is resolved only to thegenus level and assumes a ldquocomb-shapedrdquo and unresolved phylogeny below this level (ie all speciesequally related) [38] The Phylomatic phylogeny emphasizes evolutionary signal at the basal branches ofthe phylogeny whereas the DNA-based phylogeny also includes resolution at the tips of the phylogenyThus the degree of trait divergence among congeneric species in our DNA-based phylogeny outweighsthe estimate for phylogenetic signal restricted to the basal nodes in the Phylomatic phylogeny Whilethis interpretation holds true across all sites the effects are most pronounced within the BCI communityphylogenies where a relatively higher proportional representation of recently evolved clades such asInga and Ficus increases the influence of these evolutionary relationships at the tips of the phylogeneticbranches on the overall pattern of phylogenetic signal
Previous work by Asner and Martin (2011) [12] established the substantial contribution oftaxonomic organization to between-species variation of several foliar biochemical traits many ofwhich contribute to the spectral reflectance signatures of canopy tree species In the current studywe demonstrate that phylogenetic organization is directly expressed in patterns of spectral variationamong species The patterns of phylogenetic signal observed in the reflectance spectra of three distincttropical canopy tree communities provide a direct confirmation of the phylogenetic basis of foliarreflectance inferred from the relationships of foliar spectra and traits and foliar traits and taxonomy [68]Quantifying this component using λ or other phylogenetic metrics [1469] may have many applicationsin remote sensing from improving species identification algorithms to providing insights into theprocesses driving community assembly Further incorporating phylogenetic analyses into spectralregression models such as PLS RF and SVM may facilitate more robust models by accounting for thestatistical non-independence of species [60] The increasing availability of well-resolved phylogeniesand methods for phylogenetic analysis create an opportunity for all those interested in the evolutionaryunderpinnings of ecological remote sensing
5 Conclusions
Phylogenetic relationships are known to explain a considerable amount of trait variation amongspecies within tropical forest communities and foliar trait variation is known to underlie differencesin foliar reflectance spectra In this study we established that foliar reflectance spectra themselvesare influenced by the phylogenetic relatedness of species and that patterns of trait variation amongcanopy tree communities vary in ways that are suggestive of both phylogenetic and abiotic constraintson ecological strategies The increasing ease of obtaining and utilizing well-resolved phylogeniesnow makes incorporating evolutionary approaches into ecological remote sensing a feasible meansof accounting for the statistical non-independence of species for addressing broad questions ofcommunity assembly and for many other applications in which a robust understanding of theunderlying phylogenetic structure of species is useful
Supplementary Materials The following are available online at wwwmdpicom2072-429283196 Table S1Pairwise Pearsonrsquos correlation coefficients for speciesrsquo standardized mean foliar trait values (lower diagonal) andphylogenetic independent contrasts (PICs) of trait values utilizing the DNA-based phylogeny (upper diagonal)Levels of significance are indicated with asterisks LMA = leaf mass per area Chl = chlorophyll Figure S1Comparison of the branching patterns of the DNA-based phylogeny (left-hand tree) and Phylomatic phylogeny(right hand tree) to the family level for all taxa included in the study ˆ families included only in the DNA-basedphylogeny families included only in the Phylomatic phylogeny Figure S2 DNA phylogeny for BCI representing
Remote Sens 2016 8 196 13 of 16
62 species with available genetic sequences Figure S3 Phylomatic phylogeny for BCI representing 69 speciesincluded in the APG megatree Figure S4 DNA phylogeny for Tam-I representing 121 species with availablegenetic sequences Figure S5 Phylocom phylogeny for Tam-I representing 115 species included in the APGmegatree Figure S6 DNA phylogeny for Tam-U representing 141 species with available genetic sequencesFigure S7 Phylomatic phylogeny for Tam-U representing 144 species included in the APG megatree Figure S8Phylogenetic signal as Pagelrsquos lambda of species reflectance coefficients for all species at all sites included in thestudy utilizing (a) the DNA-based phylogeny and (b) the Phylomatic phylogeny Figure S9 Phylogenetic signal asPagelrsquos lambda of species reflectance coefficients at each site for five functional traits overlaid on the multi-modelensemble regression coefficients (grey bars) as measures of band importance to each trait model Site-specificlambda spectra are indicated by color BCI = purple Tam-I = cyan Tam-U = green and phylogeny used togenerate lambda is indicated by line style DNA = solid lines Phylocom = dashed lines Red bars (top and bottom)indicate bands selected by the ensemble as most important to the relationship between reflectance and chemicalconcentrationtrait variation Chl = chlorophyll N = nitrogen P = phosphorus Cel = cellulose Tan = tanninsFigure S10 Spectral coefficients for three regression models that comprise the multi-model ensemble weighted byindividual model fit statistic (R2) For each wavelength the ensemble coefficient is equal to the sum of the threeindividual model coefficients Bands selected as most influential for each biochemical trait by the ensemble areindicated by grey bars LMA = leaf mass per area Chl = chlorophyll N = nitrogen Ca = calcium P = phosphorusCel = cellulose Phe = phenols Tan = tannins Lig = lignin
Acknowledgments We thank the Spectranomics team for field laboratory and remote sensing assistanceWe thank Caroline Puente and the Smithsonian Tropical Research Institute for assistance with the moleculardata for species collected at BCI Panama and we thank the Canadian Centre for DNA Barcoding (CCDB) at theBiodiversity Institute of Ontario University of Guelph for assistance with the processing of genetic sequencesfrom sites in Tambopata Peru This study and the Spectranomics Project are supported by the John D andCatherine T MacArthur Foundation
Author Contributions KMM GPA and CBF conceived and designed this study GPA and REMdeveloped and implemented the sampling design spectral analyses and chemical analyses KGD WJKand KMM collaborated on the phylogenetic analyses KMM wrote the manuscript all authors providededitorial advice
Conflicts of Interest The authors declare no conflict of interest
References
1 Asner GP Organismic remote sensing for tropical forest ecology and conservation Ann Mo Bot Gard2015 100 127ndash140 [CrossRef]
2 Kokaly RF Asner GP Ollinger SV Martin ME Wessman CA Characterizing canopy biochemistryfrom imaging spectroscopy and its application to ecosystem studies Remote Sens Environ 2009 113 S78ndashS91[CrossRef]
3 Ustin SL Gitelson AA Jacquemoud S Schaepman M Asner GP Gamon JA Zarco-Tejada PRetrieval of foliar information about plant pigment systems from high resolution spectroscopyRemote Sens Environ 2009 113 S67ndashS77 [CrossRef]
4 Homolovaacute L Malenovskyacute Z Clevers JGPW Garciacutea-Santos G Schaepman ME Review of optical-basedremote sensing for plant trait mapping Ecol Complex 2013 15 1ndash16 [CrossRef]
5 White JC Coops NC Hilker T Wulder MA Carroll AL Detecting mountain pine beetle red attackdamage with EO-1 Hyperion moisture indices Int J Remote Sens 2007 28 2111ndash2121 [CrossRef]
6 Dahlin KM Asner GP Field CB Environmental and community controls on plant canopy chemistry in aMediterranean-type ecosystem Proc Natl Acad Sci USA 2013 110 6895ndash6900 [CrossRef] [PubMed]
7 Fassnacht FE Latifi H Ghosh A Joshi PK Koch B Assessing the potential of hyperspectral imagery tomap bark beetle-induced tree mortality Remote Sens Environ 2014 140 533ndash548 [CrossRef]
8 Clark M Roberts D Clark D Hyperspectral discrimination of tropical rain forest tree species at leaf tocrown scales Remote Sens Environ 2005 96 375ndash398 [CrossRef]
9 Kalacska M Bohlman S Sanchez-Azofeifa GA Castro-Esau K Caelli T Hyperspectral discriminationof tropical dry forest lianas and trees Comparative data reduction approaches at the leaf and canopy levelsRemote Sens Environ 2007 109 406ndash415 [CrossRef]
10 Feret J-B Asner GP Mapping tropical forest canopy diversity using high-fidelity imaging spectroscopyEcol Appl 2014 24 1289ndash1296 [CrossRef]
11 Fyllas NM Patintildeo S Baker TR Bielefeld Nardoto G Martinelli LA Quesada CA Paiva RSchwarz M Horna V Mercado LM et al Basin-wide variations in foliar properties of Amazonian forestPhylogeny soils and climate Biogeosciences 2009 6 2677ndash2708 [CrossRef]
Remote Sens 2016 8 196 14 of 16
12 Asner GP Martin RE Canopy phylogenetic chemical and spectral assembly in a lowland Amazonianforest New Phytol 2011 189 999ndash1012 [CrossRef] [PubMed]
13 Freckleton RP Harvey PH Pagel M Phylogenetic analysis and comparative data A test and review ofevidence Am Nat 2002 160 712ndash726 [CrossRef] [PubMed]
14 Blomberg SP Garland T Ives AR Testing for phylogenetic signal in comparative data Behavioral traitsare more labile Evolution 2003 57 717ndash745 [CrossRef] [PubMed]
15 Webb CO Ackerly DD McPeek MA Donoghue MJ Phylogenies and community ecologyAnnu Rev Ecol Syst 2002 33 475ndash505 [CrossRef]
16 Kress WJ Erickson DL Jones FA Swenson NG Perez R Sanjur O Bermingham E Plant DNAbarcodes and a community phylogeny of a tropical forest dynamics plot in Panama Proc Natl Acad Sci USA2009 106 18621ndash18626 [CrossRef] [PubMed]
17 Hollingsworth PM Graham SW Little DP Choosing and using a plant DNA barcode PLoS ONE 2011 6[CrossRef] [PubMed]
18 Kembel SW Hubbell SP The phylogenetic structure of a neotropical forest tree community Ecology 200687 S86ndashS99 [CrossRef]
19 Kraft NJB Cornwell WK Webb CO Ackerly DD Trait evolution community assembly and thephylogenetic structure of ecological communities Am Nat 2007 170 271ndash283 [CrossRef] [PubMed]
20 Wright SJ Kitajima K Kraft NJB Reich PB Wright IJ Bunker DE Condit R Dalling JWDavies SJ Diacuteaz S et al Functional traits and the growthndashmortality trade-off in tropical trees Ecology 201091 3664ndash3674 [CrossRef] [PubMed]
21 Baraloto C Hardy OJ Paine CET Dexter KG Cruaud C Dunning LT Gonzalez M-A Molino J-FSabatier D Savolainen V et al Using functional traits and phylogenetic trees to examine the assembly oftropical tree communities J Ecol 2012 100 690ndash701 [CrossRef]
22 Kress WJ Garciacutea-Robledo C Uriarte M Erickson DL DNA barcodes for ecology evolution andconservation Trends Ecol Evol 2014 30 25ndash35 [CrossRef] [PubMed]
23 Kraft NJB Ackerly DD Functional trait and phylogenetic tests of community assembly across spatialscales in an Amazonian forest Ecol Monogr 2010 80 401ndash422 [CrossRef]
24 Townsend AR Cleveland CC Asner GP Bustamante MMC Controls over foliar NP ratios in tropicalrain forests Ecology 2007 88 107ndash118 [CrossRef]
25 Asner GP Martin RE Airborne spectranomics Mapping canopy chemical and taxonomic diversity intropical forests Front Ecol Environ 2009 7 269ndash276 [CrossRef]
26 Durgante FM Higuchi N Almeida A Vicentini A Species spectral signature Discriminating closelyrelated plant species in the Amazon with near-infrared leaf-spectroscopy For Ecol Manag 2013 291240ndash248 [CrossRef]
27 Lang C Costa FRC Camargo JLC Durgante FM Vicentini A Near infrared spectroscopy facilitatesrapid identification of both young and mature Amazonian tree species PLoS ONE 2015 10 [CrossRef][PubMed]
28 Pagel M Inferring the historical patterns of biological evolution Nature 1999 401 877ndash884 [CrossRef][PubMed]
29 Crisp MD Cook LG Phylogenetic niche conservatism What are the underlying evolutionary andecological causes New Phytol 2012 196 681ndash694 [CrossRef] [PubMed]
30 Field C Mooney HA Photosynthesis-nitrogen relationship in wild plants In Proceedings of the SixthMaria Moors Cabot Symposium on the Economy of Plant Form and Function 29 August 1986 Givnish TJEd Cambridge University Press Cambridge UK pp 25ndash56
31 Westoby M A leaf-height-seed (LHS) plant ecology strategy scheme Plant Soil 1998 199 213ndash227 [CrossRef]32 Poorter H Niinemets Uuml Poorter L Wright IJ Villar R Causes and consequences of variation in leaf
mass per area (LMA) A meta-analysis New Phytol 2009 182 565ndash588 [CrossRef] [PubMed]33 Vitousek PM Sanford RL Nutrient cycling in moist tropical forest Annu Rev Ecol Syst 1986 17 137ndash167
[CrossRef]34 Melillo JM Aber JD Muratore JF Nitrogen and lignin control of hardwood leaf litter decomposition
dynamics Ecology 1982 63 621ndash626 [CrossRef]35 Feeny P Plant apparency and chemical defense Recent Adv Phytochem 1976 10 1ndash40
Remote Sens 2016 8 196 15 of 16
36 Coley PD Costs and benefits of defense by tannins in a neotropical tree Oecologia 1986 70 238ndash241[CrossRef]
37 Feilhauer H Asner GP Martin RE Multi-method ensemble selection of spectral bands related to leafbiochemistry Remote Sens Environ 2015 164 57ndash65 [CrossRef]
38 Webb CO Donoghue MJ Phylomatic Tree assembly for applied phylogenetics Mol Ecol Notes 2005 5181ndash183 [CrossRef]
39 Woodring WP Geology of Barro Colorado Island Canal Zone Smithsonian Institution Washington DC USA1958 Volume 4304
40 Baillie I Elsenbeer H Barthold F Grimm R Stallard RF Semi-Detailed Soil Survey of Barro Colorado IslandSmithsonian Tropical Research Institute Panama City Panama 2007
41 Vitousek PM Litterfall nutrient cycling and nutrient limitation in tropical forests Ecology 1984 65 285ndash298[CrossRef]
42 Messmer T Elsenbeer H Wilcke W High exchangeable calcium concentrations in soils on Barro ColoradoIsland Panama Geoderma 2014 217ndash218 212ndash224 [CrossRef]
43 Leigh EG Tropical Forest Ecology A View from Barro Colorado Island Oxford University Press OxfordUK 1999
44 Yavitt JB Nutrient dynamics of soil derived from different parent material on Barro Colorado IslandPanama Biotropica 2000 32 198ndash207 [CrossRef]
45 Asner GP Anderson CB Martin RE Tupayachi R Knapp DE Sinca F Landscape biogeochemistryreflected in shifting distributions of chemical traits in the Amazon forest canopy Nat Geosci 2015 8 567ndash573[CrossRef]
46 Quesada CA Lloyd J Schwarz M Baker TR Phillips OL Patintildeo S Czimczik C Hodnett MGHerrera R Arneth A et al Regional and large-scale patterns in Amazon forest structure and functionare mediated by variations in soil physical and chemical properties Biogeosci Discuss 2009 6 3993ndash4057[CrossRef]
47 Asner GP Martin RE Convergent elevation trends in canopy chemical traits of tropical forestsGlob Change Biol 2015 [CrossRef] [PubMed]
48 Martin CC Environmental Genomics Methods in Molecular Biology Humana Press Totowa NJ USA 2008Volume 410
49 Katoh K MAFFT A novel method for rapid multiple sequence alignment based on fast Fourier transformNucleic Acids Res 2002 30 3059ndash3066 [CrossRef] [PubMed]
50 Stamatakis A Hoover P Rougemont J A rapid bootstrap algorithm for the RAxML web servers Syst Biol2008 57 758ndash771 [CrossRef] [PubMed]
51 Miller MA Pfeiffer W Schwartz T Creating the CIPRES Science Gateway for inference of largephylogenetic trees In Proceedings of the 2010 Gateway Computing Environments Workshop (GCE)New Orleans LA USA 14 November 2010 pp 1ndash8
52 Sanderson MJ A nonparametric approach to estimating divergence times in the absence of rate constancyMol Biol Evol 1997 14 1218ndash1231 [CrossRef]
53 Paradis E Claude J Strimmer K APE Analyses of phylogenetics and evolution in R languageBioinformatics 2004 20 289ndash290 [CrossRef] [PubMed]
54 R Development Core Team R Data ImportExport Version 2100 200955 Webb CO Ackerly DD Kembel SW Phylocom Software for the analysis of phylogenetic community
structure and trait evolution Bioinformatics 2008 24 2098ndash2100 [CrossRef] [PubMed]56 Gastauer M Meira-Neto JAA Avoiding inaccuracies in tree calibration and phylogenetic community
analysis using Phylocom 42 Ecol Inform 2013 15 85ndash90 [CrossRef]57 Wikstroumlm N Savolainen V Chase MW Evolution of the angiosperms Calibrating the family tree
Proc Biol Sci 2001 268 2211ndash2220 [CrossRef] [PubMed]58 Muumlnkemuumlller T Lavergne S Bzeznik B Dray S Jombart T Schiffers K Thuiller W How to measure
and test phylogenetic signal Methods Ecol Evol 2012 3 743ndash756 [CrossRef]59 Revell LJ Phytools An R package for phylogenetic comparative biology (and other things)
Methods Ecol Evol 2012 3 217ndash223 [CrossRef]60 Felsenstein J Confidence limits on phylogenies An approach using the bootstrap Evolution 1985 39
783ndash791 [CrossRef]
Remote Sens 2016 8 196 16 of 16
61 Garland T Harvey PH Ives AR Procedures for the analysis of comparative data using phylogeneticallyindependent contrasts Syst Biol 1992 41 18ndash32 [CrossRef]
62 Ollinger S V Sources of variability in canopy reflectance and the convergent properties of plants New Phytol2011 189 375ndash394 [CrossRef] [PubMed]
63 Mutanga O Skidmore AK van Wieren S Discriminating tropical grass (Cenchrus ciliaris) canopiesgrown under different nitrogen treatments using spectroradiometry ISPRS J Photogramm Remote Sens 200357 263ndash272 [CrossRef]
64 Reich PB Oleksyn J Wright IJ Leaf phosphorus influences the photosynthesis-nitrogen relationA cross-biome analysis of 314 species Oecologia 2009 160 207ndash212 [CrossRef] [PubMed]
65 Fine PVA Miller ZJ Mesones I Irazuzta S Appel HM Stevens MHH Saumlaumlksjaumlrvi I Schultz JCColey PD The growth-defense trade-off and habitat specialization by plants in Amazonian forests Ecology2006 87 S150ndashS162 [CrossRef]
66 Reich PB Wright IJ Cavender-Bares J Craine JM Olesksyn J Westoby M Walters MB Theevolution of plant functional variation Traits spectra and strategies Int J Plant Sci 2003 164 S143ndashS164[CrossRef]
67 Curran PJ Remote sensing of foliar chemistry Remote Sens Environ 1989 30 271ndash278 [CrossRef]68 Asner GP Martin RE Tupayachi R Anderson CB Sinca F Carranza-Jimeacutenez L Martinez P
Amazonian functional diversity from forest canopy chemical assembly Proc Natl Acad Sci USA 2014 1115604ndash5609 [CrossRef] [PubMed]
69 Revell LJ Size-correction and principal components for interspecific comparative studies Evolution 200963 3258ndash3268 [CrossRef] [PubMed]
copy 2016 by the authors licensee MDPI Basel Switzerland This article is an open accessarticle distributed under the terms and conditions of the Creative Commons by Attribution(CC-BY) license (httpcreativecommonsorglicensesby40)
- Introduction
- Methods
-
- General Approach
- Site Descriptions
- Species Data for Chemical Spectral and Phylogenetic Analyses
- DNA Sequencing Alignment and Assembly into a Supermatrix
- Phylogenetic Reconstruction DNA-Sequence Based Method
- Phylogeny Reconstruction Supertree Method
- Quantifying Phylogenetic Signal of Spectra and Traits
- Multi-Method Ensemble Selection of Biochemically-Related Spectral Bands
- Quantification of Trait Correlations and Determination of Phylogenetic Independent Contrasts
-
- Results
-
- Spectral Variation across Soil Types
- Patterns of Trait Variation and Co-Variation
- Phylogenetic Structure of Spectra
- Phylogenetic Structure of Traits
- Ensemble Selection of Bands for Biochemical Traits
-
- Discussion
- Conclusions
-