phylogenetic status of brown trout salmo trutta ...270) iraj_jfb_12a.pdf · freyhof (2007) referred...
TRANSCRIPT
Journal of Fish Biology (2012) 81, 1479–1500
doi:10.1111/j.1095-8649.2012.03428.x, available online at wileyonlinelibrary.com
Phylogenetic status of brown trout Salmo truttapopulations in five rivers from the southern Caspian Sea
and two inland lake basins, Iran: a morphogeneticapproach
I. Hashemzadeh Segherloo*†, H. Farahmand‡, A. Abdoli§,L. Bernatchez‖, C. R. Primmer¶, A. Swatdipong**, M. Karami‡
and B. Khalili‡
*Department of Aquaculture, Faculty of Natural Resources and Earth Sciences, University ofShahre Kord, 115, Iran, ‡Department of Fisheries and Environmental Sciences, Faculty of
Natural Resources, University of Tehran, Karaj, 4111, Iran, §Department of Biodiversity andEcosystem Management, Environmental Research Institute, University of Shahid Beheshty,
G.C. Velenjak, Tehran, Iran, ‖Institut de Biologie Integrative et des Systemes, PavillonCharles-Eugene-Marchand, Universite Laval, Quebec, QC, G1V 0A6, Canada ¶Department of
Biology, 20014, University of Turku, Finland and **Department of Genetics, Faculty ofScience, Kasetsart University, Bangkok, 10900, Thailand
(Received 11 May 2011, Accepted 25 May 2012)
Interrelationships, origin and phylogenetic affinities of brown trout Salmo trutta populations fromthe southern Caspian Sea basin, Orumieh and Namak Lake basins in Iran were analysed from com-plete mtDNA control region sequences, 12 microsatellite loci and morphological characters. Among129 specimens from six populations, seven haplotypes were observed. Based on mtDNA haplotypedata, the Orumieh and southern Caspian populations did not differ significantly, but the Namakbasin–Karaj population presented a unique haplotype closely related to the haplotypes of the otherpopulations (0·1% Kimura two-parameter, K2P divergence). All Iranian haplotypes clustered as adistinct group within the Danube phylogenetic grouping, with an average K2P distance of 0·41%relative to other Danubian haplotypes. The Karaj haplotype in the Namak basin was related to ahaplotype (Da26 ) formerly identified in the Tigris basin in Turkey, to a Salmo trutta oxianus haplo-type from the Aral Sea basin, and to haplotype Da1a with two mutational steps, as well as to otherIranian haplotypes with one to two mutational steps, which may indicate a centre of origin in theCaspian basin. In contrast to results of the mtDNA analysis, more pronounced differentiation wasobserved among the populations studied in the morphological and microsatellite DNA data, exceptfor the two populations from the Orumieh basin, which were similar, possibly due to anthropogeniccauses. © 2012 The Authors
Journal of Fish Biology © 2012 The Fisheries Society of the British Isles
Key words: centre of origin; Danube phylogenetic grouping; microsatellite; morphology; mtDNAcontrol region.
†Author to whom correspondence should be addressed. Tel.: +98 9125461127; email: [email protected]
1479© 2012 The AuthorsJournal of Fish Biology © 2012 The Fisheries Society of the British Isles
1480 I . H A S H E M Z A D E H S E G H E R L O O E T A L .
INTRODUCTION
The numerous forms of brown trout Salmo trutta L. 1758 have been classified underdifferent taxonomic groupings. For example, c. 50 species have been described forvarieties of S. trutta, including 10 species found only in the British Isles (Elliot,1994). According to Berg (1948), S. trutta is represented by six subspecies within theformer Soviet Union: Salmo trutta trutta L. 1758, Salmo trutta labrax Pallas 1814,Salmo trutta caspius Kessler 1877, Salmo trutta oxianus Kessler 1874, Salmo truttaaralensis Berg 1908 and Salmo trutta ezenami Berg 1948. Additionally, Kottelat &Freyhof (2007) referred to different populations of Caspian trout as S. trutta (northernCaspian basin), Salmo ciscaucasicus Dorofeeva 1967 (western Caspian basin), andSalmo caspius Kessler 1877 (southern Caspian basin).
These classifications are based mainly on morphological data and may reflect thephyletic and reproductive relationships of different populations, forms and species,poorly in some cases (Bernatchez, 1995; Osinov & Bernatchez, 1996). Many publi-cations, including the IUCN Red List of Threatened Species (www.iucnredlist.org),have called for the identification of taxa (usually species and subspecies) that requireconservation. Such identifications are generally based on morphological systematics,which can be misleading and may channel conservation activities toward genet-ically indistinct subspecies, rather than distinct lineages in need of conservation(Freeland, 2005).
Genetic markers, in association with morphologic and reproductive data, can fre-quently be helpful in resolving the taxonomy of particular groups of populations(Frankham et al., 2002; Susnik et al., 2006, 2007). Bernatchez et al. (1992), Giuffraet al. (1994), Bernatchez & Osinov (1995), Bernatchez (1995), Apostolidis et al.(1997), Weiss et al. (2000) and Bernatchez (2001) revealed five major phylogeneticlineages in the S. trutta complex using mtDNA sequences, including Atlantic (AT),Mediterranean (ME), Adriatic (AD), Danube (DA) and Marmoratus (MA) phyloge-netic lineages, throughout the range of this species. Additionally, Suarez et al. (2001)suggested another phylogenetic lineage of this complex inhabiting Duero (DU) inthe Iberian Peninsula, and Maric et al. (2006) and Snoj et al. (2009) suggested a newphylogenetic group (Balkan cluster) in the Balkan peninsula. Among the S. truttapopulations distributed in the former Soviet Union, only two phylogenetic group-ings (DA and AT) were identified by Osinov & Bernatchez (1996), with DA beingdistributed in the basins of the Black, Caspian and Aral Seas.
The phylogenetic status of several regional S. trutta populations, including pop-ulations inhabiting Iranian inland basins and The (Persian) Gulf basin (Turkey) aswell as North African populations, was previously unknown (Elliot, 1994). Recentreports place S. trutta populations from the Balikli and Fyrat Rivers (Bernatchez,2001) and Catak Cay (Tigris basin) (Susnik et al., 2005) from The Gulf basin in theDA phylogenetic lineage, and the S. trutta populations from north-west Africa (AtlasMountains) have recently been reported as members of the Atlantic lineage (Snojet al., 2011). This was the case even for morphologically defined species, such asSalmo platycephalus Behnke 1968, that were previously attributed to the Da lineageof S. trutta based on phylogenetic studies (Susnik et al., 2004).
Two inland lake basins (Namak and Orumieh) sustain S. trutta populations withan uncertain phylogenetic affinity. These lake systems are isolated by mountainchains stretching from the north-west to the south (Zagros Mountains) and from the
© 2012 The AuthorsJournal of Fish Biology © 2012 The Fisheries Society of the British Isles, Journal of Fish Biology 2012, 81, 1479–1500
P H Y L O G E N E T I C S TAT U S O F I R A N I A N S A L M O T RU T TA 1481
north-west to the north-east (Alborz Mountains) in Iran. These lakes are isolated fromthe southern Caspian basin in the northern part of the country, where resident andmigratory forms of S. trutta occur (Abdoli, 2000). Salmo trutta inhabiting the Oru-mieh Lake basin, especially the Liqvan River, are a distinct phenotype, which has ledsome authors to propose them as a candidate subspecies of S. trutta (Abdoli, 2000).No detailed phylogenetic or morphological study, however, has been conducted onthese populations to reveal their phylogeny and origin. A phylogenetic study usingmtDNA sequences from five specimens identified as S. trutta collected from south-ern Caspian rivers in Iran showed that the individuals were actually rainbow troutOncorhynchus mykiss (Walbaum 1792)(Osinov, 2009).
The origin and taxonomy of Iranian inland populations of S. trutta (Namak basin)have been placed in contention by referring to them as S. t. macrostigma (Dumeril1858) (Derzhavin, 1929; Berg, 1949; Coad, 2011), S. t. caspius (Saadti, 1977), S.fario caspius Kessler 1877 (Dadikyan, 1986; Coad, 2011), and S. caspius (Kottelat &Freyhof, 2007). Authors identifying the Namak basin trout as S. trutta macrostigmahave presumed a Mediterranean origin for these populations via The Gulf and Zagrosmountains (Coad, 2011), but Saadati (1977) refuted this assumption, because S. truttapopulations are absent from the Iranian Persian Gulf basin and Zagros mountains.The fish inhabiting the Orumieh basin, particularly the Liqvan River population, areknown to be a subspecies of S. trutta (Abdoli, 2000; Coad, 2011).
In this study the truss system of morphometric analysis (Turan, 1999) and both uni-parentally (mtDNA control region complete sequences) and bi-parentally (microsatel-lite loci) inherited molecular markers were used to examine the phylogenetic andtaxonomic status and origin of these S. trutta populations and their relationships toone another.
MATERIALS AND METHODS
S A M P L E C O L L E C T I O NSalmo trutta (n = 102) were collected by electrofishing in four rivers from three basins
during late summer 2006 (Table I and Fig. 1). Legal limitations restricted the sample sizesto a maximum of 30 fish per collection, and the numbers of some collections were furtherrestricted by availability of fish (Table I). Electrofishing was conducted over river stretches>100 m in order to avoid the problem of family sampling (Hansen et al., 1997). Fish wereanaesthetized and after tagging, the left side was photographed and the right pectoral fin wasclipped, tagged as for the whole fish, and fixed in 96% ethanol. The fish was fixed in 4%formalin, after death from over-anaesthetization, for further analysis.
M O R P H O L O G I C A L A NA LY S I SPhenotypic characterization was based on 10 meristic and 120 metric traits. The meristic
traits examined were the red spots on the left side, pectoral, pelvic, dorsal and anal fin softrays, pored lateral-line scales, scales between the origin of the dorsal fin and the lateral lineand between the origin of the adipose fin and the lateral line, the left branchiostegal rays, andthe gill rakers on the first gill arch.
For morphometric analysis, photographic images were made of the left side of each spec-imen. All specimens were placed in the same position for photography. Specimens werepinned to a white board using coloured pins to facilitate location of landmarks in the digitalphotographs. Sixteen landmark points were positioned on morphological points (Bookstein,1991; Fig. 2).
© 2012 The AuthorsJournal of Fish Biology © 2012 The Fisheries Society of the British Isles, Journal of Fish Biology 2012, 81, 1479–1500
1482 I . H A S H E M Z A D E H S E G H E R L O O E T A L .
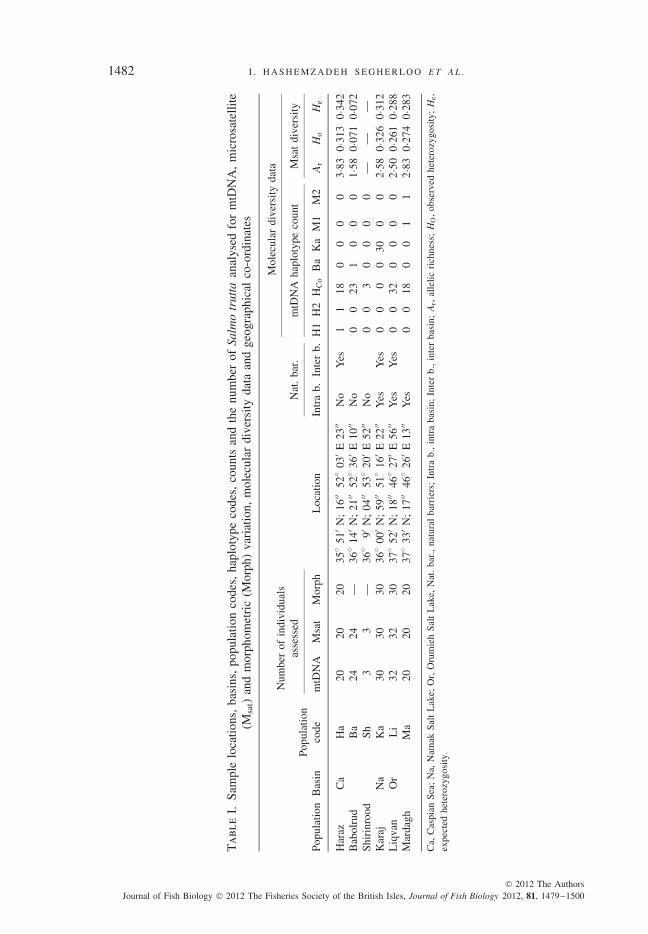
Tab
leI.
Sam
ple
loca
tions
,ba
sins
,po
pula
tion
code
s,ha
plot
ype
code
s,co
unts
and
the
num
ber
ofSa
lmo
trut
taan
alys
edfo
rm
tDN
A,
mic
rosa
telli
te(M
sat)
and
mor
phom
etri
c(M
orph
)va
riat
ion,
mol
ecul
ardi
vers
ityda
taan
dge
ogra
phic
alco
-ord
inat
es
Mol
ecul
ardi
vers
ityda
taN
umbe
rof
indi
vidu
als
asse
ssed
Nat
.ba
r.m
tDN
Aha
plot
ype
coun
tM
sat
dive
rsity
Popu
latio
nB
asin
Popu
latio
nco
dem
tDN
AM
sat
Mor
phL
ocat
ion
Intr
ab.
Inte
rb.
H1
H2
HC
oB
aK
aM
1M
2A
rH
oH
e
Har
azC
aH
a20
2020
35◦
51′ N
;16
′′52
◦03
′ E23
′′N
oY
es1
118
00
00
3·83
0·313
0·342
Bab
olru
dB
a24
24—
36◦
14′ N
;21
′′52
◦36
′ E10
′′N
o0
023
10
00
1·58
0·071
0·072
Shir
inro
odSh
33
—36
◦9′
N;
04′′
53◦
20′ E
52′′
No
00
30
00
0—
——
Kar
ajN
aK
a30
3030
36◦
00′ N
;59
′′51
◦16
′ E22
′′Y
esY
es0
00
030
00
2·58
0·326
0·312
Liq
van
Or
Li
3232
3037
◦52
′ N;
18′′
46◦
27′ E
56′′
Yes
Yes
00
320
00
02·5
00·2
610·2
88M
arda
ghM
a20
2020
37◦
33′ N
;17
′′46
◦26
′ E13
′′Y
es0
018
00
11
2·83
0·274
0·283
Ca,
Cas
pian
Sea;
Na,
Nam
akSa
ltL
ake;
Or,
Oru
mie
hSa
ltL
ake,
Nat
.ba
r.,
natu
ral
barr
iers
;In
tra
b.,
intr
aba
sin;
Inte
rb.
,in
ter
basi
n;A
r,al
lelic
rich
ness
;H
O,
obse
rved
hete
rozy
gosi
ty;H
e,ex
pect
edhe
tero
zygo
sity
.
© 2012 The AuthorsJournal of Fish Biology © 2012 The Fisheries Society of the British Isles, Journal of Fish Biology 2012, 81, 1479–1500

P H Y L O G E N E T I C S TAT U S O F I R A N I A N S A L M O T RU T TA 1483
(a)
(b)
(c)
Li
Ma
Ha
Ba
Sh
Ka
200 Km
500 Km
Caspian Sea
Caspian Sea basin
Namak Lake basin
Fig. 1. (a) Distribution map of Salmo trutta lineages throughout their range, (b) detailed map of the distributionof the Danube lineage of S. trutta and (c) map showing the basins and rivers investigated in this study:Ka, Karaj River; Ha, Haraz River; Ba, Babolrud River; Sh, Shirinrud River; Li, Liqvan River; Ma,Mardagh River.
Landmarks were digitized using tpsDIG 2·10 software (Rohlf, 2006), and the X and Yco-ordinates of the landmarks were converted to linear interlandmark distances using thePythagorean theorem as formulated in an Excel spread sheet (Turan, 1999). The extracteddistance variables were processed using the ratio of each measured distance to the centroidsize of the specimen (Bagherian & Rahmani, 2007; Ruehl & DeWitt, 2007) to eliminatesize effects (Turan, 1999). Centroid size was calculated using tpsRelw 1·45 (Rohlf, 2007).Spearman (rs) and Pearson (r) correlation tests were used for meristic and morphometricvariables, respectively, to test whether any variables were significantly correlated with size.
2
115
13
14
34
1211
10 9
816
7654
Fig. 2. The 16 landmarks (1–16) used for morphometric analysis of Salmo trutta populations.
© 2012 The AuthorsJournal of Fish Biology © 2012 The Fisheries Society of the British Isles, Journal of Fish Biology 2012, 81, 1479–1500

1484 I . H A S H E M Z A D E H S E G H E R L O O E T A L .
The sex of the specimens was determined visually, and an ANOVA test was conducted todetect sex differences. Meristic and size-corrected metric data were subjected to discrim-inant function analysis (DFA). Forward stepwise DFA based on the Mahalanobis distancewas used to determine the relationships among the populations studied (Turan, 2004). Theresulting discriminant functions were used to assign individuals to particular samples. Therelative importance of the morphometric and meristic characters in discriminating popula-tions was assessed using the F-to-remove statistic (F-to-enter, 4; F-to remove, 3·9). Euclidiandistance matrices of the morphometric and meristic data were compared to the allele sharingdistance matrix (DAS) using a Mantle test to determine if there was a correlation betweenmorphological and genetic distances (Froufe et al., 2003). The statistical analyses were per-formed using SPSS v11·5 (www.ibm.com/spss statistics), SYSTAT v9 (www.systat.com) andXLSTAT v2010 (www.xlstat.com).
M T D NA A NA LY S I S
DNA extraction was performed using the Chelex 100 method (Estoup et al., 1996). Thecomplete mtDNA control region was amplified in 129 individuals using the primers BrtD-F20(5′-GAGATTTTAACTCCCACCCT-3′) and BrtD-R20 (5′-TAGGGTCCATCTTAACAGCT-3′), which were designed based on the sequences published in GenBank (NCBI) for S.trutta mtDNA. Two internal primers were also designed to amplify and sequence frag-ments of nearly 0·5 kb of the control region in order to correct any ambiguities in basepair reading resulting from the poly T region in the centre of the control region. Theseinternal primers were InternalF (5′-ACGGGCAATAAGATTGACAC-3) and InternalR (5′-TCTTGAATTCCAGAGAACCC-3′). Polymerase chain reaction (PCR) amplifications wereperformed in 50 μl volumes. Each reaction contained 35·6 μl H2O, 5 μl 10X Buffer, 1 μl50 mM MgCl2, 1 μl of a 10 mM solution of each primer, 1 μl 25 mM deoxynucleotidetriphosphates (dNTP), 0·4 μl BioTaq DNA polymerase and 5 μl template (Estoup et al.,1996). The PCR conditions used were: initial denaturation at 94◦ C for 10 min followedby denaturation at 94◦ C for 1 min, annealing at 52◦ C for 1 min, and extension at 72◦ C 90s for 30 cycles with a final extension at 72◦ C for 15 min. All 129 amplified fragments weresequenced on an ABI-3130 DNA sequencer following the manufacturer’s protocol (AppliedBiosystems; www.appliedbiosystems.com) and aligned using BioEdit v7·0.0 (Applied Biosys-tems). The mtDNA sequences generated in this study have been deposited in GenBank underaccession numbers JF276028–JF276034.
To explore the relationships among the Iranian S. trutta populations, the Kimuratwo-parameter (K2P) distances among the haplotypes were calculated. The maximum par-simony (MP) method implemented in MEGA version 4 (Tamura et al., 2007) and a quartet-puzzling maximum likelihood procedure (ML) implemented in Tree-Puzzle 5·2 (Schmidtet al., 2002) were used to reconstruct the phylogeny of the studied fish, with the Atlanticsalmon Salmo salar L. 1758 being used as an outgroup. In addition to the new sequences, 27haplotypes representing previously described lineages (Bernatchez, 2001; Suarez et al., 2001)were analysed (Table SI, supporting information). For the MP analysis, a heuristic search (10replicates) with a bootstrap test of the phylogeny with 1000 replicates was used. To imple-ment the ML method of phylogenetic reconstruction, HKY + � (Hasegawa et al., 1985) wasselected using an online model test (Posada & Crandall, 1998). To visualize the relationshipsamong haplotypes, a haplotype network was produced using the Templeton, Crandall and Singmethod, TCS 1·21 (Clement et al., 2000). To analyse the mitochondrial genetic differentiationamong the Iranian populations, GST statistics (Nei, 1973) were calculated using DnaSP v. 5·0(Librado & Rozas, 2009).
M I C RO S AT E L L I T E A NA LY S I S
Total genomic DNA was extracted from the fin clips using a salt extraction method (Aljan-abi & Martinez, 1997). Samples were genotyped for 12 dinucleotide microsatellite loci (formore details on microsatellite loci see Tables SII and SIII, supporting information).
The samples were genotyped using single PCR reactions optimized for each primer set.Four fluorescent dyes were used, and unlabelled primers had a GTTT tail added to the 5′ end
© 2012 The AuthorsJournal of Fish Biology © 2012 The Fisheries Society of the British Isles, Journal of Fish Biology 2012, 81, 1479–1500
P H Y L O G E N E T I C S TAT U S O F I R A N I A N S A L M O T RU T TA 1485
to enhance the adenylation of the nascent DNA strand and facilitate accurate genotyping(Brownstein et al., 1996). The primers for Str543INRA, Str15INRA, StruttaINRA, Strutta58and Str85INRA were re-designed to overcome allele-size overlaps (Swatdipong, 2009). Thesingle PCRs (10 μl) consisted of 1 μl (70-80 ng) template DNA, 1 μl (5 pmol) of bothprimers, 1 μl 10X PCR buffer, 0·3 μl MgCl2(50 mM), 0·1 μl 25 mM dNTPs, 0·02 μl 5 Uμl−1
BioTaq DNA polymerase and 6·58 μl H2O. Amplifications were carried out in a PTC100thermal cycler (MJ Research; www.mjr.com), a 2720 Thermal Cycler (Applied Biosystems),or a Piko thermal cycler (Finnzymes Instruments; www.finnzymes.fi). PCR amplifications ofall microsatellite loci, except Str85, Str543, Strutta58 and Str15, were run under the followingthermal conditions: 3 min at 94◦ C followed by 30 cycles of 30 s at 94◦ C, 30 s at an annealingtemperature specific to each target sequence, 30 s at 72◦ C, and 5 min at 72◦ C. For the otherloci, the conditions were 3 min at 94◦ C followed by 30 cycles of 30 s at 94◦ C, 30 s at theannealing temperature, 1 min at 72◦ C, and final extension for 10 min at 72◦ C.
For all samples, the amplicons were diluted and denatured and subsequently subjectedto electrophoresis on an ABI Prism 3130X1 genetic analyser (Applied Biosystems) with aGeneScan 600 LIZ size standard (Applied Biosystems). The sizes of the DNA fragments wereidentified using GeneMapper 4·0 (Applied Biosystems), and all genotypes were manuallyinspected. Some specimens from the Inari Lake Basin in the Barents Sea region in northernEurope (Nukk population) were included in the genotyping analysis as an outgroup.
Exact probability tests for deviations from Hardy–Weinberg equilibrium (HWE) acrosspopulations within loci and loci within populations and exact tests for deviations from geno-typic linkage equilibrium (LE) across populations were performed using GenePop 4·0.10(Rousset, 2008). A sequential Bonferroni correction (Holm, 1979) was used to correct formultiple testing.
Interpopulation genetic divergence was calculated with the multilocus FST estimator (Weir& Cockerham, 1984) using FSTAT 2.9.3.2 (Goudet, 1995). Tests for genetic differentiationamong population pairs were conducted using GenePop 4.0.10 (Rousset, 2008). Populationdifferentiation also was evaluated through assignment of individuals to their putative popu-lations of origin based on multi-locus genotypes. The Bayesian assignment method (Rannala& Mountain, 1997) implemented in GeneClass2 (Piry et al., 2004) was performed with theassignment threshold score set to 0·05 and with Monte–Carlo resampling using the simulationalgorithm of Cornuet et al. (1999). Signals of recent population bottlenecks were assessedusing the Wilcoxon sign-rank and mode-shift tests as implemented in the software BOTTLE-NECK 1.2.02 (Cornuet & Luikart, 1996) assuming the two-phase model (TPM) of mutationfor microsatellite loci with 5% multi-step changes and variance of 12 (Gum et al., 2003).
RESULTS
M O R P H O M E T R I C DATA
Some degree of statistical association was found between most meristic charactersand the fish body size across the entire data set, but it was not linear and thereforenot allometric. The size-corrected metric characters showing a statistically significantcorrelation (P ≤ 0·05) with the size of the fish were excluded from further analy-sis. No significant difference was found between sexes for most of the characters(P ≤ 0·05); thus, after excluding the characters that differed between the sexes, allspecimens were pooled into population groups.
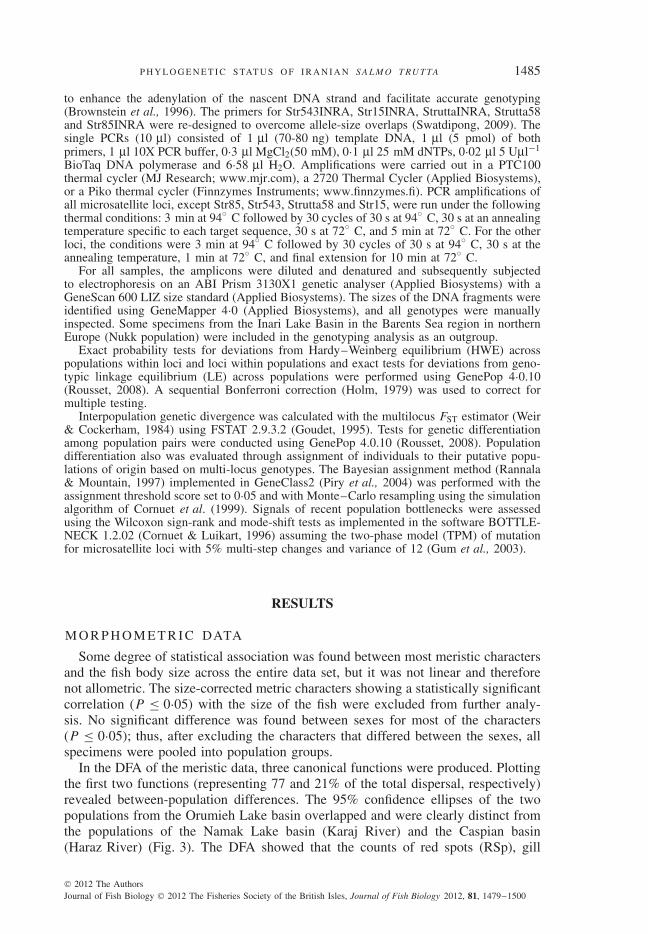
In the DFA of the meristic data, three canonical functions were produced. Plottingthe first two functions (representing 77 and 21% of the total dispersal, respectively)revealed between-population differences. The 95% confidence ellipses of the twopopulations from the Orumieh Lake basin overlapped and were clearly distinct fromthe populations of the Namak Lake basin (Karaj River) and the Caspian basin(Haraz River) (Fig. 3). The DFA showed that the counts of red spots (RSp), gill
© 2012 The AuthorsJournal of Fish Biology © 2012 The Fisheries Society of the British Isles, Journal of Fish Biology 2012, 81, 1479–1500
1486 I . H A S H E M Z A D E H S E G H E R L O O E T A L .
Ma
LiKa
Ha
543210−1−2−3−4−5−4
−3
−2
−1
0
1
2
3
4
DF I
DF
II
Fig. 3. Ninety-five per cent confidence ellipses of the discriminant function (DF) analysis scores for the meristicanalysis of Salmo trutta. Ma, Mardagh; Li, Liqvan; Ka, Karaj; Ha, Haraz (see Fig. 1).
rakers of the first gill arch (GR), scales between the lateral line and adipose finorigin (LLAF) and lateral line scales (LL) were effective countable characters indiscriminating the studied populations (Table II).
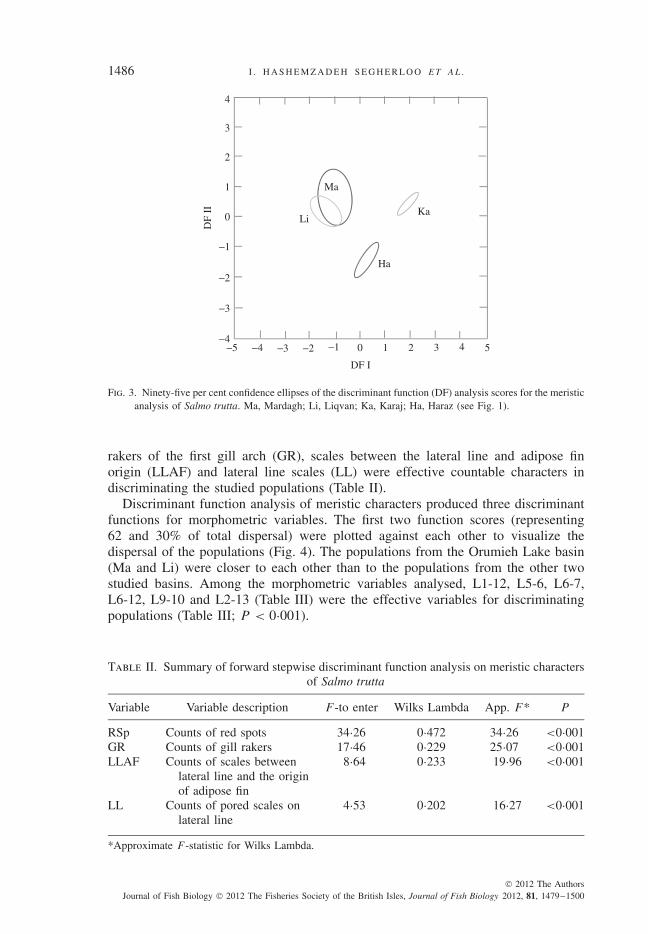
Discriminant function analysis of meristic characters produced three discriminantfunctions for morphometric variables. The first two function scores (representing62 and 30% of total dispersal) were plotted against each other to visualize thedispersal of the populations (Fig. 4). The populations from the Orumieh Lake basin(Ma and Li) were closer to each other than to the populations from the other twostudied basins. Among the morphometric variables analysed, L1-12, L5-6, L6-7,L6-12, L9-10 and L2-13 (Table III) were the effective variables for discriminatingpopulations (Table III; P < 0·001).
Table II. Summary of forward stepwise discriminant function analysis on meristic charactersof Salmo trutta
Variable Variable description F -to enter Wilks Lambda App. F* P
RSp Counts of red spots 34·26 0·472 34·26 <0·001GR Counts of gill rakers 17·46 0·229 25·07 <0·001LLAF Counts of scales between
lateral line and the originof adipose fin
8·64 0·233 19·96 <0·001
LL Counts of pored scales onlateral line
4·53 0·202 16·27 <0·001
*Approximate F -statistic for Wilks Lambda.
© 2012 The AuthorsJournal of Fish Biology © 2012 The Fisheries Society of the British Isles, Journal of Fish Biology 2012, 81, 1479–1500
P H Y L O G E N E T I C S TAT U S O F I R A N I A N S A L M O T RU T TA 1487
MaLi
Ka
Ha
543210−1−2−3−4
−4
−3
−2
−1
0
1
2
3
4
DF I
DF
II
−5
Fig. 4. Ninety-five percent ellipses of the discriminant function (DF) analysis scores for the morphometricanalysis of Salmo trutta. Ka, Karaj; Ma, Mardagh; Li, Liqvan; Ha, Haraz (see Fig. 1).
In assignment tests using a jack-knifing method for the meristic and morphometriccharacters, the average proportions of correct assignments were 68% (Ha: 95%;Ka: 97%; Li: 38% and Ma: 42%) and 79% (Ha: 84%; Ka: 86%; Li: 72% andMa: 74%), respectively. The lower assignment success observed for the populationsof the Orumieh Lake basin was due to their similarity, and the individuals fromthese two populations were mostly mis-assigned to each other. When the Orumiehpopulations were treated as a single population and the assignment test was conductedat the interbasin level, the percentage of correct assignments for Orumian populationsincreased to 75%, with average correct assignment of 89% over all the studied
Table III. Summary of forward stepwise discriminant function analysis on morphometricvariables of Salmo trutta
Variable Variable description F -to enterWilks
Lambda App. F* P
L1–12 Snout to pelvic fin base 26·092 0·548 26·092 <0·001L5–6 Origin of adipose fin to its end 22·712 0·318 24·243 <0·001L6–7 Adipose-fin end to upper origin of
caudal fin19·037 0·197 23·847 <0·001
L6–12 Adipose-fin end to pelvic-fin base 8·142 0·156 20·657 <0·001L9–10 Lower origin of caudal fin to
anal-fin end5·671 0·131 18·199 <0·001
L2–13 Pelvic-fin base to pectoral-fin base 4·118 0·115 16·241 <0·001
*Approximate F -statistic for Wilks Lambda.
© 2012 The AuthorsJournal of Fish Biology © 2012 The Fisheries Society of the British Isles, Journal of Fish Biology 2012, 81, 1479–1500

1488 I . H A S H E M Z A D E H S E G H E R L O O E T A L .
Table IV. Variable site positions in the control region among Iranian Salmo trutta haplo-types. Numbers refer to nucleotide positions in reference to Da24. As the sequences for theDa haplotypes published in GenBank were c. 994 bp in length, the 999th bp, which is variable
in an Iranian haplotype, is not known in the Da haplotypes
Haplotype 177 233 234 389 529 541 542 547 549 562 663 839 878 902 994 999
Da24 C G A C T G G C T – C A T C A NHBa T · · · · A C T · T T · · T · AHKa T · · · · A C T · T T · · · · AHH1 T · · · · A C T · T T G · · G AHCo T · · · · A C T · T T · · · G AHM2 T · · T · A C T · T T · · · G AHM1 T · · · · A C T · T T · · · G GHH2 T · · · · A C T · T T · C · G A
·, nucleotide identity with the Da24 haplotype. Ba, Babolrud River; Ka, Karaj River; H1 & H2, HarazRiver; Co, Caspian Sea and Orumieh Lake; M1, Mardagh River.
populations, for the meristic and 92%, with average correct assignment of 88% overall the studied populations, for the morphometric variables.
M T D NA
The complete mtDNA control region (c. 1030 bp) was analysed to compare theIranian populations to one another; whereas to compare the results for these pop-ulations to other published haplotypes, c. 995 bp of this region was used. A totalof 129 specimens from six populations were used in sequencing, and seven haplo-types including HKa (Karaj River), HH1, HH2 (Haraz River), HBa (Babolrud River),HCo (the most frequent haplotype in all the studied rivers except the Karaj River),HM1 and HM2 (Mardagh River) were found among them. The haplotypes observedmainly comprised a common haplotype (HCo) existing in the Caspian Sea and Oru-mieh Lake basins with an overall frequency of 95%. In contrast, in the Karaj Riverof the Namak Lake basin, all specimens exhibited a unique haplotype (HKa), whichdiffered by 1 bp (0·01%) from the common haplotype. There was no significantsequence divergence found among fish from the Iranian basins except in the Karajpopulation, which was fixed for the Ka haplotype and showed pairwise GST valuesof 0·85-1·00 compared to the other populations. With the exception of one haplotypefrom the Caspian basin (HBa:2 bp), all other haplotypes were 1 bp distant from thecommon haplotype (Table IV).
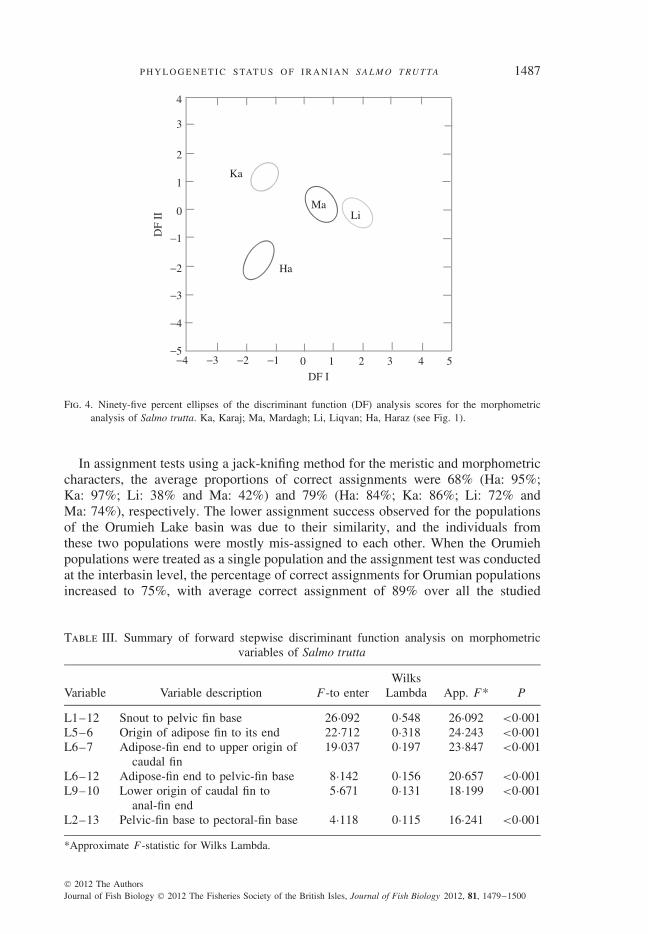
The MP and ML methods used for phylogenetic reconstruction resulted in 50%bootstrap consensus trees with similar topologies. Therefore, only the ML tree ispresented here, with the bootstrap values of the MP method shown on the branches(Fig. 5). As can be seen in the phylogram, the Iranian haplotypes are grouped intoa cluster with the haplotypes of the Danubian lineage. Based on the phylogeneticrelationships between the Iranian populations and the other populations of the Danu-bian lineage, it can be inferred that the Iranian populations, with a mean sequencedivergence of 0·41%, are genetically distinct from the other populations. The min-imum and maximum between group pairwise sequence divergence values of theIranian haplotypes, compared to the other lineages were 1·2% (Adriatic) and 1·54%(Duero), respectively.
© 2012 The AuthorsJournal of Fish Biology © 2012 The Fisheries Society of the British Isles, Journal of Fish Biology 2012, 81, 1479–1500
P H Y L O G E N E T I C S TAT U S O F I R A N I A N S A L M O T RU T TA 1489
98
89
77
92
8796
6784
5751
8693
98 769986
89 96
9797
9798
7098
59
62
75
65 Adcs11Adcs13Adcs14Adcs15Mecs2Mecs7Mecs1Mecs3Ducs21Ducs23Ducs22Atcs16Atcs18Atcs20HBa1HKaHHa1HHa2HMa2HMa1HCoDa23aDa23bS. trutta oxianusDa2Da22Da3S. trutta oxianusDa9Da1aDa1bDa26
Ma2aMa2bS. salar
Da24
Iran
ian
hapl
otyp
es
Fig. 5. Maximum likelihood phylogram of complete mtDNA control region haplotypes (997 bp) from Salmotrutta. Node support is shown by the percent bootstrap values for the maximum parsimony consensus(1000 replicates) above and for maximum likelihood below. Me, Mediterranean; Ad: Adriatic; Da,Danubian; Ma, Marmoratus; At, Atlantic; Du, Duero lineages within the Salmo trutta complex, aspresented in Bernatchez (2001) and Suarez et al., (2001).
M I C RO S AT E L L I T E D NA
All loci were found to be in HW equilibrium (P ≥ 0·5), except for Strutta58 inthe Liqvan population. After using the correction for multiple tests, all loci were inHW equilibrium. The HWE test over all loci and all populations was not significant(P > 0·05).
Based on allele size distances (RST), the Iranian populations were highly differ-entiated from one another, except for those from the Liqvan and Mardagh Rivers inthe Orumieh basin (RST = 0·071). The FST values showed extremely high levels ofdifferentiation among the Iranian populations, with the exception of the Orumiehpopulations (P < 0·001; Table V). Signals suggestive of bottleneck events werealso observed, with the Wilcoxon test revealing significant deviations (P < 0·01)
© 2012 The AuthorsJournal of Fish Biology © 2012 The Fisheries Society of the British Isles, Journal of Fish Biology 2012, 81, 1479–1500
1490 I . H A S H E M Z A D E H S E G H E R L O O E T A L .
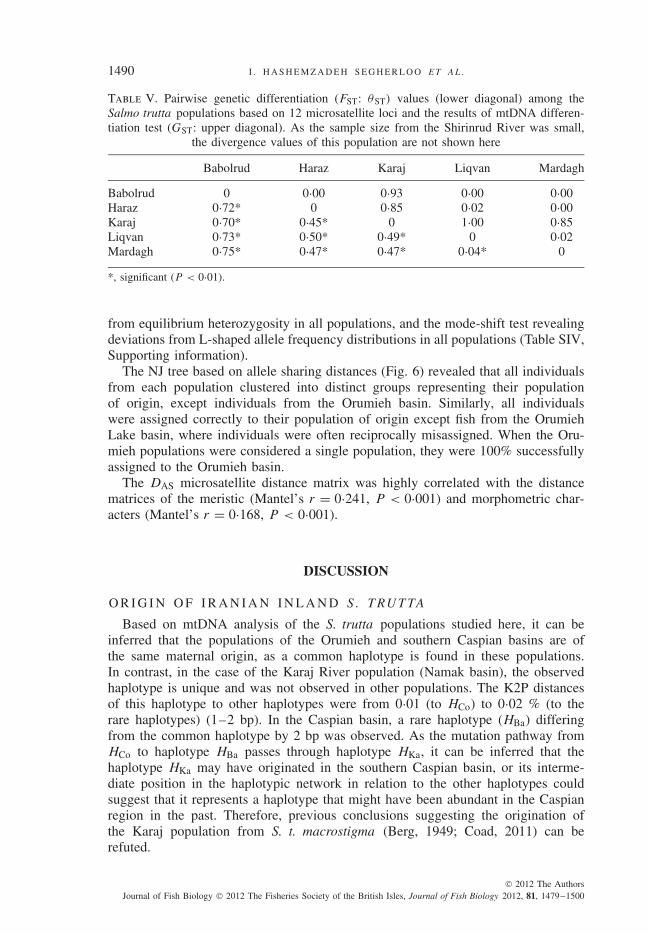
Table V. Pairwise genetic differentiation (FST: θST) values (lower diagonal) among theSalmo trutta populations based on 12 microsatellite loci and the results of mtDNA differen-tiation test (GST: upper diagonal). As the sample size from the Shirinrud River was small,
the divergence values of this population are not shown here
Babolrud Haraz Karaj Liqvan Mardagh
Babolrud 0 0·00 0·93 0·00 0·00Haraz 0·72* 0 0·85 0·02 0·00Karaj 0·70* 0·45* 0 1·00 0·85Liqvan 0·73* 0·50* 0·49* 0 0·02Mardagh 0·75* 0·47* 0·47* 0·04* 0
*, significant (P < 0·01).
from equilibrium heterozygosity in all populations, and the mode-shift test revealingdeviations from L-shaped allele frequency distributions in all populations (Table SIV,Supporting information).
The NJ tree based on allele sharing distances (Fig. 6) revealed that all individualsfrom each population clustered into distinct groups representing their populationof origin, except individuals from the Orumieh basin. Similarly, all individualswere assigned correctly to their population of origin except fish from the OrumiehLake basin, where individuals were often reciprocally misassigned. When the Oru-mieh populations were considered a single population, they were 100% successfullyassigned to the Orumieh basin.
The DAS microsatellite distance matrix was highly correlated with the distancematrices of the meristic (Mantel’s r = 0·241, P < 0·001) and morphometric char-acters (Mantel’s r = 0·168, P < 0·001).
DISCUSSION
O R I G I N O F I R A N I A N I N L A N D S . T RU T TA
Based on mtDNA analysis of the S. trutta populations studied here, it can beinferred that the populations of the Orumieh and southern Caspian basins are ofthe same maternal origin, as a common haplotype is found in these populations.In contrast, in the case of the Karaj River population (Namak basin), the observedhaplotype is unique and was not observed in other populations. The K2P distancesof this haplotype to other haplotypes were from 0·01 (to HCo) to 0·02 % (to therare haplotypes) (1–2 bp). In the Caspian basin, a rare haplotype (HBa) differingfrom the common haplotype by 2 bp was observed. As the mutation pathway fromHCo to haplotype HBa passes through haplotype HKa, it can be inferred that thehaplotype HKa may have originated in the southern Caspian basin, or its interme-diate position in the haplotypic network in relation to the other haplotypes couldsuggest that it represents a haplotype that might have been abundant in the Caspianregion in the past. Therefore, previous conclusions suggesting the origination ofthe Karaj population from S. t. macrostigma (Berg, 1949; Coad, 2011) can berefuted.
© 2012 The AuthorsJournal of Fish Biology © 2012 The Fisheries Society of the British Isles, Journal of Fish Biology 2012, 81, 1479–1500

P H Y L O G E N E T I C S TAT U S O F I R A N I A N S A L M O T RU T TA 1491
0·1
Liqvan and Mardagh(Orumieh basin)
Karaj (Namak basin)
Haraz(Caspian basin)
Babolrood(Caspian basin)
Inari Population(Barents Sea basin)
Fig. 6. Neighbour-joining tree based on individual microsatellite allele sharing (DAS) values for all Salmotrutta sampled across five populations, with those from the Nukk population in the Barents Sea basinbeing used as an outgroup. All populations, except those from the Orumieh basin, clustered together,so only the population names are given. , individuals belonging to the Mardagh population from theOrumieh basin.
P OT E N T I A L PAT H WAY S F O R T H E O R I G I N O F T H EO B S E RV E D H A P L OT Y P E S
The similarity found among S. trutta populations in the basins studied indi-cates that gene flow occurred among them in the past. Past gene flow among thebasins of the Ponto-Caspian region has been previously reported based on haplotype
© 2012 The AuthorsJournal of Fish Biology © 2012 The Fisheries Society of the British Isles, Journal of Fish Biology 2012, 81, 1479–1500

1492 I . H A S H E M Z A D E H S E G H E R L O O E T A L .
similarities among S. trutta inhabiting the Aral, Caspian and Black Sea basins (Osi-nov & Bernatchez, 1996). Possible connection corridors between the basins studiedhere could be interdrainage connections in the northern part of the Orumieh basinin Khoy (Ghara-Tappeh) via the Aras River, which drains into the Caspian Sea, orstream capture events occurring in the southeast of this basin, as the headwaters ofsome rivers draining to the Caspian Sea are located in proximity to the south-easternOrumieh basin. Osinov and Bernatchez (1996) reported a molecular clock rate of 0·8% per million years for the S. trutta control region. Assuming this clock rate, basedon the negligible sequence divergence found among Iranian S. trutta populations(<1%), it can be inferred that the time elapsing since their isolation has not beenlong. This conclusion is supported by geological reports indicating the origin of themodern Orumieh Lake c. 10 000–30 000 years ago (Darvishzadeh, 2007). Addition-ally, it was noted by Coad (2011) that Orumieh Lake was formed during the latePleiocene–Pleistocene and may have had a Pleistocene connection to the CaspianSea. Saadati (1977) suggested two possible connections between the Caspian andOrumieh basins, including a Pliocene–early Pleistocene connection, giving rise toendemic species of this basin and a late Pleistocene connection resulting in speciesthat are similar or subspecifically distinct from their Caspian counterparts. Streamcapture is another mechanism that could have allowed the introduction of somespecies, such as S. trutta, into the Orumieh basin in recent times (Coad, 2011). Thiscould also be the case for the Namak basin. A number of river drainages are close tothose of the Caspian Sea basin, and the fauna in the Namak basin may be of recentorigin (Berg, 1940). Derzhavin (1934) suggested a Pliocene origin for S. trutta inthe Namak basin. Defensible inferences might be derived by screening samples fromother rivers in these basins to provide new insights into historical relationships amongS. trutta populations in these parts of their range.
I N F E R E N C E S F RO M M O R P H O L O G Y
The counts of the meristic characters obtained in the populations studied are similarto the results of other studies of S. trutta populations in the southern Caspian Seabasin (Vatandoost, 2008) and to reports on freshwater fishes of Iran (Saadati, 1977).The most strikingly different meristic character among the studied populations wasthe higher mean ± s.d. count of red spots (P < 0·001) in populations from theOrumieh Lake basin (119·17 ± 39·25), which could have a genetic basis (Skaala& Jøstard, 1987; Blanc et al., 1994). Additionally, a meristic character for whichcounts were significantly higher (P < 0·001) in the Karaj population, compared tothe other three populations studied here, was the gill rakers on the first gill arch,which have been noted as an important character in the identification of lineages andsubspecies of S. trutta (Hermida et al., 2009). It is apparent from mtDNA data andfrom the overlapping ranges of the studied characters among populations that thischaracter does not discriminate among lineages for the Iranian populations, exceptin indicating that the Karaj population is a distinct population of Iranian S. trutta.Derzhavin (1929), Numann (1969) and Saadati (1977) also reported a Caspian originfor the Karaj S. trutta based on morphological characters. Therefore, no Iranianpopulation can be considered significantly diverged from the others, including theLiqvan population, which some authors have suggested may be a subspecies of S.trutta (Abdoli, 2000).
© 2012 The AuthorsJournal of Fish Biology © 2012 The Fisheries Society of the British Isles, Journal of Fish Biology 2012, 81, 1479–1500
P H Y L O G E N E T I C S TAT U S O F I R A N I A N S A L M O T RU T TA 1493
M I C RO S AT E L L I T E P H Y L O G E N Y O F I R A N I A N S . T RU T TA
In contrast to observations of the mtDNA control region, microsatellite datashowed extensive divergence among the studied populations. This discordancebetween mtDNA and nuclear phylogenies has been reported previously and can becaused by events such as historical introgression and selection (Redenbach & Taylor,2002; Sanz et al., 2006; Canino et al., 2010; Hedtke & Hillis, 2010; Waters et al.,2010). The discordance between mtDNA differentiation and microsatellite loci mightbe caused by population bottlenecks (Goncalves et al., 2009), past introgressionbetween lineages (Pustovrh et al., 2011), or the higher mutation rate of microsatel-lite markers compared to mtDNA. Vera et al. (2011) using both microsatellite andmtDNA markers did not report such differing results in Iranian S. trutta popula-tions from the Caspian Sea. They studied managed populations in which hatcheryproduced offspring were reared to 10-20 g in common facilities and subsequentlyreleased into managed rivers (P. Zanoosi, pers. comm.). Such pooling of the fish pro-duced by spawners of various origins homogenizes any significant allele frequencydifferentiation or reduces the differences (Ton-e-Kabon and Sardabrud Rives beingmanaged normally and Karganrud and Navrud Rivers augmented with hatchery pro-duced offspring in the past). None of the populations studied here were managed,and the differentiation levels observed are likely to be natural. All of the studiedpopulations, except those from the Orumieh basin, were separated in an individualNJ tree based on DAS distances. This level of divergence found for nuclear loci ispossibly due to the reproductive isolation of the populations resulting from existingnatural barriers or ecological barriers to intra-basin migration at the southern bound-aries of the distribution of these populations, which limits anadromy (Antunes et al.,2006). This would result in a stronger influence of random genetic drift and, possi-bly, natural selection in altering allele frequencies in the absence of homogenizingmigration (Hansen & Mensberg, 1998). The populations of the Orumieh basin arehighly similar to each other with respect to their microsatellite loci and morphology,indicating recent strong gene flow between them. If the divergence of populations inthe Orumieh basin (where the hypersaline Lake Orumieh represents a barrier betweenpopulations) is compared to the divergence in the Caspian basin, where there are nostrong barriers except the geographical distances among river mouths, the similar-ity between Mardagh and Liqvan populations may be due to anthropogenic causes,specifically, unreported transfer of fish from the Mardagh to the Liqvan River. Thismay have led to the disequilibrium in allele frequency at locus Strutta58 in theLiqvan population.
P H Y L O G E N E T I C S TAT U S O F I R A N I A N S . T RU T TA
Based on the mtDNA phylogenetic tree constructed using Iranian haplotypes andpublished haplotypes representing major evolutionary lineages of the S. trutta com-plex, it is clear that the Iranian haplotypes, which present a mean intergroup K2Pdistance of 0·41% to the other Da haplotypes, are distinct members of the Danubianlineage (Fig. 5). This observation is in agreement with those of the phylogeneticstructure of S. trutta in the Ponto-Caspian region by Osinov & Bernatchez (1996)and southern Caspian sea S. trutta populations by Vera et al. (2011), who showedthat S. trutta inhabiting this region are of Danubian phylogeny. The S. trutta popu-lations inhabiting the southern Caspian basin and the two inland basins studied here
© 2012 The AuthorsJournal of Fish Biology © 2012 The Fisheries Society of the British Isles, Journal of Fish Biology 2012, 81, 1479–1500
1494 I . H A S H E M Z A D E H S E G H E R L O O E T A L .
(referred to as S. caspius by Kottelat & Freyhof, (2007)) can be regarded as distinctmembers of the Danubian lineage of S. trutta based on their mtDNA phylogeny,rather than as separate species or subspecies.
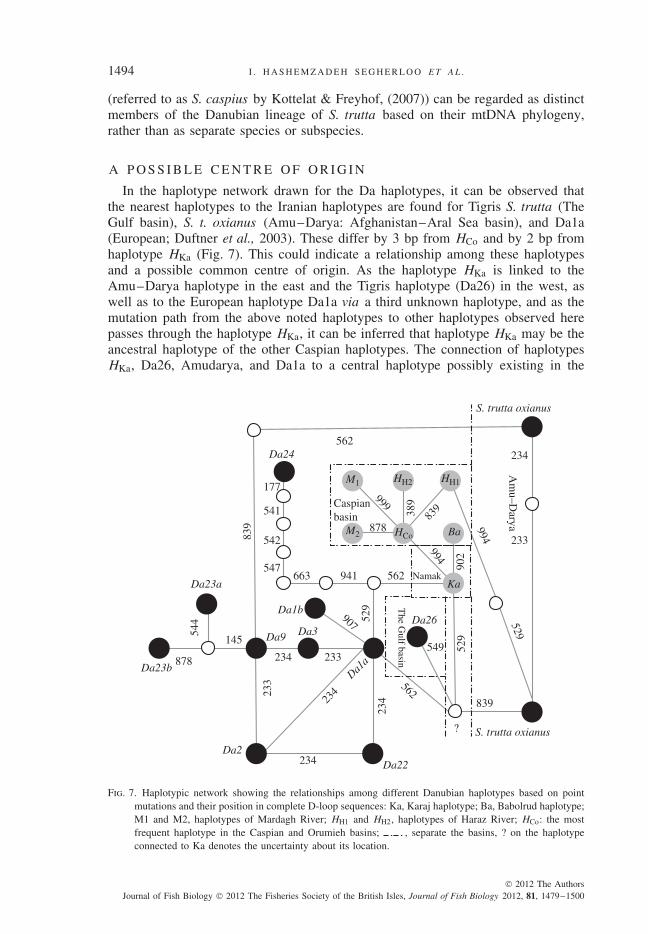
A P O S S I B L E C E N T R E O F O R I G I N
In the haplotype network drawn for the Da haplotypes, it can be observed thatthe nearest haplotypes to the Iranian haplotypes are found for Tigris S. trutta (TheGulf basin), S. t. oxianus (Amu–Darya: Afghanistan–Aral Sea basin), and Da1a(European; Duftner et al., 2003). These differ by 3 bp from HCo and by 2 bp fromhaplotype HKa (Fig. 7). This could indicate a relationship among these haplotypesand a possible common centre of origin. As the haplotype HKa is linked to theAmu–Darya haplotype in the east and the Tigris haplotype (Da26) in the west, aswell as to the European haplotype Da1a via a third unknown haplotype, and as themutation path from the above noted haplotypes to other haplotypes observed herepasses through the haplotype HKa, it can be inferred that haplotype HKa may be theancestral haplotype of the other Caspian haplotypes. The connection of haplotypesHKa, Da26, Amudarya, and Da1a to a central haplotype possibly existing in the
Da24
Da23a
Da23b
Da2
Da9 Da3
Da1b
Da22
Da26
562234
233
562
549
?
529
529
941663
542
547
145
878 234
23423
4
907
562Da1
a
234
233
233
839
S. trutta oxianus
S. trutta oxianus
541
878
999
177
Caspianbasin
Namak
Am
u–Darya
839
529
902
389
839
994
99454
4
The G
ulf basin
M1
Ba
Ka
M2
HH1HH2
HCo
Fig. 7. Haplotypic network showing the relationships among different Danubian haplotypes based on pointmutations and their position in complete D-loop sequences: Ka, Karaj haplotype; Ba, Babolrud haplotype;M1 and M2, haplotypes of Mardagh River; HH1 and HH2, haplotypes of Haraz River; HCo: the mostfrequent haplotype in the Caspian and Orumieh basins; , separate the basins, ? on the haplotypeconnected to Ka denotes the uncertainty about its location.
© 2012 The AuthorsJournal of Fish Biology © 2012 The Fisheries Society of the British Isles, Journal of Fish Biology 2012, 81, 1479–1500
P H Y L O G E N E T I C S TAT U S O F I R A N I A N S A L M O T RU T TA 1495
Caspian region might indicate the role of Caspian basin haplotypes in the origin ofthe geographically and genetically close haplotypes Da26 and S. t. oxianus, althoughthis could also present a case for some northern haplotypes such as Da1a and Da9 tobe regarded as ancestors of Da26 and S. t. oxianus. The geographic proximity of theCaspian basin and the Tigris and Amu–Darya basins, compared to the areas wherethe northern haplotypes are found, might make it more probable for The Gulf (Da26)and Amu–Darya haplotypes to have originated in the Caspian basin. On the otherhand, the similarity of the haplotype HH1 in its basic composition at position 839 toboth the Amu–Darya (Aral Sea basin) haplotypes, which was not seen among theother haplotypes studied here, can be further indication of the possible origin of theAral Sea basin haplotypes in the Caspian region.
G U I D E L I N E S F O R C O N S E RVAT I O N
Microsatellite data and morphometric characters showed high levels of divergenceamong the studied populations and basins. Salmo trutta of each basin and populationshowed unique alleles not observed in other populations. These observations, relatedto microsatellite and morphological data, are in accordance with the isolation of pop-ulations by natural barriers and their exposure to varying environmental conditions.Based on hydrochemical data reported for the rivers studied, different environmentalconditions and, therefore, different selection regimes govern the evolutionary pro-cesses occurring in each basin and river. Such differences indicate that populationsof the studied basins should be treated as evolutionarily significant units from aninterbasin perspective and that each population in each basin should be consideredas a management unit. To avoid the loss of local adaptations and to support thelong-term stability of populations through management programmes, natural geneexchange among populations should be made possible (via improving the environ-mental conditions of rivers and considering fish paths in dams). Additionally, local orecologically similar stocks should be used for restocking, managers must avoid inter-basin fish transfers, and an adaptive management approach should be implementedto manage and conserve stocks.
We sincerely thank E. Hallerman for checking the manuscript, and K. Golzarianpour, H.Niksirat, M. Bakhtyiari, M. Babapour, M. Tehrani and R. Ahmadi for their kind assistancewith fish sampling. We are also grateful to G. Cotte, V. Aukee, M. Linqvist, P. Lehtonen,R. Zahiri and T. Saarinen for assistance and advice. This project was supported by grantsfrom University of Tehran (Iran), University of Shahid Beheshty (Iran), University of Laval(Canada), University of Turku (Finland) and Iranian Ministry of Science, Research andTechnology.
SUPPORTING INFORMATION
Supporting Information may be found in the online version of this paper:
Table SI. List of complete mtDNA control region haplotypes used in phylogeneticanalysis of Salmo trutta
Table SII. Characterization of microsatellite loci in Salmo trutta. Locus, primer Ref-erences, fluorescent dye, sequences annealing temperatures (Ta) used in single PCRs,
© 2012 The AuthorsJournal of Fish Biology © 2012 The Fisheries Society of the British Isles, Journal of Fish Biology 2012, 81, 1479–1500
1496 I . H A S H E M Z A D E H S E G H E R L O O E T A L .
range of allele sizes, number of observed alleles (nA), average expected heterozy-gosity (He) and allele size differentiation (RST )
Table SIII. Microsatellite diversity indices of Salmo trutta populations. Sample size(N), average number of alleles/locus (A), number of private alleles (Apr), expected(He) and observed (Ho) heterozygosity, result of Hardy–Weinberg probability
Table SIV. BOTTLENECK test statistics in the Salmo trutta populationsPlease note: Wiley-Blackwell are not responsible for the content or functionality
of any supporting materials supplied by the authors. Any queries (other than missingmaterial) should be directed to the corresponding author for the article.
References
Abdoli, A. (2000). The Inland Water Fishes of Iran. Tehran: Iranian Museum of Nature andWildlife (in Persian).
Aljanabi, S. M. & Martinez, I. (1997). Universal and rapid salt-extraction of high qualitygenomic DNA for PCR-based techniques. Nucleic Acids Research 25, 4629–4693.doi: 10.1093/nar/25.22.4692
Antunes, A., Faria, R., Johnson, W. E., Guyomard, R. & Alexandrino, P. (2006). Life on theedge: persistence and contrasting spatial genetic structure of distinct brown trout lifehistories at their ecological limits. Journal of Heredity 97, 193–205. doi: 10.1093/jhered/esj014
Apostolidis, A. P. Triantaphyllidis, C., Kouvatsi, A. & Economidis, P. S. (1997). Mitochon-drial DNA sequence variation and phylogeography among Salmo trutta L. (Greekbrown trout) populations. Molecular Ecology 6, 531–542. doi: 10.1046/j.1365-294X.1997.d01-176.x
Bagherian, A. & Rahmani, H. (2007). Morphological differentiation between two populationsof the Shemaya, Chalcalburnus chalcoides: a geometrical morphometric approach.Zoology in the Middle East 40, 53–62.
Berg, L. S. (1940). Zoogeografiya presnovodnykh ryb Perednei Azii (Zoogeography of fresh-water fish of the Near East). Uchenye Zapiski leningradskogo gosudarstvennogo Uni-versiteta Seriya Geograficheskikh Nauk 3, 3–31.
Berg, L. S. (1948). Ryby presnykh vod SSSR i sopredel’nykh stran (Freshwater Fishes of theSoviet Union and Adjacent Countries). Moscow: Akad Nauk.
Berg, L. S. (1949). Presnovodnye ryby Irana i sopredel’nykh stran (Freshwater fishes ofIran and adjacent countries). Trudy Zoologicheskogo Instituta Akademii Nauk SSSR8, 783–858.
Bernatchez, L. & Osinov, A. (1995). Genetic diversity of trout (genus Salmo) from its mosteastern native range based on mitochondrial DNA and nuclear gene variation. Molec-ular Ecology 4, 285–297. doi: 10.1111/j.1365-294X.1995.tb00222.x
Bernatchez, L., Guyomard, R. & Bonhomme, F. (1992). DNA sequence variation of the mito-chondrial control region among morphologically and geographically remote Europianbrown trout Salmo trutta populations. Journal of Molecular Ecology 1, 161–173. doi:10.1111/j.1365-294X.1992.tb00172.x
Bernatchez, L. (1995). A role for molecular systematics in defining evolutionarily significantunits in fishes. Evolution and AquaticEcosystem: Defining Units in Population Conser-vation, (Neilsen, J. L., ed.), pp. 114–132. American Fisheries Society Symposium 17.
Bernatchez, L. (2001). The evolutionary history of brown trout (Salmo trutta L.) inferredfrom phylogeographic, nested clade, and mismatch analyses of mitochondrial DNAvariation. Evolution 55, 351–379. doi: 10.1111/j.0014-3820.2001.tb01300.x
Blanc, J. M., Chevassus, B. & Krieg, F. (1994). Inheritance of the number of red spots onthe skin of the brown trout. Aquatic Living Resources 7, 133–136.
Bookstein, F. L. (1991). Morphometric Tools for Landmark Data: Geometry and Biology.Cambridge University Press: Cambridge.
© 2012 The AuthorsJournal of Fish Biology © 2012 The Fisheries Society of the British Isles, Journal of Fish Biology 2012, 81, 1479–1500

P H Y L O G E N E T I C S TAT U S O F I R A N I A N S A L M O T RU T TA 1497
Brownstein, M. J., Carpten, J. D. & Smith, J. R. (1996). Modulation of non-templatednucleotide addition by Taq DNA polymerase: primer modifications that facilitate geno-typing. Biotechniques 20, 1004–1010.
Canino, M. F., Spies, I. B. & Lowe, S. A. (2010). Highly discordant nuclear and mitochon-drial DNA diversities in Atka mackerel. Marine and Coastal Fisheries: Dynamics,Management, and Ecosystem Science 2: 375–387 doi: 10.1577/C09-024.1
Clement, M., Posada, D. & Crandall, K. A. (2000). TCS: a computer program to estimategene genologies. Molecular Ecology 9(10), 1657–1660. doi: 10.1046/j.1365-294x.2000.01020.x
Cornuet, J. M. & Luikart, G. (1996). Description and power analysis of two tests for detectingrecent population bottlenecks from allele frequency data. Genetics 144, 2001–2014.
Corneut, J. M., Piry, S., Luikart, G., Estoup, A. & Solignac, M. (1999). New methods employ-ing multilocus genotypes to select or exclude populations as origins of individuals.Genetics 153, 1989–2000.
Dadikyan, M. G. (1986). Ryby Armenii (Fishes of Armenia). Yerevan: Izdatel’stvo AkademiyaNauk Armyanskoi SSR.
Darvishzadeh, A. (2007). Geology of Iran. Tehran: Amir-Kabir Publications (in Persian).Derzhavin, A. N. (1929). A note on fishes of the River Karaj (North Persia) News of Baku
Ichthyological Laboratory 2, 69–79 (in Russian).Derzhavin, A. N. (1934). Presnovodnye rybyyuzhnogo poberezh’ya Kaspiya.Vstuplenie
[Freshwater fishes of the southern shore of the Caspian Sea.Introduction]. Trudy Azer-baidzhanskogo Otdeleniya Zakavkazskogo Filiala Akademii Nauk SSSR, SektorZoologii, Bak 7, 91–126.
Duftner, N., Weiss, S., Medgyesy, N. & Sturmbauer, C. (2003). Enhanced phylogeographicinformation about Austrian brown trout populations derived from complete mitochon-drial control region sequences. Journal of Fish Biology 62, 427–435. doi: 10.1046/j.0022-1112.2003.00038.x
Elliot, J. M. (1994). Quantitative Ecology and the Brown Trout. Oxford: Oxford UniversityPress.
Estoup, A., Largiader, C. R., Perrot, E. & Chourrout, D. (1996). Rapid one tube DNA extrac-tion for reliable PCR detection of fish polymorphic markers and transgenes. MolecularMarine Biology and Biotechnology 5, 295–298.
Frankham, R., Ballou, J. D. & Briscoe, D. A. (2002). Introduction to Conservation Genetics.Cambridge: Cambridge University Press.
Freeland, J. R. (2005). Molecular Ecology. Chichester: John Wiley & Sons, Ltd.Froufe, E., Knizhin, I., Koskinen, M. T., Primmer, C. R. & Weiss, S. (2003). Identification
of reproductively isolated lineages of Amur grayling (Thymallus grubii Dybowski1869): concordance between phenotypic and genetic variation. Molecular Ecology 12,2345–2355. doi: 10.1046/j.1365-294X.2003.01901.x
Giuffra, E., Bernatchez, L. & Guyomard, R. (1994). Mitochondrial control region and pro-tein coding genes sequence variation among phenotypic forms of brown trout Salmotrutta from northern Italy. Molecular Ecology 3, 1161–1171. doi: 10.1111/j.1365-294X.1994.tb00117.x
Goncalves, H., Martínez-Solano, I., Pereira, R. J., Carvalho, B., García-París, M. & Ferrand, N.(2009). High levels of population subdivision in a morphologically conserved Mediter-ranean toad (Alytes cisternasii ) result from recent, multiple refugia: evidence frommtDNA, microsatellite and nuclear genealogies. Molecular Ecology 18, 5143–5160.doi: 101111/j.1365-294X.2009.04426.x
Goudet, J. (1995). FSTAT (version 1.2): a computer program to calculate F-statistics. Journalof Heridity 86, 485–486.
Gum, B., Gross, R., Rottmann, O., Schroder, W. & Kuhn, R. (2003). Microsatellite variationin Bavarian populations of European grayling (Thymallus thymallus): Implications forconservation. Conservation Genetics 4, 659–672. doi: 10.1023/B:COGE.0000006106.64243.e6
Hansen, M. M., Nielsen, E. E. & Mensberg, K. L. D. (1997). The problem of sampling fam-ilies rather than populations: relatedness among individuals in samples of juvenilebrown trout Salmo trutta L. Molecular Ecology , 6:469–474. doi: 10.1046/j.1365-294X.1997.t01-1-00202.x
© 2012 The AuthorsJournal of Fish Biology © 2012 The Fisheries Society of the British Isles, Journal of Fish Biology 2012, 81, 1479–1500
1498 I . H A S H E M Z A D E H S E G H E R L O O E T A L .
Hansen, M. M. & Mensberg, K. L. (1998). Genetic differentiation and relationship betweengenetic and geographical distance in Danish sea trout (Salmo trutta L.) populations.Heridity 81, 493–504. doi: 10.1046/j.1365-2540.1998.00408.x
Hasegawa, M., Kishino, H. & Yano, T. (1985). Dating the human-ape splitting by a molec-ular clock of mitochondrial DNA. Journal of Molecular Evolution 22, 160–174. doi:10.1007/BF02101694
Hedtke, S. M. & Hillis, D. M. (2010). The potential role of androgenesis in cytoplasmic-nuclear phylogenetic discordance. Systematic Biology 60, 87–96. doi: 10.109/sysbio/syq070
Hermida, M., Miguel, E. S., Bouza, C., Castro, J. & Martinez, P. (2009). Morphological vari-ation in a secondary contact between divergent lineages of brown trout (Salmo trutta)from the Iberian Peninsula. Genetics and Molecular Biology 32, 42–50. doi: 10.1590/S1415-47572009005000014
Holm, S. (1979). A simple sequentially rejective multiple test procedure. Scandinavian Jour-nal of Statistics 6, 65–70.
Kottelat, M. & Freyhof J. (2007). Handbook of European Freshwater Fishes. Berlin andCornol: Kottelat and Freyhof.
Librado, P. & Rozas, J. (2009). DnaSP v5: a software for comprehensive analysis of DNApolymorphism data. Bioinformatics 25, 1451–1452. doi: 10.1093/bioinformatics/btp187
Maric, S., Susnik, S., Simonovic, P. & Snoj, A. (2006). Phylogeographic study of brown troutfrom Serbia, based on mitochondrial DNA control region analysis. Genetics SelectionEvolution 38, 411–430. doi: 10.1051/gse:2006012
Nei, M. (1973). Analysis of gene diversity in subdivided populations. Proceedings of theNational Academy of Sciences of the United States of America 70, 3321–3323.
Numann, W. (1969). Untersuchungen zur fischereilichen Bewirtschaftung iranischer Stauseenund Fließgewasser. Verhandlungen der internationalen Vereinigung fur theoretische undangewandte Limnologie 17, 705–713.
Osinov, A. G. & Bernatchez, L. (1996). “Atlantic” and “Danubian” Phylogenetic groupingsof brown trout Salmo trutta complex: genetic divergence, evolution, and conservation.Journal of Ichthyology , 36, 723–746.
Osinov, A. G. (2009). Iranian samples of brown trout Salmo trutta or rainbow troutOnorhynchus mykiss: comparison of evidence from allozyme and mitochondrial DNAcontrol region sequences analysis. Journal of Ichthyology 49, 825–828.
Piry, S., Alapetite, A., Cornuet, J. M., Paetkau, D., Baudouin, L. & Estoup, A. (2004).GeneClass2: a software for genetic assignment and first-generation migrant detection.Journal of Heridity 95, 536–539. doi: 10.1093/jhered/esh074
Posada, D. and Crandall, K. A. (1998). Modeltest: testing the model of DNA substitution.Bioinformatics 14, 817–818. doi: 10.1093/bioinformatics/14.9.817
Pustovrh, G., Susnik, S. & Sonj, A. (2011). Evolutionary relationship between marble troutof the northern and southern Adriatic basin. Molecular Phylogenetics and Evolution59, 761–766. doi: 10.1016/j.ympev.2011.03.024
Redenbach, Z. & Taylor, E. B. (2002). Evidence for historical introgression along a con-tact zoone between two species of Char (Pisces: Salmonidae) in northwestern NorthAmerica. Evolution 56(5): 1021–1035. doi: 10.1111/j.0014-3820.2002.tb01413.x
Rannala, B. & Mountain, J. L. (1997). Detecting immigration by using multilocus genotypes.Proceedings of the National Academy of Sciences of the United States of America 94,9197–9201.
Rohlf, F. J. (2006). tpsDig Version 2.10. Story Brook, NY: Department of Ecology and Evo-lution, State University of New York at Stony Brook.
Rohlf, F. J. (2007). tpsRelw Version 1.45. Story Brook, NY:Department of Ecology and Evo-lution, State University of New York at Stony Brook.
Rousset, F. (2008). GENEPOP’007: a complete reimplementation of the GENEPOP softwarefor Windows and Linux. Molecular Ecology Resources 8, 103–106. doi: 10.1111/j.1471-8286.2007.01931.x
Ruehl, C. B. & DeWitt, J. (2007). Trophic plasticity and foraging performance in red drum,Sciaenops ocellatus (Linnaeus). Journal of Experimental Marine Biology and Ecology349, 284–294. doi: 10.1016/j.jembe.2007.05.017
© 2012 The AuthorsJournal of Fish Biology © 2012 The Fisheries Society of the British Isles, Journal of Fish Biology 2012, 81, 1479–1500
P H Y L O G E N E T I C S TAT U S O F I R A N I A N S A L M O T RU T TA 1499
Saadati, MAG. (1977). Taxonomy and Distribution of the Freshwater Fishes of Iran. MSThesis. Colorado State University: Fort Collins, Co, USA.
Sanz, N., Cortey, M., Pla, C. & García-Marín JL. (2006). Hatchery introgression blurs ancienthybridization between brown trout (Salmo trutta) lineages as indicated by comple-mentary allozymes and mtDNA markers. Biological Conservation 130, 278–289. doi:10.1016/j.biocon.2005.12.023
Schmidt, H. A., Strimmer, K., Vingron, M. & Haeseler, A. V. (2002). TREE-PUZZLE: max-imum likelihood Phylogenetic analysis using quartets and parallel computing. Bioin-formatics 18, 502–504. doi: 10.1093/bioinformatics/18.3.502
Skaala, Ø. & Jørstad, K. E. (1987). Inheritance of the fine spotted pigmentation pattern ofbrown trout. Polskie Archiwum Hydrobiology 35, 295–304.
Snoj, A., Maric, S., Berrebi, P., Crivelli, A. J., Shumka, S. & Susnik, S. (2009). Geneticarchitecture of trout from Albania as revealed by mtDNA control region variation.Genetics Selection Evolution 41, 22. doi: 10.1186/1297-9686-41-22
Snoj, A., Maric, S., Susnik, B. S., Berrebi, P., Janjani, S. & Schoffmann, J. (2011). Phylogeo-graphic structure and demographic patterns of brown trout in North-West Africa. Molec-ular Phylogenetics and Evolution 61, 203–211. doi: 10.1016/j.ympev.2011.05.011
Suarez, J., Bautista, J. M., Almodovar, A. & Machordom, A. (2001). Evolution of the mito-chondrial control region in Palaearctic brown trout (Salmo trutta) populations: thebiogeographical role of the Iberian Peninsula. Heredity 87, 198–206. doi: 10.1046/j.1365-2540.2001.00905.x
Susnik, S., Schoffmann, J. & Snoj, A. (2004). Phylogenetic position of Salmo (Platysalmo)platycephalus Behnke 1968 from south-central Turkey, evidenced by genetic data.Journal of Fish Biology 64, 947–960. doi: 10.1111/j.1095-8649.2004.00363.x
Susnik, S., Schoffmann, J. & Weiss, S. (2005). Genetic verification of native brown troutfrom the Persian Gulf (Catak Cay River, Tigris basin). Journal of Fish Biology 67,879–884. doi: 10.1111/j.1095-8649.2005.00780.x
Susnik, S., Knizhin, I., Snoj, A. & Weiss, S. (2006). Genetic and morphological character-ization of a Lake Ohrid endemic, Salmo (Acantholingua) ohridanus with a compar-ison to sympatric Salmo trutta. Journal of Fish Biology 68(Suppl. A), 2–23. doi:10.1111/j.1095-8649.2005.00902.x
Susnik. S., Weiss, S., Odak, T., Delling, B., Treer, T. & Sonj, A. (2007). Reticulate evolution:ancient introgression of the Adriatic brown trout mtDNA in softmouth trout Salmoobtusirostris (Teleostei: Salmonidae). Biological Journal of the Linnean Society 90,139–152. doi: 10.1111/j.1095-8312.2007.00717.x
Swatdipong, A. (2009). Conservation Genetics of Exploited Finnish Salmonid Fishes. PhDThesis, University of Turku, Finland.
Tamura, K., Dudley, J., Nei, M. & Kumar, S. (2007). MEGA4: Molecular EvolutionaryGenetic Analysis (MEGA) software version 4.0. Molecular Biology and Evolution 24,1596–1599. doi: 10.1093/molbev/msm092
Turan, C. (1999). A note on the examination of morphometric differentiation among fishpopulations: the Truss system. Turkish Journal of Zoology 23, 259–263.
Turan, C. (2004). Stock identification of Mediterranean horse mackerel (Trachurus mediter-raneus) using morphometric and meristic characters. ICES Journal of Marine Sciences61, 774–781. doi: 10.1016/j.icesjms.2004.05.001
Vatandost, S., Vosoghi, Gh. H., Nezami, Sh. A., Abdoli, A. & Matinfar, A. (2008). A studyon diversity of morphological characters of brown trout (Salmo trutta fario) in TajanRiver and Babolrud River in Mazandaran province. Journal of Fisheries 2, 57–70 (inPersian).
Vera, M., Sourinejad, I., Bouza, C., Vilas, R., Pino-Querido, A., Kalbasi, M. R. & Martínez,P. (2011). Phylogeography, genetic structure, and conservation of the endangeredCaspian brown trout, Salmo trutta caspius (Kessler, 1877), from Iran. Hydrobiologia ,664, 51–67. doi: 10.1007/s10750-010-0581-4
Waters, J. M., Rowe D. L., Burridge, C. P. & Wallis, G. P. (2010). Gene trees versus speciestrees: reassessing life-history Evolution in a freshwater fish radiation. Systematic Biol-ogy 59, 504–517. doi: 10.1093/sysbio/syq031
Weir, B. S. & Cockerham, C. C. (1984). Estimating F-statistics for the analysis of populationstructure. Evolution 38, 1358–1370.
© 2012 The AuthorsJournal of Fish Biology © 2012 The Fisheries Society of the British Isles, Journal of Fish Biology 2012, 81, 1479–1500

1500 I . H A S H E M Z A D E H S E G H E R L O O E T A L .
Weiss, S., Antunes, A., Schlotterer, C. & Alexandrino, P. (2000). Mitochondrial haplotypediversity of brown trout Salmo trutta L. in Portuguese rivers supports a simple broad-scale model of the Pleistocene recolonization of northern Europe. Molecular Ecology9, 691–698. doi: 10.1046/j.1365-294x.2000.00910.x
Electronic Reference
Coad, B. (2011). Freshwater Fishes of Iran. Available at http://www.briancoad.com/contents.htm
© 2012 The AuthorsJournal of Fish Biology © 2012 The Fisheries Society of the British Isles, Journal of Fish Biology 2012, 81, 1479–1500